methodology of selection and organization of kpis for shop
TRANSCRIPT

Page 1 of 9
Methodology of Selection and Organization of KPIs for Shop Floor
Mariana Raposo Oliveira [email protected]
Instituto Superior Técnico, Universidade de Lisboa, Portugal
November 2017
Abstract: Key Performance Indicators (KPIs) are critical tools to support activities and results, monitoring an industrial organization. Most literature published and available on KPIs is focused in business and administrative level (e.g. Parmenter’s model and Marr’s model). Those “high-level” indicators receive information from production systems based on data retrieved at the shop floor level. Nevertheless, there is scarcity of approaches to support the generation of KPIs to be used at the shop floor. The few existent approaches for this level derive from empirical use of Lean and Kaizen philosophies requesting “only” to have KPIs for Safety, Quality, Delivery, Inventory, Productivity (+QDIP). Several examples can be found in consultant companies’ web-sites but without neither a comprehensive structure nor a theoretical basis.
A methodology to support the selection and organization of KPIs at shop floor level was developed in the present work. Based on the Hoshin Kanri approach and on the Balanced ScoreCard (BSC), the methodology is built on the acknowledgment of the company strategy from all the staff. After studying the company, is necessary to identify the levels of decision and control regarding the production activities (process, cell, section, business unit and production system). Only then, is distributed a survey (based on referred models) to each level, with pre-defined universal questions about which should be the relevant information to achieve a better performance. The best rated questions will be selected and associated with a KPI. The methodology ends with displays constructions, one for each level, depending on the selected KPI.
Finally, the methodology was applied in the company OLI - Sanitary Systems in order to identify potential errors and to be improved.
Keywords: KPI, Visual Management Boards, Hoshin Kanri, Parmenter’s model, Marr’s model
1. Introduction and literature review
Nowadays Big Data is a widely used term in industry to refer to the generation and communication of data associated with new technologies [1]. This constant communication is based on the data collected by the company itself and it is done with the aim of allowing quick decisions to be made, with increased productivity in mind. This has become increasingly popular as a result of the Industry 4.0 concept, also known as fourth industrial revolution [2]. Industry 4.0 is associated with information technology, automation and control applied to production processes. The intention is that, through the “internet of things”, the cyber-physical systems should communicate and collaborate with each other and with humans, throughout the entire value chain and in real time [2]. This concept was born in Germany in 2011, with a German Government strategic project which aimed at promoting the computerisation of production by manufacturing systems so as to be able to monitor them from afar and immediately [2] [3].
As expected, as this type of systems is implemented, the amount of data generated increases. If this data is to be used in a useful and efficient way, it requires an appropriate treatment. This results in the need to transform “big data” into “smart data”, in order to speed up the decision-making process, supplying vital information for management [4].
Taking into account such difficulties and the need to find how to filter the data generated in companies, the concept of KPI has become increasingly indicated in the literature as an essential instrument in the interface between data generated and decision makers (humans or decision algorithms) [1] [5]. KPIs are a restricted group of indicators intended to gauge the performance of a system in a systematic and comprehensive manner [1]. They can be used in the following ways:
- To help in decision making, since they filter the essential information, highlighting it;
- as a means of communication, allowing managers to transmit to employees the objectives and goals resulting from the predefined strategy;
- To promote a sense of commitment between all the staff and their work, so they can see just how influential they are in the performance of the company;
- To encourage improvement measures, focused on results and intended to improve them
- To prevent problems, by monitoring the critical values
- To make comparison with other companies, resulting in the search for better market opportunities, based on the benchmark.
In order to derive the greatest benefits from KPIs, they should be linked to the company strategy, reflecting it in such a way as to cover all the key points [1] [4]. For this, the company, in addition to controlling the KPI, must define its target (value that it intends to reach) and baseline (initial KPI value, before any improvement measure). By comparing KPIs with these values, it will be possible to monitor the performance of the company in relation to its objectives. By enabling the performance of a company to be mirrored in a concise way, it will be easier detect problems and potential improvements. KPIs are a tool that is highly recommended by Lean and Kaizen, since the final objective in both cases is the optimization of processes through a continuous reduction of waste [6]. Lastly, for the KPIs to be fully understood and have an impact on the entire organization, they must be reconciled with visual management. This would make them seem attractive as well as enable them to be integrated in the company and community [5] [7]. However, very often the selection of KPIs and the way there are presented are not done in the best way. Some companies have a tendency to choose the KPIs that other companies use, with the KPIs not reflecting the true performance of the company. Another common mistake in the selection of KPIs comes from collecting an excessive number of indicators, with the result that the problem of excess data cannot be resolved. Lastly, sometimes the KPIs are presented in an unappealing way and so do not have the desire impact. Thus, given the difficulty in selecting and showing KPIs correctly, they are often used inefficiently – they are not used to full advantage [5] [8].
In the bibliography is possible to find a fair amount of information on the nature of the KPIs and some methodologies about how to select them. Most of these methodologies are associated with top management, but there are very few references about how to apply them on the shop floor [5] [9] [10].
Due to:
- the difficulty in selecting and showing KPIs;
- the difficulties arising from excess data;
- the fact that the selection of KPIs for the shop floor is made by consultancy companies.
This dissertation focuses on KPIs for the shop floor and on how to select and show them, resulting in a methodology that can be adapted to different production systems.
According to several authors [5] [9] [11], the choice of KPIs is based on company strategy. Company strategy and KPIs must

Page 2 of 9
always be interconnected. Therefore, the KPIs can be used as a mean of communication and monitoring of the company’s strategy. By defining strategy, converting it into objectives and selecting KPIs in harmony with these objectives, the checking of the progress of the strategic results will be possible [12]. This means that, if the company does not spend enough time properly defining and communicating its strategy, the analysis of results can be compromised and made more difficult. To prevent this from happening, if the Hoshin Kanri and BSC (Balanced Scorecard) approaches are adopted, this can ensure that the KPIs are suitable for gauging the strategic objectives. It should be noted that, in the Hoshin Kanri approach, it is argued that the strategy should result from a long process of negotiation, the outcome of an agreement reached between all the staff of the company, “creating an organic flow of information circulating throughout the entire company” [12]. One of the purposes of using the BSC is to make it easier to define and communicate the strategy, in such a way as to help define the KPIs [11]. In order to be able to monitor all the work carried out, it is therefore essential to combine the generation of KPIs for the shop floor with these two approaches.
Given the above, aim of this thesis is the development of a methodology for the operationalization of KPIs (for recurrent use on the shop floor), which satisfies the following requirements:
- Overcome the difficulty associated with the effective communication of the strategy to all the staff, and its conversion into concrete objectives;
- Ensure that the KPIs chosen reflect the company in question, based on its strategy as well as critical points;
- Guarantee the analysis of all the aspects of the production process, ensuring that any problem will be identified;
- Ensure a regular review of KPIs, checking that they are a true reflection of the company over a certain period of time;
- Involvement of the staff in the selection of KPIs, so that they feel committed to these and motivated to achieve their goals;
- Show the KPIs in a way that is engaging, intuitive and easy to assimilate;
- Standardize the way to show the KPIs;
- Show each employee only the information that is important for them to be able to improve their performance and avoid spending time with excess of information;
- The opportunity to choose between KPIs associated with strategic objectives, operational objectives, or both;
- Applicable to horizontal organizations and adaptable to different structures.
2. Models for the generation and exhibition of KPIs
Given the difficulty in selecting “ideal” KPIs, several authors developed different models for choosing them. Some of these authors have taken into account the visual impact that KPIs should have to help the management of the processes. Table 1 summarizes the three models studied. Both Parmenter’s model and Marr’s model are connected with top management, unlike the +QDIP model, which is directed at the shop floor.
Parmenter [9] and Marr [5] divide the indicators into different groups: Parmenter in result indicators (RI) and performance indicators (PI), even subdividing the most important from each group (Key results indicators – KRIs, Key performance indicators – KPIs); Marr only divides into strategical and operational. The way these two authors separate indicators is remarkably similar.
Both divide them in:
- indicators which should be measured in real time or at most every week, and which focus on operational objectives and daily actions;
- indicators measured monthly, focusing on strategy and long-term results.
In this way it possible to see a division between:
i) indicators referring to a higher level of management, more strategic and of greater interest for top management;
ii) operational indicators, related to the front line and the daily goals of each employee.
Regarding +QDIP (Quality, Delivery, Inventory, Production), this is a more practical model to be used on the shop floor giving less emphasis to the management component in the choice of KPIs, while still using visual management.
Marr [5] argues that there should be 15 to 20 indicators for each business unit. These should be standardized (making alterations only when strictly necessary) to facilitate their reading, comprehension and contextualization. Parmenter [9] does not mention this, merely stating that each company should use 10 KPIs, 80 PIs and RIs, and 10 KRIs. Neither of the authors talks about the categories of KPIs, even though their books mention the following indicators: financial, client, marketing and sales, project, production, workers, social responsibility.
3. Methodology development
A methodology of operationalization of KPIs was developed, aiming to overcome some of the difficulties associated with this process. The methodology also combines the choice and categorization of KPIs with the visual management, the involvement of the staff in the KPIs selection and tries to achieve an harmony between the strategy and KPIs. It was designed to support the generation of KPIs on the shop-floor, since other methodologies already developed and explained don’t cover this area.
The starting point of the proposed methodology is the organizational strategy of the company together with its awareness by all staff. It proposes the involvement of them in the choice of KPIs depending on their responsibilities, to increase the feel of commitment with the chosen indicators. Is also intended that the employees feel more stimulated to achieve the defined target. These assumptions are defended by different authors, like Marr [5] and Parmenter [9] the main references of this work. Since one of the common difficulties in the use of KPIs is related with the not being visually appealing and easy to understand, is an imperative part of the methodology the way to expose them as clearly and intuitively as possible.
3.1. Production system model The first difficulty in the development of the methodology was
the fact that KPIs should be explicitly explained to those who are responsible for their performance and for whom they have meaning and relevance. It must be borne in mind that important KPIs for one area can be insignificant for others. Because of this, it is necessary to avoid excess data and lack of contextualization.
To solve that problem, a typical production system model was considered to develop the methodology (Figure 1). An organizational pyramid was also designed, taking into consideration different management levels and their responsibilities, as shown in Figure 2.
A company with five distinct production levels was postulated,
with a macro level - the production system – consisting of a set of business units. Each business unit is made up of a number of
Models Parmenter Marr +QDIP
Division of
indicators
Results of Indicators (KRIs e RIs) and Performance Indicators (KPIs, PIs)
Strategic indicators and operational indicators
Safety, quality, delivery, cost, inventory, production, environment
Number of
indicators
10/80/10 15 to 20 high level, and a similar number
for each business unit
Each category represents some indicators,
there being no defined number
Update
intervals
KPIs: real time to weekly
KRIs: one to four months
RIs e PIs: real time to monthly
Strategic indicators: weekly and monthly
Operational indicators: real time
Daily in a monthly spectrum
Table 1 - Comparison between the Parmenter, Marr and + QDIP models, according to their division of the indicators, number and update intervals

Page 3 of 9
sections, and each section is a family of products. Within the sections there are various cells, and each of these consists in a group of different processes. This model can be adapted depending on the productive unit being studied. For example, the cell level can be omitted if the product results from only one process (as can be seen in the bottom right corner of Figure 1). More levels can also be
created. For example, when the same company has more than one production unit and wants to monitor all of them in the same way, it is possible to create a sixth level to control these.
Since every level of the pyramid has different responsibilities, each of these levels needs to check different indicators. In this way, it will be possible for them to perform better while monitoring their work results more effectively. Thus, each group will have different displays, associated with specific KPIs.
The physical division of the production system (Figure 1) combined with the organizational pyramid of the staff division, results in Figure 2, giving rise to five different levels. This relationship was established in order to link the responsibilities of each worker with their place of work: e.g. the operators are responsible for the process, thus constituting level 1; the cell is the responsibility of the cell leader, forming level 2. Both physical and staff divisions can be adapted to each company, depending on its structure and organization. The purpose of this division is to select appropriate information and guarantee that every worker is involved and in tuned with the KPIs of their level.
3.2. KPIs Selection
In order to overcome the limitations of the existing methods, the methodology proposed here recommends that, before its application, the strategy should be properly communicated to employees and shared with them. This is to ensure that everyone knows their role in the company. The methodology can be applied in other circumstances. However, this communication and sharing is recommended to obtain more realistic results and to be able to choose indicators that truly reflect the company in question. The first step is to create surveys for each level, and then distribute them. These surveys will provide a list of KPIs, to be classified indirectly. Next, the surveys will be analyzed and the most highly rated KPIs for each level will be selected. These KPIs will be coordinated with the company strategy in such a way as to reflect both its strategy as well as the performance of critical points.
The KPIs are divided into nine classes, based on the +QDIP model. This division will guarantee the study of KPIs through all the value chain. It will also ensure that if problems and/or deviations higher than expected occur, they will be detected. An acronym will be assigned to each class. Whenever a class is subsequently referred to, its acronym will be used.
- Suppliers (S): this class includes the internal (process for process) and external performance of the suppliers; evaluate its performance and the performance of the previous process;
- Planning (Pl): class that evaluate the planning effectiveness; if this is performed correctly and in time. Otherwise, the delays influence in the company are evaluated, and if the resources are being used in their maximum potential;
- Productivity (Pr): evaluates the process itself, its performance and levels of productivity;
- Quality (Q): reflect the problems of bad quality and the actions to correct them. Evaluates also the critical parameters of bad quality in each process;
- Mechanical (Me): evaluates and identify the deviation between the established and the real value of the mechanical parameters of the machines. These parameters are analyzed because they can influence the process and the quality of the parts;
- Maintenance (Ma): referring to all the maintenance (planned or unplanned) points, evaluating its efficiency and cost;
- Clients (C): focused on internal and external clients, studying their satisfaction and evaluation;
- Environment (E): class where is analyzed quantity of wastes and environmental concerns;
- Workers (W): focus on workers, their performance, satisfaction and costs associated to them.
Each level will be formed by different classes, according to Table 2:
- Level 1 is composed by Planning, Productivity, Quality, Mechanical, Maintenance and Environment.
- Level 2 is composed by Suppliers, Planning, Productivity, Quality, Maintenance and Environment
- Level 3, 4 and 5 is composed by Suppliers, Planning, Productivity, Quality, Maintenance, Clients, Environment and Workers
This division is justified by the need to evaluate the mechanical parameters, only when a machine analysis is mandatory (level 1). Analyze mechanical parameters of more than one machine simultaneously not only misleads the workers but is also meaningless.
For the Suppliers class, since the same process has the same supplier, only makes sense to analyze this class in groups of the same process (from level 2 to 5). In this way will be avoid excessive and redundant information. About the classes of Clients and Workers, the analysis is only relevant when it is about higher groups (level 3,4 and 5) because it is a very embracing information.
Following Marr [5], who suggest the use of 15 to 20 indicators, each class will be represented by 3 KPIs chosen by the surveys. Therefore, the KPIs will depend on the company studied and the levels which they represent. The contextualization of the situation
and the study and analysis of all the key points of the process are
Level S Pl Pr Q Mec Mai C E W
1 X X X X X X
2 X X X X X X
3,4,5 X X X X X X X X
Table 2 - Matching of classes to levels
Figure 1- Production System Model
Figure 2 – Organizational Pyramid Model, with the color code of Figure 1
Page 4 of 9
assured. It is important to mention that, if the company does not need all these classes, it is possible to take them out or add new ones.
3.2.1. Survey structure
According to Marr [5] more important than the selection of KPI, are the questions that need to be clarified. For this reason, he has created the KPQ (Key Performance Question). KPQs are the questions that should be clarified with the right KPI, working like a guide. KPQs guarantee that the information provided by the KPIs is really important and give them a raison d’être [5]. These questions also help in contextualizing the KPIs and converting them into knowledge.
After major research into KPIs, using mainly Marr’s book [13] and online KPIs libraries [14] [15] [16], the most commonly used and recommended KPIs were listed and subsequently divided into the classes explained above. Then, for each KPI, a KPQ was constructed. The KPI will answer that KPQ. The list of KPIs drawn up leaves room for improvement, since it is not exhaustive and can be added to or modified. In addition, the KPIs listed were translated into formulas, in order to show the data that needs to be collected. In the construction of the KPQs (on the basis of the selected KPIs) care was taken not to make them too explicit in order to avoid biased answers. The intention here was for respondents to focus more on questions they want clarified, rather than on the KPIs that they want to see at the end. The intention was also to achieve impartial choices, as opposed to ones biased in favor of KPIs that are easier to measure or that the company generally uses, without taking into consideration their real purpose [8]. Furthermore, the level of every KPQ was defined. The surveys to be made were based on the outcome of this, with each survey corresponding to one level.
This KPIs selected for levels 1 and 2 are for the shop floor. They are related with production aspects and equivalent to Marr’s operational indicators [5] or Parmenter’s KPIs [9]. In line with both authors, these types of indicators should be measured at short intervals, focusing on the operational objectives and daily actions of each employee.
For levels 3, 4 and 5, the questions were filtered in such a way that certain information could only reach the highest levels. This is because such information is only important for top management, where it will have an impact. A case in point is the costs and aspects related to the macro strategy of the company. If we make a
comparison with the models referred to above, these can be seen as KRIs [9] or strategic indicators [5]. So, their purpose is to help monitor the strategy of the company and evaluate the work of various teams working together. The staff at these levels have the option of seeing only operational indicators or strategic indicators, or a mixture of both, depending on what they want. This enables them to focus only on the macro strategy, instead of on the operational objectives of each employee/section. It is also possible for each staff member to consult the display of the levels below. In this way, if there are any irregularities, they can trace the source of the problem.
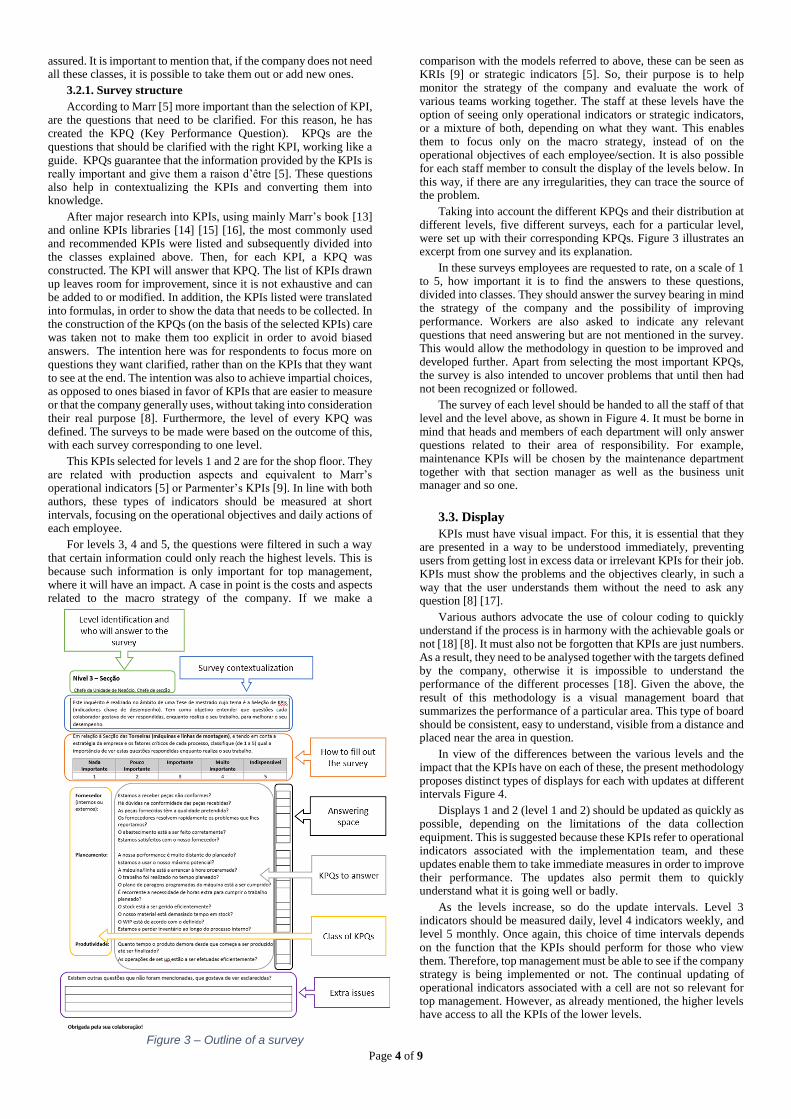
Taking into account the different KPQs and their distribution at different levels, five different surveys, each for a particular level, were set up with their corresponding KPQs. Figure 3 illustrates an excerpt from one survey and its explanation.
In these surveys employees are requested to rate, on a scale of 1 to 5, how important it is to find the answers to these questions, divided into classes. They should answer the survey bearing in mind the strategy of the company and the possibility of improving performance. Workers are also asked to indicate any relevant questions that need answering but are not mentioned in the survey. This would allow the methodology in question to be improved and developed further. Apart from selecting the most important KPQs, the survey is also intended to uncover problems that until then had not been recognized or followed.
The survey of each level should be handed to all the staff of that level and the level above, as shown in Figure 4. It must be borne in mind that heads and members of each department will only answer questions related to their area of responsibility. For example, maintenance KPIs will be chosen by the maintenance department together with that section manager as well as the business unit manager and so one.
3.3. Display
KPIs must have visual impact. For this, it is essential that they are presented in a way to be understood immediately, preventing users from getting lost in excess data or irrelevant KPIs for their job. KPIs must show the problems and the objectives clearly, in such a way that the user understands them without the need to ask any question [8] [17].
Various authors advocate the use of colour coding to quickly understand if the process is in harmony with the achievable goals or not [18] [8]. It must also not be forgotten that KPIs are just numbers. As a result, they need to be analysed together with the targets defined by the company, otherwise it is impossible to understand the performance of the different processes [18]. Given the above, the result of this methodology is a visual management board that summarizes the performance of a particular area. This type of board should be consistent, easy to understand, visible from a distance and placed near the area in question.
In view of the differences between the various levels and the impact that the KPIs have on each of these, the present methodology proposes distinct types of displays for each with updates at different intervals Figure 4.
Displays 1 and 2 (level 1 and 2) should be updated as quickly as possible, depending on the limitations of the data collection equipment. This is suggested because these KPIs refer to operational indicators associated with the implementation team, and these updates enable them to take immediate measures in order to improve their performance. The updates also permit them to quickly understand what it is going well or badly.
As the levels increase, so do the update intervals. Level 3 indicators should be measured daily, level 4 indicators weekly, and level 5 monthly. Once again, this choice of time intervals depends on the function that the KPIs should perform for those who view them. Therefore, top management must be able to see if the company strategy is being implemented or not. The continual updating of operational indicators associated with a cell are not so relevant for top management. However, as already mentioned, the higher levels have access to all the KPIs of the lower levels.
Figure 3 – Outline of a survey

Page 5 of 9
Three different displays were designed, demonstrated in a simplified way in Figure 4. Each of the displays consists of different divisions and each division has a colour (green, yellow or red) depending on the performance of the corresponding KPIs in relation to the target (previously defined by the company). If the performance is better than the target, the division is green (e.g. the suppliers in Figure 5). Where performance is below the target but above the baseline, is painted yellow (see productivity in Figure 5). Any performance below the baseline is painted red (e.g. quality in Figure 5).
For levels 1 and 2, data will be updated at short intervals. However, these updates can cover a long period of time. For example, although the number of “ok components” must be updated instantaneously, the target should refer to daily values. Thus, the worker can have an idea of his performance while working. Nevertheless, the main point of this is to understand, at the end of the day, if the worker completed all the work that was allocated to him or not. For the company, it is irrelevant if at any point during the day the worker was ahead of or behind schedule. For these reasons, for some KPIs (when justifiable), in addition to the KPI value, the history of the KPI is also shown in the same display. Figure 5 represents an example of the level 2 display, similar to the one for level 1. It can be seen that on occasions more than one KPI can be included in the same diagram, as in the case of maintenance in Figure 5.
For the displays referring to levels 3,4 and 5, it was decided not to show KPIs individually or their evolution in order to avoid excess data, since the aim is to analyse 3 KPIs for each section.
This type of display is formed by 8 small peripheral circles, each one referring to as one of the classes. There is also a central circle which reflects the average performance of the 8 classes taken as a whole. In the circles it is possible to find the daily/weekly/monthly value of each class and respective target, depending on whether it is level 3/4/5. This number is the result of the average of the 3 KPIs
previously selected by the surveys. Every circle will be painted green, yellow or red, depending on the general performance of each class. The peripheral circles are organised following the order of the process, clockwise. The order is the same for every display. This standardization is intended to make them readily understandable with no possibility of a doubt.
In order to have an idea of the history of the events, the history of the last 15 days/12 weeks/12 months (depending on the level in question) is shown in colours around each circle. These small sections also follow a clockwise direction, as in Figure 6. The first section refers to the day before and the last section before the white one refers to the performance of 15 days previously. In in Figure 6 this evolution is indicated by arrows.
As already mentioned, each of the small circles in Figure 6 represents one class, and that class is the result of the performance of 3 KPIs. The 3 KPIs of each class must be associated with a group of employees, and the monitoring and measurement of these KPIs is their responsibility. If any irregularity is detected in their class, it is their duty to trace the origin of the problem and try to resolve it. in Figure 6 shows an example of the display that every member of these groups of employees should have and analyse. This particular display shows the 3 KPIs of the planning class: downtime level, cycle time, overtime hours.
For levels 1,2 and 3 daily meetings are suggested to understand what went right and wrong the day before. These meetings also provide an opportunity for brainstorming ideas of improvement such as requesting help from others departments. The main aim of these meetings is to increase performance and identify where improvements can be made.
Considering levels 4 and 5, the meetings should be further apart. For level 4, a weekly meeting is enough to discuss the performance of the business unit in that week. In level 5, a monthly meeting would
Figure 4 – Surveys distribution into different levels
Figure 5 - Example of a level 2 display Figure 6 - Example of a level 3 display

Page 6 of 9
be ideal to analyse the performance of the production system, comparing it with the strategy of the company.
The ways these displays are presented enables the KPIs to be immediately understood. Taking all this into consideration, it is possible to have standardize displays, as recommended by different authors. [5] [7] [9].
4. Fieldwork 4.1. Company description
The designed methodology was applied to OLI - Sanitary Systems, to enable the possibility to find failures and therefore, improvement opportunities. This company was founded in 1954, in Aveiro, and the last 30 years have been dedicated to flush cisterns production. It is the bigger European producer of universal mechanisms, represented in four different countries, with approximately 400 employees nowadays.
The main productive unit is located in Aveiro. It is constituted approximately by 80 injection machines, 1000 molds and 80 production lines. There are 3 business units in this production site. Each business unit is composed by two or three families of products. As a result of the company’s dimension, it was only studied one section (taps), which belongs to the business unit “Taps, exposed flash cistern and plats”. In addition to the this, in the production system there are two more business units.
The assembly of this section is composed by 8 cells, with 24 operators and 1 cell leader in charge, working 24/7. The injection is formed by 7 machines controlled by 3 technicians and 3 machines operators. This structure is kept unchanged for all the other processes.
In addition to that framework, there are several parallel departments common to all the business units. The departments are:
- Provisioning: responsible for external supplied parts and for their availability in the company;
- External logistics: responsible for the material storage, transportation and distribution in all the different cells inside the company;
- Planning: responsible for planning all the production and dispatch of orders;
- Maintenance: responsible for the maintenance of all the equipment and machines, as well as aspects related with energy consumption;
- Quality: responsible for the parts inspection and defects, searching their causes and how to avoid it.
Besides these, the injection and assembly departments are divided in different business units already explained. The assembly department is responsible for the assembly lines and the injection department for the injection machines. The injection team is
composed by machine operators and injection technicians, being the last ones responsible for mould exchanges.
The human resources department was also included in this study, once its work is associated with all the company’s members, and consequently with the production system.
4.2. Application of the methodology 4.2.1. Adaptation of the methodology
Figure 7 is the outcome of the explanation given above. It shows the adaptation of the production system model to the company studied.
It was necessary to divide level 1 into two different groups, because the two processes studied are quite different and need different KPIs. Level 2, taking into account the structure of the company, only relates to assembly. This decision was also made because there is no need to monitor the majority of the KPIs of the machines together, since the information would end up getting lost.
Concerning the section (level 3), the company does not have a single person in charge of assembly and injection as stipulated in the model. However, the company has a section manager (responsible for assembly) and a shift master (responsible for injection). So, it was decided to put these two employees together in level 3 with the members of each department. The model was able to be used without any changes for level 5 and 6.
Then, the KPQs were organized and adapted to the different levels, resulting in 6 surveys (A, B, C, D, E, F), one for each division of the pyramid. As stipulated, each level answers its corresponding survey and the survey of the level above. Each department should only answer the questions related to their job and their responsibilities.
The choice of classes to be answered by each department was made with the help of the production manager together with the head of the human resources department, with the aim of giving each worker only the information that would help them for improve performance. For this reason, it makes no sense for the logistics department to be involved in the choice of KPIs related to maintenance.
The surveys were handed to the heads of each department, with clear instructions on how to distribute and fill them in Table 3. Explains the distribution of the surveys and their classes.
4.2.2. Analysis of the surveys
After the completed surveys were handed back, the 3 highest rated KPIs for each level and class were selected. In cases of an equal rating for 2 or more KPIs, the criterion for deciding which to choose should be defined by the top level of the pyramid because this is by no means obvious as it depends on the aspirations of each company. In the present study, in case of a tie, the KPI with lower standard deviation was chosen. This reflects greater unanimity regarding the importance of that KPI.
Figure 7 - Organizational pyramid adapted to OLI

Page 7 of 9
If we analyse the KPIs chosen, it can be seen that in almost every class indicators about costs were selected. This type of KPQs only appear in surveys of the higher levels (5 and 6). The majority of these KPQs were selected by level 6, top management. This demonstrates that top management is more interested in cost-related KPIs because top management is more focused on results than on individual processes.
The results also show that there are a group of KPIs which were selected in every survey. The explanation for this is that they can summarize effectively the performance of each class:
- Cycle time: important to achieve a good work rhythm and, consequently, high productivity;
- Recurring problems and complaints associated with quality: representing quality. These reflect the performance of the company when it comes to efficiency in detecting and solving problems;
- Unplanned maintenance: mirrors the performance of maintenance, if there are too many unforeseen breakdowns, as well as if the maintenance is being performed efficiently;
- Client satisfaction: this summarizes all the processes behind the product, from efficient production to delivery on time;
- Incidents where the board intervened: this shows, once again, the ability of the company to deal successfully with problems. It is one of the most important skills to perfect.
Regarding the remaining KPIs, the results show a random selection. However, there is normally agreement in the choice of KPIs of levels there are close together. If we analyse KPQs individually, it is possible to see a degree of heterogeneity in the responses, since a clear preference is only apparent in a small number of questions. Sometimes the same KPQ got a similar number of votes in 3 of the 5 values for selection. There were even cases where, out of 5 values to choose from, 4 of them were voted for. In addition, in several KPQs there were a small number of employees (1 or 2) who gave a lower rating than the general.
After analysing all the values, it was concluded that randomness prevailed in the answers. Nevertheless, if all workers
know the strategy of the company and its objectives, it may be possible to attenuate these differences. It is advisable to repeat the surveys a before too much time has elapsed (e.g. after 12 months), to try to achieve an agreement among the employees and consequently to reduce the heterogeneity of the results.
4.3. Needs and difficulties in implementing KPIs
A study was made in the company, after analysing and deciding on which KPIs should be shown for each level, in order to understand which indicators are being measured, how and where they are used.
The studied company uses the BSC model. They have monthly meetings with all the department heads to check if the performance is following the objectives defined by the administration. The indicators already measured by the company are established by BSC or work as way to calculate them. For this reason, the majority of these indicators are measured monthly and, in some cases, quarterly, biannually or annually. Even when measured, the company does not use them as a navigation tool. They are only used as results to be presented to the board at monthly meetings. The fact that these indicators are only measured and analysed at such big intervals, means that, if some problem is detected, the actions to solve it are always corrective. Due to that, the KPIs are not used as a tool to prevent problems. As already mentioned, this KPIs are measured to BSC and analysed by the top manager. Because of this, they are often financial, not exposed in an appealing way, neither visible to the ones how has influence in it. Keeping in mind the above, it is possible to conclude that the indicators do not follow the habits of KPIs and they can be put to use.
There are also KPIs collected every shift and exposed in a board named Daily Kaizen. Each section has one Daily Kaizen where is shown its performance. This board is located in the entrance of the section, and the section’s staff meet next to it to discuss the results of the day before and set the goals. Daily Kaizen of injection and assembly sectors are different from each other, they are composed by:
Survey Regarding to Classes Answered by
A Injection Pl, Pr, Q,
Mec, Mai, E
3 machine operators (Pl, Pr, Q, Mec), injection technicians (Pl, Pr, Q, Mec), 5 maintenance
technicians (Mec, Mai, E), 3 shift masters (entire)
B Assemby line S, Pl, Pr, Q 24 assembly operators (entire), 1 team leader (entire)
C Assembly S, Pl, Pr, Q 1 team leader (entire), 1 section manager (entire), 4 Provisioning members (S), 3 Planning members (Pl, Pr, Q), 6 Quality members (Q), 4 External logistics members (S, Pl), 3 Assembly members (Pr, Q)
D Tap section S, Pl, Pr, Q, Mai, C, E, W
1 section manager (entire), 3 shift master (entire), 1 Business unit manager (entire), 5
Provisioning members (S), 4 Planning members (Pl, Pr, Q, C), 7 Quality members (Q), 5
External logistics members (S, Pl), 4 Assembly members (Pr, Q, E), 2 Injection members (Pr,
Q, E), 2 Maintenance members (Mai, E), 3 HR members (W).
E Business unit S, Pl, Pr, Q,
Mai, C, E, W
Heads of: UN (entire), Provisioning (S), Planning (Pl, Pr, Q, C), Quality (Q), External logistics
(S, Pl), Assembly (Pr, Q, E), Injection (Pr, Q, E), Maintenance (Mai, E), HR (W). Production
manager (entire), management advisor (entire), CEO (entire)
F Production
System
S, Pl, Pr, Q,
Mai, C, E, W
Production manager (entire), management advisor (entire), CEO (entire).
Table 3 – Distribution of the surveys and classes
Figure 8 - Injection daily kaizen Figure 9 – Screen of assembly lines
Page 8 of 9
- Assembly: emotional frame, daily and accumulated productivity (OEE), number of open claims associated, open actions and their status, memos and company agenda;
- Injection: emotional frame, number of actions, number of mould change, stopping times, percentage of non-conformities, open actions and their status, memos and company agenda.
After some informal interviews and attendance in the section, it was possible to understand that most of these KPIs are not followed in the best way. Usually they are not visible from a distance, not regularly measured and their targets are too ambitious and difficult to achieve. All the points referred will create a distance between the staff and KPIs and consequently its targets.
Furthermore, some screens are exposed near the assembly lines. These are instantaneously updated and give information to the worker about: what product is being produced, how many parts of the model will be produced, how many parts were already produced, if the rhythm of production established is being fulfilled.
Comparing the KPIs selected by the methodology and the KPIs already measured by the company (not guaranteeing that they are displayed in the best way and shared with the ones who have influence on it), it is possible to confirm that about 50% of the KPIs suggested are already measured. However, most of them are not being updated in the interval of time established by the methodology
and exposed to the right audience. Regarding the Daily Kaizen KPIs, these are related to productivity and are in agreement with selected KPIs to productivity class. Although, with the aim of using KPIs in their maximum potential, it is necessary to review how data is being collected, measured and exposed.
This confrontation between KPIs selected and KPIs is useful once often the staff can look at the methodology solution as a added work. Doing this comparison and concluding that part of these KPIs are already being measured, workers can understand that they will not have extra workload. It is also necessary to do a review to the KPIs already measured by the company in order to certify that the measurements carried out are the best possible, data is correctly collected and if the targets are well defined.
To obtain the remain KPIs suggested by the methodology is necessary to do same changes. Three different types of changes were defined and each one represents a way to overcome the measurement problems and analysis.
One of the types is referring to cases where the data is already collected but only analysed when occurs some problem or an irregular situation (type 1). The energy consumption is one of these cases. It is measured but not regularly followed. In cases like that, it is only necessary review the data collected method and start analysing their regularly.
Another type of action to develop is related with ERP actualizations and workers actions related to this (type 2). One example are the KPIs related with class Planning. These are easily collected if the worker registers in the ERP the moment when production started, all its stops and when it finishes. In this way will be possible to obtain the downtime level, equipment usage rate, start time, set up time. For this, every time the machine stops, the worker should choose from several options, in ERP, the reason of the stop. For example: interval, missing material, set up, device malfunction, preventive maintenance, end of production. Thus, will be possible, besides calculating the downtime level, checking if the start is occurring on time, as well as the set up.
Lastly, type 3 refers to KPIs which need different types of actions by the workers. Duration of problems resolution is one example. Every time that a quality problem occurs, an action is opened in order to study the problem and reach its solution. The quality department is responsible to close the action when the problem is solved. The time of problems resolution is possible to obtain from interval between opening and closing the action. Another example is the number of incidents in which it was necessary the administration’s intervention. This KPI can be easily measured if, to close a complaint, there is a required field to select if the administration intervened or not.
Following steps
The next step should be to communicate to all the staff the KPIs selected, however, in agreement with the administration of the company, it was decided not to do it. This decision was made because, in addition to the production system being restructured, the company is also under a Kaizen project which is defining new KPIs. So, it was decided only to communicate the results to the level 4 and 5, in order not to confuse the workers.
Despite of, at first, the results not being coordinated with the strategy of the company, employees from level 4 and 5 were satisfied about them. The heads of department showed interest in implementing the methodology but, before that, they recognised that it is necessary to change the way of thinking about the KPIs and how to link them with the strategy.
This methodology was also presented in CIE 47 (International Conference on Computers & Industrial Engineering, October 2017 in Faculty of Science and Technology of the Universidade Nova de Lisboa), where it was well received. The audience recognised the importance of the KPIs, the difficulties associated with their choice and the scarcity of literature and studies made about them. It was proposed by the audience a horizontal study about how to correlate different KPIs, in order to pre-establish some actions related with their performance together. Analyse the KPIs commonly used and selected by the methodology was also suggested by the audience. So, it will be possible to understand if there are some KPIs that are recurrently chosen and, consequently, essential for the organization.
4.4 Difficulties presented
As mentioned, raising the awareness of workers regarding the strategy to be implemented is of the utmost importance. Naturally, this would imply a significant effort from the company. Considering that this awareness was not carried out in the studied case, the final results may not be as reliable as desired.
After the distribution of the surveys, the following problems arose: a significant amount of surveys were not returned (25 out of 160); recognition, by the employees, of the need to clarify some of the answers, but also the awareness that it is hard to collect and analyse them; poor comprehension of the surveys; when knowing the finality of the surveys, difficulty to dissociate the KPIs to be obtained with the already existing ones, due to the tendency of trying to match the final results with the already measured KPI, ignoring the need to clarify some questions. Due to these difficulties, the initial methodology was improved and will be explained in the next point.
5. Final methodology
Given the problems exposed, a more robust methodology was designed. The main base remains the definition and knowledge of the company’s strategy by everyone. This is the starting point and it is company’s responsibility. Is suggested for the company to have a training session with the staff in order to help in the definition and transmission of the strategy, based in Hoshin Kanri and BSC.
The methodology itself begins with a fieldwork in the company in order to adapt the theoretical model to the reality. After adapting the model and the surveys, a workshop should be realised. The first part of the workshop relates the staff awareness with the use of KPIs, explaining slightly the final result, and completing the surveys. It is pretended a better comprehension of the surveys and their goal, so the results can be more coherent and all the surveys collected.
Later on, an analysis of the surveys is made and the 3 KPIs with better rating of each class will be selected. As referred, there must be made an assessment between the KPIs selected by the methodology and the ones already measure in the company.
The second part of the workshop is the following step. This consists in present the results of all the surveys. In this way, is requested that the workers can observe their influence in the KPIs selection, to achieve a greater commitment with the results.
Then, is defined the responsible person for each KPI and its target. It is suggested that each KPI should have a KPI card associated, where the responsible, audience, target, baseline, KPQ, formula, etc, are defined. A good comprehension from all staff
Page 9 of 9
concerning the KPIs is essential. The target definition must also be the aim of an exhaustive study, once it should be specific for each KPI, realistic, reachable and defined based on its history. A study about the costs of monitoring each KPI is also proposed, such as their limitations and how it could be manipulated.
After defining all previous points, the implementation which
will result in the various displays will be final step. Lastly, a
periodical review (e.g. yearly) of the KPIs is necessary to ensure
that the KPIs are updated and reflect both strategy of the company
and its critical points.
6. Conclusion and future works Having in mind the difficulties already exposed, a methodology
to select and organize KPIs was developed. This methodology is based on versatility, allowing it to be adaptable to different production systems and industrial companies. It is to be noted that, before implementing the methodology, is necessary to study the company and adapt the model to that case.
With this methodology is possible:
- Chose a group of KPIs which contextualize a process; - Link the KPIs with the workers in order to involve them; - Facilitate the attribution of responsibility to each KPI;
- Achieve a commitment between the workers and selected KPIs;
- Intuitively analyse a KPI performance, in relation to its baseline and target;
- Monitor the selected KPIs; - Enable a relation between the strategy of the organization
and the selected KPIs; - Easy and quick display of each process critical points; - Periodical review and actualization of KPIs.
As future work, is suggested an analysis of a production system’s performance after having implemented the methodology, since in this study there was no chance for that. To perform this is necessary investment from the company to measure the selected KPIs and a long study period there, in order to understand if the KPIs have the desired impact. It would be also interesting to join a methodology to define the company’s strategy to uniform the process and ensure that the company makes its transmission to the staff in the best way. Ideally it would be achieved a harmony between strategy definition and the selected KPIs. A study could also be made about the use of the methodology in different companies in order to understand if there are some trends in KPIs selection. This study would be interesting to verify if some KPIs should be always measured, independently of the company.
Furthermore, it is also relevant to try to manage together the KPIs horizontally, between classes, trying to associate an action with a colour code through a matrix. For example, if the planning department KPIs and productivity KPIs are red, the matrix suggest that is a problem related with setup time and advise a SMED. This study, although being very interesting, is too complex and it may even be inconclusive.
7. References
[1] M. Shacklett, "Setting a KPI course for Big Data," Tech Republic, 01 2013.
[2] M. Hermann, T. Pentek and B. Otto, "Design Principles for Industrie 4.0 Scenarios: A Literature Review," Technische Universität Dortmund , Dortmund , 2015.
[3] "Zukunftsprojekt Industrie 4.0," BMBF, [Online]. Available: https://www.bmbf.de/de/zukunftsprojekt-industrie-4-0-848.html. [Accessed 17 03 2017].
[4] P. S. Pande, The six Sigma Leader - How Top Executives Will Prevail in the 21st Century, The McGraw-Hill, 2007.
[5] B. Marr, Key Performance Indicators for Dummiers, Jonh Wiley & Sons, Ltd, 2015.
[6] "Lean KPIs," Lean Manufacture, [Online]. Available: http://www.leanmanufacture.net/kpi.aspx. [Accessed 24 3 2017].
[7] M. Imai, Gemba Kaizen, McGraw-Hill, 1997.
[8] "10 ways to make your Visual Management Boards work," Industry Forum, [Online]. Available: https://www.industryforum.co.uk/resources/blog/10-ways-to-make-your-visual-management-boards-work/. [Accessed 13 4 2017].
[9] D. Parmenter, Key Performance Indicators - Developing, Implementig, and Using Winning KPIs, John Wiley & Sons , 2007.
[10] C. Protzman, F. Whiton, J. Kerpchar, C. Lewandowski, S. Stenberg and P. Grounds, The Lean Practitioner's Field Book, CRC Press, 2012.
[11] R. Kaplan and D. Norton, "The Balanced Scorecard—Measures that Drive Performance," Harvard Business Review, 1992.
[12] "Lean Production," Vorne Industries Inc., 2011. [Online]. Available: http://www.leanproduction.com/hoshin-kanri.html. [Accessed 15 3 2017].
[13] B. Marr, Key Performance Indicators - The 75 measures every manager needs to know, Pearson, 2012.
[14] "KPI Examples," Klipfolio, [Online]. Available: https://www.klipfolio.com/resources/kpi-examples. [Accessed 24 3 2017].
[15] "Biblioteca de Indicadores," Biblioteca de Indicadores, [Online]. Available: http://www.bibliotecadeindicadores.com.br/. [Accessed 01 06 2017].
[16] "KPI Library," KPI Library, [Online]. Available: http://kpilibrary.com/. [Accessed 01 06 2017].
[17] M. Wrye, "Visual Management is Critical to Lean," Beyond Lean, 09 2012.
[18] R. Wheeler, "Visual Management Boards: What are they and how do you use them?," Life Cycle Engineering, 2016.
[19] H. Tokola, C. Groger, E. Jarvenpaa and E. Niemi, "Designing manufacturing dashboards on the basis of a Key Performance Indictor survey," in 49th CIRP Conference on Manufacturing Systems, 2016.
[20] S. C. Brandão, "Da gestão intermédia à gestão de topo," Escola Superior de Enfermagem do Porto, Porto, 2016.