kpis for measuring and monitoring performance of osh ... 4... · research objectives and...
TRANSCRIPT
Safety and health at work is everyone’s concern. It’s good for you. It’s good for business.
KPIs for measuring and monitoring performance
of OSH management systems
Daniel Podgórski
Central Institute for Labour Protection - National Research Institute, Warsaw, Poland
Healthy Workplaces
Campaign Partner Event
Workshop 4: Harmonisation
of OSH KPI reporting
Brussels, 22-23 March 2017
2
www.healthy-workplaces.eu
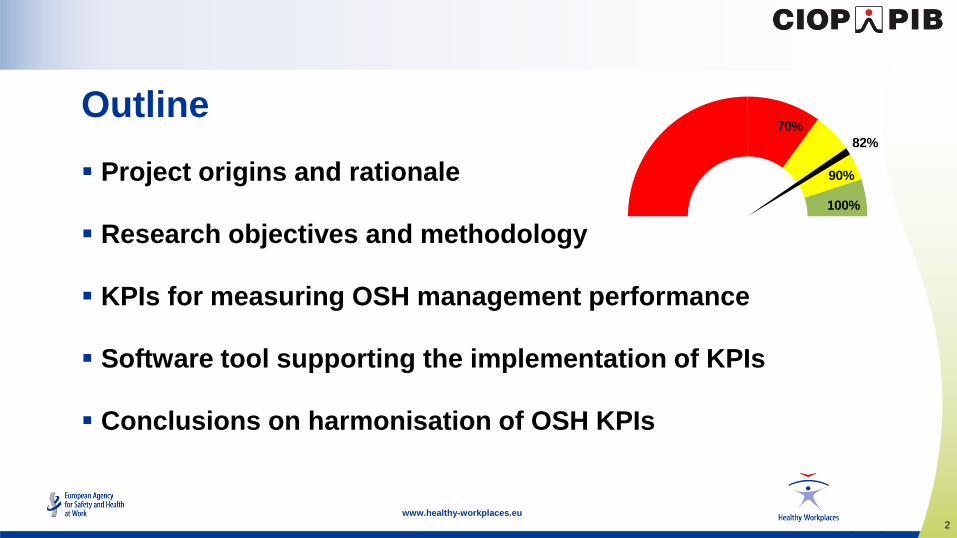
Project origins and rationale
Research objectives and methodology
KPIs for measuring OSH management performance
Software tool supporting the implementation of KPIs
Conclusions on harmonisation of OSH KPIs
70%
90%
100%
82%
Outline

3
www.healthy-workplaces.eu
The project was carried out as a result of the first SAF€RA joint call
for research project proposals on theme “Human and organizational
factors including the value of industrial safety”
SAF€RA consortium originated as an FP7 ERA-NET project:
Coordination of European Research on Industrial Safety towards Smart
and Sustainable Growth, funded in 2012-2015 by the European
Commission (see: www.safera.eu)
KPI-OSH project duration: 1 May 2014 - 31 March 2017
Project origins

4
www.healthy-workplaces.eu
Partner organization Country Project teams Funding
Central Institute for Labour
Protection- National Research
Institute
Poland
• Daniel Podgórski
• Anna Skład
• Zofia Pawłowska
• Małgorzata Pęciłło
Central Institute for Labour
Protection - National
Research Institute
FIOH Finland
• Jarmo Vorme
• Riikka Ruotsala
• Tuula Räsänen
Finnish Institute of
Occupational Health (FIOH)
Ministry of Social Affairs
and Health (MSAH), Finland
Research &
InnovationSpain
• Jesús Lopez De Ipiña Peña
• Julien Negre
Instituto Vasco de
Seguridad y Salud Laborales
(OSALAN), Spain
Project consortium and funding
Scientific Advisory Panel
Prof. Eric HOLLNAGEL Denmark University of Southern Denmark
Prof. Gerard ZWETSLOOT The NetherlandsTNO - The Netherlands Foundation for Applied
Scientific Research
Dr. Markku AALTONEN Finland Finnish Institute of Occuppational Health
Mario CALDERÓN SpainAENOR - The Spanish Association for
Standardisation and Certification
5
www.healthy-workplaces.eu
Rationale for the project
Low effectiveness of OSH management systems:
After 25 years of world-wide proliferation of OSH MSs no conclusive and sound
evidence has been obtained that such systems are effective in terms of preventing
and reducing the number of occupational accidents and diseases
Systematic analysis of OSH MS performance literature (Robson et al., 2007):
• no sufficient evidence confirming good performance of OSH MSs
• OSH MSs are to be neither recommended nor objected to
The study of European Trade Union Institute (2011):
• OSH MS certificate confirms compliance with procedures, but does not guarantee good OSH results
• In practice enterprises with a certified OSH MS in place do not provide better working conditions
as compared to other enterprises

6
www.healthy-workplaces.eu
Developing an easy-to-use method to support managers
in measuring operational performance of OSH MS
Focus on the small number of leading performance indicators
Developing a software tool
to facilitate implementation
of KPIs in enterprises
Project goals

7
www.healthy-workplaces.eu
Examples of lagging (outcome) indicators:
LTIR - Lost Time Injury Rate = (# of Lost-Time Injuries * 200,000) / # hours worked
LTIFR - Lost Time Injury Frequency Rate = (# of Lost-Time Injuries * 1,000,000) / # hours worked
TRIR - Total Recordable Injury Rate = (# of Recordable Injuries * 200,000) / # hours worked
SR - Severity Rate = Total # of lost workdays / Total # of recordable incidents
DART - Days Away from work, days of Restricted work, and/or days of Job Transfer
Examples of leading operational performance indicators:
Number of jobs for which risk assessment has been carried out or updated (e.g. per month)
Number of risk assessments completed or reviewed in a given time period
% of workers completing OSH refresher training courses (e.g. quarterly)
% of safety checks on machines and installations, as compared to the plan (e.g. monthly)
Leading vs. lagging indicators
8
www.healthy-workplaces.eu
To develop a relatively small set of leading KPIs (ca. 20-30) assigned
to individual components of the OSH MS
To validate a method for prioritization of indicators applied for
measuring OSH MS operational performance
• The KPIs should be able to measure the operational rather than structural
performance of OSH MS on a daily basis
• The tool should allow the managers to implement their own sets of KPIs,
which would be better tailored to specific conditions of their enterprises
Research objectives
9
www.healthy-workplaces.eu
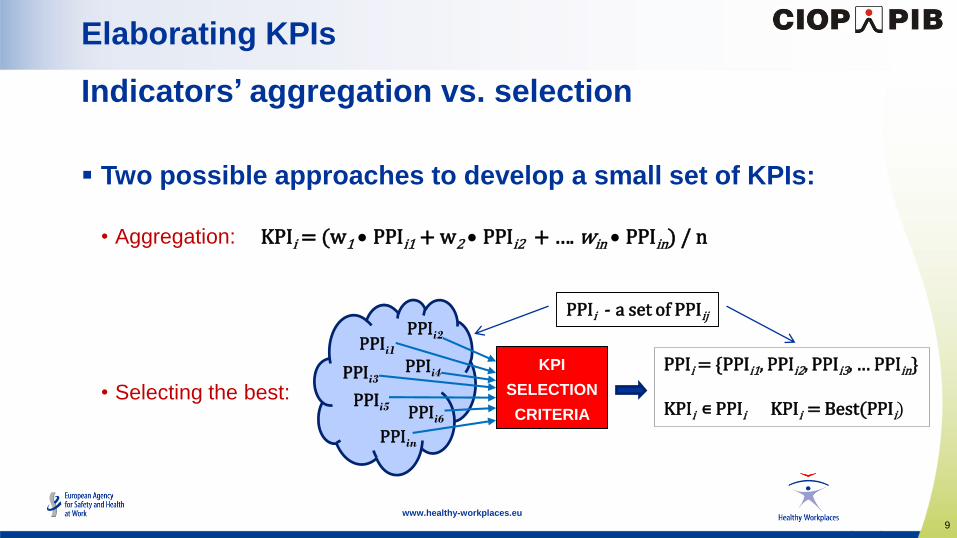
Two possible approaches to develop a small set of KPIs:
• Aggregation: KPIi = (w1 PPIi1 + w2 PPIi2 + …. win PPIin) / n
• Selecting the best:
Elaborating KPIs
Indicators’ aggregation vs. selection
PPIi1PPIi2
PPIi3PPIi4
PPIi5 PPIi6PPIin
KPI
SELECTION
CRITERIA
PPIi = {PPIi1, PPIi2, PPIi3, … PPIin}
KPIi ∊ PPIi KPIi = Best(PPIi)
PPIi - a set of PPIij
10
www.healthy-workplaces.eu
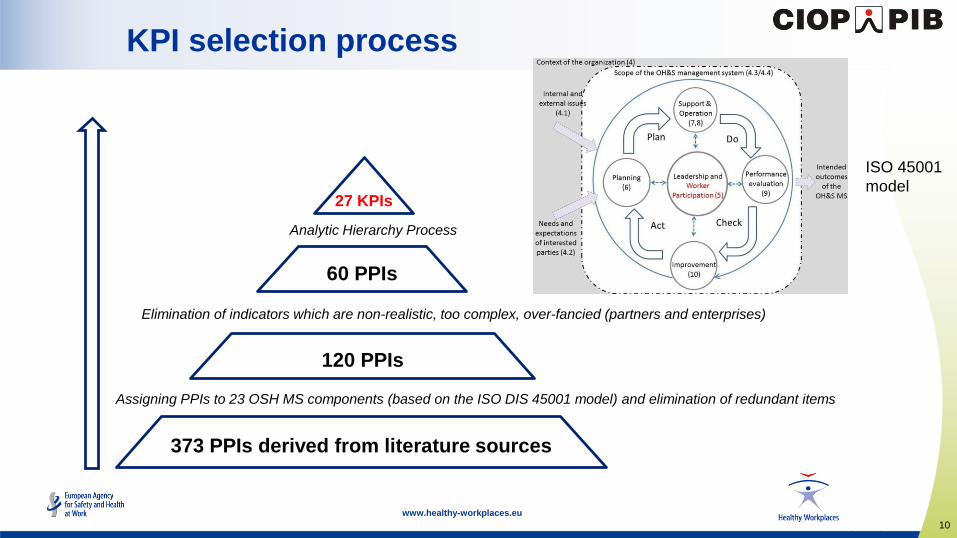
KPI selection process
373 PPIs derived from literature sources
120 PPIs
60 PPIs
Assigning PPIs to 23 OSH MS components (based on the ISO DIS 45001 model) and elimination of redundant items
Elimination of indicators which are non-realistic, too complex, over-fancied (partners and enterprises)
Analytic Hierarchy Process
27 KPIs
ISO 45001
model
11
www.healthy-workplaces.eu
Scientific publications:
• Basso et al., 2004. Reviewing the safety management system by incident investigation and performance
indicators. Journal of Loss Prevention in the Process Industries, 17(3), 225-231
• Hinze et al., 2013. Leading indicators of construction safety performance. Safety Science, 51, 23-28.
• Reiman & Pietikäinen, 2012. Leading indicators of system safety - Monitoring and driving the
organizational safety potential. Safety Science 50, 1993-2000.
Practical guidelines:
• Guidance on the Use of Positive Performance Indicators to Improve Workplace Health and Safety. Office
of Australian Safety and Compensation Council, 2005, Australia.
• Guidance Note. Performance standards and indicators. WorkSafey Victoria Advisory Service, Victorian
WorkCover Authority, 2011, Australia.
• Leading Performance Indicators. Guidance for Effective Use. Step Change in Safety, 2003, UK.
• Overview of leading indicators for occupational health and safety in mining. International Council on
Mining and Metals (ICMM), 2012, London, UK.
Selected examples of literature sources analysed
12
www.healthy-workplaces.eu
Wreathall J., 2001. Final Report on Leading Indicators of Human Performance, EPRI,
Palo Alto, CA, and the U.S. Department of Energy, Washington, DC, USA.
Kjellen U., 2009. The safety measurement problem revisited. Safety Science, 47(4), 486-489
Hale A., 2009. Why safety performance indicators? Safety Science, 47(4), 479-480
Hollnagel E., 2013. The Resilience Analysis Grid (RAG)
Step Change in Safety, 2003. Leading Performance Indicators. Guidance for for Effective Use.
SMART (Specific, Measurable, Achievable, Relevant, Time-bound)
Which criteria for the selection of best indicators?
Literature on the selection of performance indicators

13
www.healthy-workplaces.eu
Criteria for KPI selection
Comprehended Clearly defined to be easily understood and
communicated by/to all persons participating in and/or supervising the process (communication power)
Objective
Based on objective sources of data
It is impossible to manipulate its value without introducing real changes to OSH management processes
Relevant
Representative for monitoring operational performance of a given OSH MS component
Providing information relevant for corrective/preventive action (potential for the improvement)
Measurable
Data easy to be collected, measured and calculated
Sensitive to small changes of the working environment
Capable to measure process dynamics
Cost efficient
Arrangements and resources necessary for the measurement are available
Benefits for OSH exceed the costs of measurements

14
www.healthy-workplaces.eu
The AHP is implemented in four stages:
1. Decomposition of a decision problem by constructing a hierarchical model of
criteria and decision variants (performance indicators - PPIij)
2. Pairwise comparison of the selection criteria, and generating the vector
of weights for individual criteria
3. Pairwise comparison of PPIij
indicators in relation to the criteria
4. Prioritization – creating
a vector of PPIij preferences
Analytic Hierarchy Process – AHP (Saaty, 1970)
Comprehended
Goal: Selection of KPI for the i-th OSH MS component
Objective Relevant Measurable Cost efficient
PPIi1 PPIi2 PPIi3 PPIi(n-1) PPIin
…………...

15
www.healthy-workplaces.eu
Ranking criteria by pairwise comparisons
AHP comparisons were supported by MakeItRational tool (makeitrational.com)
16
www.healthy-workplaces.eu
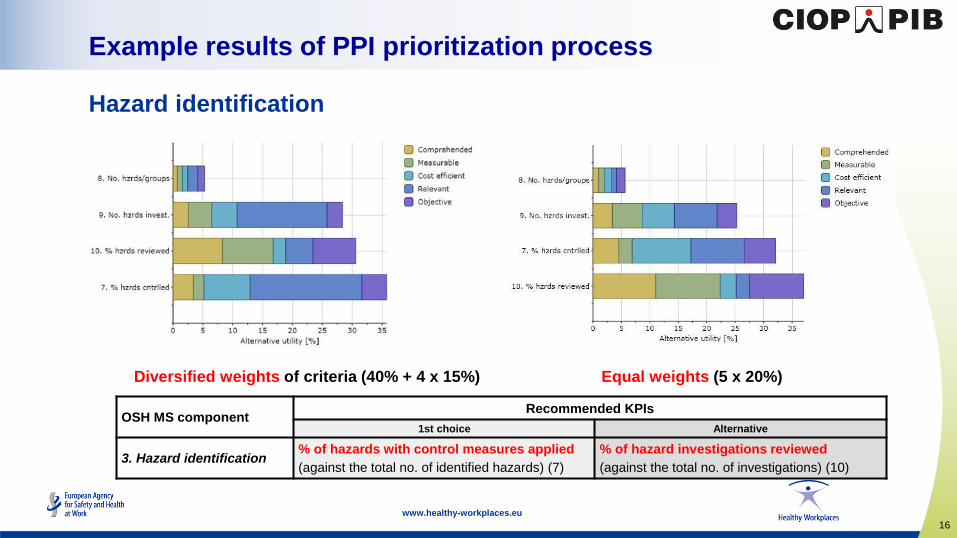
Hazard identification
Example results of PPI prioritization process
Diversified weights of criteria (40% + 4 x 15%) Equal weights (5 x 20%)
OSH MS componentRecommended KPIs
1st choice Alternative
3. Hazard identification% of hazards with control measures applied
(against the total no. of identified hazards) (7)
% of hazard investigations reviewed
(against the total no. of investigations) (10)

17
www.healthy-workplaces.eu
List of selected KPIs 1/3
Leadership and worker participation:
• Audits reports reviewed
• Perception of leadership by workers
• Workers positively evaluating leadership
• Job descriptions complying with OSH
Planning:
• Hazards under control
• Hazard investigations reviewed
• Risk assessments completed or reviewed
• Risk control measures implemented
• OSH objectives achieved

18
www.healthy-workplaces.eu
Support:
• Permits to work complying with OSH
• Workers trained according to plan
• OSH training plan accomplished
• Effectiveness of OSH training
• Near-misses reported by workers
• Managers’ OSH-related meetings with workers
• Workers involved in OSH improvements
Operations:
• Cost equipment failures
• Preventive maintenance activities performed
• Purchase specifications with reference to OSH
• OSH related meetings with contractors
• Workers trained in emergency response
List of selected KPIs 2/3

19
www.healthy-workplaces.eu
Performance evaluation:
• Monitoring activities completed
• Non-conformities identified during audits
• Internal audits completed
• OSH management system issues reviewed
Improvement
• Corrective/preventive actions completed
• Measurement activities with positive results
List of selected KPIs 3/3

20
www.healthy-workplaces.eu
5. HC
HazCntrl
[1] Acronym:
[2] KPI name:
Percentage of hazards with control measures applied (against the total number of new hazards identified in a given reporting period)
[3] OSH MS component: 6.1.2. Hazard Identification
[4] Necessary data to calculate the KPI:
Xi - No. of newly identified hazards1 in i-th unit, in respect to which appropriate control measures have been implemented according to schedule2 within a given reporting period;
Yi - Total no. of newly identified hazards in i-th unit, in respect to which appropriate control measures should have been implemented within a given reporting period;
[5] Calculation formula:
HCi = Xi / Yi • 100%
N
HC = (Σ HCi) / N i=1
N - No. of units conducting hazard identification and collecting data on newly identified hazards. 1)
Hazards identified at new workstations, in new processes/machines, or hazards identified as new ones at existing workstations/processes. The number of newly identified hazard may refer to hazards identified prior or within a reporting period.
2) The length of the period required for planning and the implementation of control measures after the identification of a hazard can be specified (e.g. no. of days) or unlimited.
[6] Source of data: Internal reports or records resulting from risk assessment/management processes, which include the identification of hazards in individual units of the enterprise (maintained by heads of the units and/or by the safety manager/OSH department).
[7] Measurement frequency:
Quarterly
[8] Graphical representation:
HC current value: semicircular speedometer (with colour policy)
HCi current values: vertical bars (one for each unit3, but ≤ 10)
HC historical values: vertical bars for X past reporting periods
3
3) No. of bars for units & periods should be set up by the user (no. ≤ 10).
[9] Colour policy:
Red: HC < 70%
Yellow: 70% ≤ HC ≤ 90%
Green: HC > 90%
[10] The method of the KPI implementation in the enterprise:
- Reviewing procedures, reports and other OSH MS documents related to hazard identification, risk assessment and implementation of control measures aimed at elimination/reduction of risks;
- Identification of units/positions which are responsible for conducting and documenting results of hazard identification and risk management procedures;
- Modification of respective procedures to ensure ongoing identification and regular reporting a number and types of newly identified hazards to a responsible OSH unit.
KPI description
sheet example
21
www.healthy-workplaces.eu
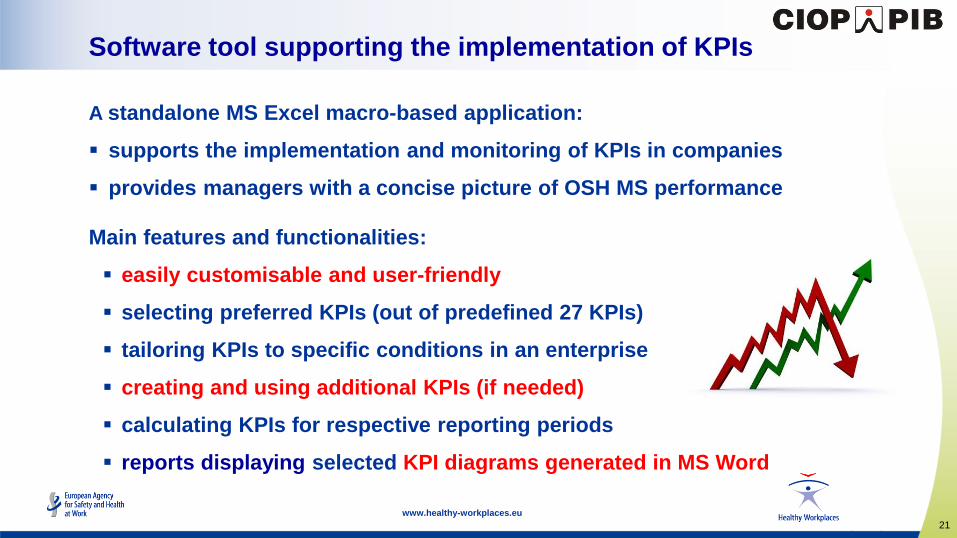
A standalone MS Excel macro-based application:
supports the implementation and monitoring of KPIs in companies
provides managers with a concise picture of OSH MS performance
Main features and functionalities:
easily customisable and user-friendly
selecting preferred KPIs (out of predefined 27 KPIs)
tailoring KPIs to specific conditions in an enterprise
creating and using additional KPIs (if needed)
calculating KPIs for respective reporting periods
reports displaying selected KPI diagrams generated in MS Word
Software tool supporting the implementation of KPIs

22
www.healthy-workplaces.eu
KPI-OSH Tool user interface (example screenshots)
Starting page of the Tool
Selecting KPIs to be used
(out of predefined 27 KPIs)
KPI input configuration

23
www.healthy-workplaces.eu
KPI-OSH Tool user interface (example screenshots)

24
www.healthy-workplaces.eu
70%
90%
100%
82%Examples of KPI diagrams
Global KPI trend for selected periods
Values of sub-KPIs for individual departments
Global KPI current value
40%60%
80%
0
50
100
Quarter 1 2015 Quarter 2 2015 Quarter 3 2015
70%80% 95%
0
50
100
Quarter 1 2015 Quarter 2 2015 Quarter 3 2015
90%70% 60%
0
50
100
Quarter 1 2015 Quarter 2 2015 Quarter 3 2015
80%95%
60%
75% 80%
0
20
40
60
80
100
Dept 1 Dept 2 Dept 3 Dept 4 Dept 5
69,1%70,3%
76,9%
64
66
68
70
72
74
76
78
Quarter 1 2015 Quarter 2 2015 Quarter 3 2015
Dept 1
Dept 2
Dept 3
25
www.healthy-workplaces.eu
Pilot implementation of beta version in 3 enterprises in Poland
Methodology for evaluating the usability of the tool elaborated by FIOH
Evaluation included meetings and interviews with safety managers
Data collection and analysis
Next steps:
Drafting recommendations for improving the Tool
Developing a new improved version 2.0 and its User Manual
Promoting the Tool via project website, OSHwiki and social media
Testing and validation of the KPI-OSH Tool
26
www.healthy-workplaces.eu
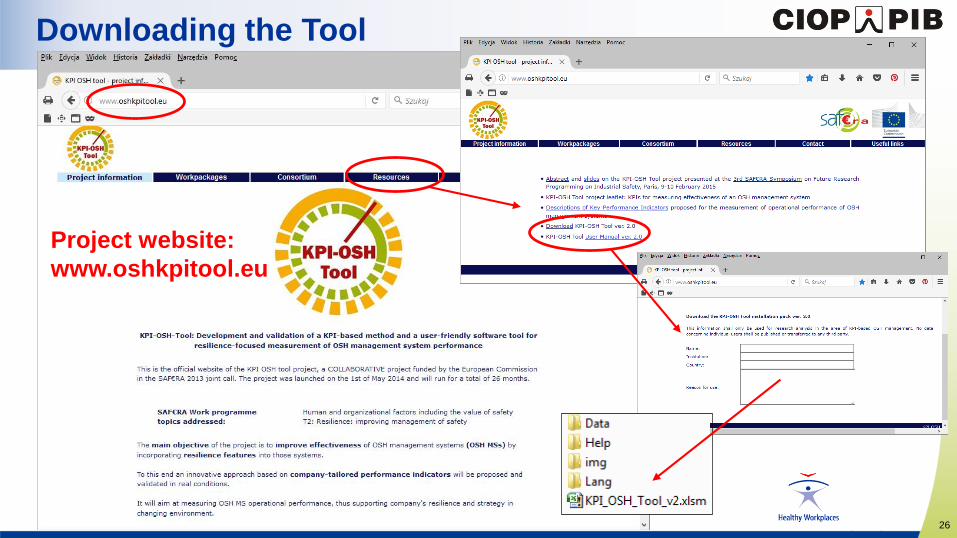
Project website:
www.oshkpitool.eu
Downloading the Tool
27
www.healthy-workplaces.eu
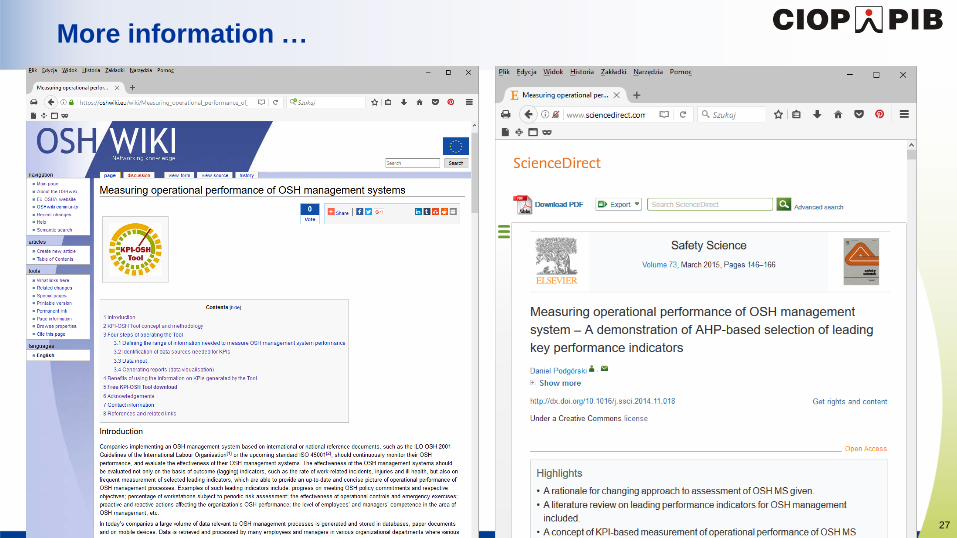
Dodać screen z OSHwiki
More information …

28
www.healthy-workplaces.eu
Focus on leading rather than lagging indicators
KPIs should be useful for managers in improving OSH management
Better a small set of KPIs than many performance metrics
A clearly defined set of criteria for the selection of KPIs, for example:
Comprehended, Relevant, Objective, Measurable, and Cost-efficient
Defining KPIs unambiguously (calculation formulas, descriptions
of parameters, sources of data, demonstration and reporting etc.)
Implementation of KPIs supported by the user-friendly software tool
Conclusions on harmonization of OSH KPIs
