methodology for the assessment of dose · pdf fileattachment c-12 . methodology for the...
TRANSCRIPT

United Nations Scientific Committee on the Effects of Atomic Radiation
ATTACHMENT C-12
METHODOLOGY FOR THE ASSESSMENT OF DOSE FROM EXTERNAL EXPOSURE AND INHALATION OF
RADIOACTIVE MATERIAL UNSCEAR 2013 Report, Annex A, Levels and effects of radiation exposure due to the nuclear accident after the 2011 great east-Japan earthquake and tsunami,
Appendix C (Assessment of doses to the public)
Content
This attachment describes the methodology used for assessing public exposure to radiation from the accident at the Fukushima Daiichi nuclear power station in March 2011 due to inhalation and to external irradiation.
The population data are taken from the Japan Census [MIC, 2011].
Acknowledgements
The Committee would like to acknowledge the work done by M. Balonov and V. Golikov (Institute of Radiation Hygiene, St. Petersburg, Russia), P. Bedwell (Public Health England, Chilton, UK), and F. Gering (Bundesamt für Strahlenschutz, Neuherberg, Germany) who conducted the analysis of doses from inhalation and from external exposure, and who prepared this attachment.
Notes
The designations employed and the presentation of material in this publication do not imply the expression of any opinion whatsoever on the part of the Secretariat of the United Nations concerning the legal status of any country, territory, city or area, or of its authorities, or concerning the delimitation of its frontiers or boundaries.
Information on uniform resource locators and links to Internet sites contained in the present publication are provided for the convenience of the reader and are correct at the time of issue. The United Nations takes no responsibility for the continued accuracy of that information or for the content of any external website.
© United Nations, September 2014. All rights reserved, worldwide.
This publication has not been formally edited.

Contents
CONTENT ................................................................................................................................... 1
ACKNOWLEDGEMENTS ......................................................................................................... 1
NOTES ......................................................................................................................................... 1
I. INTRODUCTION .................................................................................................................. 5
A. Basic approach ................................................................................................................. 5 B. Basic models for dose assessment .................................................................................... 6
1. External exposure ....................................................................................................... 6 2. Dose from inhalation .................................................................................................. 6
C. Input data for dose assessment ......................................................................................... 7
II. METHODOLOGY FOR ESTIMATION OF DOSE FROM EXTERNAL EXPOSURE FROM DEPOSITED RADIONUCLIDES ....................................................... 8
A. Computational model ....................................................................................................... 8 1. Basic computational model ........................................................................................ 8 2. Population groups and exposure duration .................................................................. 9 3. Evacuation of the public ........................................................................................... 10 4. Environmental remediation and population return ................................................... 12
B. Model parameters and assumptions ............................................................................... 13 1. Dose- and kerma-rate conversion coefficients for deposited radionuclides
and attenuation of radiation ...................................................................................... 13 2. Location factors for Japan ........................................................................................ 14 3. Occupancy factors for Japan .................................................................................... 15 4. Dose conversion coefficients.................................................................................... 16
III. METHODOLOGY FOR ESTIMATION OF DOSE FROM EXTERNAL EXPOSURE FROM RADIOACTIVE PLUMES ................................................................ 17
A. Computational model ..................................................................................................... 17 B. Model parameters ........................................................................................................... 19
IV. METHODOLOGY FOR ESTIMATION OF DOSE FROM INHALATION ..................... 20
A. Computational model ..................................................................................................... 20 B. Model parameters ........................................................................................................... 22
V. ASSESSMENT OF COLLECTIVE DOSES ....................................................................... 24
VI. INPUT DATA FOR DOSE ASSESSMENT ....................................................................... 25
A. Source term..................................................................................................................... 25 B. Composition of deposited radionuclides ........................................................................ 26 C. Data sets for the assessment of dose from external exposure from deposited
radionuclides .................................................................................................................. 28

ATTACHMENT C-12: METHODOLOGY FOR THE ASSESSMENT OF DOSE FROM EXTERNAL EXPOSURE AND INHALATION ... 4
1. Within 100 km of FDNPS and the entire Fukushima prefecture (Groups 1 and 2) ........................................................................................................................ 28
2. The six prefectures − Iwate, Miyagi, Tochigi, Gunma, Ibaraki and Chiba (Group 3) .................................................................................................................. 28
3. Distant prefectures of Japan (Group 4) .................................................................... 28 D. Data set for the assessment of dose from external exposure for the plume and
internal exposure from inhalation................................................................................... 28 E. Evacuation data .............................................................................................................. 29
REFERENCES ........................................................................................................................... 37

ATTACHMENT C-12: METHODOLOGY FOR THE ASSESSMENT OF DOSE FROM EXTERNAL EXPOSURE AND INHALATION ... 5
I. INTRODUCTION
A. Basic approach
1. This attachment describes the methodology used for assessing public exposure in Japan and in some other countries resulting from the accident at the Fukushima Daiichi nuclear power station (FDNPS) in March 2011 from the following exposure pathways:
(a) External exposure from radionuclides deposited on the ground;
(b) External exposure from radionuclides in the radioactive plumes;
(c) Internal exposure from inhalation of radionuclides in the radioactive plumes.
2. For the purpose of its assessment, the Committee has estimated the doses received in the first year, over 10 years after the 2011 accident and over a lifetime (i.e. to age 80 years) following the accident. The estimates of effective doses and absorbed doses to the thyroid, red bone marrow and female breast were based, to the extent possible, on measurement data and realistic models and assumptions. Estimates were also made of collective doses to the public incurred in the first year, over 10 years and until an attained age of exposed individuals of 80 years.
3. For the purposes of the assessment, the Japanese territory was delineated into areas that had comparable conditions that influenced the doses and for which environmental measurement data of similar quality were available. At the time of the assessment, measurement data of different quality were available for (a) the area up to 100 km from FDNPS and the whole of Fukushima Prefecture, (b) six neighbouring or nearby prefectures (Iwate, Miyagi, Tochigi, Gunma, Ibaraki and Chiba) and (c) the rest of Japan. The Committee focused on assessing doses to the public living in Fukushima Prefecture and the neighbouring prefectures with elevated radiation levels.
4. The Committee considered four groups of geographical areas in Japan:
(a) Group 1 included settlements in Fukushima Prefecture where members of the public were evacuated in days to months after the accident;
(b) Group 2 included all non-evacuated districts of Fukushima Prefecture;
(c) Group 3 included selected prefectures in eastern Japan that are neighbouring (prefectures of Miyagi, Tochigi, Gunma and Ibaraki) or nearby (prefectures of Iwate and Chiba) Fukushima Prefecture;
(d) Group 4 included all the remaining prefectures of Japan.
5. The Committee considered three main age groups as at the time of the releases: adults, children and infants. For the estimation of doses, 20-year-old adults were chosen to represent all adults, 10-year-old children to represent all children older than 5 years old, and one-year-old infants to represent all infants younger than five years old. The growth of one-year-old infants and 10-year-old children was taken into account in the assessments of doses received over time.
6. The uncertainties associated with the assessed doses to the public were addressed to the extent possible.

ATTACHMENT C-12: METHODOLOGY FOR THE ASSESSMENT OF DOSE FROM EXTERNAL EXPOSURE AND INHALATION ... 6
B. Basic models for dose assessment
1. External exposure
7. The major (in chronological order) external exposure pathways following the releases of radioactive material to the environment were those identified in (a) and (b) of paragraph 1.
8. For the assessment of effective dose and absorbed doses to organs from external exposure, information on the following was necessary:
(a) The external gamma-radiation field;
(b) Human behaviour in the radiation field;
(c) Conversion coefficients relating the radiation field to effective dose and absorbed dose to organs1.
9. The kerma rate in air, Kair (t), at the height of 1 m above the surface of an open plot of undisturbed ground (the reference site) was the basic parameter used to define the radiation field. Its value was influenced both by the deposition density of radionuclides and natural factors including the initial attenuation of radiation in soil, radioactive decay, vertical migration of radionuclides into soil, and the presence of snow cover.
10. The value of Kair (t) in an anthropogenic environment was taken into account by means of location factors, fj, defined as the ratio of the kerma rate in air at a typical location (area), j, inside a settlement to the kerma rate at the reference site [Golikov et al., 1999; Golikov et al., 2002; Golikov et al., 1993; Jacob, 1996; Meckbach et al., 1988]. These location factors declined with time because of weathering, street cleaning etc.
11. Human behaviour in the radiation field was described by means of occupancy factors, pij, which represent the fraction of time spent by the representative of population group, i, in typical location, j, of the settlement.
12. The conversion coefficients, ki, relate the measured or modelled values of Kair (t) to effective dose rate or absorbed dose rate to particular organs of the representative person in population group, i. The conversion coefficients depend on irradiation geometry; for example, they are different for radionuclides deposited on the ground and in a plume.
2. Dose from inhalation
13. Inhalation of radionuclides by the public was assumed to occur only during the passage of a radioactive plume through a settlement where members of the public resided. The contribution of resuspended radionuclides to dose from inhalation was negligible, much less than the uncertainty associated with the dose estimates.
14. The radionuclides that were taken into account were those that had been measured in the environmental samples collected in Japan and those for which their dispersion had been modelled (see appendix B). They include mostly radioisotopes of volatile elements including iodine, tellurium and caesium.
1 Published values of conversion coefficients are often quoted in terms of the protection quantity, equivalent dose to particular organs. However, the numerical values of these conversion coefficients were taken to apply to the absorbed doses to those organs because the doses of interest are due to low-LET radiation.
ATTACHMENT C-12: METHODOLOGY FOR THE ASSESSMENT OF DOSE FROM EXTERNAL EXPOSURE AND INHALATION ... 7
C. Input data for dose assessment
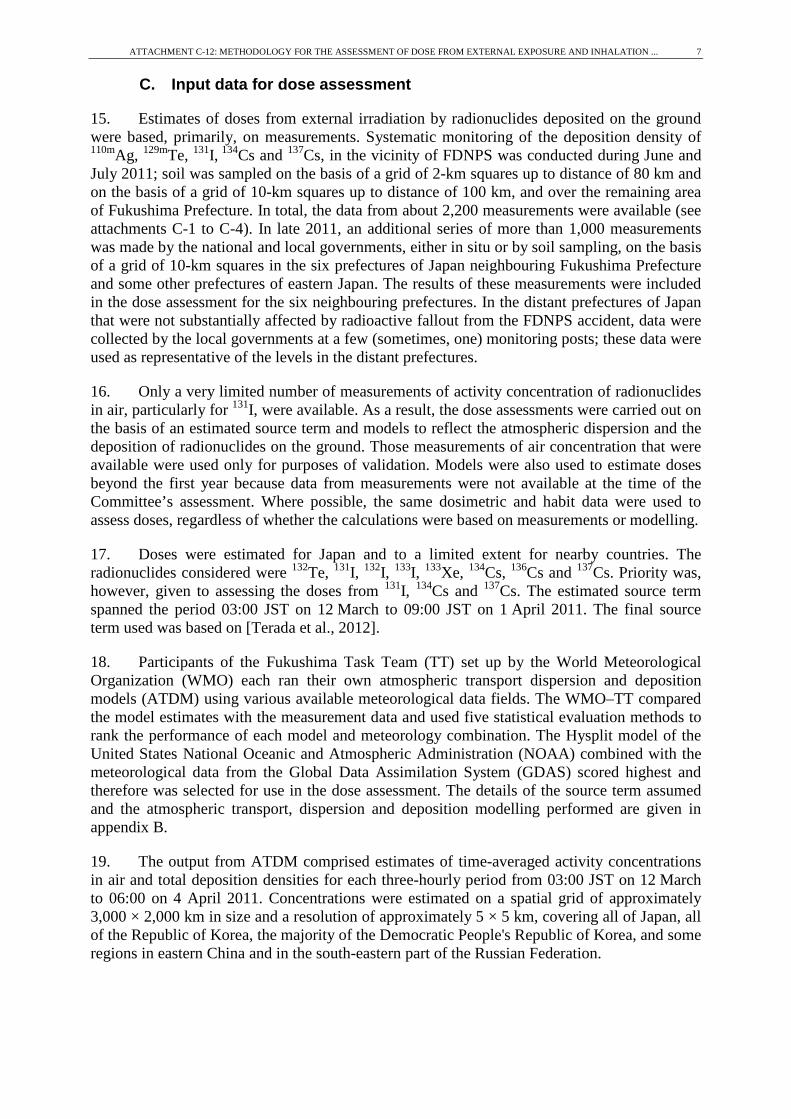
15. Estimates of doses from external irradiation by radionuclides deposited on the ground were based, primarily, on measurements. Systematic monitoring of the deposition density of 110mAg, 129mTe, 131I, 134Cs and 137Cs, in the vicinity of FDNPS was conducted during June and July 2011; soil was sampled on the basis of a grid of 2-km squares up to distance of 80 km and on the basis of a grid of 10-km squares up to distance of 100 km, and over the remaining area of Fukushima Prefecture. In total, the data from about 2,200 measurements were available (see attachments C-1 to C-4). In late 2011, an additional series of more than 1,000 measurements was made by the national and local governments, either in situ or by soil sampling, on the basis of a grid of 10-km squares in the six prefectures of Japan neighbouring Fukushima Prefecture and some other prefectures of eastern Japan. The results of these measurements were included in the dose assessment for the six neighbouring prefectures. In the distant prefectures of Japan that were not substantially affected by radioactive fallout from the FDNPS accident, data were collected by the local governments at a few (sometimes, one) monitoring posts; these data were used as representative of the levels in the distant prefectures.
16. Only a very limited number of measurements of activity concentration of radionuclides in air, particularly for 131I, were available. As a result, the dose assessments were carried out on the basis of an estimated source term and models to reflect the atmospheric dispersion and the deposition of radionuclides on the ground. Those measurements of air concentration that were available were used only for purposes of validation. Models were also used to estimate doses beyond the first year because data from measurements were not available at the time of the Committee’s assessment. Where possible, the same dosimetric and habit data were used to assess doses, regardless of whether the calculations were based on measurements or modelling.
17. Doses were estimated for Japan and to a limited extent for nearby countries. The radionuclides considered were 132Te, 131I, 132I, 133I, 133Xe, 134Cs, 136Cs and 137Cs. Priority was, however, given to assessing the doses from 131I, 134Cs and 137Cs. The estimated source term spanned the period 03:00 JST on 12 March to 09:00 JST on 1 April 2011. The final source term used was based on [Terada et al., 2012].
18. Participants of the Fukushima Task Team (TT) set up by the World Meteorological Organization (WMO) each ran their own atmospheric transport dispersion and deposition models (ATDM) using various available meteorological data fields. The WMO–TT compared the model estimates with the measurement data and used five statistical evaluation methods to rank the performance of each model and meteorology combination. The Hysplit model of the United States National Oceanic and Atmospheric Administration (NOAA) combined with the meteorological data from the Global Data Assimilation System (GDAS) scored highest and therefore was selected for use in the dose assessment. The details of the source term assumed and the atmospheric transport, dispersion and deposition modelling performed are given in appendix B.
19. The output from ATDM comprised estimates of time-averaged activity concentrations in air and total deposition densities for each three-hourly period from 03:00 JST on 12 March to 06:00 on 4 April 2011. Concentrations were estimated on a spatial grid of approximately 3,000 × 2,000 km in size and a resolution of approximately 5 × 5 km, covering all of Japan, all of the Republic of Korea, the majority of the Democratic People's Republic of Korea, and some regions in eastern China and in the south-eastern part of the Russian Federation.

ATTACHMENT C-12: METHODOLOGY FOR THE ASSESSMENT OF DOSE FROM EXTERNAL EXPOSURE AND INHALATION ... 8
II. METHODOLOGY FOR ESTIMATION OF DOSE FROM EXTERNAL EXPOSURE FROM DEPOSITED RADIONUCLIDES
A. Computational model
1. Basic computational model
20. The computational model used [Golikov et al., 1999; Golikov et al., 2002; Golikov et al., 1993; Jacob, 1996] consists of four submodels for determining:
(a) Kerma rate in free air at a reference site in the settlement;
(b) Location factors defined by the ratio of kerma rates in air at a location of interest to that at the reference site;
(c) Occupancy factors for different population groups at various types of locations;
(d) Conversion coefficients for different population groups from kerma rate in air to effective dose rate or absorbed dose rate to the particular organ.
21. The first submodel was used to calculate the time-dependent kerma rate in free air, )(tKair
(nGy/h), at a height of 1 m above an undisturbed open field, lawn or meadow. This was considered as the key parameter for the radiation field at the reference site. The value of
)(tKair is influenced both by the deposition density of radionuclides and natural factors
including the initial attenuation of radiation in soil, radioactive decay, and the vertical migration of radionuclides in soil:
)exp()()()( tkA
AAtrtK mdepm
m
mair ⋅−⋅⋅⋅⋅= ∑ λ
Cs137Cs137
, (nGy/h) (2.1)
where r(t) is the ratio of the kerma rate in air above undisturbed open ground to that for a reference depth distribution of a radionuclide in soil (dimensionless); r(t) accounts for the penetration of radionuclides in soil; Am is the deposition density of radionuclide, m, on the ground (kBq/m2); dep
mk is the kerma-rate conversion coefficient for a reference depth distribution of radionuclide, m, in soil, that is, it is the ratio of the kerma rate in free air at a height of 1 m above the ground to the deposition density of radionuclide, m, on soil (nGy/h per kBq/m2); and λm is the decay constant of radionuclide, m (t-1). The most long-lived and radiologically significant radionuclide, 137Cs, was chosen as the reference radionuclide for area mapping.
22. In the second submodel, the kerma rate in air at location, j, was assessed by multiplying the kerma rate, )(tKair
, in air at a height of 1 m above an undisturbed open field by the time-dependent dimensionless location factor, fj (t), defined as the ratio of the air kerma rate at location, j, inside a settlement to the kerma rate at the reference site [Golikov et al., 1999; Golikov et al., 2002; Golikov et al., 1993; Jacob, 1996; Meckbach et al., 1988].
23. The third submodel was used for the calculation of the dose rate in air for the representative person of population group, i, taking into account human behaviour in the radiation field. This was accomplished by weighting the dose rate in air at location, j, by the dimensionless occupancy factor, pij, and summing the product over the locations of interest. The value of pij is the fraction of time spent by the representative of population group, i, in the

ATTACHMENT C-12: METHODOLOGY FOR THE ASSESSMENT OF DOSE FROM EXTERNAL EXPOSURE AND INHALATION ... 9
typical location, j, of the settlement and was considered to be constant for a defined population group, with the exception of the evacuated population groups (see next subsection).
24. The sum of the products of fj(t) and pij is represented here by a single modifying factor, the time-dependent aggregated dose reduction factor, )(tRF dep
i .
25. In the fourth submodel, the effective dose rate, )(tE depi
, to the representative of population group, i, (or absorbed dose rate to the particular organ of these individuals) was calculated according to:
(2.2)
where ki is the dose conversion coefficient from kerma in air to effective dose or absorbed dose to the particular organ (dimensionless) for exposure from deposited radionuclides.
26. For environmental contamination with gamma-emitting radionuclides released from FDNPS, the model used dose conversion coefficients, ki, that are independent of location type and time after the accident but that are dependent on the age group considered [Golikov et al., 2007; Jacob et al., 1990; Petoussi-Henss et al., 2012].
27. Effective dose rates were also calculated using dose coefficients that directly relate the levels of deposition of radionuclides on soil to the effective dose rate to the representative of population group, i:
(2.3)
where depmi
depim kke ⋅=, is the effective dose-rate conversion coefficient for the reference activity
distribution of radionuclide, m, in soil; it is equal to the ratio of the effective dose rate for the representative person of population group, i, to the deposition density of radionuclide, m, on soil (nSv/h per kBq/m2).
28. Regardless of whether )(tE depi was assessed by (2.2) or (2.3), the effective dose,
)(TEdepi , received in time, T (h), from deposited radionuclides can be calculated by:
(2.4)
2. Population groups and exposure duration
29. The external exposure of members of the public in an environment contaminated by radionuclides depends on the time spent outdoors and in different premises and also on the shielding properties of the premises and their body mass. On the basis of experience gained following the Chernobyl accident [Golikov et al., 1999; Golikov et al., 2007; Golikov et al.,
(nSv/h) )()()()()( tRFktKptfktKtE depiiair
jijjiair
depi ⋅⋅=⋅⋅⋅= ∑
)/()()exp()()()( ,137
137 hnSvptfetA
AAtrtEj
ijjdep
immm Cs
mCs
depi ∑∑ ⋅⋅⋅⋅−⋅⋅⋅= λ
)()(10)( 6 mSvdttETET
depi
depi ⋅⋅= ∫−

ATTACHMENT C-12: METHODOLOGY FOR THE ASSESSMENT OF DOSE FROM EXTERNAL EXPOSURE AND INHALATION ... 10
2002; Golikov et al., 1993; Jacob, 1996], deterministic estimates of the dose from external exposure were considered for the following four social/age groups:
(a) 20-year-old adults working mostly indoors;
(b) 20-year-old adults working mostly outdoors;
(c) 10-year-old children as representative of school children (aged 6–15 years in 2011);
(d) One-year-old infants as representative of preschool children (aged 0–5 years in 2011).
30. For these population groups, the shielding properties of the following three types of dwelling typical for Japan were considered:
(a) Wooden one-to-three-storey houses;
(b) Wooden fireproof (plastered) one-to-three-storey houses;
(c) Concrete multi-storey apartments
31. In total, 12 combinations of social/age groups and types of dwelling were addressed. The estimates of dose from external exposure for all the 12 groups are presented in appendix C. Statistical data from the 2008 Housing and Land Survey of Japan [MIC, 2012a] indicates that the majority of the population of Fukushima Prefecture (80%) and neighbouring prefectures resided in wooden or wooden fireproof one-to-two-storey houses.
32. For the purposes of this assessment, the doses received over the first year (March 2011–March 2012), the first ten years (2011–2021) and a lifetime (up to age 80 years) following the accident were estimated. That means that as of 2011, the time integration of the dose rate for one-year-old infants, was done, respectively, for one year, 10 years and 79 years; for 10-year-old children, for one year, 10 years and 70 years; and for 20-year-old adults, for one year, 10 years and 60 years, following the accident.
33. The growth of both one-year-old infants and 10-year-old children was taken into account in the assessment of doses integrated over the first 10 years and over the lifetime following the accident. The same dose coefficients for the group of one-year-old infants was considered to apply over the first five years of life (i.e. to preschool children, aged 0–5 years); from 15 March 2016, the dose coefficients for 10-year-old children were applied for the next 10 years (i.e. to school-age children, aged 6–15 years) and from 15 March 2026, the dose coefficients for adults were applied (i.e. from age 16 years over the remainder of life). A similar approach was applied to children aged 10 years as of 2011 (i.e. the dose coefficients for 10-year-old children were applied over the next five years and from 15 March 2016, the dose coefficients for adults were applied).
3. Evacuation of the public
34. The methodology for the assessment of doses from external exposure and inhalation of radionuclides did not account for any reduction in dose that may have resulted from the evacuation of residents in the Japanese spring of 2011 from the affected and potentially affected areas of Fukushima Prefecture to less affected areas. In fact, the Government of Japan ordered the evacuation of people, as a precautionary measure, from the area of the anticipated radionuclide contamination (20 km around FDNPS). This evacuation took place from 12 to 15 March 2011 [NERHQ, 2011]. Thus, the residents of the whole of the towns of Futaba, Okuma, Tomioka, Naraha and Hirono, and Kawauchi Village and also some residents of the cities of Minamisoma and Tamura, Namie Town and Katsurao Village located partially within the

ATTACHMENT C-12: METHODOLOGY FOR THE ASSESSMENT OF DOSE FROM EXTERNAL EXPOSURE AND INHALATION ... 11
20-km area were not present in the most affected areas when the major radionuclide releases occurred.
35. Following the major radionuclide releases that resulted in substantial deposition to the north-west of FDNPS, additional “deliberate evacuation” was initiated by the Government of Japan on the basis of the environmental measurements. The residents of the whole of Iitate Village and numbers of residents of Namie City, Kawamata Town and Katsurao Village were evacuated between March and June 2011. Thus, the residents of those localities were mostly exposed to elevated levels of radiation until evacuation took place.
36. Therefore, in the general tables, doses to the residents of the nine totally evacuated localities are not presented. For the three partially evacuated localities (the cities of Minamisoma and Tamura, and Kawamata Village), doses were calculated only for those residents who stayed in those localities following the major radionuclide releases (see table 11). Use was made of any radiation measurements in the non-evacuated parts of these latter localities when they were available.
37. The doses received by the residents of the evacuated localities or parts of such localities before and during the evacuation were assessed using the results of a survey conducted within Fukushima Prefecture to ascertain their activities, notably their spatial and temporal distribution during this period. A questionnaire was issued to all residents of Fukushima Prefecture (~2 million people) and completed questionnaires were received from approximately 21% of the population. This survey was used by the National Institute of Radiological Sciences (NIRS) to define 18 scenarios representative of the movements of these residents following the accident [Akahane et al., 2013] (see table 11). All estimations of dose in the first year to the evacuees for the 18 scenarios covered the period up to and including the final evacuation.
38. The estimated doses to the evacuees for the 18 scenarios were obtained mostly using the estimated source term and output of ATDM (three-hourly time-integrated activity concentrations in air and cumulative deposition densities on a grid of 5-km squares, see section I). Where a public place (e.g. town office or community centre) had been identified and the associated coordinates had been provided, the four grid-points bounding the place were considered and the environmental concentrations interpolated using an inverse distance-weighted approach. Where a public place had not been identified, a location was derived on the basis of the information provided in [Akahane et al., 2013]. The average activity concentrations in air for each three-hour period were converted to time-integrated activity concentrations in air and summed over the time the residents were assumed to have remained at each location (for the period from 03:00 JST on 12 March to 09:00 JST on 1 April 2011). Where the temporal movements of the residents were not aligned with the 3-hourly environmental concentrations, the fraction of time the residents remained at the location within that three-hour period was estimated and the environmental concentration was weighted by this fraction.
39. The dose per unit deposition density was applied to the mean of the total deposition density of radionuclides at the start and at the end of each 3-hour period within the period from 03:00 JST on 12 March to 09:00 JST on 3 April 2011. After 3 April 2011, it was assumed that no further deposition occurred. For individuals exposed after this time, the total deposition density at 09:00 JST on 3 April 2011 was used, and account was taken of radioactive decay and vertical migration of radionuclides in soil.
40. Where the population in a specific scenario moved between two locations, the dose received was assumed to be the average of the doses received at the locations of departure and
ATTACHMENT C-12: METHODOLOGY FOR THE ASSESSMENT OF DOSE FROM EXTERNAL EXPOSURE AND INHALATION ... 12
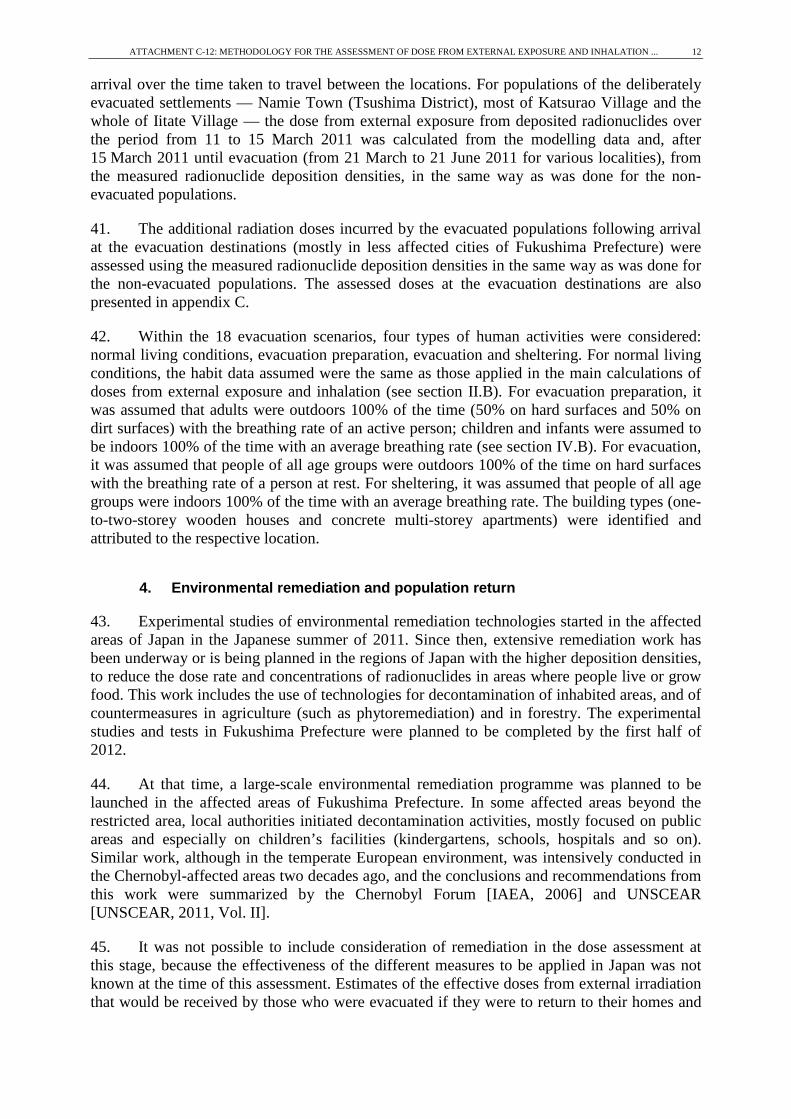
arrival over the time taken to travel between the locations. For populations of the deliberately evacuated settlements — Namie Town (Tsushima District), most of Katsurao Village and the whole of Iitate Village — the dose from external exposure from deposited radionuclides over the period from 11 to 15 March 2011 was calculated from the modelling data and, after 15 March 2011 until evacuation (from 21 March to 21 June 2011 for various localities), from the measured radionuclide deposition densities, in the same way as was done for the non-evacuated populations.
41. The additional radiation doses incurred by the evacuated populations following arrival at the evacuation destinations (mostly in less affected cities of Fukushima Prefecture) were assessed using the measured radionuclide deposition densities in the same way as was done for the non-evacuated populations. The assessed doses at the evacuation destinations are also presented in appendix C.
42. Within the 18 evacuation scenarios, four types of human activities were considered: normal living conditions, evacuation preparation, evacuation and sheltering. For normal living conditions, the habit data assumed were the same as those applied in the main calculations of doses from external exposure and inhalation (see section II.B). For evacuation preparation, it was assumed that adults were outdoors 100% of the time (50% on hard surfaces and 50% on dirt surfaces) with the breathing rate of an active person; children and infants were assumed to be indoors 100% of the time with an average breathing rate (see section IV.B). For evacuation, it was assumed that people of all age groups were outdoors 100% of the time on hard surfaces with the breathing rate of a person at rest. For sheltering, it was assumed that people of all age groups were indoors 100% of the time with an average breathing rate. The building types (one-to-two-storey wooden houses and concrete multi-storey apartments) were identified and attributed to the respective location.
4. Environmental remediation and population return
43. Experimental studies of environmental remediation technologies started in the affected areas of Japan in the Japanese summer of 2011. Since then, extensive remediation work has been underway or is being planned in the regions of Japan with the higher deposition densities, to reduce the dose rate and concentrations of radionuclides in areas where people live or grow food. This work includes the use of technologies for decontamination of inhabited areas, and of countermeasures in agriculture (such as phytoremediation) and in forestry. The experimental studies and tests in Fukushima Prefecture were planned to be completed by the first half of 2012.
44. At that time, a large-scale environmental remediation programme was planned to be launched in the affected areas of Fukushima Prefecture. In some affected areas beyond the restricted area, local authorities initiated decontamination activities, mostly focused on public areas and especially on children’s facilities (kindergartens, schools, hospitals and so on). Similar work, although in the temperate European environment, was intensively conducted in the Chernobyl-affected areas two decades ago, and the conclusions and recommendations from this work were summarized by the Chernobyl Forum [IAEA, 2006] and UNSCEAR [UNSCEAR, 2011, Vol. II].
45. It was not possible to include consideration of remediation in the dose assessment at this stage, because the effectiveness of the different measures to be applied in Japan was not known at the time of this assessment. Estimates of the effective doses from external irradiation that would be received by those who were evacuated if they were to return to their homes and
ATTACHMENT C-12: METHODOLOGY FOR THE ASSESSMENT OF DOSE FROM EXTERNAL EXPOSURE AND INHALATION ... 13
regular lifestyles without any environmental remediation having been implemented are however shown in table C19 of appendix C. These estimates provide an upper bound to the doses that might be received in the future.
B. Model parameters and assumptions
1. Dose- and kerma-rate conversion coefficients for deposited radionuclides and attenuation of radiation
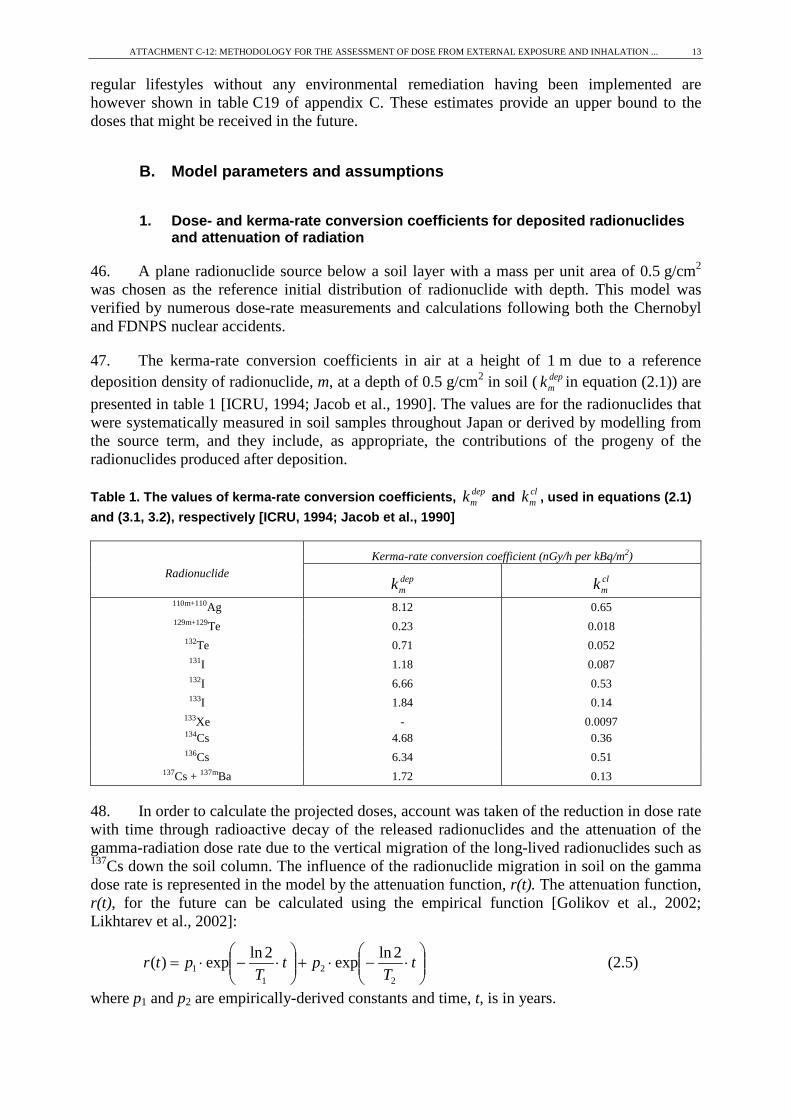
46. A plane radionuclide source below a soil layer with a mass per unit area of 0.5 g/cm2 was chosen as the reference initial distribution of radionuclide with depth. This model was verified by numerous dose-rate measurements and calculations following both the Chernobyl and FDNPS nuclear accidents.
47. The kerma-rate conversion coefficients in air at a height of 1 m due to a reference deposition density of radionuclide, m, at a depth of 0.5 g/cm2 in soil ( dep
mk in equation (2.1)) are presented in table 1 [ICRU, 1994; Jacob et al., 1990]. The values are for the radionuclides that were systematically measured in soil samples throughout Japan or derived by modelling from the source term, and they include, as appropriate, the contributions of the progeny of the radionuclides produced after deposition.
Table 1. The values of kerma-rate conversion coefficients, depmk and cl
mk , used in equations (2.1) and (3.1, 3.2), respectively [ICRU, 1994; Jacob et al., 1990]
Radionuclide Kerma-rate conversion coefficient (nGy/h per kBq/m2)
depmk
clmk
110m+110Ag 8.12 0.65 129m+129Te 0.23 0.018
132Te 0.71 0.052 131I 1.18 0.087 132I 6.66 0.53 133I 1.84 0.14
133Xe
134Cs -
4.68 0.0097
0.36 136Cs 6.34 0.51
137Cs + 137mBa 1.72 0.13
48. In order to calculate the projected doses, account was taken of the reduction in dose rate with time through radioactive decay of the released radionuclides and the attenuation of the gamma-radiation dose rate due to the vertical migration of the long-lived radionuclides such as 137Cs down the soil column. The influence of the radionuclide migration in soil on the gamma dose rate is represented in the model by the attenuation function, r(t). The attenuation function, r(t), for the future can be calculated using the empirical function [Golikov et al., 2002; Likhtarev et al., 2002]:
⋅−⋅+
⋅−⋅= t
Tpt
Tptr
22
11
2lnexp2lnexp)( (2.5)
where p1 and p2 are empirically-derived constants and time, t, is in years.

ATTACHMENT C-12: METHODOLOGY FOR THE ASSESSMENT OF DOSE FROM EXTERNAL EXPOSURE AND INHALATION ... 14
49. The parameters of this function were determined from gamma-spectrometric analyses of over 400 soil samples taken between 1986 and 2003 in areas of Germany (Bavaria), the Russian Federation, Sweden and Ukraine after the Chernobyl accident [Golikov et al., 2002; Jacob, 1996; Likhtarev et al., 2002]. On the basis of these data and the fact that the long-term exposure of the public following the FDNPS accident is caused by the same volatile radionuclides, 134Cs and 137Cs, as was the case in areas distant from the Chernobyl accident, the Committee decided to use for Japan the same function and parameters: p1 = 0.5; p2 = 0.5; T1 = 1.5 years; and T2 = 50 years.
50. For the areas of Japan with deposited radionuclides, this region-specific assessment is still to be done. The influence of the migration of 137Cs in soil on the absorbed dose rate in air is shown in figure I.
Figure I. The influence of the migration of radiocaesium in soil on absorbed dose rate in air for an initial deposition density of 137Cs of 1 MBq/m2
The isotopic composition of radiocaesium was taken from [IRSN, 2011]
10 30 50 70 90 110
Time, years
0.50
1.50
2.503.504.505.50
Dos
e ra
te in
air
, µG
y/h
without migration with migration
2. Location factors for Japan
51. Location factors for typical western-European buildings have been determined by both calculation [Jacob et al., 1987a; Meckbach et al., 1988] and gamma-spectrometric measurement [Andersson et al., 1995; Jacob et al., 2000; Jacob et al., 1987b]. Following the Chernobyl accident, the location factors in urban environments and their variation with time were determined for western Europe, the Russian Federation [Golikov et al., 1999; Golikov et al., 2002] and Ukraine [Likhtarev et al., 2002].
52. As specific location factors for Japanese settlements were lacking, the Committee decided to use those from the European experience for the following locations: indoors (inside houses, offices and other buildings) and outdoors (in paved and unpaved environments). Buildings were divided into three types, account being taken of Japanese national statistics:

ATTACHMENT C-12: METHODOLOGY FOR THE ASSESSMENT OF DOSE FROM EXTERNAL EXPOSURE AND INHALATION ... 15
wooden one-to-three-storey houses, wooden fireproof one-to-three-storey houses and concrete multi-storey apartments with the initial values of location factors 0.4, 0.2 and 0.1, respectively [MIC, 2012b]. The time dependence of the outdoor and indoor location factors based on post-Chernobyl studies [Golikov et al., 1999; Jacob et al., 1987b] were obtained as follows (time, t, is in years):
(a) For paved surfaces (asphalt, concrete, etc.):
1.0)9.0
2lnexp(50.0 +⋅
−⋅=tfhard (2.6)
(b) For unpaved surfaces (lawn, meadow, etc.):
25.0)2.2
2lnexp(50.0 +⋅
−⋅=tfdirt (2.7)
(c) For buildings:
212lnexp aT
tafbuild +
⋅−⋅= (2.8)
Table 2. Parameter values used in equation (2.8)
Type of building Parameter
a1 (dimensionless)
a2 (dimensionless)
T (years)
Wooden one-to-three-storey house 0.2 0.2 1.8 Wooden fireproof one-to-three-storey house 0.1 0.1 1.8 Concrete multi-storey buildings 0.05 0.05 1.8
3. Occupancy factors for Japan
53. The occupancy factors, pij—the fraction of time spent by the representative persons of the different population groups, i, in the various location types, j—were derived from the national survey data for Japan from the official web site [MIC, 2012b]. The results are presented in table 3.
Table 3. Occupancy factors, pij, for Japan
Type of location, j Occupancy factor, pij (dimensionless)
1-year old 10-year old Outdoor worker Indoor worker or pensioner
Indoors 0.80 0.85 0.70 0.90 Outdoors
Paved environment 0.10 0.05 0.20 0.05 Unpaved environment 0.10 0.10 0.10 0.05
Total 0.20 0.15 0.30 0.10
54. The occupancy factors presented in table 3 in combination with the location factors presented in the previous subsection, including table 2 for buildings, were used for the characterization of the 12 social/age groups and types of dwelling. However, only the data for two typical population groups — adults living in wooden houses and working indoors and infants living in wooden houses — are presented. The choice of these two population groups was based on statistical data that indicated that the majority of the population of Fukushima
ATTACHMENT C-12: METHODOLOGY FOR THE ASSESSMENT OF DOSE FROM EXTERNAL EXPOSURE AND INHALATION ... 16
Prefecture and neighbouring prefectures reside in wooden or wooden fireproof one-to-two-storey houses [MIC, 2012b] in particular, typical adults were estimated to spend 0.6 of their time in wooden one-to-two-storey houses and 0.3 of their time at work in concrete multi-storey buildings. Typical preschool children were estimated to spend all of their time indoors in wooden houses.
4. Dose conversion coefficients
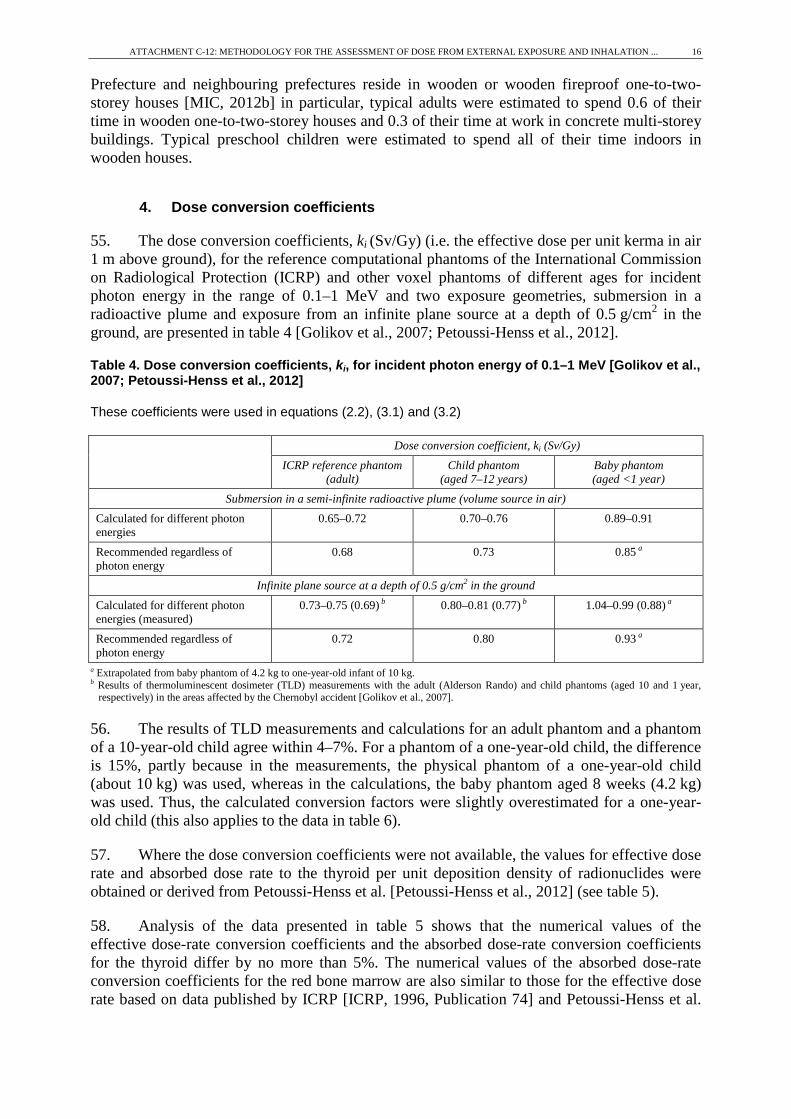
55. The dose conversion coefficients, ki (Sv/Gy) (i.e. the effective dose per unit kerma in air 1 m above ground), for the reference computational phantoms of the International Commission on Radiological Protection (ICRP) and other voxel phantoms of different ages for incident photon energy in the range of 0.1–1 MeV and two exposure geometries, submersion in a radioactive plume and exposure from an infinite plane source at a depth of 0.5 g/cm2 in the ground, are presented in table 4 [Golikov et al., 2007; Petoussi-Henss et al., 2012].
Table 4. Dose conversion coefficients, ki, for incident photon energy of 0.1–1 MeV [Golikov et al., 2007; Petoussi-Henss et al., 2012]
These coefficients were used in equations (2.2), (3.1) and (3.2)
Dose conversion coefficient, ki (Sv/Gy) ICRP reference phantom
(adult) Child phantom
(aged 7–12 years) Baby phantom (aged <1 year)
Submersion in a semi-infinite radioactive plume (volume source in air) Calculated for different photon energies
0.65–0.72 0.70–0.76 0.89–0.91
Recommended regardless of photon energy
0.68 0.73 0.85 a
Infinite plane source at a depth of 0.5 g/cm2 in the ground Calculated for different photon energies (measured)
0.73–0.75 (0.69) b 0.80–0.81 (0.77) b 1.04–0.99 (0.88) a
Recommended regardless of photon energy
0.72 0.80 0.93 a
a Extrapolated from baby phantom of 4.2 kg to one-year-old infant of 10 kg. b Results of thermoluminescent dosimeter (TLD) measurements with the adult (Alderson Rando) and child phantoms (aged 10 and 1 year,
respectively) in the areas affected by the Chernobyl accident [Golikov et al., 2007].
56. The results of TLD measurements and calculations for an adult phantom and a phantom of a 10-year-old child agree within 4–7%. For a phantom of a one-year-old child, the difference is 15%, partly because in the measurements, the physical phantom of a one-year-old child (about 10 kg) was used, whereas in the calculations, the baby phantom aged 8 weeks (4.2 kg) was used. Thus, the calculated conversion factors were slightly overestimated for a one-year-old child (this also applies to the data in table 6).
57. Where the dose conversion coefficients were not available, the values for effective dose rate and absorbed dose rate to the thyroid per unit deposition density of radionuclides were obtained or derived from Petoussi-Henss et al. [Petoussi-Henss et al., 2012] (see table 5).
58. Analysis of the data presented in table 5 shows that the numerical values of the effective dose-rate conversion coefficients and the absorbed dose-rate conversion coefficients for the thyroid differ by no more than 5%. The numerical values of the absorbed dose-rate conversion coefficients for the red bone marrow are also similar to those for the effective dose rate based on data published by ICRP [ICRP, 1996, Publication 74] and Petoussi-Henss et al.

ATTACHMENT C-12: METHODOLOGY FOR THE ASSESSMENT OF DOSE FROM EXTERNAL EXPOSURE AND INHALATION ... 17
[Petoussi-Henss et al., 2012]. Therefore, only the effective dose-rate conversion coefficients were used in the assessment. The absorbed dose-rate conversion coefficients for the breast are numerically 5–10% larger than the effective dose-rate conversion coefficients.
Table 5. Effective dose-rate conversion coefficients, depime , , and absorbed dose-rate conversion
coefficients for the thyroid, depthimh ,, , for photon exposure from an infinite plane source at a depth
of 0.5 g/cm2 in the ground [Petoussi-Henss et al., 2012]
These were used in equation (2.3)
Radionuclide Effective dose-rate conversion coefficient (nSv/h per kBq/m2)
Absorbed dose-rate conversion coefficient for the thyroid (nGy/h per kBq/m2)
1-year old a 10-year old Adults 1-year old a 10-year old Adults 110m+110Ag 8.04 6.48 6.07 8.10 6.35 6.25 129m+129Te 0.21 0.16 0.15 0.24 0.18 0.18 132Te 0.66 0.51 0.47 0.67 0.50 0.50 131I 1.17 0.92 0.85 1.17 0.90 0.89 132I 6.67 5.35 5.00 6.65 5.19 5.10 133I 1.84 1.47 1.37 1.85 1.43 1.40 134Cs 4.63 3.7 3.46 4.62 3.60 3.53 136Cs 6.20 4.99 4.67 6.17 4.83 4.75 137Cs + 137mBa 1.69 1.34 1.25 1.69 1.31 1.29
a In order to interpolate from baby phantom of 4.2 kg to a one-year-old infant of 10 kg, the conversion coefficients presented in the column should be multiplied by 0.93.
III. METHODOLOGY FOR ESTIMATION OF DOSE FROM EXTERNAL EXPOSURE FROM RADIOACTIVE PLUMES
59. External radiation exposures from radionuclides in the air are particularly important for releases of noble gases which do not deposit on the ground and for which the doses from inhalation are negligible. Other radionuclides also contribute to such exposures. Insufficient measurements of dose rates and activity concentrations of radionuclides in air were available for the estimation of dose received over the first few days after the start of the release. The concentrations in air were therefore obtained from the results of ATDM. Those data were used either directly or in combination with the data on deposition density of radionuclides. A semi-infinite cloud modelling approach was used to estimate the doses from external exposure from the time-integrated activity concentrations in the air.
A. Computational model
60. Two approaches were used to calculate the effective dose from external exposure from the radioactive plume, cl
iE , to the representative person of population group, i. In the first case, the effective dose during the passage of the radioactive plume was estimated on the basis of measured or modelled radionuclide concentrations in the surface air:
(mSv) )(10 6 dttCkRFkEm T
airm
clm
clii
cli
cl
⋅⋅⋅⋅⋅= ∑ ∫− (3.1)

ATTACHMENT C-12: METHODOLOGY FOR THE ASSESSMENT OF DOSE FROM EXTERNAL EXPOSURE AND INHALATION ... 18
where ki is the dose conversion coefficient from air kerma to effective dose for exposure from radionuclides in an infinite cloud (Sv/Gy); cl
iRF is the aggregated dose reduction factor for exposure from radionuclides in an infinite to that in a semi-infinite cloud (dimensionless); cl
mk is the kerma-rate conversion coefficient for a semi-infinite volume source in air, that is, the ratio of the kerma rate in free air at a height of 1 m above the ground to the uniform activity concentration of radionuclide, m, in air (nGy/h per Bq/m3); Tcl is the time duration of human exposure from the passage of a radioactive plume over a site of interest (h); and )(tC air
m is the time-dependent activity concentration of radionuclide, m, in surface air (Bq/m3).
61. This approach was applied for both the precautionary and deliberately evacuated settlements of Fukushima Prefecture.
62. In the second case, when measurements of radionuclide concentrations in air were lacking, the effective dose, cl
iE , was calculated from measurements of the deposition density of radionuclides as follows:
(mSv) )/(108.2 137137
10 clm
m m
CsmcliiCs
cli k
VAARFkAE ⋅⋅⋅⋅⋅⋅= ∑− (3.2)
where Am is the deposition density of radionuclide, m, on the ground (kBq/m2); Vm is the aggregated deposition velocity of radionuclide, m, for particular weather and surface conditions (m/s); and the other symbols are the same as above.
63. The aggregated deposition velocities were estimated from the ATDM results for the radionuclides in the plume and deposited on the ground as a function of time and location within Fukushima Prefecture; in other prefectures, average values for the deposition velocities were used. The aggregated deposition velocities applied were based on the ratios of the estimated time-integrated activity concentrations in air to the deposition densities of the radionuclides. This approach was applied to non-evacuated settlements of Fukushima Prefecture and the rest of Japan.
64. As in subsection II.A.1, both equations (3.1) and (3.2) were converted into a format where the dose-rate conversion coefficients from activity concentration in surface air or deposition density of the radionuclides to effective dose rate for the representative person of population group, i, were used:
(mSv) )(10 ,6 dttCeRFE
m T
airm
clim
cli
cli
cl
⋅⋅⋅⋅= ∑ ∫− (3.3)
(mSv) )/(108.2 ,137
13710 cl
imm m
CsmcliCs
cli e
VAARFAE ⋅⋅⋅⋅= ∑− (3.4)
where clmi
clim kke ⋅=, is the effective dose-rate conversion coefficient for a semi-infinite volume
source in air equal to the ratio of the effective dose rate for the representative person of population group, i, to the uniform activity concentration of radionuclide, m, in air (nGy/h per Bq/m3) (see table 6); other terms are as defined as above.

ATTACHMENT C-12: METHODOLOGY FOR THE ASSESSMENT OF DOSE FROM EXTERNAL EXPOSURE AND INHALATION ... 19
Table 6. Effective dose-rate conversion coefficients, clime , , and absorbed dose-rate conversion
coefficients for the thyroid, clthimh ,, , for photon exposure from submersion in a radioactive plume
[Petoussi-Henss et al., 2012]
These were used in equations (3.3) and (3.4)
Radionuclide Effective dose-rate conversion coefficient (nSv/h per Bq/m3)
Absorbed dose-rate conversion coefficient for the thyroid (nGy/h per Bq/m3)
1-year old a 10-year old Adults 1-year old a 10-year old Adults 129m+129Te 0.0144 0.0122 0.0111 0.0142 0.0137 0.0133 132Te 0.043 0.034 0.032 0.043 0.038 0.039 131I 0.0774 0.0638 0.0598 0.0774 0.0689 0.0711 132I 0.48 0.4 0.38 0.48 0.42 0.44 133I 0.128 0.106 0.100 0.126 0.113 0.117 133Xe 0.00677 0.00477 0.00435 0.00699 0.00538 0.00638 134Cs 0.328 0.272 0.257 0.328 0.289 0.299 136Cs 0.453 0.376 0.356 0.460 0.400 0.413 137Cs + 137mBa 0.118 0.097 0.092 0.117 0.104 0.108
a In order to extrapolate from baby phantom of 4.2 kg to a one-year-old infant of 10 kg, the conversion coefficients presented in that column should be multiplied by 0.94.
65. The durations of the passage of the radioactive plumes were relatively short (a few hours) and the contribution to dose from external exposure from the plumes was relatively minor compared with that from deposited radionuclides. The Committee therefore decided to use a value of cl
iRF equal to 1. This is a somewhat conservative assumption because it does not account for any shielding provided by buildings and the plumes are assumed to be semi-infinite in size.
66. Implicit in this approach is the assumption that the activity concentrations of radionuclides in air were uniform over the volume of a plume from which photons can reach the point at which the dose was delivered. The Committee considered this assumption to be reasonable because the assessment considered only the population groups that resided beyond a few kilometres from the release point or were evacuated to larger distances before the major releases started.
B. Model parameters
67. The kerma-rate conversion coefficients, clmk , for a semi-infinite volume source of
radionuclide, m, in air (nGy/h per Bq/m3) are given in table 1 for the gamma-emitting radionuclides that were detected in soil samples during June–July 2011 as partially seen in attachments C-1 to C-4 and for some additional radionuclides used in ATDM (see table 10).
68. The values of the absorbed dose-rate conversion coefficient for the red bone marrow were extracted from Petoussi-Henss et al. [Petoussi-Henss et al., 2012] for the respective radionuclides and used for the assessment of doses to the red bone marrow from a semi-infinite volume source of radionuclides in air.

ATTACHMENT C-12: METHODOLOGY FOR THE ASSESSMENT OF DOSE FROM EXTERNAL EXPOSURE AND INHALATION ... 20
IV. METHODOLOGY FOR ESTIMATION OF DOSE FROM INHALATION
69. The assessment of dose from the inhalation of radionuclides in air was based on the concentrations of radionuclides in air obtained from ATDM, either directly or in combination with the data on the deposition density of radionuclides, the age-dependent breathing rates and the appropriate dose conversion coefficients (i.e. the radiation dose that results from breathing in a unit amount of a radionuclide).
A. Computational model
70. Two methods of dose assessment were applied. The first method was based solely on the ATDM results for the time-dependent activity concentrations in air of a number of radionuclides, 132Te, 131I, 132I, 133I, 133Xe, 134Cs, 136Cs and 137Cs, which were available on a grid of 5-km squares covering the whole of Japan and the neighbouring countries. The ATDM results were based on the best available data on the source term and used models that included detailed information on the meteorological conditions that prevailed at the time. Nevertheless, significant uncertainties are associated with the ATDM results at specific locations and times. This approach was applied for the evacuated settlements of Fukushima Prefecture.
71. The second method was based on the estimated time-integrated activity concentrations in air derived from the measured deposition densities of radionuclides and the aggregated deposition velocities, estimated from the ATDM results as a function of time and location within Fukushima Prefecture; in other prefectures, average values for the deposition velocities were used. The aggregated deposition velocities applied were based on the ratios of the estimates of the time-integrated activity concentration in air to the deposition density of radionuclides. This approach was applied to non-evacuated settlements of Fukushima Prefecture and the rest of Japan.
72. The generic equation used for the assessment of the committed effective dose, inhiE , to
the representative person in population group, i, from the inhalation of airborne radionuclides is as follows:
(mSv) )(10 ,6 dttCkeRFE
m T
airmm
inhmi
inhii
inhi
cl
⋅⋅⋅⋅⋅⋅= ∑ ∫− ν (4.1)
where νi is age-dependent breathing rate (m3/s); inhiRF is the inhalation reduction factor for
staying indoors (dimensionless); inhmie , is the dose conversion coefficient to assess the committed
effective dose to the representative person of population group, i, from the inhalation of radionuclide, m, under reference conditions (default particle size of 1 μm and typical absorption type [ICRP, 1995, Publication 71]) (nSv/Bq); km is the factor accounting for particle size and absorption type for radionuclide, m, that are different from those assumed under reference conditions (dimensionless); Tcl is the time duration of inhalation from a radioactive plume passing over a site of interest (h); and )(tC air
m is the time-dependent activity concentration of radionuclide, m, in surface air (Bq/m3).
73. When the activity concentrations of key radionuclides in surface air were not available, the assessment of dose from inhalation was based on the available deposition densities of radionuclides as follows:
ATTACHMENT C-12: METHODOLOGY FOR THE ASSESSMENT OF DOSE FROM EXTERNAL EXPOSURE AND INHALATION ... 21
(mSv) )/(10 ,137
1373
minh
mim m
CsmCs
inhii
inhi ke
VAAARFE ⋅⋅⋅⋅⋅⋅= ∑− ν (4.2)
where Am is the deposition density of radionuclide, m, on the ground (kBq/m2); Vm is the aggregated deposition velocity of radionuclide, m, for particular weather and surface conditions (m/s); the other symbols are as defined above.
74. The values of the dose conversion coefficients, inhmie , , for inhalation were taken from
ICRP [ICRP, 1995, Publication 71]. These were based on generic anatomical and physiological human data for a reference person as defined by ICRP, and as such are not intended to be specific to inhabitants of any specific region. The use of these dose conversion coefficients may have resulted in some overestimation of absorbed doses to the thyroid for Japanese individuals because the high iodine content of the Japanese diet (e.g. from sea fish, shellfish and seaweed) may have reduced the uptake of radioiodine by the thyroid [Zava et al., 2011]. Further consideration of the anatomical and physiological characteristics of Asian people (see, for example [IAEA, 1998; IAEA, 2008]) and the implications for the doses estimated in this study, are considered in section IV of appendix C.
75. Values of age-dependent breathing rates, νj, were taken from ICRP [ICRP, 1994, Publication 66]. The inhalation rates applied are the average rates over a day from the ICRP model of the respiratory tract and include time spent sleeping, at home and at work, and hence they are suitable for someone exposed for 24 hours a day. For time spent at work, the inhalation rate is modelled on the male sedentary worker and male heavy worker. The ICRP dose coefficients for inhalation, based on inhalation rates for males, [ICRP, 1996, Publication 72], were used in the assessment of doses to adults.
76. The estimates of the deposition density of radionuclides were based on measurements whenever they were available. Such data were available for 134Cs and 137Cs for each settlement. If, for a particular settlement, data on 131I were available, their values were used directly. For 129mTe and 132Te/132I, missing values were obtained from the ratio of the deposition densities of the respective radionuclide to that of 137Cs (see table 9). For the short-lived radionuclide, 133I, the activity concentration in air was estimated directly from the calculated concentration of 131I in air by applying the radionuclide ratio derived from ATDM.
77. In the absence of specific information, the default particle size and absorption types specified by ICRP [ICRP, 1995, Publication 71] were assumed, that is, km was taken as one. Similarly, inh
iRF was also assigned a value of one, because infiltrating gaseous radionuclides were assumed to have dominated the exposure of the representative individual.
78. The values of aggregated deposition velocity, Vm, for radionuclide, m, were derived from the ATDM calculations based on the ratios of the estimates of the time-integrated activity concentration in air to the deposition density.
79. A similar approach was used for the assessment of the committed absorbed dose to the thyroid of the representative person in population group, i, from the inhalation of airborne radionuclides, inh
thiH , :
(mSv) )(10 ,,6
, dttCkhRFHm T
airmm
inhmith
inhii
inhthi
cl
⋅⋅⋅⋅⋅⋅= ∑ ∫− ν (4.3)
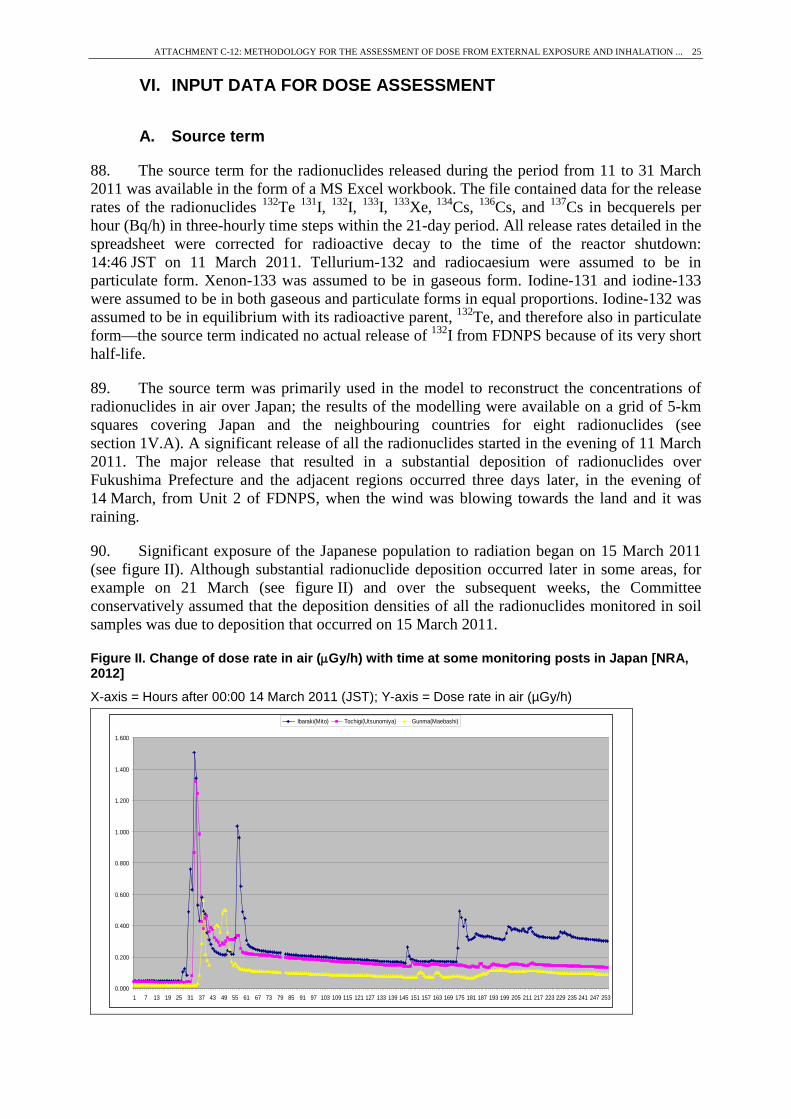
ATTACHMENT C-12: METHODOLOGY FOR THE ASSESSMENT OF DOSE FROM EXTERNAL EXPOSURE AND INHALATION ... 22
or (mSv) )/(10 ,,137
1373
, minh
mithm m
CsmCs
inhii
inhthi kh
VAAARFH ⋅⋅⋅⋅⋅⋅= ∑− ν (4.4)
where inhmithh ,, is the committed absorbed dose conversion coefficient for the thyroid of the
representative person in population group, i, due to inhalation of radionuclide, m, under reference conditions (default particle size of 1 μm and typical absorption type) (nSv/Bq); other terms are defined as above.
Similar equations were used for the assessment of doses to the red bone marrow and breast.
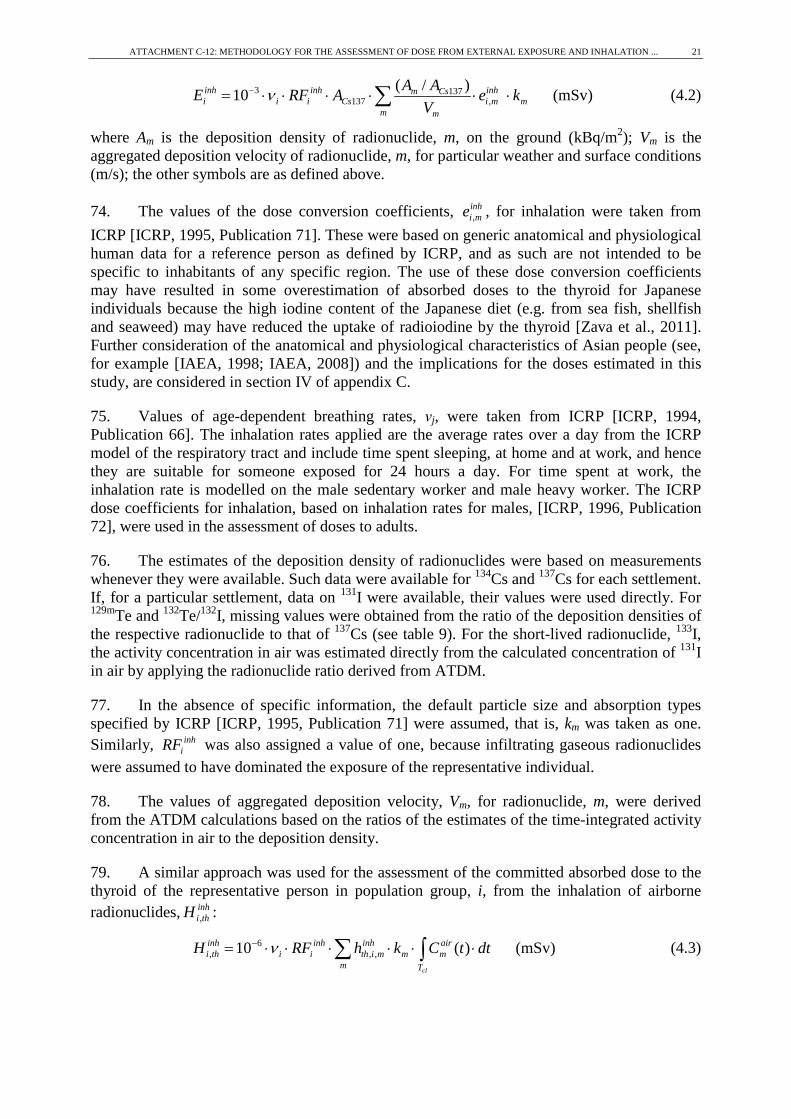
B. Model parameters
80. Breathing rates were considered as a function of age and occupation (for adults). Representative inhalation rates were derived from data given in ICRP publications [ICRP, 1994, Publication 66; ICRP, 1995, Publication 71]. These data were based on an assumed combination of activity, rest and sleep (see table 7).
Table 7. Breathing rates, νi, for adults, children and infants (averaged over a day) [ICRP, 1994, Publication 66]
These were used in equations (4.1) to (4.4)
Age group Inhalation rate (m3/s)
Adult (outdoor worker) 2.92 × 10⁻⁴ Adult (indoor worker or pensioner) 2.57 × 10⁻⁴ 10-year old 1.77 × 10⁻⁴ One-year old 6.02 × 10⁻⁵
81. The effective dose conversion coefficients and the absorbed dose conversion coefficients for the thyroid and red bone marrow from inhalation were taken or derived from ICRP publications [ICRP, 1995, Publication 71; ICRP, 1996, Publication 72] (see table 8). These take account of age, particle size (a default particle size of 1 µm was assumed), radionuclide (and for certain elements such as iodine, chemical form), absorption type (F, M, or S), organ/tissue and time-integration period. The numerical values of the absorbed dose conversion coefficients for the breast from inhalation of 134Cs and 137Cs are lower than those for the red bone marrow by a factor of about 0.8 (0.74 to 0.85 for different age groups) and 0.9 (0.86 to 0.93), respectively.

A
TTAC
HM
ENT C
-12: METH
OD
OLO
GY
FOR
THE A
SSESSMEN
T OF D
OSE FR
OM
EXTER
NA
L EXPO
SUR
E AN
D IN
HA
LATIO
N ...
23
Table 8. Committed dose coefficients for inhalation by members of the public [ICRP, 1996, Publication 72]
Dose conversion coefficients for effective dose, inh
mie , , and absorbed dose to organs, inh
mithh ,, , were used in equations (4.1) and (4.2), and (4.3) and (4.4), respectively
Radionuclide Radionuclide form
Lung absorption
type
Effective dose conversion coefficient (Sv/Bq)
Absorbed dose conversion coefficient for thyroid (Gy/Bq)
Absorbed dose conversion coefficient for red bone marrow (Gy/Bq)
Adults 10-year old 1-year old Adults 10-year old 1-year old Adults 10-year old 1-year old
129mTe Aerosol M 6.6 × 10⁻⁹ 9.8 × 10⁻⁹ 2.6 × 10⁻⁸ 1.0 × 10⁻⁹ 2.5 × 10⁻⁹ 1.2 × 10⁻⁸ 1.2 × 10⁻⁹ 2.8 × 10⁻⁹ 1.2 × 10⁻⁸
132Te Aerosol M 2.0 × 10⁻⁹ 4.0 × 10⁻⁹ 1.3 × 10⁻⁸ 4.3 × 10⁻⁹ 1.1 × 10⁻⁸ 5.3 × 10⁻⁸ 2.2 × 10⁻¹⁰ 3.6 × 10⁻¹⁰ 8.5 × 10⁻¹⁰
131I Vapour F 2.0 × 10⁻⁸ 4.8 × 10⁻⁸ 1.6 × 10⁻⁷ 3.9 × 10⁻⁷ 9.5 × 10⁻⁷ 3.2 × 10⁻⁶ 9.3 × 10⁻¹¹ 1.4 × 10⁻¹⁰ 3.4 × 10⁻¹⁰ Aerosol F 7.4 × 10⁻⁹ 1.9 × 10⁻⁸ 7.2 × 10⁻⁸ 1.5 × 10⁻⁷ 3.7 × 10⁻⁷ 1.4 × 10⁻⁶ 3.7 × 10⁻¹¹ 6.0 × 10⁻¹¹ 1.6 × 10⁻¹⁰
132I Aerosol F 9.4 × 10⁻¹¹ 2.2 × 10⁻¹⁰ 9.6 × 10⁻¹⁰ 1.4 × 10⁻⁹ 3.4 × 10⁻⁹ 1.6 × 10⁻⁸ 1.1 × 10⁻¹¹ 2.1 × 10⁻¹¹ 6.1 × 10⁻¹¹
133I Vapour F 4.0 × 10⁻⁹ 9.7 × 10⁻⁹ 4.1 × 10⁻⁸ 7.6 × 10⁻⁸ 1.9 × 10⁻⁷ 8.0 × 10⁻⁷ 4.4 × 10⁻¹¹ 8.0 × 10⁻¹¹ 2.3 × 10⁻¹⁰ Aerosol F 1.5 × 10⁻⁹ 3.8 × 10⁻⁹ 1.8 × 10⁻⁸ 2.8 × 10⁻⁸ 7.4 × 10⁻⁸ 3.5 × 10⁻⁷ 1.8 × 10⁻¹¹ 3.5 × 10⁻¹¹ 1.1 × 10⁻¹⁰
134Cs Aerosol F 6.6 × 10⁻⁹ 5.3 × 10⁻⁹ 7.3 × 10⁻⁹ 6.3 × 10⁻⁹ 5.1 × 10⁻⁹ 6.3 × 10⁻⁹ 6.3 × 10⁻⁹ 4.7 × 10⁻⁹ 5.2 × 10⁻⁹ 136Cs Aerosol F 1.2 × 10⁻⁹ 2.0 × 10⁻⁹ 5.2 × 10⁻⁹ 1.0 × 10⁻⁹ 1.6 × 10⁻⁹ 3.9 × 10⁻⁹ 9.8 × 10⁻¹⁰ 1.4 × 10⁻⁹ 3.2 × 10⁻⁹ 137Cs Aerosol F 4.6 × 10⁻⁹ 3.7 × 10⁻⁹ 5.4 × 10⁻⁹ 4.4 × 10⁻⁹ 3.5 × 10⁻⁹ 4.4 × 10⁻⁹ 4.4 × 10⁻⁹ 3.3 × 10⁻⁹ 4.0 × 10⁻⁹

ATTACHMENT C-12: METHODOLOGY FOR THE ASSESSMENT OF DOSE FROM EXTERNAL EXPOSURE AND INHALATION ... 24
V. ASSESSMENT OF COLLECTIVE DOSES
82. The collective dose to the general public provides an aggregated metric associated with the radiological detriment arising from an activity or event, in this case, the FDNPS accident. For comparison with other events associated with radionuclide releases to the environment (e.g. global fallout following the testing of nuclear weapons in the atmosphere, and the Chernobyl accident), the long-term collective dose commitment over decades has been previously assessed.
83. The Committee assessed both the collective effective dose and the collective absorbed dose to the thyroid. The collective absorbed dose to the thyroid in the first year following the accident was of particular interest because of the substantial release of radioiodine—the major contributor was the intake of 131I via inhalation and ingestion. The main contributors to the collective effective dose to the public are the long-term exposure pathways, that is, external exposure from 134Cs and 137Cs deposited on the ground and internal exposure from ingestion of the same radionuclides in foods.
84. The collective effective dose commitment and collective absorbed dose to the thyroid were assessed for the population residing in all localities of Fukushima Prefecture and other prefectures of Japan for the three age groups of the population (adults, 10-year-old children and one-year-old infants).
85. According to the recent Japan 2010 Census [MIC, 2011], the total population of Japan in 2010 was 128 million persons. Among them, 108.9 million persons, (85.1%) were aged 16 years and above, 11.7 million persons (9.1%) were in the age range of 6 to 15 years, and 7.4 million persons (5.8%) were in the age range of 0 to 5 years.
86. The collective doses were assessed for the following geographical areas: (a) Fukushima Prefecture (Groups 1 and 2 districts); (b) the six neighbouring or nearby prefectures (Group 3 prefectures, i.e. Iwate, Miyagi, Tochigi, Gunma, Ibaraki and Chiba); (c) the rest of Japan (Group 4 prefectures); and (d) the whole of Japan.
87. The collective dose (both effective and absorbed dose to the thyroid) from external exposure for a particular area depends on the population size and its distribution with respect to the deposition density of the radionuclides, dwelling type and occupancy factor. On the basis of national statistics for Japan, the Committee assumed that about 30% of the entire population of the country live in wooden one-to-three-storey houses, another 30% live in wooden fireproof one-to-three-storey houses and about 40% of the population live in concrete multi-storey apartments [MIC, 2012b]. Regarding occupancy factors for the adult population, the Committee assumed that about 10% were outdoor workers and about 90% were indoor workers including various industries, office workers, students and pensioners. The occupancy factors for preschool and school children are presented in table 3. The time integration to infinity of the appropriate external dose rate was made using the equations (2.1) to (2.4) presented in section II.
ATTACHMENT C-12: METHODOLOGY FOR THE ASSESSMENT OF DOSE FROM EXTERNAL EXPOSURE AND INHALATION ... 25
VI. INPUT DATA FOR DOSE ASSESSMENT
A. Source term
88. The source term for the radionuclides released during the period from 11 to 31 March 2011 was available in the form of a MS Excel workbook. The file contained data for the release rates of the radionuclides 132Te 131I, 132I, 133I, 133Xe, 134Cs, 136Cs, and 137Cs in becquerels per hour (Bq/h) in three-hourly time steps within the 21-day period. All release rates detailed in the spreadsheet were corrected for radioactive decay to the time of the reactor shutdown: 14:46 JST on 11 March 2011. Tellurium-132 and radiocaesium were assumed to be in particulate form. Xenon-133 was assumed to be in gaseous form. Iodine-131 and iodine-133 were assumed to be in both gaseous and particulate forms in equal proportions. Iodine-132 was assumed to be in equilibrium with its radioactive parent, 132Te, and therefore also in particulate form—the source term indicated no actual release of 132I from FDNPS because of its very short half-life.
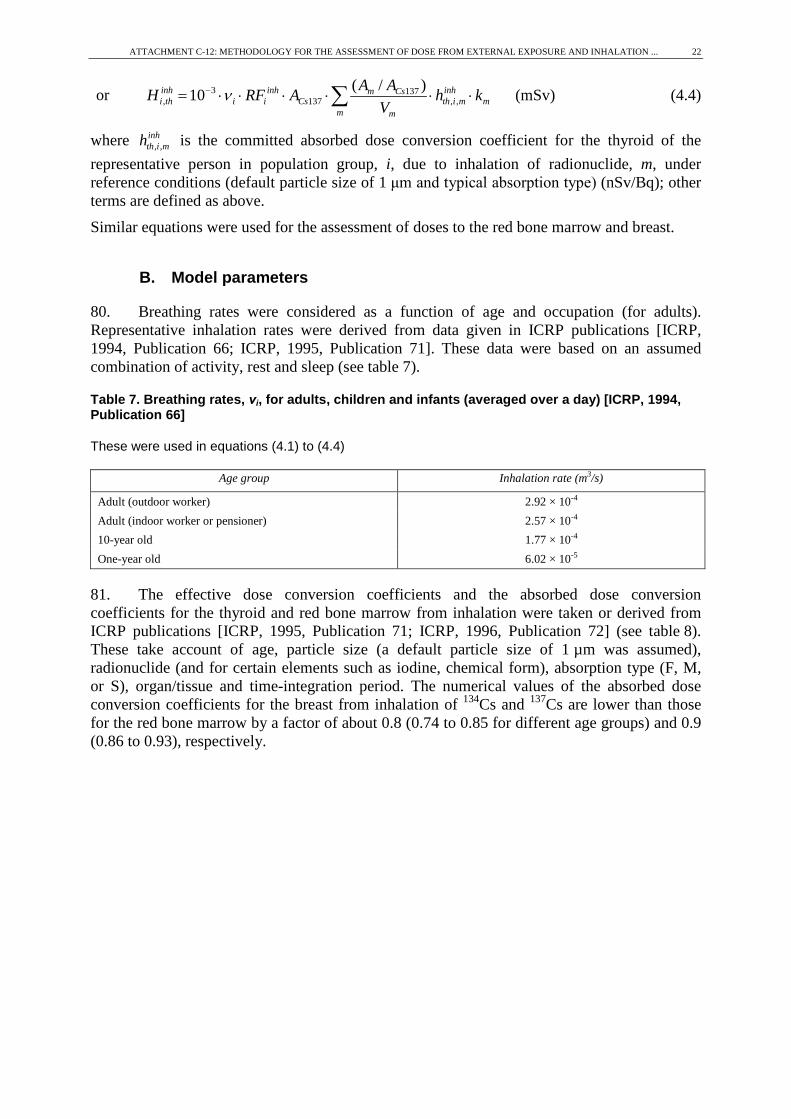
89. The source term was primarily used in the model to reconstruct the concentrations of radionuclides in air over Japan; the results of the modelling were available on a grid of 5-km squares covering Japan and the neighbouring countries for eight radionuclides (see section 1V.A). A significant release of all the radionuclides started in the evening of 11 March 2011. The major release that resulted in a substantial deposition of radionuclides over Fukushima Prefecture and the adjacent regions occurred three days later, in the evening of 14 March, from Unit 2 of FDNPS, when the wind was blowing towards the land and it was raining.
90. Significant exposure of the Japanese population to radiation began on 15 March 2011 (see figure II). Although substantial radionuclide deposition occurred later in some areas, for example on 21 March (see figure II) and over the subsequent weeks, the Committee conservatively assumed that the deposition densities of all the radionuclides monitored in soil samples was due to deposition that occurred on 15 March 2011.
Figure II. Change of dose rate in air (µGy/h) with time at some monitoring posts in Japan [NRA, 2012]
X-axis = Hours after 00:00 14 March 2011 (JST); Y-axis = Dose rate in air (µGy/h)
0.000
0.200
0.400
0.600
0.800
1.000
1.200
1.400
1.600
1 7 13 19 25 31 37 43 49 55 61 67 73 79 85 91 97 103 109 115 121 127 133 139 145 151 157 163 169 175 181 187 193 199 205 211 217 223 229 235 241 247 253
Ibaraki(Mito) Tochigi(Utsunomiya) Gunma(Maebashi)

ATTACHMENT C-12: METHODOLOGY FOR THE ASSESSMENT OF DOSE FROM EXTERNAL EXPOSURE AND INHALATION ... 26
B. Composition of deposited radionuclides
91. The systematic monitoring of the deposition density of radionuclides in the vicinity of FDNPS was conducted during June and July 2011 [MEXT, 2013]. Soil was sampled on the basis of a grid of 2-km squares up to a distance of 80 km from the source and of a grid of 10-km squares up to a distance of 100 km and all over Fukushima Prefecture — in total about 2,200 aggregated samples. The measurement results as provided in electronic form by the Government of Japan are tabulated in attachments C-1 (131I), C-2 (134Cs, 137Cs), C-3 (110mAg), C-4 (129mTe) and C-5 (strontium and plutonium isotopes).
92. Radiocaesium (134Cs and 137Cs) was detected in all the soil samples, 131I (half-life, 8.02 days) in 419 samples, 129mTe (half-life, 33.6 days) in 799 samples, and 110mAg (half-life, 250 days) in 343 samples.
93. The most long-lived and radiologically significant radionuclide, 137Cs, was chosen as the standard for area mapping. According to the analysis of all of the 2,200 soil samples, the average deposition density of 134Cs on 15 March 2011 was equal to that of 137Cs (see table 9).
94. The ratios of the deposition densities of radionuclides to those of 137Cs measured in numerous samples were used in the reconstruction of the deposition densities of 110mAg, 129mTe and 131I in the samples where these radionuclides had not been detected.
95. Figure III shows that the derived ratios of the deposition densities of 129mTe and 131I to that of 137Cs were significantly elevated (by an average of a factor of six to seven) in the narrow south trace along the coast within a distance of about 60 km from FDNPS compared to those for other areas of Japan [MEXT, 2013]. The data for the south trace were therefore treated differently, using linear regression methods, from the rest of the monitored area. The deposition densities of both 129mTe and 131I strongly correlated with those of 137Cs. The respective regression coefficients are given in table 9.
96. There was also a statistically significant correlation between the deposition density of 110mAg and that of 137Cs but the correlation coefficient was smaller than those for 129mTe and 131I. The correlation coefficient for 110mAg is given in table 9 and was used for the reconstruction of the deposition densities of this radionuclide. The unavoidable uncertainty with this did not substantially influence the dose estimates because the contribution of this radionuclide to external exposure was small (of the order of 0.1%).
97. Environmental measurement data have been published for various radioisotopes of one chemical element that were used in the reconstruction of the deposition densities of a short-lived radioisotope of that element. For example, the deposition densities of 132Te and 136Cs were reconstructed on the basis of the measurements of the deposition densities of 129mTe and 137Cs, respectively. From measurements on soil samples from various sites in Japan [Endo et al., 2012; Tagami et al., 2011] and air samples from Europe [Kirchner et al., 2012], the average isotopic ratio 136Cs/137Cs was estimated to be 0.17 on 15 March 2011 with a relatively low variability (see table 9). The calculated activities of these radioisotopes released from Unit 2 of FDNPS gave somewhat higher but still similar values, that is, 0.26 [Nishihara, 2012] and 0.25 [Kirchner et al., 2012]. The ratio 132Te/129mTe varied more substantially. It was estimated to be 9.1 ± 1.6 (n = 14) from measurements of soil samples in Japan [Endo et al., 2012] and 5.8 ± 0.1 (n = 14) from measurements of air samples collected over Europe [Kirchner et al., 2012]. The Committee used a rounded average of seven (see table 9), although the calculated activities of

ATTACHMENT C-12: METHODOLOGY FOR THE ASSESSMENT OF DOSE FROM EXTERNAL EXPOSURE AND INHALATION ... 27
these radioisotopes released from Unit 2 of FDNPS gave higher but diverse values, that is, 22 [Nishihara, 2012] and 13 [Kirchner et al., 2012].
Table 9. Ratios of the deposition densities of radionuclides to those of 137Cs as of 15 March 2011 [Endo et al., 2012; Kirchner et al., 2012; MEXT, 2013; Tagami et al., 2011]
Area Characteristic Radionuclide (half-life)
137Cs+137mBa (30.2 years)
134Cs (2.06 years)
136Cs (13.2 days)
131I (8.02 days)
129mTe (33.6 days)
132Te+132I (3.2 days)
110mAg (250 days)
All of Japan except for the south trace
Ratio to 137Cs 1.0 1.0 0.17 11.5 1.1 8 0.0028
Standard deviation (n)
0.074 (2181)
0.02 (56)
Correlation coefficient (n)
0.72 (339) 0.97 (689)
0.47 (343)
South trace a
Ratio to 137Cs 1.0 1.0 0.17 74 7.9 59 0.0028
Correlation coefficient (n)
0.89 (73) 0.85 (110)
a The towns of Tomioka, Naraha, Hirono and Iwaki of Fukushima Prefecture.
Figure III. Locations of measurements of the ratios of the deposition density of 129mTe to that of 137Cs in Fukushima Prefecture
Blue marks are for where the 129mTe/137Cs ratio was <5; red marks are for where the 129mTe/137Cs ratio was >5 [MEXT, 2012]

ATTACHMENT C-12: METHODOLOGY FOR THE ASSESSMENT OF DOSE FROM EXTERNAL EXPOSURE AND INHALATION ... 28
C. Data sets for the assessment of dose from external exposure from deposited radionuclides
1. Within 100 km of FDNPS and the entire Fukushima prefecture (Groups 1 and 2)
98. The results of the measurements of the deposition densities of radionuclides on soil were weighted according to the population density in each of the 59 settlements in Fukushima Prefecture and of the 33 settlements in the neighbouring prefectures—Yamagata (5 settlements), Tochigi (5 settlements), Ibaraki (5 settlements) and Miyagi (18 settlements). Measurement data obtained during the Japanese summer of 2011 were available for 134Cs and 137Cs for each settlement (2,200 soil samples). When measurement data were available for other measured radionuclides (e.g. 110mAg, 129mTe, or 131I), their values were used directly. Missing data were reconstructed from the ratios presented in table 9.
2. The six prefectures − Iwate, Miyagi, Tochigi, Gunma, Ibaraki and Chiba (Group 3)
99. The six Group 3 prefectures included those of Iwate, Miyagi, Tochigi, Gunma, Ibaraki and Chiba, except for the 33 settlements discussed in the previous paragraph above. Data on the deposition densities of radionuclides on soil were obtained from a series of in situ measurements and/or soil sampling conducted in late 2011 on the basis of a grid of 10-km squares with maps showing sampling points for each prefecture. These data were weighted according to the population density in each of the 130 settlements located in the six Group 3 prefectures. Measurement data were available for 134Cs, 137Cs and, for some locations, 110mAg. The deposition densities of other radionuclides for which no measurement data were available were assessed using the ratios in table 9.
3. Distant prefectures of Japan (Group 4)
100. The distant prefectures of Japan comprise the prefectures that were not covered in the previous two paragraphs above—the other 40 Japanese prefectures. The measurement data for 134Cs, 137Cs and sometimes 131I were obtained at one representative point in each prefecture and presented on a monthly basis over the 13-month period from March 2011 to March 2012.
101. In order to assess the representative deposition densities of radionuclides on soil, the monthly fallout data for 134Cs and 137Cs were summarized for the period from March to July 2011. The results for 134Cs were corrected for radioactive decay to 15 March 2011. The deposition densities of other radionuclides were assessed using the ratios in table 9.
D. Data set for the assessment of dose from external exposure for the plume and internal exposure from inhalation
102. For all of Japan, the input data (activity concentrations in air or time-dependent activity concentrations in air of eight radionuclides: 132Te, 131I, 132I, 133I, 133Xe, 134Cs, 136Cs, and 137Cs) were obtained from ATDM. These data were converted into time-integrated activity concentrations.
103. The activity concentrations in air or the time-integrated activity concentrations in air were averaged over the areas of each of the 59 settlements of Fukushima Prefecture.

ATTACHMENT C-12: METHODOLOGY FOR THE ASSESSMENT OF DOSE FROM EXTERNAL EXPOSURE AND INHALATION ... 29
Aggregated deposition velocities were derived from the time-integrated activity concentrations in air and deposition densities. The median of the values of these aggregated deposition velocities were then used to derive the time-integrated activity concentrations in air for the rest of Japan.
104. The activity concentrations in air or time-integrated activity concentrations in air for the eight radionuclides were directly used for the assessment of doses from external exposure from the plume and internal exposure from inhalation for the 18 scenarios for the evacuated settlements.
E. Evacuation data
105. As a result of the FDNPS accident, precautionary evacuation from the potentially affected areas of Fukushima Prefecture (<20 km from FDNPS) to less affected areas [NERHQ, 2011] was carried out by the Government of Japan between 11 and 15 March 2011. In addition, some people evacuated from the adjacent areas voluntarily. A series of evacuations was deliberately implemented during late March to June 2011 from the towns and villages located to the north-west of FDNPS; the governmental decision was based on the environmental radiation measurements [NERHQ, 2011].
106. Information on the number of people residing in the evacuated and adjacent areas before the accident and the number of people evacuated is presented in table 10. More detailed information about the destinations of those evacuated in the precautionary and deliberate evacuations are presented in table 11.
Table 10. Populations of the evacuated areas and some adjacent territories and the number of evacuees
City, town or village
Population before 11 March 2011a Rounded number of evacueesb
<20 km 20–30 km >30 km Total Evacuated by 15 March 2011
Population of deliberate
evacuation area Totalc
Minamisoma 14 300 47 400 9 200 70 900 14 300 <100 32 000 Katsurao 300 1 300 – 1 600 300 1 300 1 600 Namie 19 600 1 000 300 20 900 19 600 1 300 20 900 Tamura 600 3 200 36 600 40 400 600 – 3 000 Futaba 6 900 – – 6 900 6 900 – 6 900 Okuma 11 500 – – 11 500 11 500 – 11 500 Kawauchi 1 100 1 700 – 2 800 2 800d – 2 800d Tomioka 16 000 – – 16 000 16 000 – 16 000 Naraha 7 700 – – 7 700 7 700 – 7 700 Hirono 200 5 200 – 5 400 5 200 – 5 200 Iitate – 300 5 900 6 200 – 6 200 6 200 Kawamata – – 15 600 15 600 – 1 300 1 300 Iwaki – 2 200 340 000 342 200 – – 2 700
Total 78 200 62 300 407 600 548 100 84 900 10 200 117 800 a Approximate number based on Japan 2010 Census [MIC, 2011]. b The numbers reported in [MEXT, 2011]; those were adjusted to be consistent with the population data. c The number of evacuees reported [MEXT, 2011] may also include evacuees who lived outside of 30-km radius and people evacuated for
other reasons than radiological protection. For that reason, the total number of evacuees may be larger than the sum of people evacuated before 15 March 2011 and from the deliberate evacuation area.
d Evacuated from the evacuation zone (<20 km) by 15 March 2011, and from the whole village immediately after the village mayor’s instruction on 16 March 2011 [ICANPS, 2011].

ATTA
CH
MEN
T C-12: M
ETHO
DO
LOG
Y FO
R TH
E ASSESSM
ENT O
F DO
SE FRO
M EX
TERN
AL EX
POSU
RE A
ND
INH
ALA
TION
...
30
Table 11. Evacuation scenarios
Location Latitude °N
Longitude °E
Time period (JST) Activity Building type or vehicle Fraction of time indoors (adult / child / infant)
Scenario 1: Tomioka Town evacuation
Tomioka Town Office 37.346 141.009 2011-03-11 00:00 --> 2011-03-11 21:00 Normal living conditions Wooden 1-to-2-storey house See table 3
Tomioka Town Office 37.346 141.009 2011-03-11 21:00 --> 2011-03-12 03:00 Evacuation preparation Wooden 1-to-2-storey house 0 / 1 / 1
Tomioka Town to Kawauchi Village
2011-03-12 03:00 --> 2011-03-12 06:00 Evacuation Vehicle 0 / 0 / 0
Kawauchi Village Office 37.3381 140.809 2011-03-12 06:00 --> 2011-03-15 11:00 Normal living conditions Wooden 1-to-2-storey house See table 3 Kawauchi Village Office 37.3381 140.809 2011-03-15 11:00 --> 2011-03-16 08:00 Sheltering Wooden 1-to-2-storey house 1 / 1 / 1
Kawauchi Village Office 37.3381 140.809 2011-03-16 08:00 --> 2011-03-16 10:00 Evacuation preparation Wooden 1-to-2-storey house 0 / 1 / 1
Kawauchi Village to Big Pallete Fukushima
2011-03-16 10:00 --> 2011-03-16 16:00 Evacuation Vehicle 0 / 0 / 0
Big Palette Fukushima 37.3699 140.3741 2011-03-16 16:00 --> 2012-03-11 00:00 Normal living conditions Concrete multi-storey apartment
See table 3
Scenario 2: Okuma Town evacuation
Okuma Town Office 37.4044 140.9834 2011-03-11 00:00 --> 2011-03-11 21:23 Normal living conditions Wooden 1-to-2-storey house See table 3
Okuma Town Office 37.4044 140.9834 2011-03-11 21:23 --> 2011-03-12 04:00 Sheltering Wooden 1-to-2-storey house 1 / 1 / 1 Okuma Town Office 37.4044 140.9834 2011-03-12 04:00 --> 2011-03-12 10:00 Evacuation preparation Wooden 1-to-2-storey house 0 / 1 / 1
Okuma Town to Funahiki 2011-03-12 10:00 --> 2011-03-12 13:00 Evacuation Outdoors 0 / 0 / 0
Funahiki Vocational Improvement Center
37.4352 140.5657 2011-03-12 13:00 --> 2012-03-11 00:00 Normal living conditions Wooden 1-to-2-storey house See table 3
Scenario 3: Futaba Town evacuation
Futaba Town Office 37.4491 141.0123 2011-03-11 00:00 --> 2011-03-11 21:00 Normal living conditions Wooden 1-to-2-storey house See table 3
Futaba Town Office 37.4491 141.0123 2011-03-11 21:00 --> 2011-03-12 03:00 Evacuation preparation Wooden 1–to-2-storey house 0 / 1 / 1
Futaba to Kawamata 2011-03-12 03:00 --> 2011-03-12 08:00 Evacuation Vehicle 0 / 0 / 0
Kawamata Elementary School 37.6696 140.5996 2011-03-12 08:00 --> 2011-03-19 08:00 Normal living conditions Wooden 1-to-2-storey house See table 3 Kawamata Elementary School 37.6696 140.5996 2011-03-19 08:00 --> 2011-03-19 10:00 Evacuation preparation Wooden 1-to-2-storey house 0 / 1 / 1

ATTA
CH
MEN
T C-12: M
ETHO
DO
LOG
Y FO
R TH
E ASSESSM
ENT O
F DO
SE FRO
M EX
TERN
AL EX
POSU
RE A
ND
INH
ALA
TION
...
31
Location Latitude °N
Longitude °E
Time period (JST) Activity Building type or vehicle Fraction of time indoors (adult / child / infant)
Kawamata to Saitama 2011-03-19 10:00 --> 2011-03-19 17:00 Evacuation Vehicle 0 / 0 / 0 Saitama Super Arena 35.8949 139.6307 2011-03-19 17:00 --> 2011-03-31 08:00 Normal living conditions Concrete multi-storey
apartment See table 3
Saitama Super Arena 35.8949 139.6307 2011-03-31 08:00 --> 2011-03-31 10:00 Evacuation preparation Concrete multi-storey apartment
0 / 1 / 1
Saitama to Kisai 2011-03-31 10:00 --> 2011-03-31 11:00 Evacuation Vehicle 0 / 0 / 0
Kisai High School 36.1042 139.5704 2011-03-31 11:00 --> 2012-03-11 00:00 Normal living conditions Concrete multi-storey apartment
See table 3
Scenario 4: Futaba Town evacuation (2)
Futaba Town Office 37.4491 141.0123 2011-03-11 00:00 --> 2011-03-11 21:23 Normal living conditions Wooden 1-to-2-storey house See table 3
Futaba Town Office 37.4491 141.0123 2011-03-11 21:23 --> 2011-03-12 10:00 Sheltering Wooden 1-to-2-storey house 1 / 1 / 1
Futaba Town Office 37.4491 141.0123 2011-03-12 10:00 --> 2011-03-12 16:00 Evacuation preparation Wooden 1-to-2-storey house 0 / 1 / 1 Futaba to Kawamata 2011-03-12 16:00 --> 2011-03-12 21:00 Evacuation Vehicle 0 / 0 / 0
Kawamata Elementary School 37.6696 140.5996 2011-03-12 21:00 --> 2011-03-19 08:00 Normal living conditions Wooden 1-to-2-storey house See table 3
Kawamata Elementary School 37.6696 140.5996 2011-03-19 08:00 --> 2011-03-19 10:00 Evacuation preparation Wooden 1-to-2-storey house 0 / 1 / 1
Kawamata to Saitama 2011-03-19 10:00 --> 2011-03-19 17:00 Evacuation Vehicle 0 / 0 / 0 Saitama Super Arena 35.8949 139.6307 2011-03-19 17:00 --> 2011-03-31 08:00 Normal living conditions Concrete multi-storey
apartment See table 3
Saitama Super Arena 35.8949 139.6307 2011-03-31 08:00 --> 2011-03-31 10:00 Evacuation preparation Concrete multi-storey apartment
0 / 1 / 1
Saitama to Kisai 2011-03-31 10:00 --> 2011-03-31 11:00 Evacuation Vehicle 0 / 0 / 0
Kisai High School 36.1042 139.5704 2011-03-31 11:00 --> 2012-03-11 00:00 Normal living conditions Concrete multi-storey apartment
See table 3
Scenario 5: Naraha Town evacuation
Naraha Town Office 37.2826 140.9935 2011-03-11 00:00 --> 2011-03-12 03:00 Normal living conditions Wooden 1-to-2-storey house See table 3
Naraha Town Office 37.2826 140.9935 2011-03-12 03:00 --> 2011-03-12 09:00 Evacuation preparation Wooden 1-to-2-storey house 0 / 1 / 1 Naraha to Iwaki 2011-03-12 09:00 --> 2011-03-12 13:00 Evacuation Vehicle 0 / 0 / 0
Iwaki City Office 37.0505 140.8877 2011-03-12 13:00 --> 2011-03-31 08:00 Normal living conditions Wooden 1-to-2-storey house See table 3
Iwaki City Office 37.0505 140.8877 2011-03-31 08:00 --> 2011-03-31 10:00 Evacuation preparation Wooden 1-to-2-storey house 0 / 1 / 1
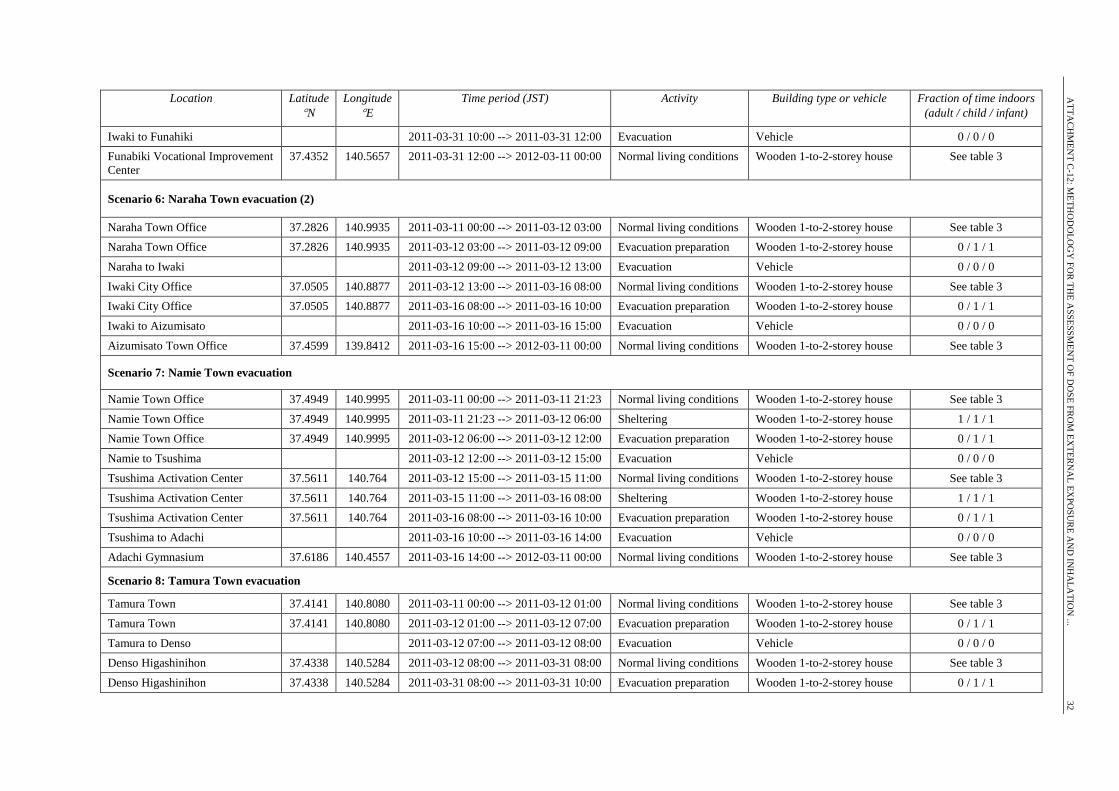
ATTA
CH
MEN
T C-12: M
ETHO
DO
LOG
Y FO
R TH
E ASSESSM
ENT O
F DO
SE FRO
M EX
TERN
AL EX
POSU
RE A
ND
INH
ALA
TION
...
32
Location Latitude °N
Longitude °E
Time period (JST) Activity Building type or vehicle Fraction of time indoors (adult / child / infant)
Iwaki to Funahiki 2011-03-31 10:00 --> 2011-03-31 12:00 Evacuation Vehicle 0 / 0 / 0 Funabiki Vocational Improvement Center
37.4352 140.5657 2011-03-31 12:00 --> 2012-03-11 00:00 Normal living conditions Wooden 1-to-2-storey house See table 3
Scenario 6: Naraha Town evacuation (2)
Naraha Town Office 37.2826 140.9935 2011-03-11 00:00 --> 2011-03-12 03:00 Normal living conditions Wooden 1-to-2-storey house See table 3 Naraha Town Office 37.2826 140.9935 2011-03-12 03:00 --> 2011-03-12 09:00 Evacuation preparation Wooden 1-to-2-storey house 0 / 1 / 1
Naraha to Iwaki 2011-03-12 09:00 --> 2011-03-12 13:00 Evacuation Vehicle 0 / 0 / 0
Iwaki City Office 37.0505 140.8877 2011-03-12 13:00 --> 2011-03-16 08:00 Normal living conditions Wooden 1-to-2-storey house See table 3 Iwaki City Office 37.0505 140.8877 2011-03-16 08:00 --> 2011-03-16 10:00 Evacuation preparation Wooden 1-to-2-storey house 0 / 1 / 1
Iwaki to Aizumisato 2011-03-16 10:00 --> 2011-03-16 15:00 Evacuation Vehicle 0 / 0 / 0
Aizumisato Town Office 37.4599 139.8412 2011-03-16 15:00 --> 2012-03-11 00:00 Normal living conditions Wooden 1-to-2-storey house See table 3
Scenario 7: Namie Town evacuation
Namie Town Office 37.4949 140.9995 2011-03-11 00:00 --> 2011-03-11 21:23 Normal living conditions Wooden 1-to-2-storey house See table 3
Namie Town Office 37.4949 140.9995 2011-03-11 21:23 --> 2011-03-12 06:00 Sheltering Wooden 1-to-2-storey house 1 / 1 / 1 Namie Town Office 37.4949 140.9995 2011-03-12 06:00 --> 2011-03-12 12:00 Evacuation preparation Wooden 1-to-2-storey house 0 / 1 / 1
Namie to Tsushima 2011-03-12 12:00 --> 2011-03-12 15:00 Evacuation Vehicle 0 / 0 / 0
Tsushima Activation Center 37.5611 140.764 2011-03-12 15:00 --> 2011-03-15 11:00 Normal living conditions Wooden 1-to-2-storey house See table 3
Tsushima Activation Center 37.5611 140.764 2011-03-15 11:00 --> 2011-03-16 08:00 Sheltering Wooden 1-to-2-storey house 1 / 1 / 1 Tsushima Activation Center 37.5611 140.764 2011-03-16 08:00 --> 2011-03-16 10:00 Evacuation preparation Wooden 1-to-2-storey house 0 / 1 / 1
Tsushima to Adachi 2011-03-16 10:00 --> 2011-03-16 14:00 Evacuation Vehicle 0 / 0 / 0
Adachi Gymnasium 37.6186 140.4557 2011-03-16 14:00 --> 2012-03-11 00:00 Normal living conditions Wooden 1-to-2-storey house See table 3
Scenario 8: Tamura Town evacuation
Tamura Town 37.4141 140.8080 2011-03-11 00:00 --> 2011-03-12 01:00 Normal living conditions Wooden 1-to-2-storey house See table 3
Tamura Town 37.4141 140.8080 2011-03-12 01:00 --> 2011-03-12 07:00 Evacuation preparation Wooden 1-to-2-storey house 0 / 1 / 1
Tamura to Denso 2011-03-12 07:00 --> 2011-03-12 08:00 Evacuation Vehicle 0 / 0 / 0 Denso Higashinihon 37.4338 140.5284 2011-03-12 08:00 --> 2011-03-31 08:00 Normal living conditions Wooden 1-to-2-storey house See table 3
Denso Higashinihon 37.4338 140.5284 2011-03-31 08:00 --> 2011-03-31 10:00 Evacuation preparation Wooden 1-to-2-storey house 0 / 1 / 1

ATTA
CH
MEN
T C-12: M
ETHO
DO
LOG
Y FO
R TH
E ASSESSM
ENT O
F DO
SE FRO
M EX
TERN
AL EX
POSU
RE A
ND
INH
ALA
TION
...
33
Location Latitude °N
Longitude °E
Time period (JST) Activity Building type or vehicle Fraction of time indoors (adult / child / infant)
Denso to Big Palette 2011-03-31 10:00 --> 2011-03-31 11:00 Evacuation Vehicle 0 / 0 / 0 Big Palette Fukushima 37.3699 140.3741 2011-03-31 11:00 --> 2012-03-11 00:00 Normal living conditions Concrete multi-storey
apartment See table 3
Scenario 9: Minamisoma City evacuation Minamisoma City 37.5761 140.9131 2011-03-11 00:00 --> 2011-03-15 04:00 Normal living conditions Wooden 1-to-2-storey house See table 3
Minamisoma City 37.5761 140.9131 2011-03-15 04:00 --> 2011-03-15 10:00 Evacuation preparation Wooden 1-to-2-storey house 0 / 1 / 1
Minamisoma City to Date City Office
2011-03-15 10:00 --> 2011-03-15 16:00 Evacuation Vehicle 0 / 0 / 0
Date City Office 37.8191 140.563 2011-03-15 16:00 --> 2011-03-31 08:00 Normal living conditions Wooden 1-to-2-storey house See table 3
Date City Office 37.8191 140.563 2011-03-31 08:00 --> 2011-03-31 10:00 Evacuation preparation Wooden 1-to-2-storey house 0 / 1 / 1 Date City to Azuma Gymnasium 2011-03-31 10:00 --> 2011-03-31 11:00 Evacuation Vehicle 0 / 0 / 0
Azuma Gymnasium 37.7248 140.3649 2011-03-31 11:00 --> 2012-03-11 00:00 Normal living conditions Wooden 1-to-2-storey house See table 3
Scenario 10: Hirono Town evacuation
Hirono Town 37.2422 140.9887 2011-03-11 00:00 --> 2011-03-11 19:00 Normal living conditions Wooden 1-to-2-storey house See table 3 Hirono Town 37.2422 140.9887 2011-03-11 19:00 --> 2011-03-12 01:00 Evacuation preparation Wooden 1-to-2-storey house 0 / 1 / 1
Hirono to Ono 2011-03-12 01:00 --> 2011-03-12 08:00 Evacuation Vehicle 0 / 0 / 0
Ono Town Office 37.2868 140.6263 2011-03-12 08:00 --> 2012-03-11 00:00 Normal living conditions Wooden 1-to-2-storey house See table 3
Scenario 11: Kawauchi Village evacuation
Kawauchi Village 37.3510 140.8503 2011-03-11 00:00 --> 2011-03-13 04:00 Normal living conditions Wooden 1-to-2-storey house See table 3
Kawauchi Village 37.3510 140.8503 2011-03-13 04:00 --> 2011-03-13 10:00 Evacuation preparation Wooden 1-to-2-storey house 0 / 1 / 1 Kawauchi Village to Kawauchi Mura Elementary School
2011-03-13 10:00 --> 2011-03-13 11:00 Evacuation Vehicle 0 / 0 / 0
Kawauchi Mura Elementary School
37.3435 140.803 2011-03-13 11:00 --> 2011-03-15 11:00 Normal living conditions Concrete multi-storey apartment
See table 3
Kawauchi Mura Elementary School
37.3435 140.803 2011-03-15 11:00 --> 2011-03-16 08:00 Sheltering Concrete multi-storey apartment
1 / 1 / 1
Kawauchi Mura Elementary School
37.3435 140.803 2011-03-16 08:00 --> 2011-03-16 10:00 Evacuation preparation Concrete multi-storey apartment
0 / 1 / 1
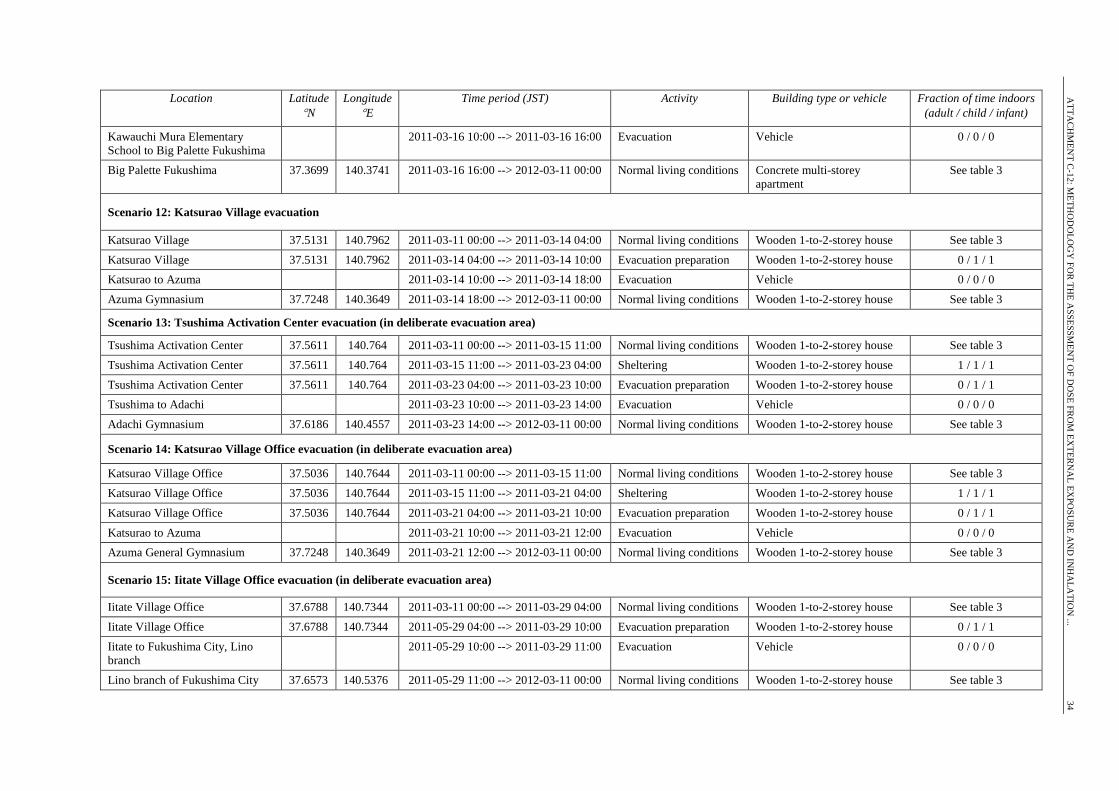
ATTA
CH
MEN
T C-12: M
ETHO
DO
LOG
Y FO
R TH
E ASSESSM
ENT O
F DO
SE FRO
M EX
TERN
AL EX
POSU
RE A
ND
INH
ALA
TION
...
34
Location Latitude °N
Longitude °E
Time period (JST) Activity Building type or vehicle Fraction of time indoors (adult / child / infant)
Kawauchi Mura Elementary School to Big Palette Fukushima
2011-03-16 10:00 --> 2011-03-16 16:00 Evacuation Vehicle 0 / 0 / 0
Big Palette Fukushima 37.3699 140.3741 2011-03-16 16:00 --> 2012-03-11 00:00 Normal living conditions Concrete multi-storey apartment
See table 3
Scenario 12: Katsurao Village evacuation
Katsurao Village 37.5131 140.7962 2011-03-11 00:00 --> 2011-03-14 04:00 Normal living conditions Wooden 1-to-2-storey house See table 3
Katsurao Village 37.5131 140.7962 2011-03-14 04:00 --> 2011-03-14 10:00 Evacuation preparation Wooden 1-to-2-storey house 0 / 1 / 1 Katsurao to Azuma 2011-03-14 10:00 --> 2011-03-14 18:00 Evacuation Vehicle 0 / 0 / 0
Azuma Gymnasium 37.7248 140.3649 2011-03-14 18:00 --> 2012-03-11 00:00 Normal living conditions Wooden 1-to-2-storey house See table 3
Scenario 13: Tsushima Activation Center evacuation (in deliberate evacuation area)
Tsushima Activation Center 37.5611 140.764 2011-03-11 00:00 --> 2011-03-15 11:00 Normal living conditions Wooden 1-to-2-storey house See table 3
Tsushima Activation Center 37.5611 140.764 2011-03-15 11:00 --> 2011-03-23 04:00 Sheltering Wooden 1-to-2-storey house 1 / 1 / 1
Tsushima Activation Center 37.5611 140.764 2011-03-23 04:00 --> 2011-03-23 10:00 Evacuation preparation Wooden 1-to-2-storey house 0 / 1 / 1 Tsushima to Adachi 2011-03-23 10:00 --> 2011-03-23 14:00 Evacuation Vehicle 0 / 0 / 0
Adachi Gymnasium 37.6186 140.4557 2011-03-23 14:00 --> 2012-03-11 00:00 Normal living conditions Wooden 1-to-2-storey house See table 3
Scenario 14: Katsurao Village Office evacuation (in deliberate evacuation area)
Katsurao Village Office 37.5036 140.7644 2011-03-11 00:00 --> 2011-03-15 11:00 Normal living conditions Wooden 1-to-2-storey house See table 3
Katsurao Village Office 37.5036 140.7644 2011-03-15 11:00 --> 2011-03-21 04:00 Sheltering Wooden 1-to-2-storey house 1 / 1 / 1
Katsurao Village Office 37.5036 140.7644 2011-03-21 04:00 --> 2011-03-21 10:00 Evacuation preparation Wooden 1-to-2-storey house 0 / 1 / 1
Katsurao to Azuma 2011-03-21 10:00 --> 2011-03-21 12:00 Evacuation Vehicle 0 / 0 / 0 Azuma General Gymnasium 37.7248 140.3649 2011-03-21 12:00 --> 2012-03-11 00:00 Normal living conditions Wooden 1-to-2-storey house See table 3
Scenario 15: Iitate Village Office evacuation (in deliberate evacuation area)
Iitate Village Office 37.6788 140.7344 2011-03-11 00:00 --> 2011-03-29 04:00 Normal living conditions Wooden 1-to-2-storey house See table 3
Iitate Village Office 37.6788 140.7344 2011-05-29 04:00 --> 2011-03-29 10:00 Evacuation preparation Wooden 1-to-2-storey house 0 / 1 / 1
Iitate to Fukushima City, Lino branch
2011-05-29 10:00 --> 2011-03-29 11:00 Evacuation Vehicle 0 / 0 / 0
Lino branch of Fukushima City 37.6573 140.5376 2011-05-29 11:00 --> 2012-03-11 00:00 Normal living conditions Wooden 1-to-2-storey house See table 3

ATTA
CH
MEN
T C-12: M
ETHO
DO
LOG
Y FO
R TH
E ASSESSM
ENT O
F DO
SE FRO
M EX
TERN
AL EX
POSU
RE A
ND
INH
ALA
TION
...
35
Location Latitude °N
Longitude °E
Time period (JST) Activity Building type or vehicle Fraction of time indoors (adult / child / infant)
Scenario 16: Iitate Village evacuation (2) (in deliberate evacuation area)
Iitate Village Office 37.6788 140.7344 2011-03-11 00:00 --> 2011-03-21 04:00 Normal living conditions Wooden 1-to-2-storey house See table 3 Iitate Village Office 37.6788 140.7344 2011-06-21 04:00 --> 2011-03-21 10:00 Evacuation preparation Wooden 1-to-2-storey house 0 / 1 / 1
Iitate to Fukushima City, Lino branch
2011-06-21 10:00 --> 2011-03-21 11:00 Evacuation Vehicle 0 / 0 / 0
Lino branch of Fukushima City 37.6573 140.5376 2011-06-21 11:00 --> 2012-03-11 00:00 Normal living conditions Wooden 1-to-2-storey house See table 3
Scenario 17: Minamisoma City evacuation (2) (in deliberate evacuation area)
Minamisoma City 37.6535 140.8375 2011-03-11 00:00 --> 2011-03-20 04:00 Normal living conditions Wooden 1-to-2-storey house See table 3 Minamisoma City 37.6535 140.8375 2011-05-20 04:00 --> 2011-03-20 10:00 Evacuation preparation Wooden 1-to-2-storey house 0 / 1 / 1
Minamisoma City to Minamisoma City Office
2011-05-20 10:00 --> 2011-03-20 10:30 Evacuation Vehicle 0 / 0 / 0
Minamisoma City Office 37.6422 140.957 2011-05-20 10:30 --> 2012-03-11 00:00 Normal living conditions Wooden 1-to-2-storey house See table 3
Scenario 18: Yamakiya District, Kawamata Town evacuation (in deliberate evacuation area)
Yamakiya District, Kawamata Town
37.6201 140.6725 2011-03-11 00:00 --> 2011-03-01 04:00 Normal living conditions Wooden 1-to-2-storey house See table 3
Yamakiya District, Kawamata Town
37.6201 140.6725 2011-06-01 04:00 --> 2011-03-01 10:00 Evacuation preparation Wooden 1-to-2-storey house 0 / 1 / 1
Yamakiya District, Kawamata Town to Kawamata Town Office
2011-06-01 10:00 --> 2011-03-01 10:30 Evacuation Vehicle 0 / 0 / 0
Kawamata Town Office 37.665 140.598 2011-06-01 10:30 --> 2012-03-11 00:00 Normal living conditions Wooden 1-to-2-storey house See table 3

ATTA
CH
MEN
T C-12: M
ETHO
DO
LOG
Y FO
R TH
E ASSESSM
ENT O
F DO
SE FRO
M EX
TERN
AL EX
POSU
RE A
ND
INH
ALA
TION
...
36

ATTACHMENT C-12: METHODOLOGY FOR THE ASSESSMENT OF DOSE FROM EXTERNAL EXPOSURE AND INHALATION ... 37
References Akahane, K., S. Yonai, S. Fukuda et al. NIRS external dose estimation system for Fukushima residents
after the Fukushima Dai-ichi NPP accident. Sci Rep 3: 1670 (2013). Andersson, K.G., J. Roed, P. Jacob et al. Weathering of Cs-137 on various surfaces in inhabited areas
and calculated locations factors. p. 47-56 in: Deposition of Radionuclides, Their Subsequent Relocation in the Environment and Resulting Implications. Report EUR 16604 EN. European Commission, Luxembourg, 1995.
Endo, S., S. Kimura, T. Takatsuji et al. Measurement of soil contamination by radionuclides due to the Fukushima Dai-ichi Nuclear Power Plant accident and associated estimated cumulative external dose estimation. J Environ Radioact 111: 18-27 (2012).
Golikov, V., M. Balonov, V. Erkin et al. Model validation for external doses due to environmental contaminations by the Chernobyl accident. Health Phys 77(6): 654-661 (1999).
Golikov, V., E. Wallstrom, T. Wohni et al. Evaluation of conversion coefficients from measurable to risk quantities for external exposure over contaminated soil by use of physical human phantoms. Radiat Environ Biophys 46(4): 375-382 (2007).
Golikov, V.Y., M.I. Balonov and P. Jacob. External exposure of the population living in areas of Russia contaminated due to the Chernobyl accident. Radiat Environ Biophys 41(3): 185-193 (2002).
Golikov, V.Y., M.I. Balonov and A.V. Ponomarev. Estimation of external gamma radiation doses to the population after the Chernobyl accident. p. 247-288 in: The Chernobyl Papers. Vol. I. Doses to the Soviet Population and Early Health Effects Studies (S. E. Merwin, eds.). Research Enterprises, Richland, Washington, 1993.
IAEA. Compilation of anatomical, physiological and metabolic characteristics for a Reference Asian Man. Vols 1 and 2. IAEA–TECDOC-1005. International Atomic Energy Agency, Vienna, 1998.
IAEA. Environmental consequences of the Chernobyl accident and their remediation: Twenty years of experience. Report of the Chernobyl Forum Expert Group "Environment". International Atomic Energy Agency, Vienna, 2006.
IAEA. Reference Asian Man: Ingestion and organ content of trace elements of importance in radiological protection. IAEA-TECDOC-1592. International Atomic Energy Agency, Vienna, 2008.
ICANPS. Interim Report, the Investigation Committee on the Accident at the Fukushima Nuclear Power Stations of Tokyo Electric Power Company. [Internet] Available from (http://icanps.go.jp/eng/interim-report.html) on 26 December 2011.
ICRP. Human respiratory tract model for radiological protection. ICRP Publication 66. Annals of the ICRP 24(1-3). International Commission on Radiological Protection, Pergamon Press, Oxford, 1994.
ICRP. Age-dependent doses to members of the public from intake of radionuclides: Part 4. Inhalation dose coefficients. ICRP Publication 71. Annals of the ICRP 25(3-4). International Commission on Radiological Protection, Pergamon Press, Oxford, 1995.
ICRP. Age-dependent doses to members of the public from intake of radionuclides: Part 5. Compilation of ingestion and inhalation dose coefficients. ICRP Publication 72. Annals of the ICRP 26(1). International Commission on Radiological Protection, Pergamon Press, Oxford, 1996.
ICRP. Conversion coefficients for use in radiological protection against external radiation. ICRP Publication 74. Annals of the ICRP 26(3-4). International Commission on Radiological Protection, Pergamon Press, Oxford, 1996.
ICRU. Gamma-ray spectrometry in the environment. ICRU Report 53. International Commission on Radiation Units and Measurements, Bethesda, 1994.
IRSN. Synthèse des informations disponibles sur la contamination radioactive de l’environnement terrestre japonais provoquée par l’accident de Fukushima Dai-ichi (13 juillet 2011). [Internet] Available from (http://www.irsn.fr/FR/Actualites_presse/Actualites/Documents/IRSN-NI_Fukushima-Consequences_environnement_Japon-13072011.pdf) on 1 December 2011. (French)
Jacob, P., G. Pröhl, I. Likhtarev et al. Pathway analysis and dose distributions. EUR 16541 EN. European Commission, Brussels, 1996.
Jacob, P. and R. Meckbach. Shielding factors and external dose evaluation. Radiat Prot Dosim 21(1-3): 79-85 (1987a).
Jacob, P. and R. Meckbach. Measurements after the Chernobyl accident in relation to the exposure of an urban population. p. 34-41 in: Restoration of Environments Affected by Residues from

ATTACHMENT C-12: METHODOLOGY FOR THE ASSESSMENT OF DOSE FROM EXTERNAL EXPOSURE AND INHALATION ... 38
Radiological Accidents: Approaches to Decision Making. IAEA-TECDOC-1131. International Atomic Energy Agency, Vienna, 2000.
Jacob, P., R. Meckbach and H.M. Müller. Reduction of external exposure from deposited Chernobyl activity by run-off, weathering, street cleaning and migration in the soil. Radiat Prot Dosim 21(1-3): 51-57 (1987b).
Jacob, P., H. Rosenbaum, N. Petoussi et al. Calculation of organ doses from environmental gamma rays using human phantoms and Monte Carlo methods. Part II: Radionuclides distributed in the air or deposited on the ground. GSF-Bericht 12/90. GSF-National Research Center on Environment and Health, Neuherberg, Germany, 1990.
Kirchner, G., P. Bossew and M. De Cort. Radioactivity from Fukushima Dai-ichi in air over Europe; part 2: what can it tell us about the accident? J Environ Radioact 114: 35-40 (2012).
Likhtarev, I.A., L.N. Kovgan, P. Jacob et al. Chernobyl accident: retrospective and prospective estimates of external dose of the population of Ukraine. Health Phys 82(3): 290-303 (2002).
Meckbach, R. and P. Jacob. Gamma exposures due to radionuclides deposited in urban environments. Part II: Location factors for different deposition patterns. Radiat Prot Dosim 25(3): 181-190 (1988).
MEXT. Status of the evacuees. Ministry of Education, Culture, Sports, Science and Technology. [Internet] Available from (http://www.mext.go.jp/b_menu/shingi/chousa/kaihatu/016/ shiryo/__icsFiles/afieldfile/2011/10/14/1305309_1.pdf) on 13 December 2011. (Japanese)
MEXT. Preparation of Distribution Map of Radiation Doses, etc. (Maps of Concentration of Tellurium 129m and Silver 110m in Soil). Ministry of Education, Culture, Sports, Science and Technology. [Internet] Available from (http://radioactivity.nsr.go.jp/en/contents/5000/ 4168/24/1750_1031e_2.pdf) on 19 August 2012.
MEXT. Results of analyses of radionuclides (Cs-134 and Cs-137) in soil. Ministry of Education, Culture, Sports, Science and Technology. [Internet] Available from (http://www.mext.go.jp/b_menu/shingi/chousa/gijyutu/017/shiryo/__icsFiles/afieldfile/2011/9/02/1310688_1.pdf) on 12 January 2013. (Japanese).
MIC. The basic information about the population census for 2010 in Japan. Ministry of Internal Affairs and Communications. [Internet] Available from (http://www.stat.go.jp/data/kokusei/2010/ special/english/index.htm) on 6 December 2011.
MIC. Housing and Land Survey: 2008 Survey. Statistics Bureau, Ministry of Internal Affairs and Communications. [Internet] Available from (http://www.stat.go.jp/english/data/jyutaku/) on 19 August 2012 (2012a).
MIC. 2011 Survey on time use and leisure activities. Ministry of Internal Affairs and Communications. [Internet] Available from (http://www.e-stat.go.jp/SG1/estat/ListE.do?bid=000001040667 &cycode=0) on 19 August 2012 (2012b).
NERHQ. Report of Japanese Government to the IAEA Ministerial Conference on Nuclear Safety. The accident at TEPCO's Fukushima Nuclear Power Stations. Nuclear Emergency Response Headquarters. [Internet] Available from (http://www.iaea.org/newscenter/focus/fukushima/ japan-report) on 6 October 2011.
Nishihara, K., H. Iwamoto and K. Suyama. Estimation of fuel compositions in Fukushima-Daiichi Nuclear Power Plant. JAEA-Data/Code 2012-018. Japan Atomic Energy Agency, Japan, 2012.
NRA. Monitoring information of environmental radioactivity level. Nuclear Regulation Authority. [Internet] Available from (http://radioactivity.nsr.go.jp/en/list/192/list-201103.html) on 18 September 2012.
Petoussi-Henss, N., H. Schlattl, M. Zankl et al. Organ doses from environmental exposures calculated using voxel phantoms of adults and children. Phys Med Biol 57(18): 5679-5713 (2012).
Tagami, K., S. Uchida, Y. Uchihori et al. Specific activity and activity ratios of radionuclides in soil collected about 20 km from the Fukushima Daiichi Nuclear Power Plant: Radionuclide release to the south and southwest. Sci Total Environ 409(22): 4885-4888 (2011).
Terada, H., G. Katata, M. Chino et al. Atmospheric discharge and dispersion of radionuclides during the Fukushima Dai-ichi Nuclear Power Plant accident. Part II: verification of the source term and analysis of regional-scale atmospheric dispersion. J Environ Radioact 112: 141-154 (2012).
UNSCEAR. Sources and Effects of Ionizing Radiation. Volume II: Effects. Scientific Annexes C, D and E. UNSCEAR 2008 Report. United Nations Scientific Committee on the Effects of Atomic Radiation. United Nations sales publication E.11.IX.3. United Nations, New York, 2011.
Zava, T.T. and D.T. Zava. Assessment of Japanese iodine intake based on seaweed consumption in Japan: A literature-based analysis. Thyroid Res 4(14): 1-7 (2011).