methane emissions from gassy coals in storage silos
TRANSCRIPT

Bureau of Mines Report of Investigations/l978
Methane Emissions From Gassy Coals
in Storage Silos
UNITED STATES DEPARTMENT OF THE INTERIOR

Report of I n v e s t i g a t i o n s 8269
Methane Emissions From Gassy Coals
in Storage Silos
By J . E. Motta, J. C. I,aScola, and Fred N . Kissell
UNII'EID S T A T E S D E P A R T M E N T OF T H E I N T E R I O R Cecil I>. Andrus , Sec re t a ry
BUREAU OF MINES

T h i s publ icat ion has been cataloged as fo l lows:
hla.tta, Joscpli I.:
Methane emissions from gassy coals in storage s i los ' by J. E. Matta, J. C. LaScola, and Fred N. Kissell. !Washing- ton] : U.S. Dept. of the Interior, Bureau of Mines, 1978.
1.i 1'. : d i a g r a ~ n s : 2- cnl. (I<cj>ort uf i n v c s t i g ; l t i o n s - I3urr,lu 01 5 l i n c s : 8269)
13ibliopr:lphy: p. 11.
I . (:o;ll S t o r a g r . 2. 13ituniinotrs cn;ll - S t o r . 1 ~ ~ . Z , J l i * t l l : i ~ ~ c ~ 4. \ l i n e g : l s e s A I. I - ;~Scnl; l , J o h n ('., jo int ;ltrtlior, 1 1 . K i s s c l l , Frcd N., joint author. 111. I ; n i t e d S t n t r s . t3urc.1~1 c > f \ l i n e s . I \ ' . . , 1 i t l e . \'. S e r i e s : [Iniced S t n t r s . 13ureau ol \ l i n e s . I<cport of i n \ . e s t i g . x t i o n s - 13urcau of \ l i n e s : 82(10.
TN23.U7 no. 8269 622.06173
I:.S. 1)cyt. o f t h e Int. Librilry

CONTENTS Page
. . . . . . . . . . . . . . . . . . . . . . . . . . . . . . . . . . . . . . . . . . . . . . . . . . . . . . . . . . . . . . . . . Abs t r ac t 1 . . . . . . . . . . . . . . . . . . . . . . . . . . . . . . . . . . . . . . . . . . . . . . . . . . . . . . . . . . . . . I n t r o d u c t i o n 1
. . . . . . . . . . . . . . . . . . . . . . . . . . . . . . . . . . . . . . . . . . . . . . . . . . . . . . . . . S i l o v e n t i l a t i o n 3 S i l o usage . . . . . . . . . . . . . . . . . . . . . . . . . . . . . . . . . . . . . . . . . . . . . . . . . . . . . . . . . . . . . . . 3 Conveyor b e l t g rab samples . . . . . . . . . . . . . . . . . . . . . . . . . . . . . . . . . . . . . . . . . . . . . . . 4
. . . . . . . . . . . . . . . . . . . . . . . . . . . . . . Methane concen t r a t i on above t h e s t o r e d p i l e 8 . . . . . . . . . . . . . . . . . . . . . . . . . . . . . Methane c o n c e n t r a t i o n w i t h i n t h e s t o r e d p i l e 10
. . . . . . . . . . . . . . . . . . . . . . . . . . . . . . . . . . . . . . . . . . . . . . . . . . . . . . . . . . . . . . Conclusions 11 References . . . . . . . . . . . . . . . . . . . . . . . . . . . . . . . . . . . . . . . . . . . . . . . . . . . . . . . . . . . . . . . 12 Appendix . . -Theoret ical c a l c u l a t i o n of t h e gas emission from a c o a l s i l o .. 13
ILLUSTRATIONS
. . . . . . . . . . . . . . . . . . . . . . . . . . 1 . Gas emi t ted from conveyor b e l t grab samples 4 2 . Gas emi t ted from grab sample a t Fede ra l No . 2 mine ( log- log p l o t ) . . . . 6 3 . Calcu la ted gas emission from a c o a l s i l o u s ing t h e Fede ra l No . 2
grab sample and assuming a c o n s t a n t 8 - h o u r f i l l i n g r a t e . . . . . . . . . . . . 7 4 . Methane c o n c e n t r a t i o n g r a d i e n t i n c o a l s i l o .......................... 8 5 . Average methane c o n c e n t r a t i o n i n s i l o ve r sus gas emi t ted w i t h i n
24 hours from t h e corresponding grab sample . . . . . . . . . . . . . . . . . . . . . . . . 9
TABLE S
1 . General in format ion concerning s i l o s i n v e s t i g a t e d .................... 2 ....................................... 2 . Gas emission from grab samples 5

METHANE EMISSIONS FROM GASSY COALS IN STORAGE SILOS
by
Jm E, Matta, Jm C. LaScola, and Fred N. K i ssel I
ABSTRACT
The methane gas emit ted from c o a l samples c o l l e c t e d from the conveyor b e l t s dumping i n t o s i l o s was measured by the Bureau of Mines. Approximately 50 p c t of the t o t a l gas desorbed i n t o a sealed can wi th in 1 week was r e l eased during the f i r s t 24 hours . No simple c o r r e l a t i o n between the gass iness of the c o a l s to red and the methane concent ra t ion i n the s i l o open space above the c o a l was found. This was probably because the g a s s i e r coa l s were s tored i n open-top s i l o s , which were b e t t e r v e n t i l a t e d . Although the methane concentra- t i o n i n the open space above the c o a l p i l e was l e s s than 1 p c t f o r a l l 34 s i l o s inves t iga t ed , a methane measurement i n the c o a l p i l e showed t h a t high methane concent ra t ions can e x i s t . The methane r e l eased i n t h e p i l e appears t o accumulate and not l i b e r a t e f r e e l y i n t o t h e open space above the coa l p i l e . Probably t h i s gas i s r e l eased during reclaiming ope ra t ions , but f u r t h e r r e sea rch i s requi red t o s u b s t a n t i a t e t h i s claim.
INTRODUCTION
Coal can be s to red i n a number of ways It can be s to red under water , i n open p i t s , b ins , bunkers, s t o c k p i l e s , and s i l o s . The cu r ren t t rend i s t o s t o r e c o a l i n s t o c k p i l e s o r s i l o s a t t h e mine s i t e , so t h a t a p rede te r - mined quan t i ty can be s to red and e a s i l y loaded i n t o r a i l r o a d c a r s . I n t h e p a s t , coa l was gene ra l ly loaded i n t o r a i l r o a d c a r s the day i t was mined; how- eve r , the use of the u n i t t r a i n , which a f fo rds reduced t r a n s p o r t a t i o n r a t e s f o r t r a i n l o a d s or p a r t i a l t r a in loads of coa l , has made temporary s tockp i l ing a t the mine a necess i ty ( 7 ) . I n a d d i t i o n t o convenience i n handling the c o a l , t he use of s i l o s lessens t h e p o s s i b i l i t y of phys ica l and chemical changes i n the c o a l , thereby preserving the u t i l i z a t i o n va lue of the f u e l .
l ~ e s e a r c h p h y s i c i s t . 2 ~ a t h e m a t i c i a n . 3 Physica l research s c i e n t i s t .
A l l au thors a r e wi th P i t t sbu rgh Mining and Sa fe ty Research Center, Bureau of Mines, P i t t sbu rgh , Pa.
4 ~ n d e r l i n e d numbers i n parentheses r e f e r t o items i n the l i s t of re ferences preceding the appendix.

Subbituminous c o a l can be s t o r e d wi thout much deg rada t ion i n a c losed b i n w i t h minimum a i r c i r c u l a t i o n , a slow r a t e of temperature change of t h e b i n i n t e r i o r , and a low tempera ture ( 5 ) . However, when gaseous bituminous c o a l i s s t o r e d i n a con- f i n e d space such a s a s i l o , methane accumulat ion can become an explos ion hazard . The Eng l i sh were aware of t h i s problem a s e a r l y a s 1875 when t h e Royal Commission inqu i r ed i n t o t h e spontaneous combustion of c o a l and gas explos ions i n s h i p s (6) . Current Fede ra l r e g u l a t i o n s (8) r e q u i r e s t h e methane con ten t i n t h e a i r of any s t r u c t u r e , enc losu re , o r o t h e r f a c i l i t y t o be l e s s t h a n 1 . 0 v o l - p c t . As deeper and g a s - s i e r c o a l s a r e mined, problems a s s o c i a t e d w i t h methane accumulat ions i n s i l o s w i l l i n c r e a s e .
The purpose of t h e p re sen t i n v e s t i g a t i o n was t o s tudy t h e p o s s i b i l i t y of a haz- a rd r e s u l t i n g from methane accumulat ions i n s i l o s . Methane concen t r a t ions were mea- sured i n t h e open space above the c o a l and i n t h e c o a l p i l e . Coal samples were c o l l e c t e d from t h e conveyor b e l t t h a t dumps t h e c o a l i n t o t h e s i l o . The gas emi t t ed from t h e samples was measured t o determine t h e r e l a t i o n s h i p between t h e g a s s i n e s s of t he c o a l s t o r e d and t h e methane c o n c e n t r a t i o n i n t h e s i l o . This i n fo rma t ion i s r e l e - v a n t because improper s t o r a g e inay r e s u l t i n h igh methane c o n c e n t r a t i o n s . Now, w i t h even deeper and more gas sy coalbeds being mined and w i t h t h e growing p r a c t i c e of s h o r t - and long-term s t o r a g e of f i n e c o a l , t h e explos ion hazard due t o methane emis- s i o n i s worthy of i n v e s t i g a t i o n . Most of t h e s i l o s i n v e s t i g a t e d i n t h i s s t u d y s t o r e l a r g e q u a n t i t i e s of c o a l e x t r a c t e d from mines t h a t emit l a r g e volumes of methane ( t a b l e 1) and, t h e r e f o r e , methane accumulat ions i n t hese s i l o s a r e p o s s i b l e i f s u f - f i c i e n t v e n t i l a t i o n i s no t main ta ined .
TABLE 1. - General informat ion concerning s i l o s i n v e s t i g a t e d
Mine
Loveridge No. 2 2 . . . F e d e r a l No. 2 . . Val ley Camp No. 3 . . A l l i s o n . . . . . . . . . . . . . . . . .
Do.. . . . . . . . . . . . . . . . . .
Nelms No. I . . . . . . . . Nelms No. 2 . . . . . . . .
Do . . . . . . . . . . . . . . . . . . . .
B e a t r i c e . . . . . . . . . . .
Virginia-Pocahontas No. 1.
Virginia-Pocahontas No. 2 .
Virginia-Pocahontas No. 3 .
Virginia-Pocahontas No. 4 .
Oak Grove . . . . . . . . . .
Number of
s i l o s
1 2 1 1 1
1 1 6
1
1
1
1
1
1
Seam
P i t t s b u r g h . . . . . . . . . . . . . . do . . . . . . . .
. . . . . do . . . . . . . . do . . . . . . . .
. d o . . . . . . . .
Lower F reepor t . . . . . . do . . . . . . . .
do . . . . . . . .
Pocahontas No. 3 . . . . . . do . . . . . . . .
. . . . . do . . . . . . . .
. . . . .do . . . . . . . .
. . . . .do. . . . . . . .
Mary Lee. . . . . . .
Coal s t o r e d
Clean . . Raw.. . . . Clean. . Raw . . . . . . Clean . .
. . . . Raw Raw. . . . Crushed
Raw. . . . .
Raw. . . .
Raw. . . . .
Raw.. . . .
Raw. . . . .
Raw. . . .
Dai ly mine
produc- t i o n , tons 9,200 4,000 4,200 4,500 4,500
4,500 - -
3,300
3,000
1,100
2,400
850
800
Type of top
Closed .do . .
. . d o . . d o . .
. . do . .
. . d o . .
. . d o . . Open..
. d o . .
. . d o . .
.do. .
.do. .
.do. . Closed w i t h f a n .
Mine methane
emission, MM cu f t /
day 11 .6 8 . 1 2 . 0
. 2
.2
2 . 1 .4 .4
5 . 6
3 . 9
3 . 4
3 . 3
1 . 9
1 . 3
Capaci ty of each
s i l o , tons
10,000 2,500
10,000 6,800
17,400
5,000 2,500 2,000
2,000
2,000
2,000
5,000
5,000
6,000
SILO VENTILATION
S i l o s can be d iv ided i n t o two types accord ing t o t h e i r type of v e n t i l a - t ion- -open t op and c lo sed top . Open-top s i l o s a l low l a r g e a i r movements above t he c o a l p i l e , t h u s reducing t h e hazard of a methane explos ion . However, open- t o p s i l o s provide no p r o t e c t i o n a g a i n s t p r e c i p i t a t i o n , and we t t i ng of some c o a l s i n c r e a s e s t h e chance of spontaneous combustion. Furthermore, t h e move- ment of l a r g e volumes of a i r through a s i l o can r e a d i l y e n t r a i n d u s t i n t o t h e atmosphere.
Although c losed- top s i l o s provide t h e p r o t e c t i o n n o t a f fo rded by open-top s i l o s , methane may accumulate above t he c o a l p i l e dur ing s t o r a g e of gassy c o a l s . V e n t i l a t i o n i s provided by v a r i o u s types of openings a t t h e top of the s i l o . Na tu ra l l y v e n t i l a t e d s i l o s depend upon wind t o move a i r through t h e openings, a l though some s i l o s employ exhaust f ans t o i n s u r e s u f f i c i e n t a i r movement.
Typ ica l l y , v e n t i l a t i o n of c lo sed - top s i l o s i s through r e c t a n g u l a r ho l e s approximately 1 by 2 f e e t , spaced a long t h e o u t e r edge of t h e s i l o immediately below t h e conc re t e r o o f . This scheme i s s u b j e c t t o s l i g h t v a r i a t i o n s . For example, i n t h e s i l o a t Nelms No. 1 mine, t h e s i d e ven t ho l e s a r e expanded i n t o a s i n g l e 18-inch-high s l i t , s t a r t i n g a t t h e p o i n t where t h e conveyor b e l t c r o s s e s t h e s i d e of t h e s i l o , t o a p o i n t halfway around t h e c i rcumference . Some s i l o s have round, covered d u c t s , 4 t o 10 inches i n d iameter , t h a t p ro - t r u d e through t h e roof t o provide a d d i t i o n a l openings f o r v e n t i l a t i o n . Open- i ngs on t h e roof such a s access ho l e s , i n s p e c t i o n h o l e s , and open space around t h e t r a n s f e r p o i n t and conveyor b e l t a l s o enhance a i r c i r c u l a t i o n .
When a i r movement due t o t h e p r e v a i l i n g wind i s i n s u f f i c i e n t o r methane emiss ion i s high, exhaust f ans a r e mounted on t op of t h e s i l o . I n a de s ign used a t t he OakGrovemine, e i g h t I-beams suppor t t he conc re t e r o o f . To i n s u r e adequate v e n t i l a t i o n , 8 - by 16-inch v e n t ho l e s appear on one s i d e of t h e s i l o on ly , one f o r each of t h e n ine spaces between t h e I-beams. On t h e o t h e r s i d e of t h e s i l o , a meta l duc t pa s se s up through t h e roof from each space and mani- f o l d s i n t o a 30- inch exhaust f a n powered by a 13.4-bhp motor. A i r sweeps through t h e s i l o and flows p a r a l l e l a long t h e I-beams a t a t o t a l r a t e of 16,600 c u f t l m i n .
A compromise between an open- and c losed- top arrangement i s used a t t h e Nelms No. 2 mine. Here, a c l u s t e r of s i x open-top s i l o s i s covered by a s l a n t e d meta l roof mounted high above t h e t op edge. This a l lows f r e e a i r movement whi le p rov id ing f a i r p r o t e c t i o n a g a i n s t p r e c i p i t a t i o n .
SILO USAGE
Coal f r e s h l y mined from a working f ace may be t empora r i l y s t o r e d under- ground i n smal l ba tches and t hen brought t o t he s u r f a c e . I n a t y p i c a l p ro - c e s s i n g ope ra t i on where s i l o s a r e used, c o a l i s conveyed by b e l t and dropped i n t o t h e t op of t h e raw c o a l s i l o dur ing each mining s h i f t . Coal i s unloaded from t h e raw-coal s i l o through f eede r s i n t h e s i l o base , onto a conveyor b e l t , and i n t o t h e p r e p a r a t i o n p l a n t a t a cont inuous r a t e determined by t h e c a p a c i t y
of t h e p l a n t . Since the p l a n t capac i ty i s usua l ly l a rge enough t o handle a f u l l day ' s mine product ion i n one p l a n t s h i f t , c o a l does no t normally remain i n t h e raw c o a l s i l o more than 24 hours. Af ter processing, t he c o a l i s con- veyed by b e l t to the c lean-coal s i l o where it w i l l be loaded onto a u n i t t r a i n . Unit t r a i n s a r e loaded a s o f t e n a s d a i l y o r a s seldom a s weekly.
CONVEYOR BELT GRAB SAMPLES
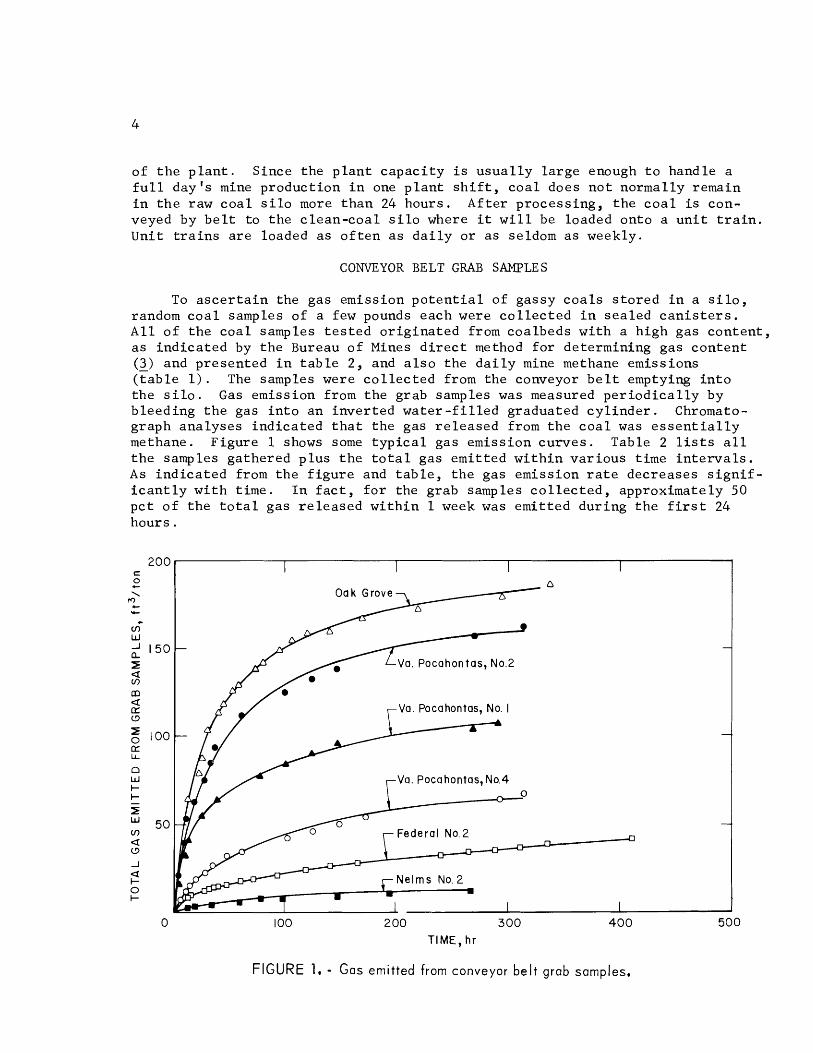
To a s c e r t a i n the gas emission p o t e n t i a l of gassy c o a l s s to red i n a s i l o , random c o a l samples of a few pounds each were c o l l e c t e d i n sea led c a n i s t e r s . A l l of t he coa l samples t e s t e d o r ig ina ted from coalbeds with a high gas content , a s indica ted by t h e Bureau of Mines d i r e c t method f o r determining gas content (3) and presented i n t a b l e 2 , and a l s o the d a i l y mine methane emissions ( t a b l e 1). The samples were c o l l e c t e d from the conveyor b e l t emptying i n t o the s i l o . Gas emission from the grab samples was measured p e r i o d i c a l l y by bleeding t h e gas i n t o an inver ted w a t e r - f i l l e d graduated c y l i n d e r . Chromato- graph analyses indica ted t h a t t he gas re leased from t h e c o a l was e s s e n t i a l l y methane. Figure 1 shows some t y p i c a l gas emission curves . Table 2 l i s t s a l l t h e samples gathered p lus t h e t o t a l gas emit ted wi th in var ious time i n t e r v a l s . A s i nd ica t ed from the f i g u r e and t a b l e , t h e gas emission r a t e decreases s i g n i f - i c a n t l y wi th time. I n f a c t , f o r the grab samples c o l l e c t e d , approximately 50 pc t of t h e t o t a l gas r e l eased wi th in 1 week was emit ted during t h e f i r s t 24 hours .
I I I
Va. Pocahontas, No.2
Va. Pocahontas, No. I
Va. Pocahontas, No.4 0
-,
100 2 0 0 3 0 0 400 TIME, h r
FIGURE 1. - G a s e m i t t e d f r o m c o n v e y o r b e l t g r a b s a m p l e s .

TABLE 2 . - Gas emiss ion from g r a b samples
2 ~ a s h e s i n d i c a t e t h a t measurements were t e rmina ted s i n c e gas was no longer be ing e m i t t e d .
3 ~ m i s s i o n curves f o r t h e s e samples a r e p l o t t e d i n f i g u r e 1.
S i l o T o t a l gas e m i t t e d , c u f t / t o n a f t e r - - Gas
c o n t e n t , ' c u f t / t o n
PITTSBURGH
Sam- p l e No.
3 weeks2 24 hr 1 week 48 h r
- -
38 .4 1 6 . 7
28.8 26 .6 24.6 31.4
- - -
2 weeks2
1 1 . 2 10.2
11 .5 5 . 8
9 . 0 9 . 1 7 .5
12 .3
2 .0 2 . 8 1 . 0
1 2
3l 2
1 2 3 4
1 2 3
Loveridge, West V i r g i n i a .
F e d e r a l No. 2, West V i r g i n i a .
Va l ley Camp No. 3 . .
A l l i s o n . . . . . . . . . . . . .
LOWER FREEPORT
- -
46.4 1 9 . 8
! } 35.4
- - -
190 190
190 19 0
60-130 60-130 60-130 60-130
60-130 60-130 60-130
} c l e a n .
} Raw.
Clean.
) Raw.
Clean.
13.8 12.9
15.7 7 .5
11.6 11.3
9 .7 14.9
2 .0 2 .9 1 .7
NelmsNo. 1 . . . . . . . . .
. . . . . . . Nelms No. 2 . .
23.4 22.8
28.2 12.2
23.6 22 .0 20.3 26.7
2 .8 4 . 0 4 . 5
60-130 60-130 60-130 60-130
60-130 60-130 60-130 60-130 60-130 60-130 60-130 60-130
4 . 2 4 . 5 4 . 5 4 . 2
5 . 2 5 . 9 4 . 8 4 . 6 5 . 2 4 . 8 4 . 1 4 . 8
POCAHONTAS
7 . 5 8 . 7 7 .9 8 . 2
; - -
5.7 6 . 8 6 . 2 6 . 1
10 .6 1 1 . 3
8 . 7 9 . 1 9 .7 9 . 6 8 . 4 9 .7
B e a t r i c e . . . . . . . . . . . .
Virginia-Pocahontas No. 1.
Vi rg in ia -Pocahontas No. 2 .
Virginia-Pocahontas No. 3 .
Virginia-Pocahontas No. 4 .
1 2 3 4
1 2 3 4 5 6 7
3 8
; I - -
3 . 3 3 . 6 4 . 2 3 . 8
3 . 6 3 . 1 3 . 3 3 . 3 3 . 7 3 . 4 2 . 8 3 . 3
350-600 350-600
350-600
350-600 350-600
350-600
350-600
Raw.
.
MARY LEE Oak Grove. . . . . . . . . . .
1 2
1
1 2
1
1
178 .1
67.6
106 .3 33 .6
18.4
31 .8
8 5 . 8 63.9
55.0
7 1 . 1 3 0 . 7
1 4 . 2
20.5
l ~ i r e c t -method r e s u l t s .
500 5 00 500 500
197.9 9 5 . 3 1 5 0 . 5
93 .0
145.8 47.0
26.0
5 3 . 0
31 2 3 4
230.9 179.6
109.2
163.6 43 .7
32 .8
68 .2
121.8 120.0 101.7 45 .9
85 .8 8 5 . 9 67 .4 3 1 . 1
242.6 189.8
115.0
170.4 4 4 . 2
3 5 . 5
75 .5
166.6 161.5 145.9 64 .0
0 Raw.
186.2 179.2 165.5 7 2 . 1
198 .9 191.3 178.2 77.4
} Raw.

According t o Miiller ( 4 ) , - t h e t o t a l gas emi t t ed , Q , c a n be expressed a s f o l lows :
where a i s a c o n s t a n t , F i s t h e c o a l tonnage, t i s t h e t ime , and t h e exponent x ranges from 0.3 f o r c o a l s i z e under 8 mm t o 0 .7 f o r g r a i n s i z e between 25 t o 120 mm. F igure 2 i s a log- log p l o t of t h e gas emi t ted pe r t o n dur ing t h e f i r s t 48 hours f o r t h e Fede ra l No. 2 sample shown i n f i g u r e 1. Here, t h e i n i - t i a l t ime, t = 0, i s t h e t ime when t h e c o a l i s t aken from the s i l o b e l t . The s l o p e of t h e dashed l i n e , 0 .54 , corresponds t o t h e exponent x f o r t h i s c o a l . The b e s t f i t t o t h e o t h e r f i v e emission curves shown i n f i g u r e 1 r e s u l t e d i n exponents t h a t ranged from 0 .4 t o 0 . 8 . Although the se v a l u e s a r e c o n s i s t e n t w i t h those ob ta ined by Miiller, it should be noted t h a t Miiller chose t h e t ime of c u t t i n g t h e c o a l a s t = 0. The choice of i n i t i a l t ime does a f f e c t t h e exponent . For example, ignor ing t h e f i r s t 2 hours of gas emission from t h e Fede ra l No. 2 g rab sample, which would be equ iva l en t t o an a d d i t i o n a l 2-hour de l ay i n t r a n s p o r t i n g t h e c o a l t o t h e s i l o b e l t a l t e r e d t h e exponent t o 0 .68 .
I 2 4 6 8 10 20 30 405060 TIME, hr
F IGURE 2. - Gas emi t ted from grab sample a t Federa l No. 2 mine ( log- log lot).

The grab-sample emission curve i n f i g u r e 2 can be used t o es t imate gas emission from the Federa l No. 2 s i l o . Using t h i s emission r a t e f o r t he c o a l and assuming t h a t an empty s i l o i s f i l l e d a t a cons tant r a t e over an 8-hour s h i f t , t he methane emission r a t e from t h e s tored c o a l i s shown i n f i g u r e 3 . Also superimposed i s t he q u a n t i t y of c o a l s tored versus time. The d e r i v a t i o n of t h i s emission curve i s presented i n the appendix. The emission r a t e inc reases wi th time t o the 0.54 power u n t i l the s i l o i s f i l l e d , t hen it begins t o decrease . The h ighes t emission r a t e occurs when the s i l o i s j u s t f i l l e d ; t h a t i s , when the coa l i s g a s s i e s t and t h e quan t i ty s to red i s maximum. Although the maximum gas emission r a t e i s only about 40 cfm, t h i s could r e s u l t i n a l a rge methane concent ra t ion i n a s h o r t time i f proper v e n t i l a t i o n i s not provided.
0 120 240 360 480 600 720 840 960
TIME, min
FIGURE 3. - Calcu la ted gas emission from a coal s i l o using the Federal No. 2 grab sample and
assuming a constant 8-hour f i l l i n g rate.
METHANE CONCENTRATION ABOVE THE STORED PILE
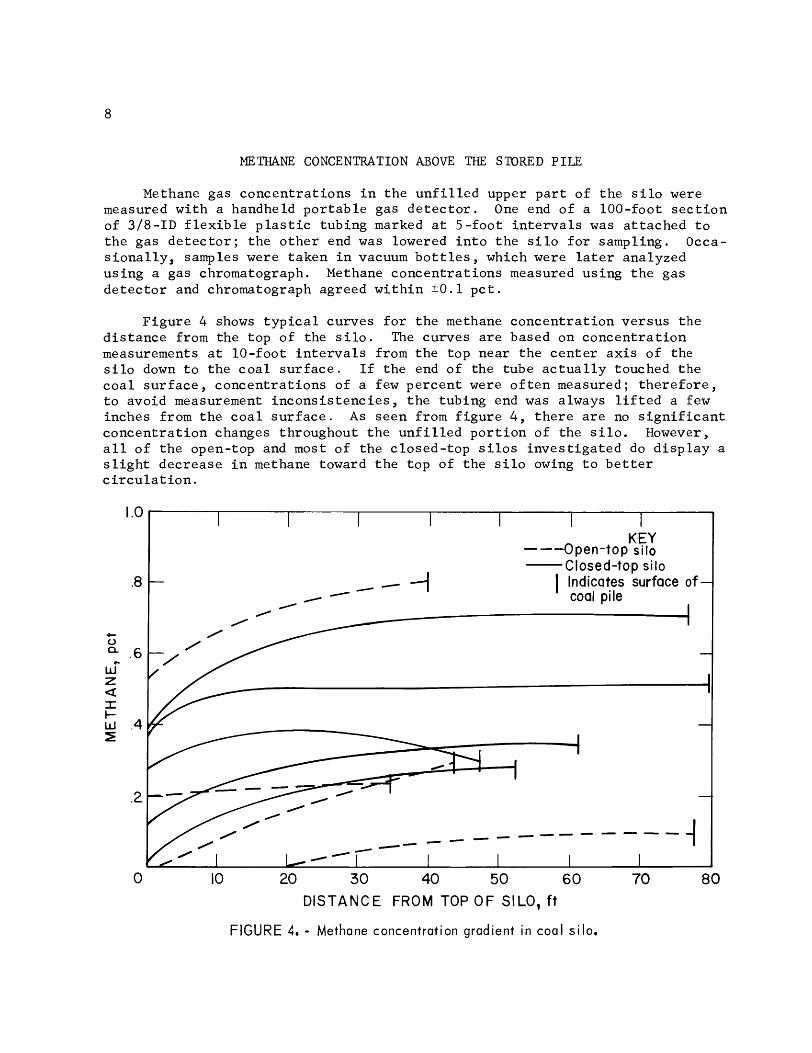
Methane gas concent ra t ions i n the u n f i l l e d upper p a r t of t he s i l o were measured with a handheld po r t ab le gas d e t e c t o r . One end of a 100-foot s e c t i o n of 318-ID f l e x i b l e p l a s t i c tubing marked a t 5- foot i n t e r v a l s was a t tached t o t h e gas d e t e c t o r ; t he o the r end was lowered i n t o t h e s i l o f o r sampling. Occa- s i o n a l l y , samples were taken i n vacuum b o t t l e s , which were l a t e r analyzed using a gas chromatograph. Methane concent ra t ions measured using t h e gas de tec to r and chromatograph agreed wi th in '0.1 p c t .
F igure 4 shows t y p i c a l curves f o r t h e methane concent ra t ion versus t h e d i s t ance from the top of the s i l o . The curves a r e based on concent ra t ion measurements a t 10-foot i n t e r v a l s from t h e top near the cen te r a x i s of the s i l o down t o the c o a l su r face . I f t he end of the tube a c t u a l l y touched t h e coa l su r face , concent ra t ions of a few percent were o f t e n measured; t he re fo re , t o avoid measurement incons i s t enc ie s , t h e tubing end was always l i f t e d a few inches from t h e c o a l su r face . A s seen from f i g u r e 4 , t h e r e a r e no s i g n i f i c a n t concent ra t ion changes throughout t h e u n f i l l e d po r t ion of the s i l o . However, a l l of t h e open-top and most of t he closed-top s i l o s inves t iga t ed do d i s p l a y a s l i g h t decrease i n methane toward t h e top of t he s i l o owing t o b e t t e r c i r c u l a t i o n .
0 10 20 30 40 50 60 70 80
DISTANCE FROM TOP OF SILO, f t
I
FIGURE 4. - Methane concentration gradient in coal s i lo.
KEY ---Open-top silo
Closed-top silo - -- -1 I Indicates surface o f -
/ /
/ coal pile
I I -
I -
I I
-
- -------- -I I
I I

Figu re 5 i s a p l o t of t h e average methane c o n c e n t r a t i o n i n t h e s i l o above t h e c o a l p i l e v e r s u s t h e ga s s ine s s of the c o a l a s determined from t h e random grab samples f o r each s i l o . S ince t h e c o a l i s u s u a l l y s t o r e d f o r approxi - mately 24 hours , t h i s t ime per iod was used t o determine t h e ga s s ine s s o f the c o a l from t h e emission cu rves . The average methane concen t r a t i on above t h e c o a l was es t imated from t h e methane concen t r a t i on midway between the t op of t h e s i l o and t h e c o a l s u r f a c e . For t he s i l o s shown i n f i g u r e 4, t h e d e v i a t i o n from t h e average5 and midway concen t r a t i on i s l e s s t han 10 p c t .
P r i o r t o t h i s i n v e s t i g a t i o n , i t was thought t h a t t h e r e might be a c o r r e - l a t i o n between t h e c o a l ga s s ine s s and t h e average methane c o n c e n t r a t i o n above t h e c o a l s u r f a c e . Higher methane concen t r a t i ons might be observed f o r g a s s i e r c o a l s . However, f i g u r e 5 shows no obvious c o r r e l a t i o n , probably because t h e g a s s i e r c o a l s were s t o r e d i n open-top s i l o s where b e t t e r a i r c i r c u l a t i o n reduces t h e methane concen t r a t i on .
An example of t h i s improved a i r c i r c u l a t i o n i s t h e Bea t r i c e s i l o a t Keen Mountain, Va. ( f i g . 5 ) . I n 1970, t h i s Bea t r i c e s i l o , which was
I 1 1 I I I I 1 - -
y i s o n (raw) - -
Val ley camp No.3 T / Va. Pocahontas, No.2
TJ - 1 I-c-l I 0 I -
1 - - T ~ l l i s o n ( c l e a n )
1 -C+ Nelms No. I
0 - Open-top s i los Closed-top silos w / fan
- T / O ~ ~ Grove -
L F -
T ,Va. Pocahontas. No l 1 - I-o<
(raw) 1 - t 1 I r a o
TOTAL GAS EMITTED FROM AVERAGE GRAB S A M P L E WITHIN 2 4 HOURS, ft3/ton
FIGURE 5. - Average methane concentration in s i l o versus gas emitted wi th in 24 hours from
the correspond ing grab sample.
5The average methane c o n c e n t r a t i o n was determined from t h e methane concent ra - t i o n s t aken from t h e t op of t h e s i l o down t o t h e c o a l s u r f a c e a t 10- foo t i n t e r v a l s .

o r i g i n a l l y cons t ruc t ed a s a c lo sed - top s i l o , exploded. Subsequently, i t was r e c o n s t r u c t e d a s an open-top s i l o , and c u r r e n t t e s t s i n d i c a t e d e s s e n t i a l l y no methane above t h e c o a l .
ME THANE CONCENTRATION W I T H I N THE STORED PILE
To i n v e s t i g a t e t h e methane concen t r a t i on i n t h e c o a l p i l e , a s e c t i o n of po lye thy lene tub ing was extended halfway down i n t o an empty c losed- top s i l o , where i t was bur ied by c o a l a s t h e s i l o was f i l l e d over a n 8-hour p e r i o d . About 2 hours a f t e r t h e s i l o was f i l l e d , a methane c o n c e n t r a t i o n of about 14 p c t was measured i n t h e c o a l p i i e . This i s s i m i l a r t o what one would e s t i m a t e from a methane c a l c u l a t i o n assuming no v e n t i l a t i o n .
Assuming no v e n t i l a t i o n i n t o t h e c o a l p i l e , t h e pe rcen t of methane con- c e n t r a t i o n , C , which i s i n i t i a l l y ze ro , i s governed by t h e fol lowing r e l a t i o n :
where Q , , V , and t a r e t h e gas emission r a t e , f r e e space i n t h e c o a l p i l e , and t ime , r e s p e c t i v e l y . For t he s i l o s t u d i e d , V i s approximately 5 0 , 0 0 0 ~ cu f t , and t he average methane emission during t h e f i r s t 10 hours was about 20 cu f t / m i n . The average methane emission was determined from the random grab samples t aken from t h i s s i l o and us ing equa t i on A-13, g iven i n t h e appendix. Equat ion 2 p r e d i c t s a n approximate methane concen t r a t i on of 21 p c t a f t e r 10 hours .
The f a i r agreement between t h e c a l c u l a t e d and measured concen t r a t i on i n t h e c o a l p i l e i n d i c a t e s t h a t t h e r e was l i t t l e v e n t i l a t i o n throughout t h e p i l e . The methane concen t r a t i on above t h e c o a l p i l e was l e s s t h a n 0 .5 p c t . It appears t h a t a l though t h e methane concen t r a t i on above t he c o a l i s low, l a r g e concen t r a t i ons i n t h e c o a l p i l e may e x i s t .
As noted e a r l i e r , when i n v e s t i g a t i n g t h e a i r space above t h e c o a l p i l e , i f t h e sampling-tube end a c t u a l l y touched t h e c o a l p i l e , methane measurements of a few pe rcen t were ob t a ined . Also, a t some of t h e s i l o s v i s i t e d , t h e workers noted t h a t s i m i l a r methane concen t r a t i ons a r e de t ec t ed below t h e s i l o i n t h e v i c i n i t y of t h e f eede r s when c o a l i s being unloaded from t h e s i l o . S imi l a r problems have been r epo r t ed dur ing s t o c k p i l e ope ra t i ons (7 ) , f u r t h e r i n d i c a t i n g t h a t t h e r e can be high methane concen t r a t i ons w i t h i n tKe c o a l p i l e .
Large methane concen t r a t i ons i n t h e c o a l p i l e might gene ra t e an exp los ive atmosphere below the s i l o dur ing rec la iming ope ra t i ons i f proper v e n t i l a t i o n i s n o t main ta ined . A t t he Val ley Camp No. 3 mine i n West V i rg in i a , two 10,000- cu f t / m i n exhaust f ans f o r c e a i r i n t o t h e v i c i n i t y of t h e f e e d e r s , reduc ing t h e methane c o n c e n t r a t i o n below 1 p c t dur ing rec la iming ope ra t i ons . The f a n s o p e r a t e s imul taneous ly w i th t h e conveyor b e l t t h a t unloads c o a l ou t of t he s i l o .
^The f r e e space i n t h e c o a l p i l e was determined by c a l c u l a t i n g t h e empty v o l - ume of the s i l o minus t h e volume of c o a l s t o r e d us ing 1 . 3 g/cu cm a s t he d e n s i t y .
Although t h i s i n v e s t i g a t i o n was designed t o s tudy t h e p o s s i b i l i t y of hazardous methane concen t r a t i ons i n and above the c o a l p i l e , it appears now t h a t a followup s tudy of the s i l o rec la iming a r e a i s a l s o war ran ted .
CONC LUS IONS
1. Even f o r s t o r e d gassy c o a l s , open-top s i l o s appear t o provide s u f f i - c i e n t v e n t i l a t i o n above t he c o a l t o keep t he methane c o n c e n t r a t i o n f a r below 1 p c t . I f degrada t ion of the c o a l i s a concern, a s l a n t e d meta l roof of t h e s o r t used a t t he Nelms No. 2 mine can prov ide p r o t e c t i o n whi le main ta in ing good v e n t i l a t i o n .
2 . High methane concen t r a t i ons can e x i s t i n t he c o a l p i l e . It i s pos- s i b l e t h a t t h i s gas i s r e l e a s e d dur ing rec la iming o p e r a t i o n s , r e s u l t i n g i n h igh concen t r a t i ons below t h e s i l o i f t h i s a r e a i s no t v e n t i l a t e d p rope r ly . However, t o s u b s t a n t i a t e t h i s , f u r t h e r r e s e a r c h i s r e q u i r e d .

Bark ley , J . *R. The S t o r a g e o f C o a l . BuMines I C 7235, 1943, 14 pp.
F l i igge , G . Methane Gas Emiss ions Dur ing Mining and Hau l ing . G luckauf , v . 25 , May 1972, 7 p p .
K i s s e l l , F . N . , C . M. McCulloch, and C . H . E l d e r . The D i r e c t Method o f De te rmin ing C o n t e n t s of Coalbeds f o r V e n t i l a t i o n Design. BuMines R I 7767, 1973, 17 pp .
Mii l le r , H . R e s t g a s i n h a l t und Ausgasung d e r F z r d e r k o h l e ( R e s i d u a l and E m i t t e d Gas Dur ing Coal H a u l a g e ) . Ph.D. D i s s e r t a t i o n , Tech. Univ. B e r l i n , B e r l i n , Germany, 1966, 162 p p .
P a r r y , V . F . , and J . B . Goodman. S t o r a g e of Subbi tuminous Coa l i n B i n s . BuMines R I 3587, 1941, 1 0 pp.
Rowan, T. Spontaneous Combustion and E x p l o s i o n s O c c u r r i n g i n C o a l Cargoes : T h e i r T rea tmen t and P r e v e n t i o n . E. and F . N . Spon, London, 1882, 97 pp .
S t a h l , R . W . , and C . J . D a l z e l l . Recommended S a f e t y P r e c a u t i o n s f o r A c t i v e Coa l S t o c k P i l i n g and Rec la iming O p e r a t i o n s . BuMines I C 8256, 1965, 7 p p .
U.S. Code o f F e d e r a l R e g u l a t i o n s . T i t l e 30--Minera l R e s o u r c e s ; C h a p t e r I-- Mining Enforcement and S a f e t y A d m i n i s t r a t i o n ; Subchap te r 0- -Coal Mine H e a l t h and S a f e t y ; P a r t 77--Mandatory S a f e t y S t a n d a r d s , S u r f a c e Coa l Mines and S u r f a c e Work Areas of Underground Coal Mines . F e d e r a l R e g i s t e r , v . 39 , No. 126, June 28 , 1974, pp . 24006-24008.
3 T i t l e e n c l o s e d i n p a r e n t h e s e s i s t r a n s l a t i o n from t h e language i n which t h e i t e m was o r i g i n a l l y p u b l i s h e d .
APPENDIX. - -THEORE TICAL CALCULATION OF THE GAS EMISSION FROM A COAL SILO
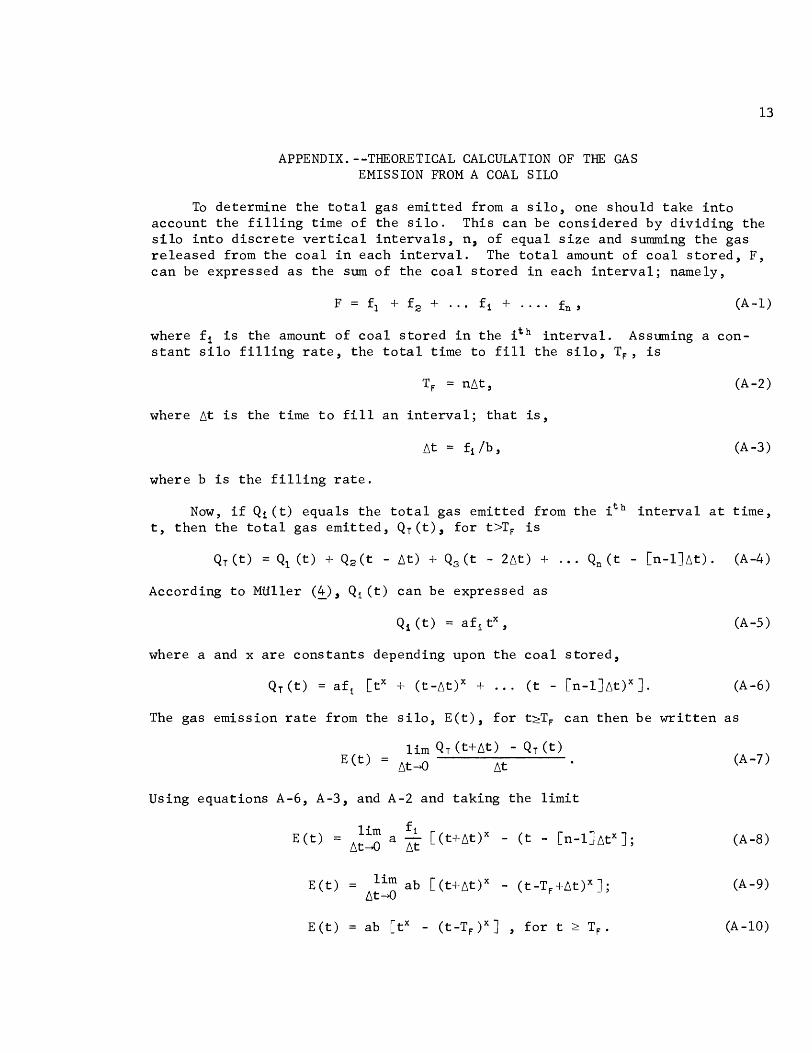
To determine t h e t o t a l gas emit ted from a s i l o , one should take i n t o account the f i l l i n g time of the s i l o . This can be considered by d iv id ing the s i l o i n t o d i s c r e t e v e r t i c a l i n t e r v a l s , n, of equal s i z e and summing the gas r e l eased from t h e c o a l i n each i n t e r v a l . The t o t a l amount of c o a l s to red , F, can be expressed a s the sum of the coa l s to red i n each i n t e r v a l ; namely,
where f i i s the amount of c o a l s to red i n the ith i n t e r v a l . Assuming a con- s t a n t s i l o f i l l i n g r a t e , the t o t a l time t o f i l l t h e s i l o , T F , i s
where A t i s the time t o f i l l an i n t e r v a l ; t h a t i s ,
where b i s t h e f i l l i n g r a t e .
Now, i f Qi ( t ) equals t he t o t a l gas emitted from the ith i n t e r v a l a t t ime, t , then t h e t o t a l gas emi t ted , Q r ( t ) , f o r t>TF i s
Q~ ( t ) = Ql ( t ) + Q2 ( t - At) + Q3 ( t - 2At) + . . . Qn ( t - [ n - l l ~ t ) . (A-4)
According t o Miiller (4) , - Q , ( t ) can be expressed a s
Qi ( t ) = a f , tX,
where a and x a r e cons tants depending upon the c o a l s to red ,
Q T ( t ) = a f , [tX + ( t - ~ t ) ~ + . . . ( t - [ n - l ] ~ t ) ~ 1. (A-6)
The gas emission r a t e from the s i l o , E ( t ) , f o r t>TF can then be w r i t t e n a s
Using equat ions A-6, A-3, and A-2 and tak ing the l i m i t
E ( t ) = ab [tX - ( t -TF) ' ] , f o r t r T F .

S i m i l a r l y f o r t<TF by summing t h e gas emitted f o r only t h e f i l l e d i n t e r v a l s , t he t o t a l gas emission r a t e can be expressed a s
E ( t ) = ab tX , f o r t s TF . (A-11)
The t o t a l gas emit ted can be determined from t h e emission r a t e s by i n t e g r a t i o n ; t h a t i s ,
ab Q~ = - t x + l , f o r t I TF;
x+l (A-12)
and ab [tX+l - ( t -T,)X+l] , f o r t 2 T F . QT =
Fliigge (2) developed an equat ion s i m i l a r t o A-12 f o r t he spec ia l i zed case x = 0.5 us ing a double i n t e g r a t i o n technique.
-U.S. GOVERNMENT PRINTING OFFICE: 1978-703-103129