silos – verilog simulator - silvaco · silos – verilog simulator starting silos 8...
TRANSCRIPT

Silos – Verilog Simulator
Compliant to VERILOG - 2001
SILOS – Verilog Simulator
• Introduction • Starting Silos Project • Explorer and Analyzer • Source Code Debugging • State Machine Design Entry • Advanced Debugging Features • Finite State Machine Example • Gate Level Debugging
Agenda
2
SILOS – Verilog Simulator
• Verilog(IEEE 1364) Digital Logic Simulator • Analysis and Debugging Environment
• Waveform Viewer • Hierarchical Browser • Text editor • Code Coverage • Finite State Machine Tool • Single Step with Breakpoints • Trace Gate and RTL events
What is Silos
3
SILOS – Verilog Simulator
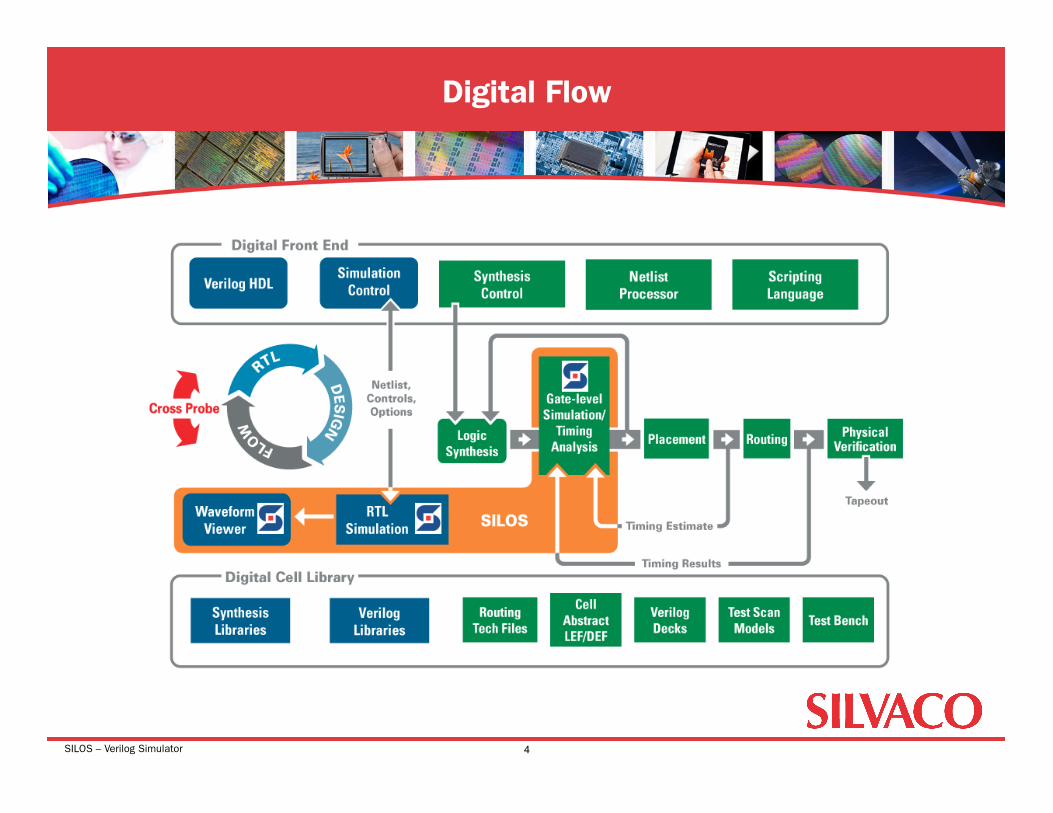
Digital Flow
4
SILOS – Verilog Simulator
• Silos supports • Windows • SUN Solaris • Linux platforms
Silos Platforms
5

SILOS – Verilog Simulator
• Current • FPGA (Xilinx, Altera, QuickLogic, Actel, etc.) • PLD • General Digital Logic
• Future • Analog Mixed-Signal
Silos Markets
6

SILOS – Verilog Simulator
• Introduction • Starting Silos Project • Explorer and Analyzer • Source Code Debugging • State Machine Design Entry • Advanced Debugging Features • Finite State Machine Example • Gate Level Debugging
Agenda: Starting Silos Project
7

SILOS – Verilog Simulator
Starting Silos
8
“Contents” will display the contents for the Silos User’s Manual. The “New Features” menu provides a short help file on the new features for the Silos release.
SILOS – Verilog Simulator
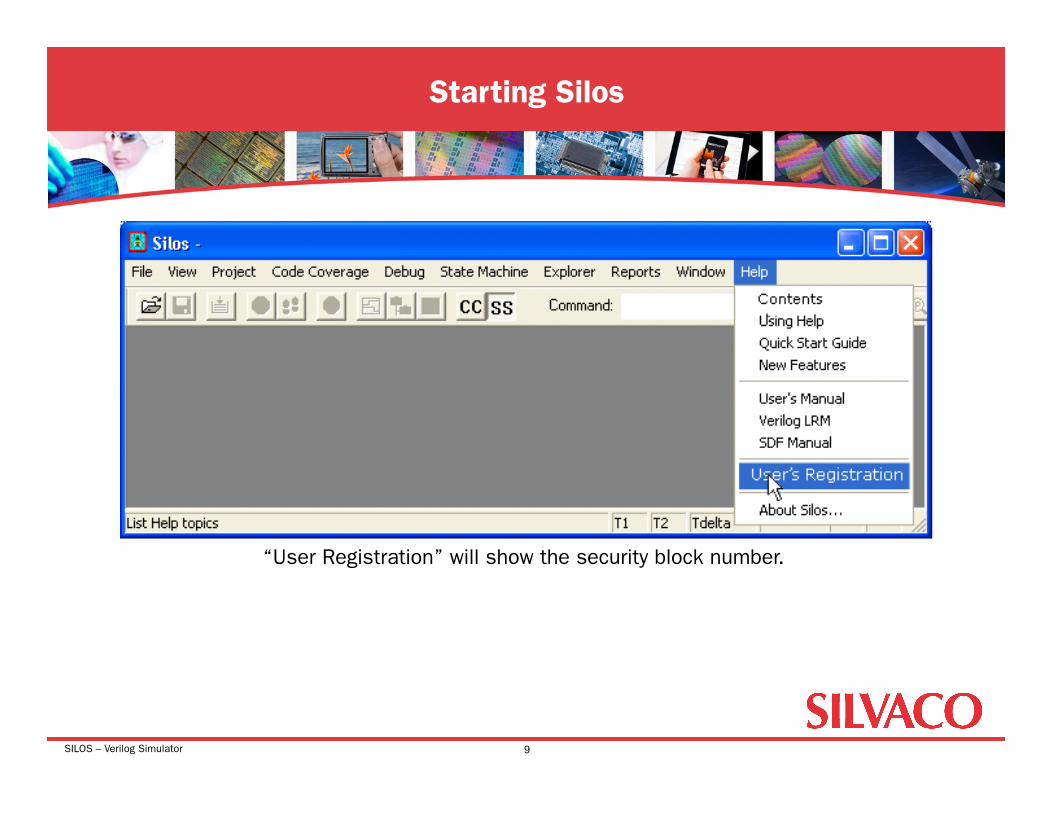
Starting Silos
9
“User Registration” will show the security block number.
SILOS – Verilog Simulator
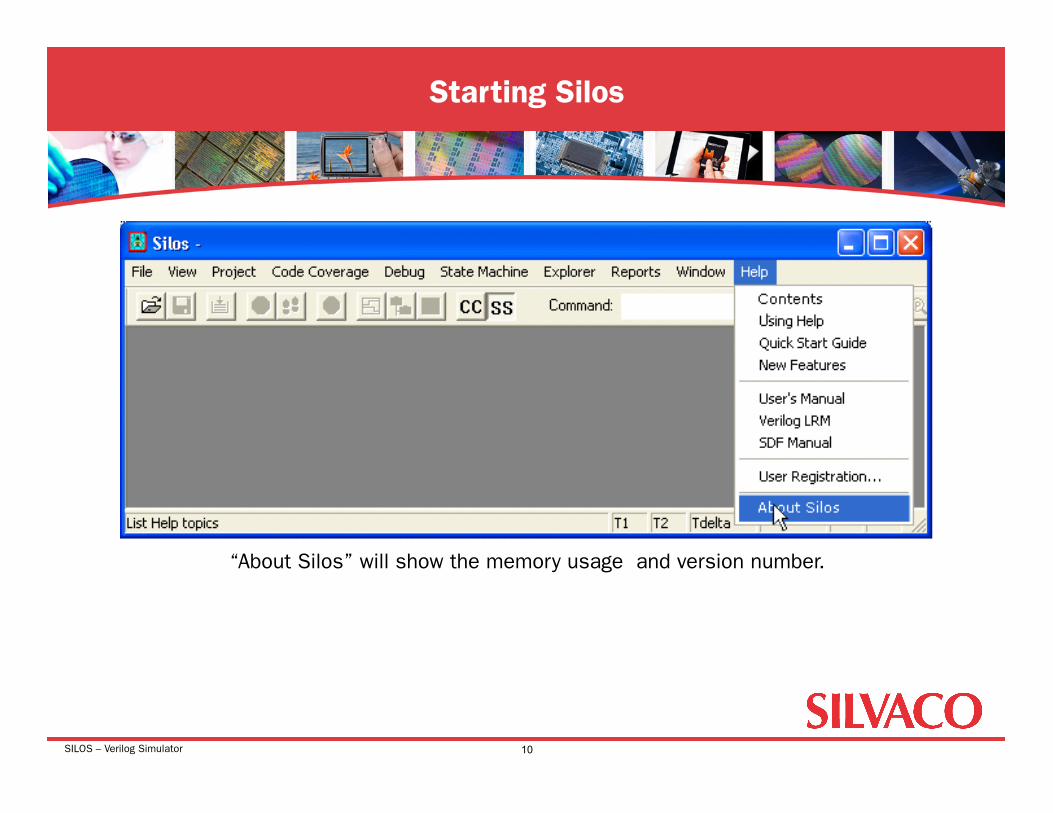
Starting Silos
10
“About Silos” will show the memory usage and version number.
SILOS – Verilog Simulator
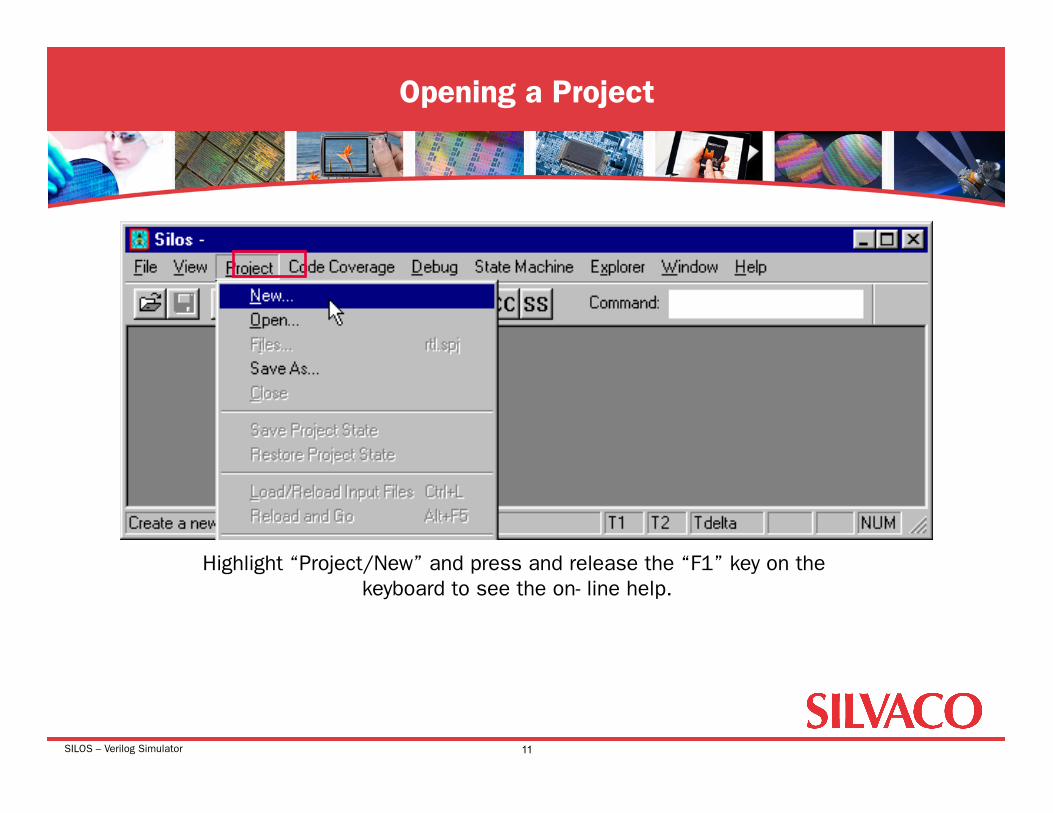
Opening a Project
11
Highlight “Project/New” and press and release the “F1” key on the keyboard to see the on- line help.

SILOS – Verilog Simulator
Create a Project
12
Project name.rtl
SILOS – Verilog Simulator
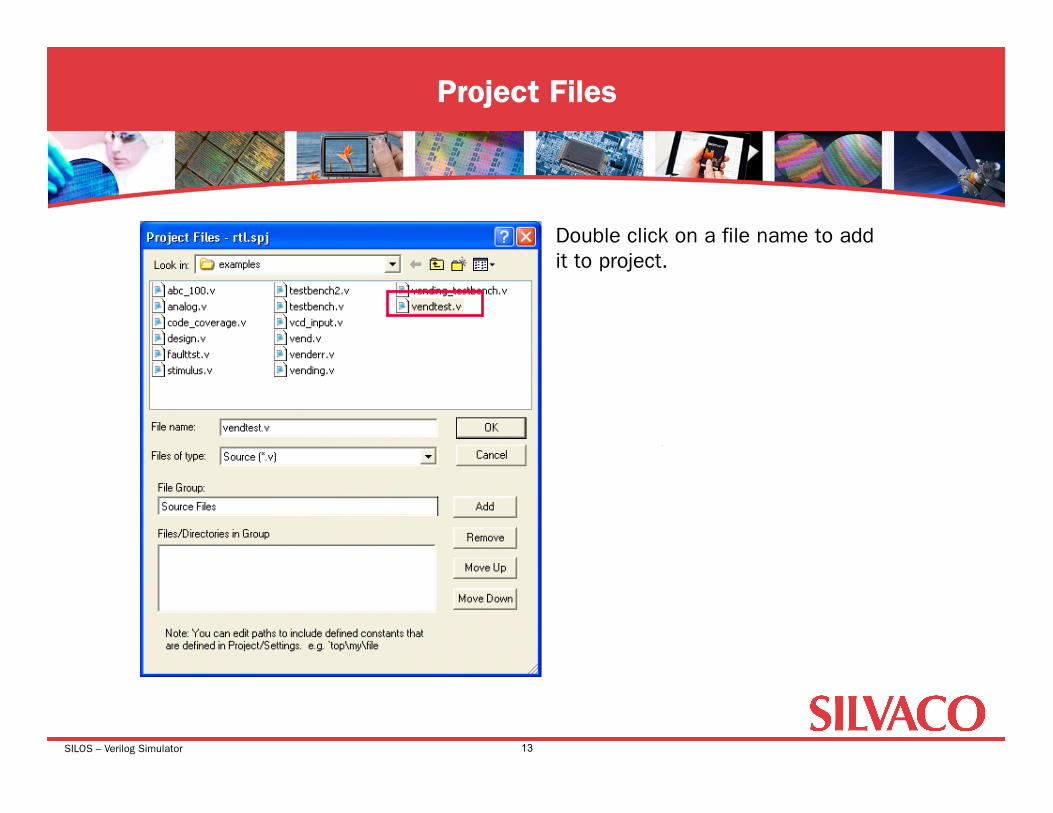
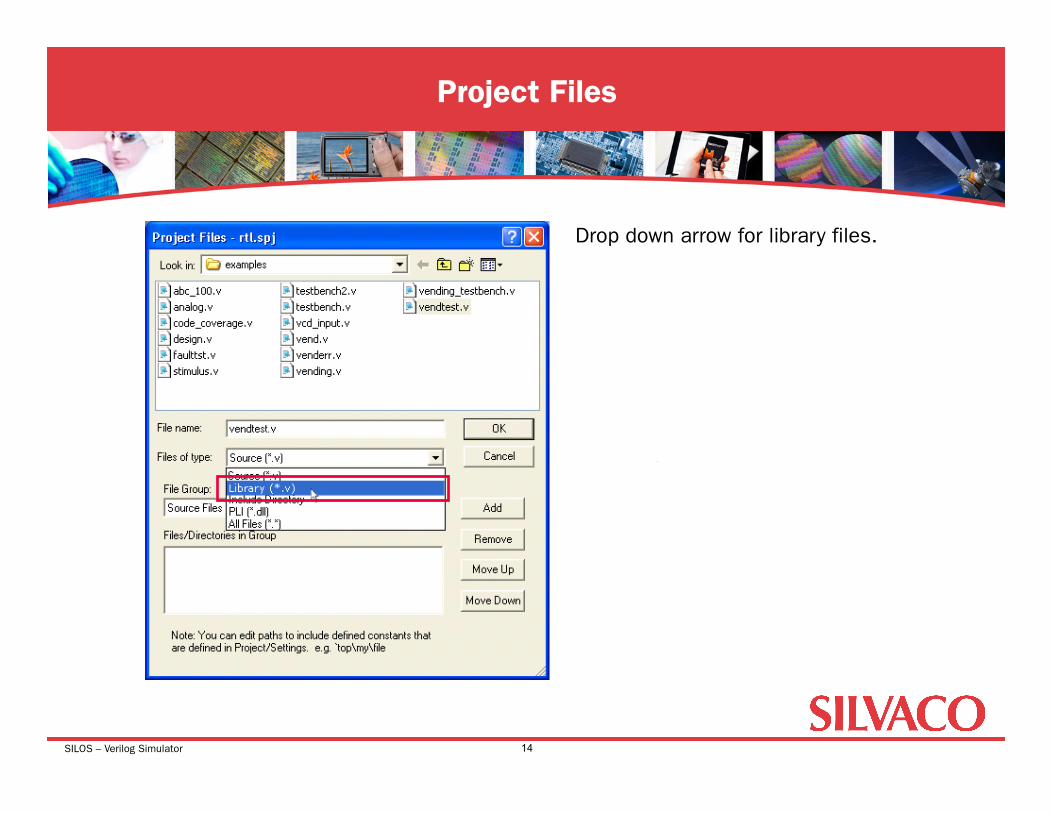
Project Files
13
Double click on a file name to add it to project.
SILOS – Verilog Simulator
Project Files
14
Drop down arrow for library files.
SILOS – Verilog Simulator
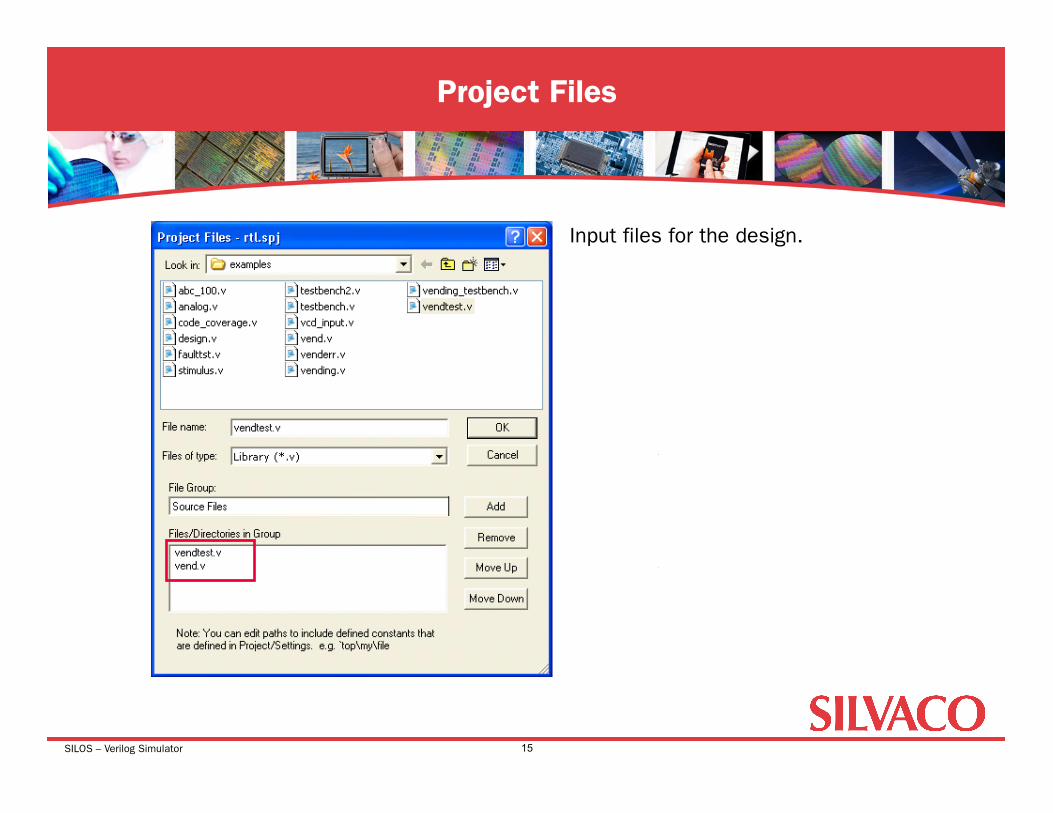
Project Files
15
Input files for the design.
SILOS – Verilog Simulator
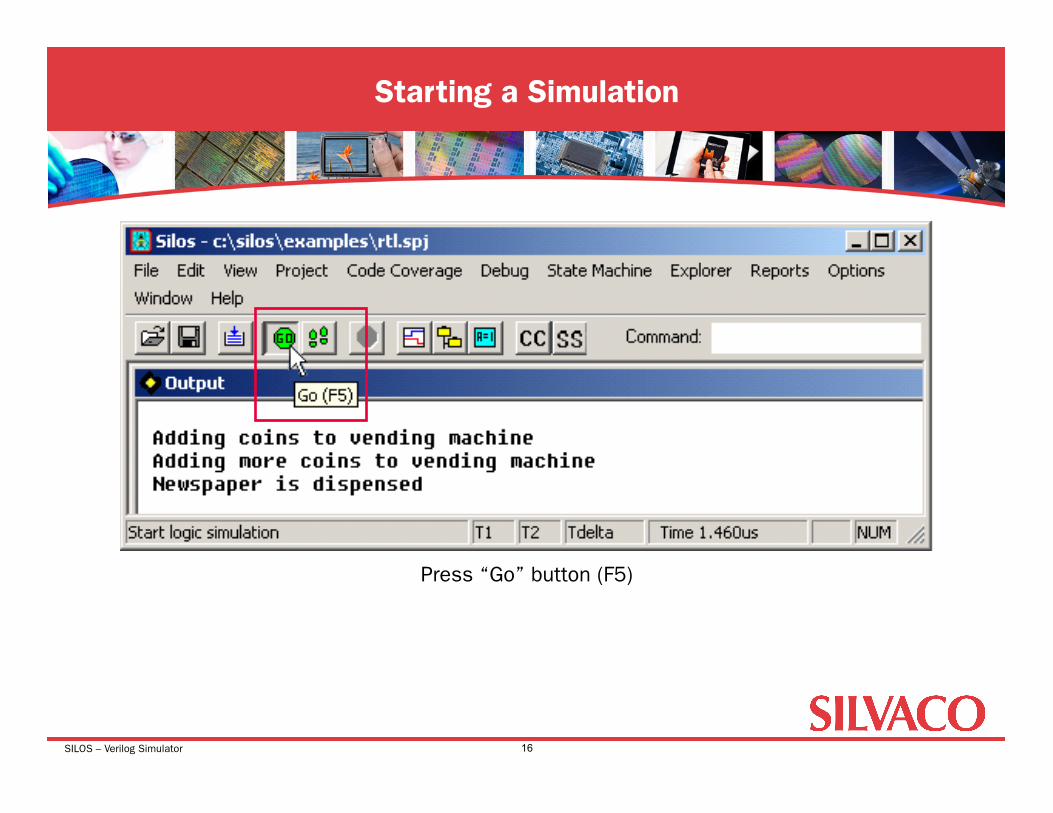
Starting a Simulation
16
Press “Go” button (F5)
SILOS – Verilog Simulator
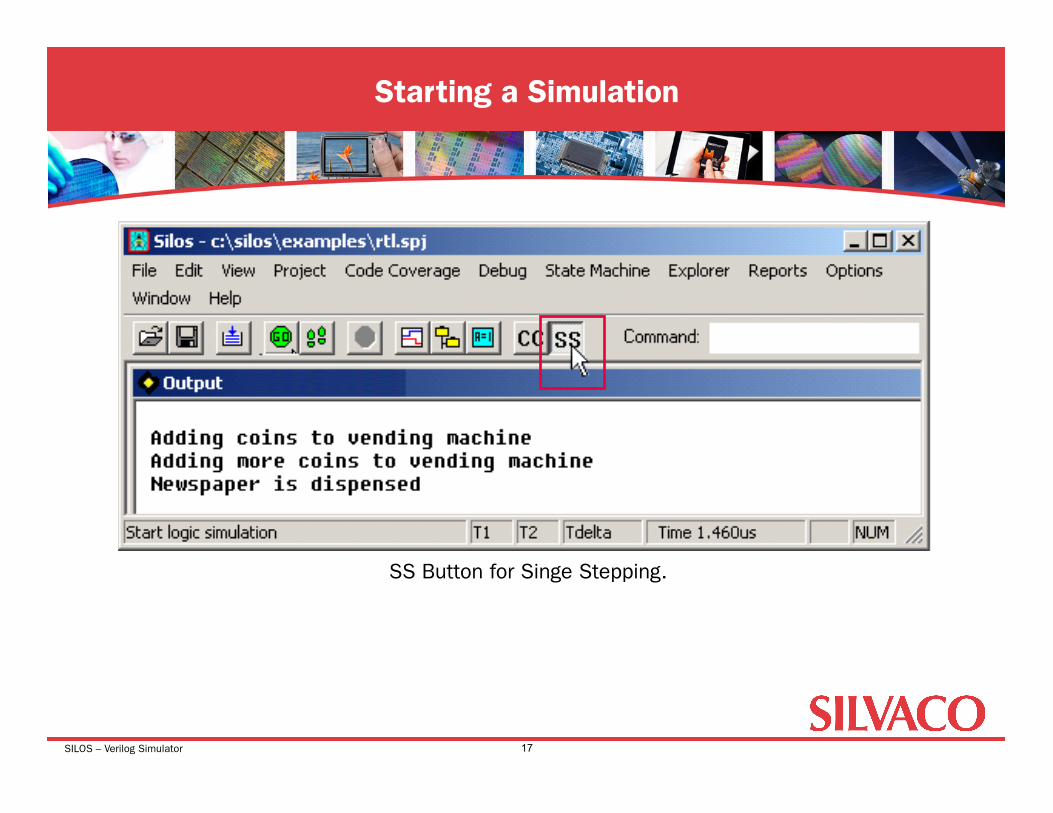
Starting a Simulation
17
SS Button for Singe Stepping.

SILOS – Verilog Simulator
Starting a Simulation
18
Output Window.
SILOS – Verilog Simulator
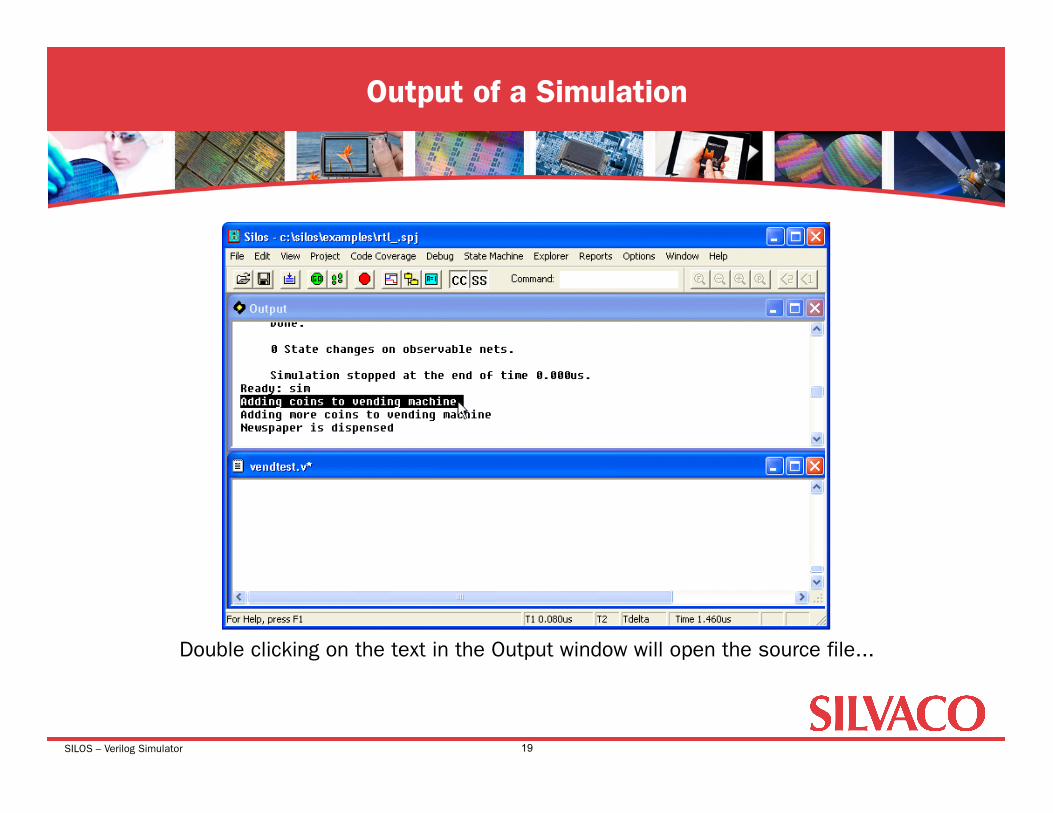
Output of a Simulation
19
Double clicking on the text in the Output window will open the source file...
SILOS – Verilog Simulator
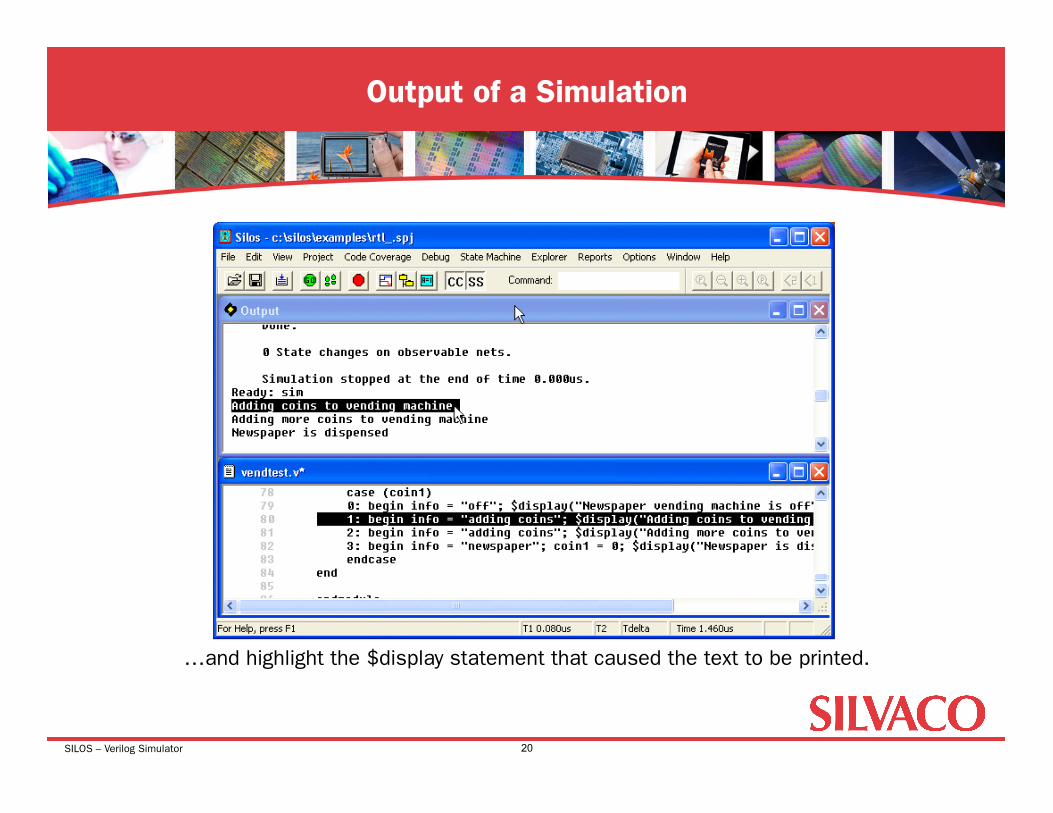
Output of a Simulation
20
…and highlight the $display statement that caused the text to be printed.

SILOS – Verilog Simulator
• Introduction • Starting Silos Project • Explorer and Analyzer • Source Code Debugging • State Machine Design Entry • Advanced Debugging Features • Finite State Machine Example • Gate Level Debugging
Agenda: Explorer and Analyzer
21
SILOS – Verilog Simulator
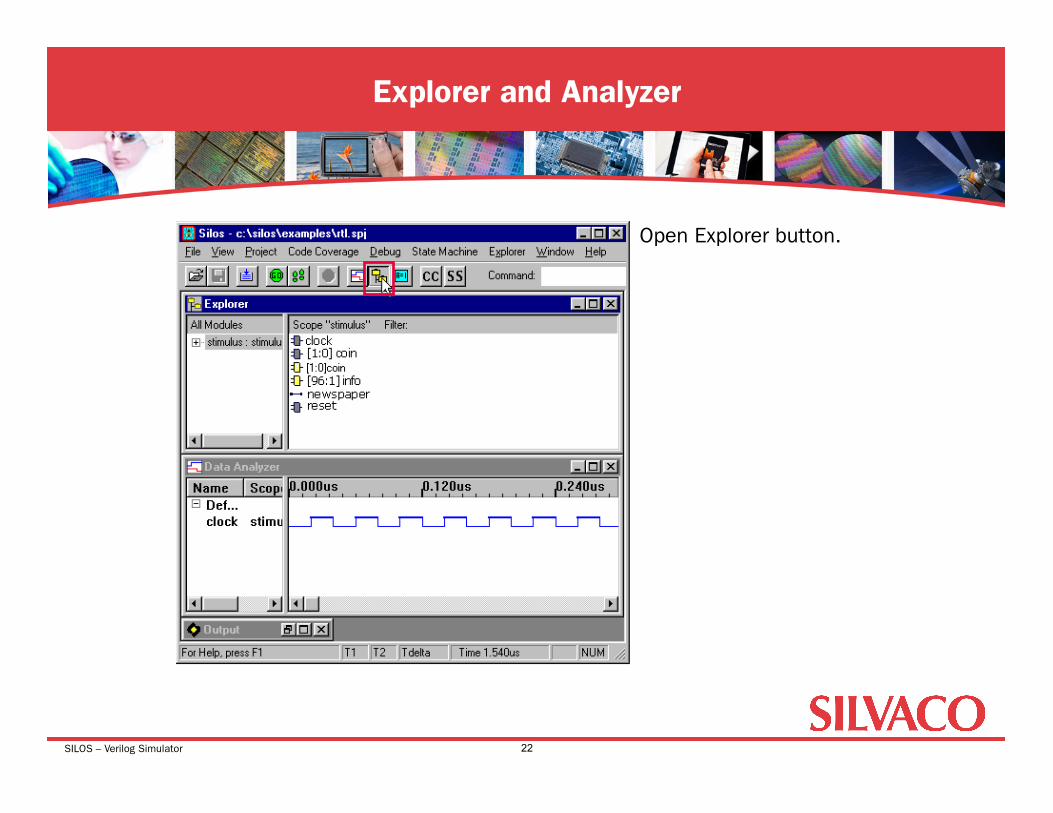
Explorer and Analyzer
22
Open Explorer button.
SILOS – Verilog Simulator
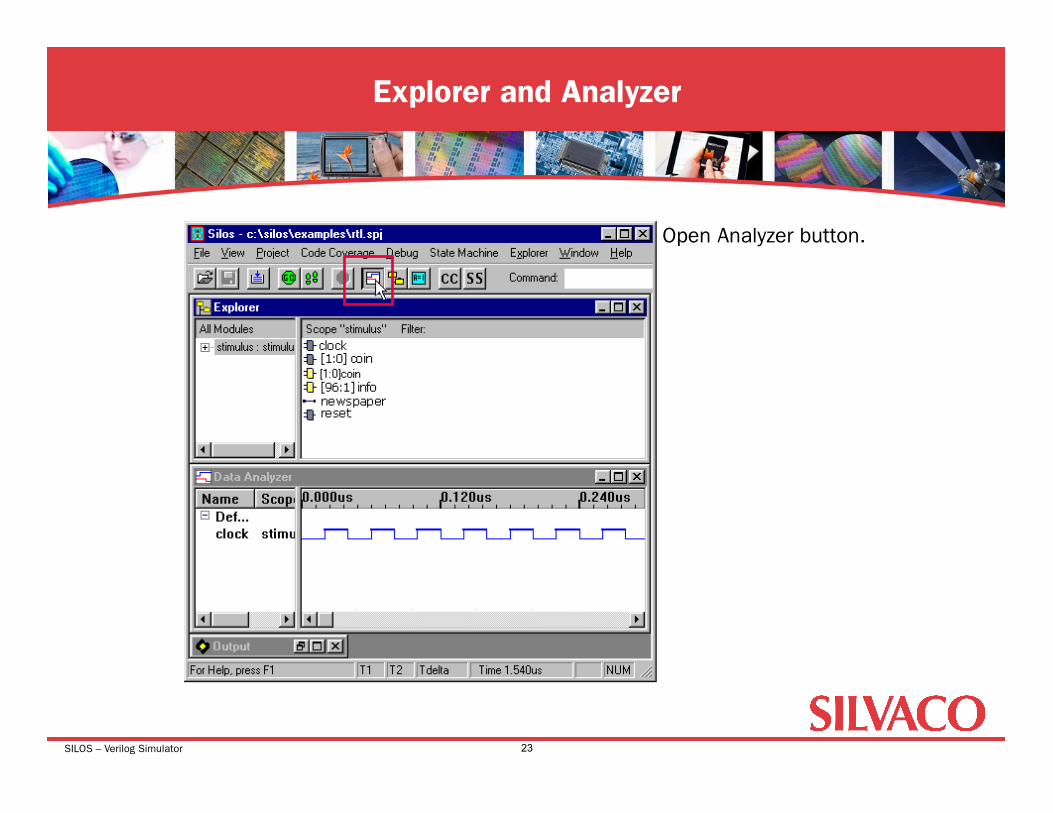
Explorer and Analyzer
23
Open Analyzer button.
SILOS – Verilog Simulator
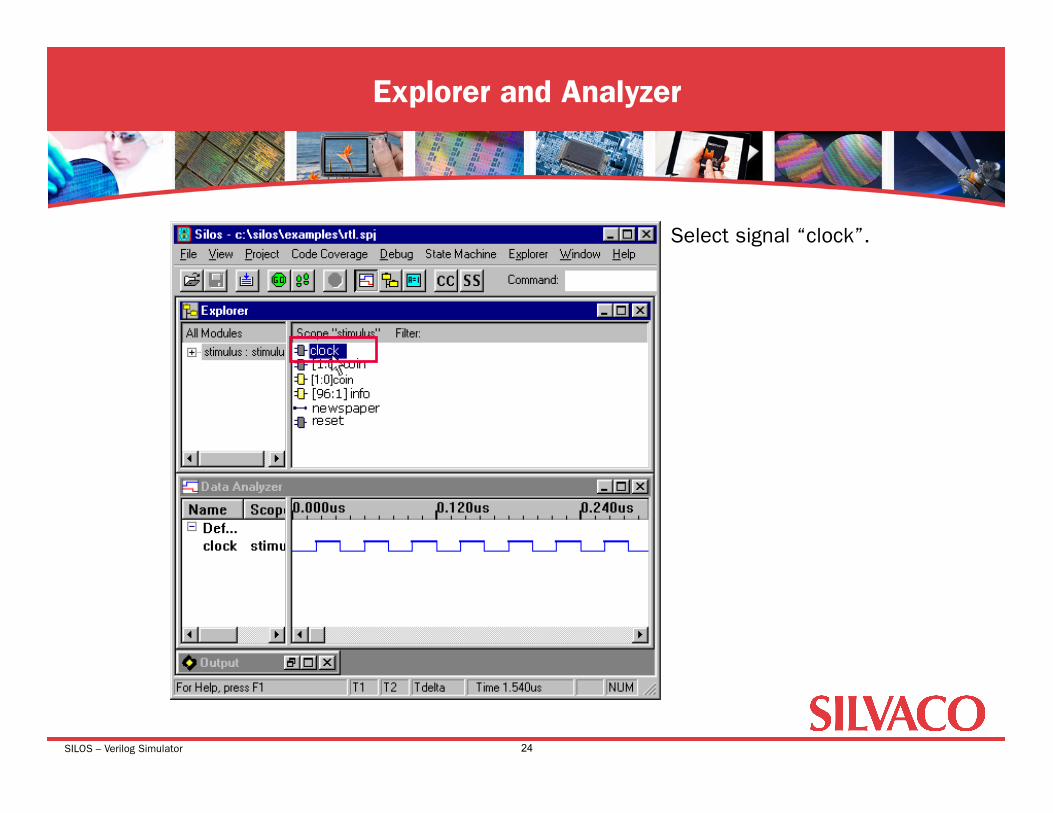
Explorer and Analyzer
24
Select signal “clock”.

SILOS – Verilog Simulator
Explorer and Analyzer
25
Hold down Ctrl or Shift keys while using the mouse to select additional signals.
SILOS – Verilog Simulator
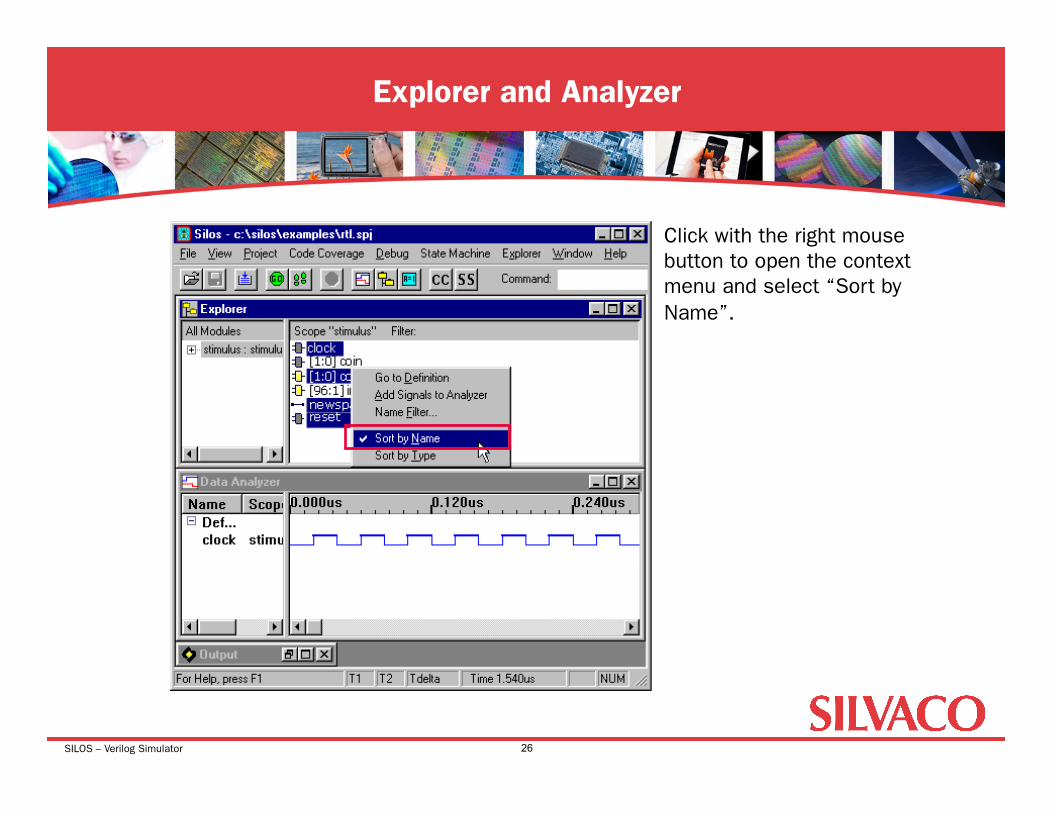
Explorer and Analyzer
26
Click with the right mouse button to open the context menu and select “Sort by Name”.

SILOS – Verilog Simulator
Explorer and Analyzer
27
Drag and drop signals to “Name” list box in Data Analyzer.

SILOS – Verilog Simulator
Explorer - Symbols
28
Input ports point right.
Output ports point left.
Non-port variable symbols:
“dumbell” symbol is a wire
“flop” symbol is a register
is a real variable
is a parameter
is an integer

SILOS – Verilog Simulator
Explorer - Context Menu
29
Context menu (use right mouse button).
SILOS – Verilog Simulator
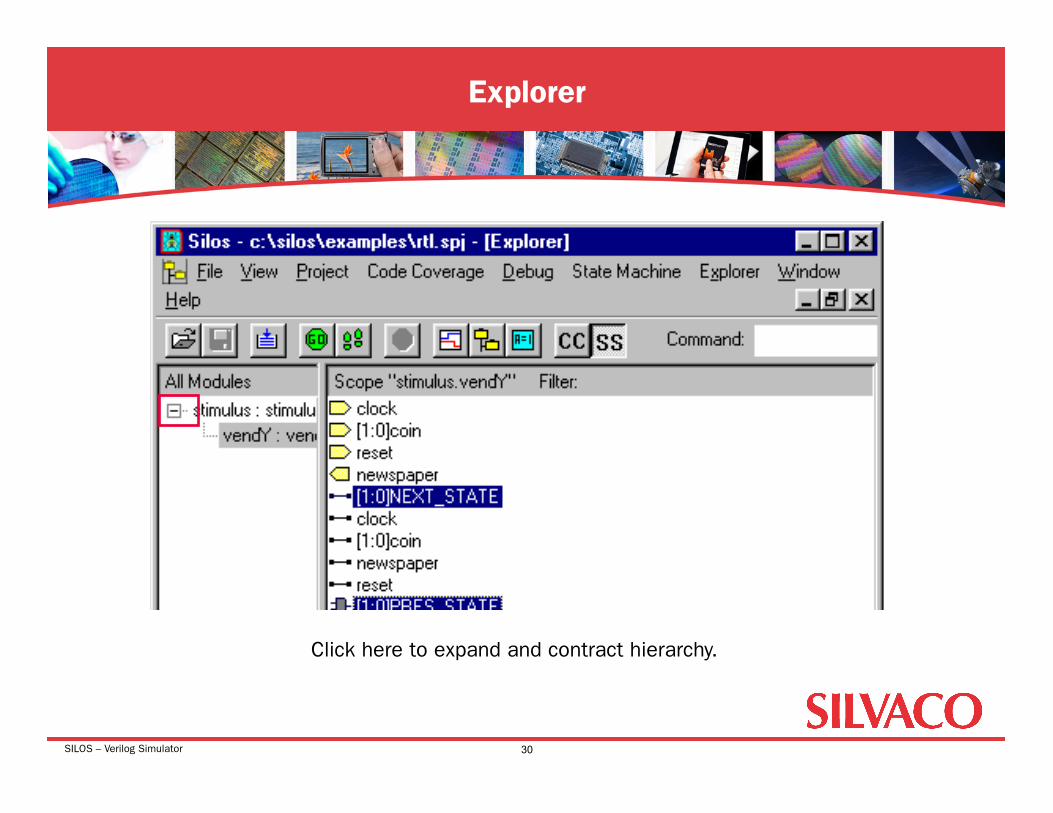
Explorer
30
Click here to expand and contract hierarchy.
SILOS – Verilog Simulator
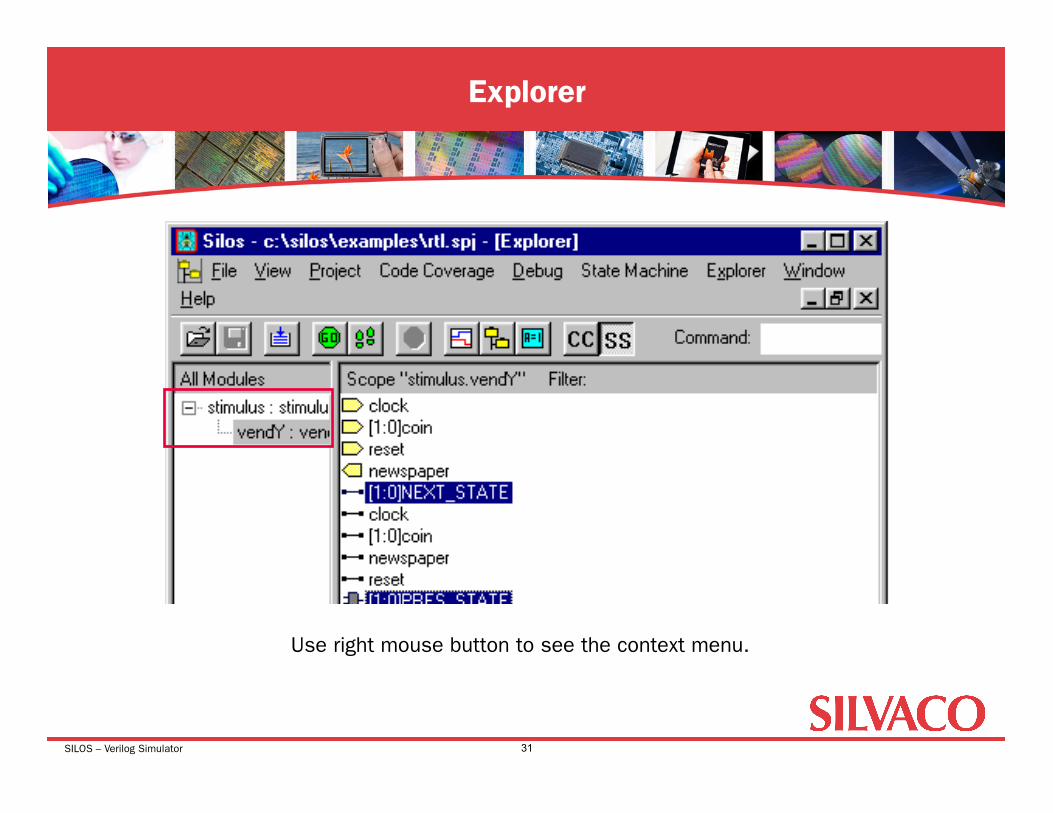
Explorer
31
Use right mouse button to see the context menu.
SILOS – Verilog Simulator
• Introduction • Starting Silos Project • Explorer and Analyzer • Source Code Debugging • State Machine Design Entry • Advanced Debugging Features • Finite State Machine Example • Gate Level Debugging
Agenda: Source Code Debugging
32
SILOS – Verilog Simulator
Source Code Waveforms
33
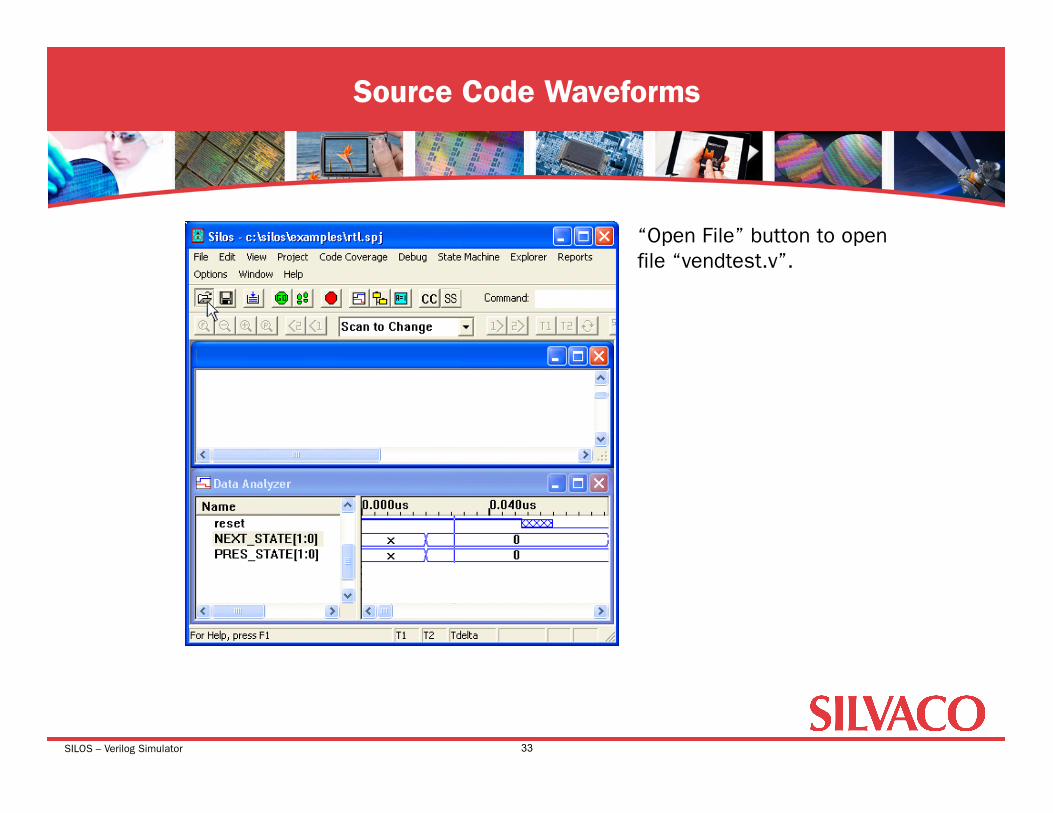
“Open File” button to open file “vendtest.v”.
SILOS – Verilog Simulator
Source Code Waveforms
34
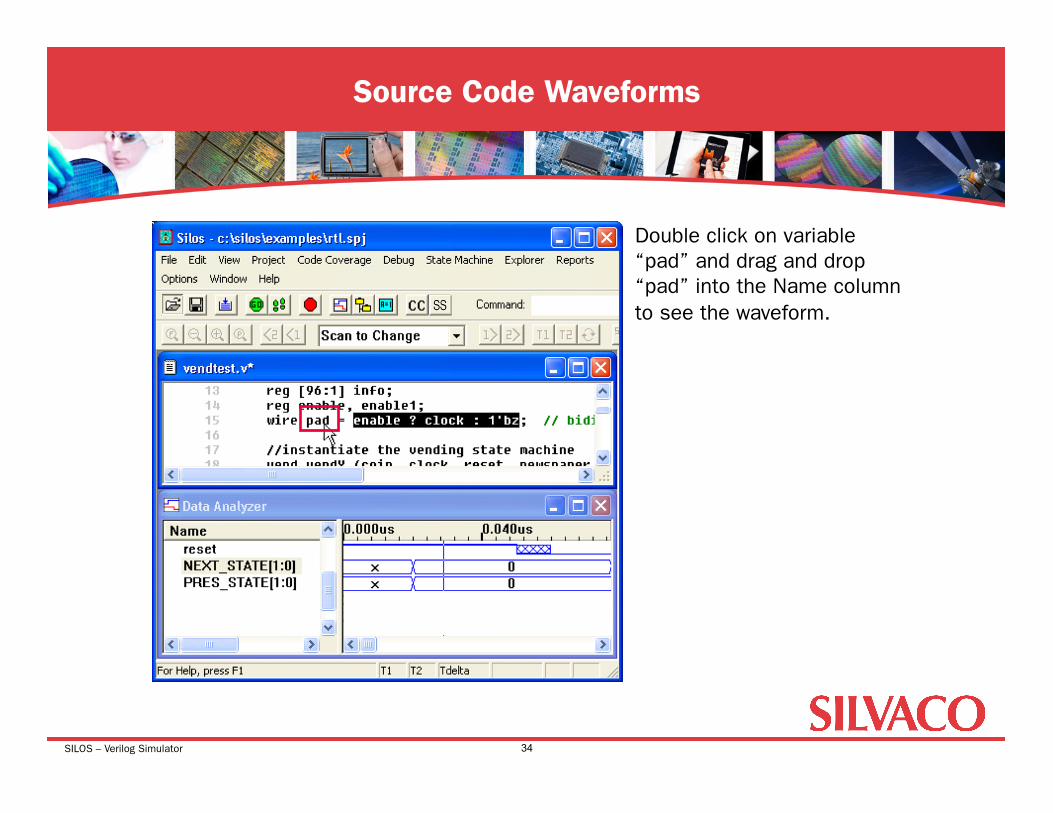
Double click on variable “pad” and drag and drop “pad” into the Name column to see the waveform.
SILOS – Verilog Simulator
Source Code Waveforms
35
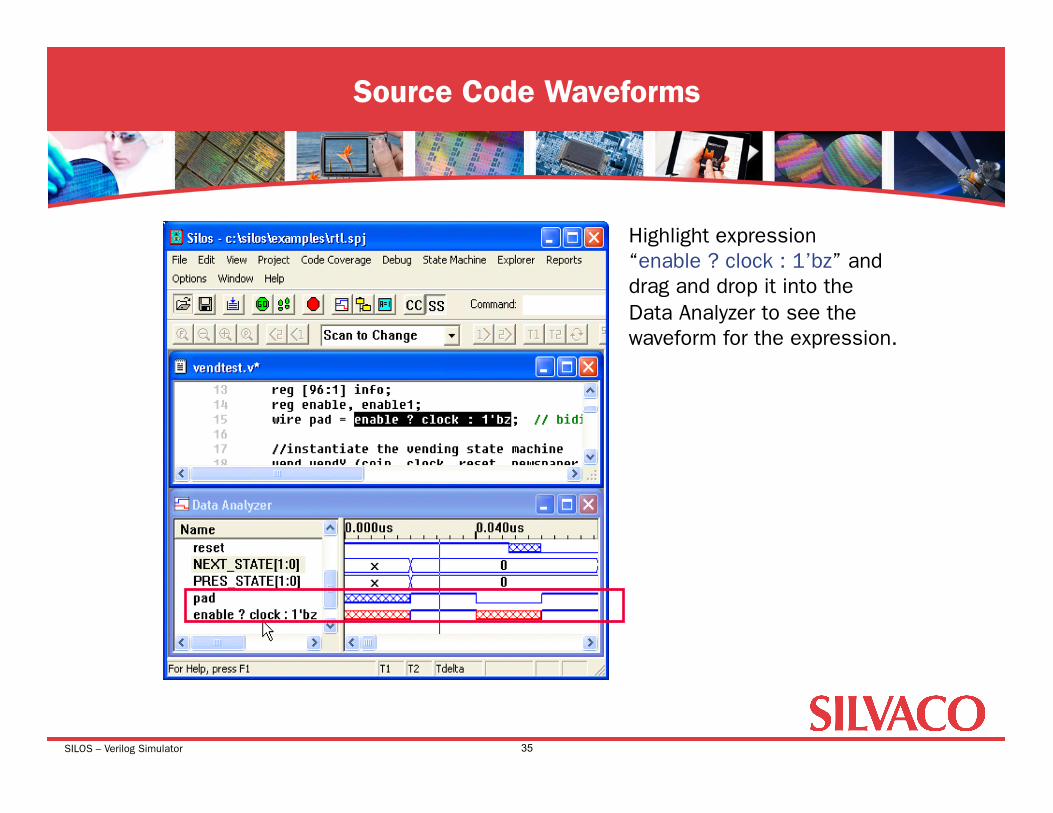
Highlight expression “enable ? clock : 1’bz” and drag and drop it into the Data Analyzer to see the waveform for the expression.

SILOS – Verilog Simulator
Rearranging Signal – Drag and Drop
36
Rearrange the signal names by dragging and dropping them in the Signal Name list box.
SILOS – Verilog Simulator
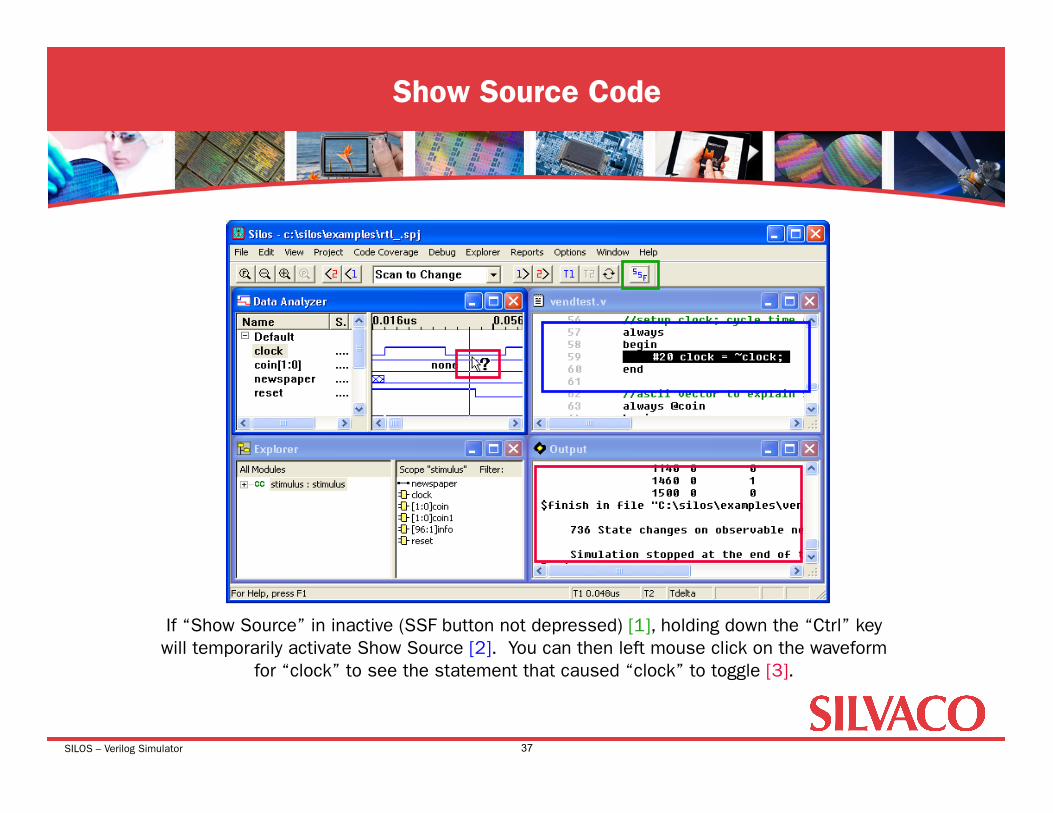
Show Source Code
37
If “Show Source” in inactive (SSF button not depressed) [1], holding down the “Ctrl” key will temporarily activate Show Source [2]. You can then left mouse click on the waveform
for “clock” to see the statement that caused “clock” to toggle [3].

SILOS – Verilog Simulator
Visual Debug - Time Point for Tracing Signal
38
Setting the blue “T1” marker [1] determines the time point for tracing a signal. Right mouse clicking on the name “newspaper” brings up the context menu [2].

SILOS – Verilog Simulator
Visual Debug - Trace Signal Inputs
39
Selecting the Trace Signal Inputs menu selection opens the Trace Signal Inputs window [3].

SILOS – Verilog Simulator
Visual Debug
40
The top signal, “stimulus newspaper”, is the signal being traced. The next line is the module name “vend”, and instance name, “stimulus.vendY”, which drives the top signal. The next line is the driver, or assignment, in the instance. Subsequent lines indented with a space are the inputs or right hand side (rhs) variables to the driver/assignment. If the driver or rhs variable is a port of the instance it is
shown using port name syntax. If it is not a port then just the name of the variable is listed. The signal name preceded by the period, “.newspaper”, is the local port name in module “vend”. The name in the parenthesis, “(newspaper)”, is the name in the module above “stimulus.vendY”. Signal names “coin[1]” and wire “PRES_STATE[1:0]”, the rhs variables in the assignment to “newspaper”, are listed
below it and indented one space.

SILOS – Verilog Simulator
Visual Debug - Status Window
41
Red flashing message in status window warns user of multiple drivers or assignments at a time point while “Show Source” is on.
SILOS – Verilog Simulator
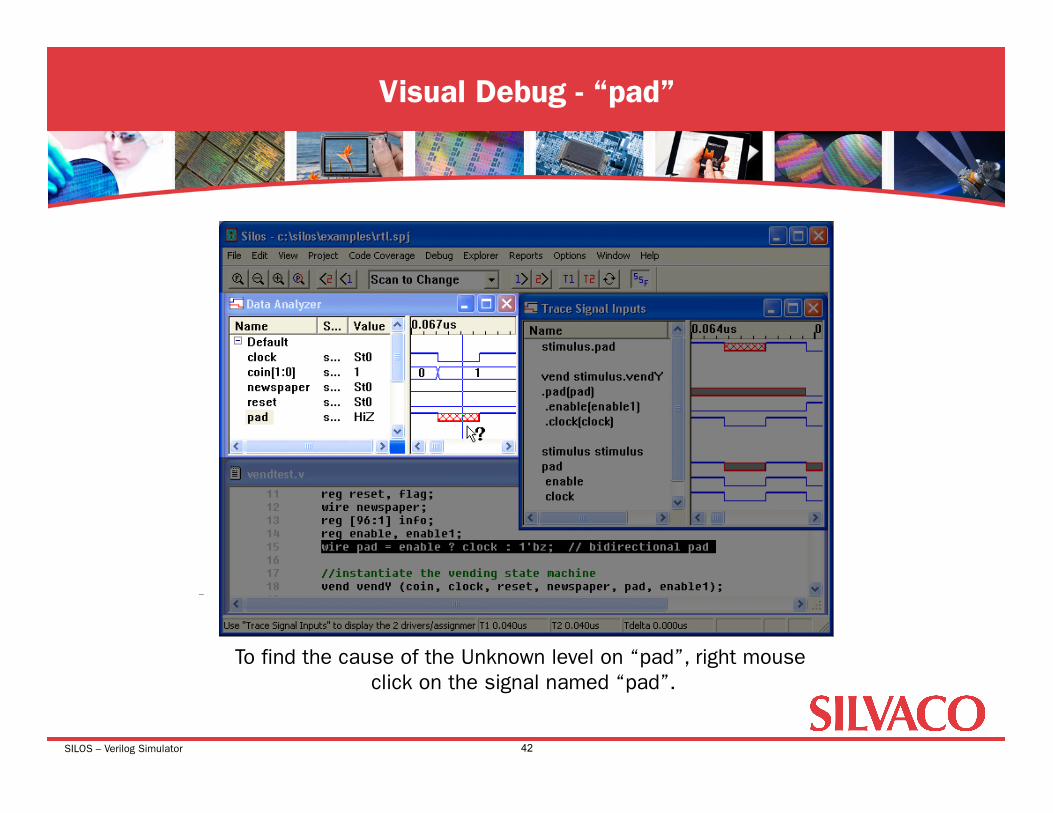
Visual Debug - “pad”
42
To find the cause of the Unknown level on “pad”, right mouse click on the signal named “pad”.
SILOS – Verilog Simulator
Visual Debug - “pad”
43
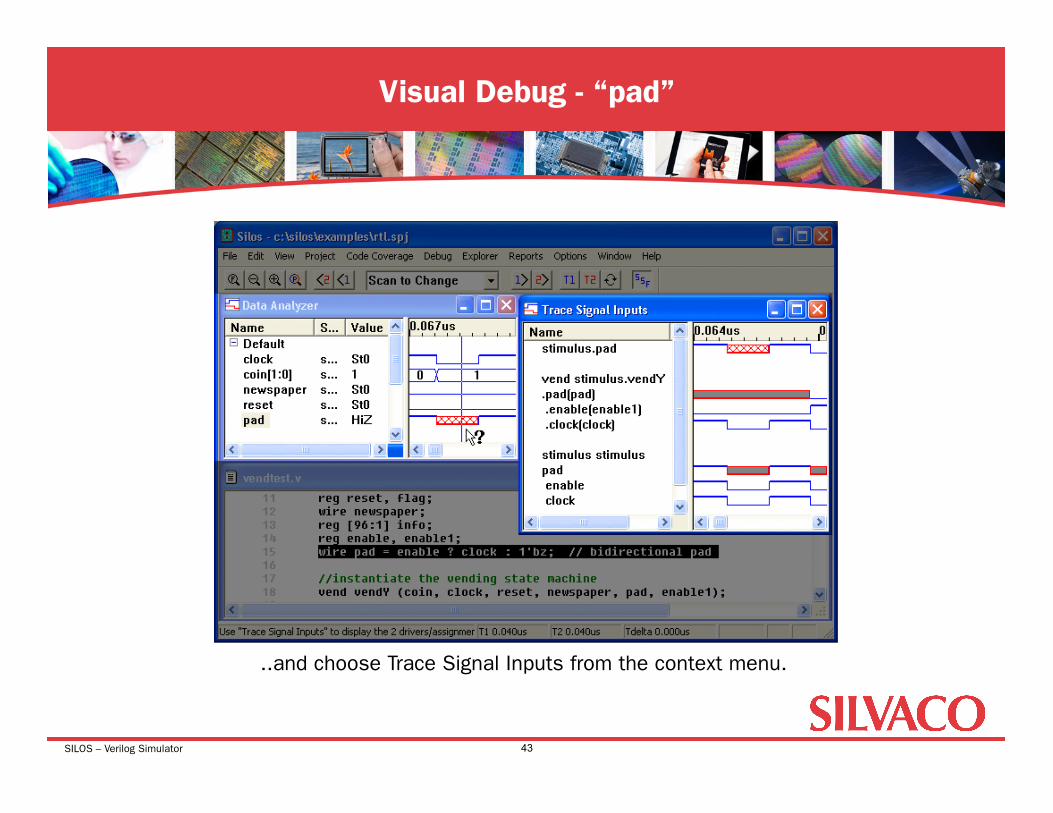
..and choose Trace Signal Inputs from the context menu.

SILOS – Verilog Simulator
Visual Debug - “stimulus.pad”
44
Unknown level on “stimulus.pad” is caused by both enables being low. Left mouse clicking on either driver name “pad” will highlight the
corresponding line of source for that driver.
SILOS – Verilog Simulator
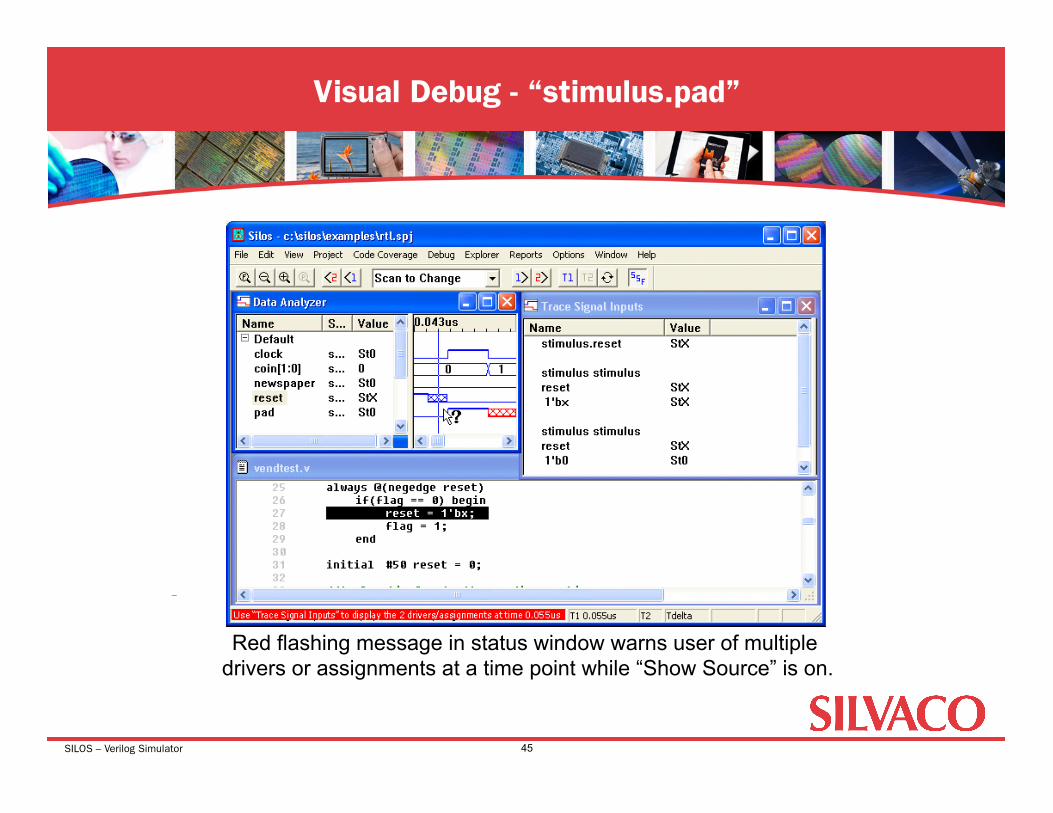
Visual Debug - “stimulus.pad”
45
Red flashing message in status window warns user of multiple drivers or assignments at a time point while “Show Source” is on.
SILOS – Verilog Simulator
Visual Debug - “reset”
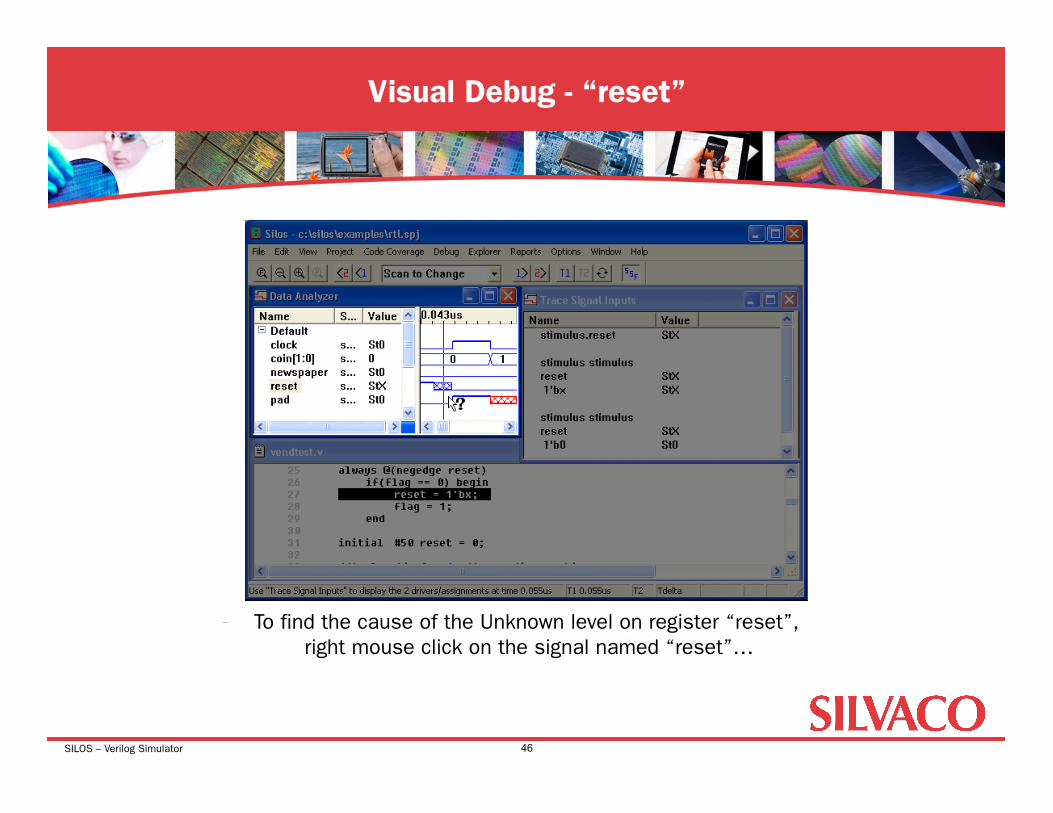
46
To find the cause of the Unknown level on register “reset”, right mouse click on the signal named “reset”…
SILOS – Verilog Simulator
Visual Debug - “reset”
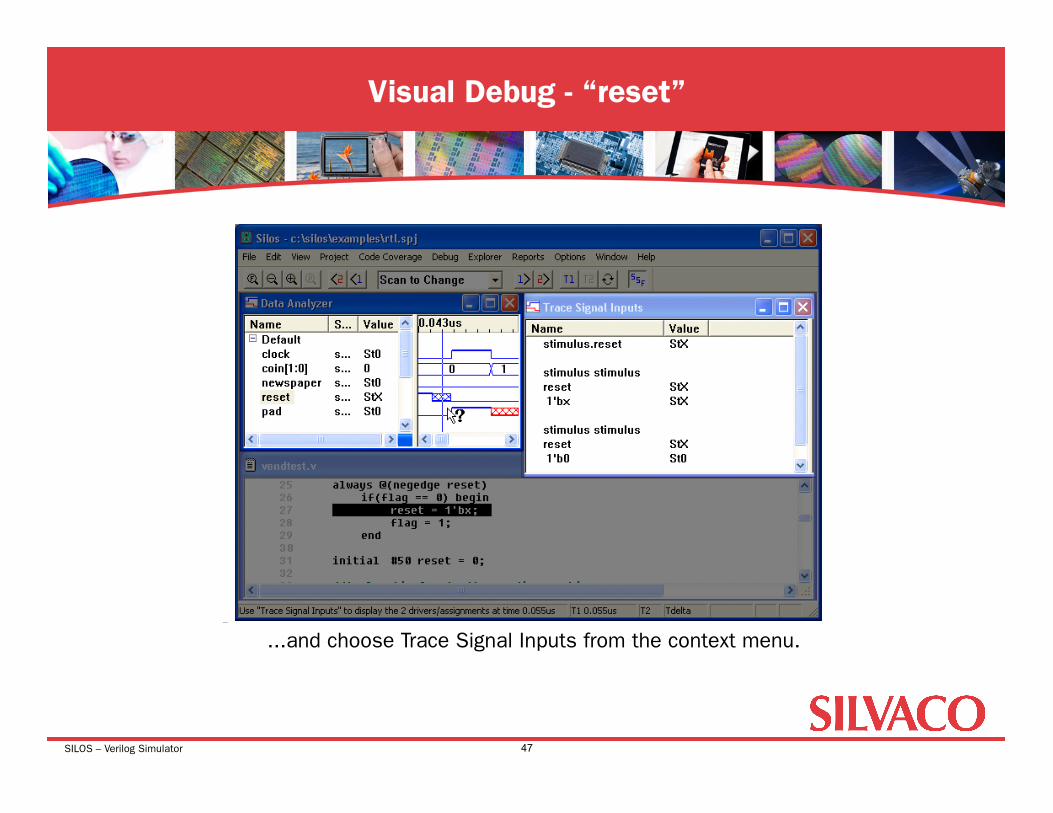
47
...and choose Trace Signal Inputs from the context menu.

SILOS – Verilog Simulator
Visual Debug - “reset”
48
The Trace Signal Inputs window shows that two statements assigned to register “stimulus.reset” at T1=.0.055us. The first assignment listed in the Trace Signal Inputs window is the last assignment to ‘reset’ that executed at this time point. The
second statement listed is the next to last assignment to “reset” that executed. Left mouse clicking on the first statement for “reset” shows line 27 of file “vendtest.v” is the last line executed.

SILOS – Verilog Simulator
Visual Debug
49
Tracing on “newspaper” in the Data Analyzer brings up the Trace Signal Inputs window, which shows “PRES_STATE[1:0]” and “coin[1]” are the right hand side (rhs) variables that assign the value for newspaper. Double clicking on “PRES_STATE[1]” will refresh the Trace Signal Inputs window, put
“PRES_STATE[1]” at the top, and display the rhs variables for “PRES_STATE[1]”.
SILOS – Verilog Simulator
Report Generation
50
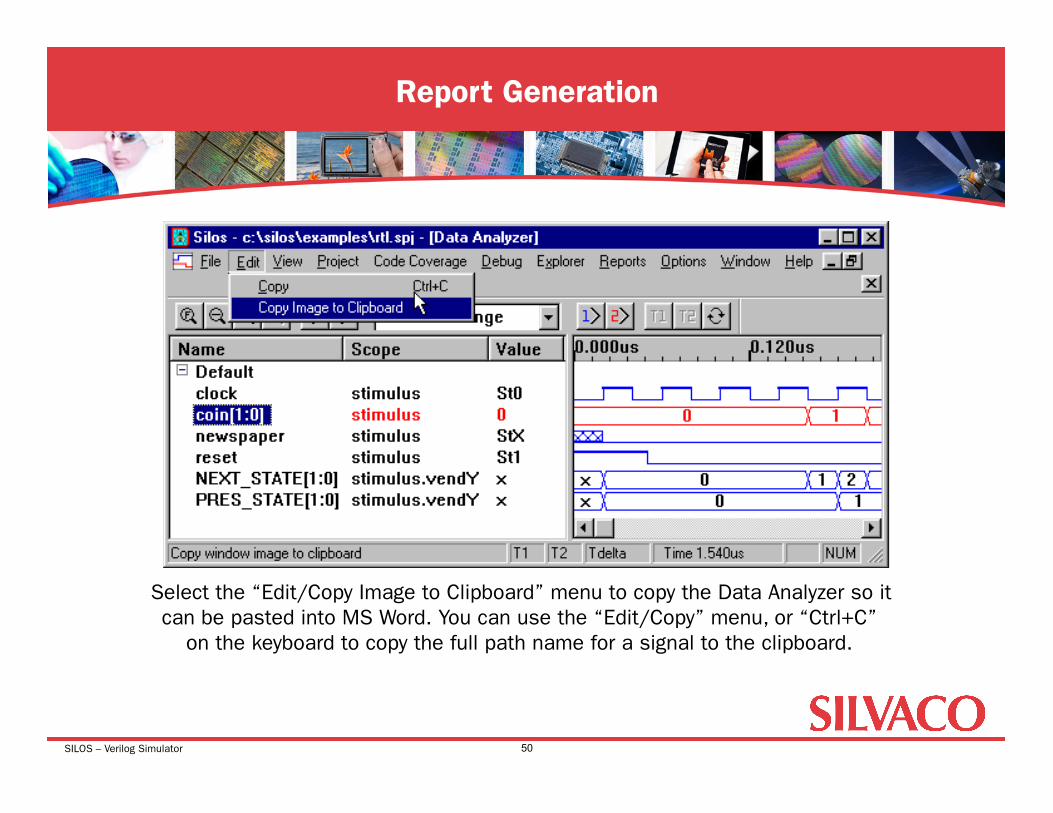
Select the “Edit/Copy Image to Clipboard” menu to copy the Data Analyzer so it can be pasted into MS Word. You can use the “Edit/Copy” menu, or “Ctrl+C”
on the keyboard to copy the full path name for a signal to the clipboard.

SILOS – Verilog Simulator
Vector Display
51
Double click on vector “coin[1:0] to expand and hide the bits.
SILOS – Verilog Simulator
• Introduction • Starting Silos Project • Explorer and Analyzer • Source Code Debugging • State Machine Design Entry • Advanced Debugging Features • Finite State Machine Example • Gate Level Debugging
Agenda: State Machine Design Entry
52
SILOS – Verilog Simulator
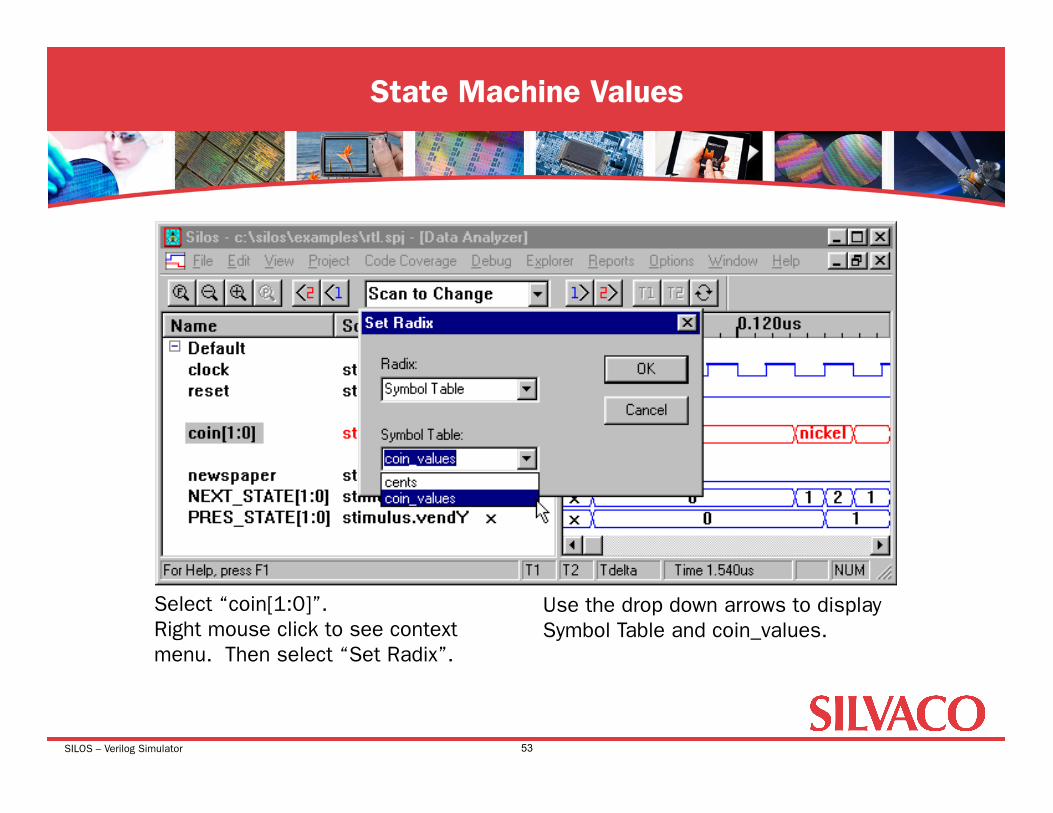
State Machine Values
53
Use the drop down arrows to display Symbol Table and coin_values.
Select “coin[1:0]”. Right mouse click to see context menu. Then select “Set Radix”.
SILOS – Verilog Simulator
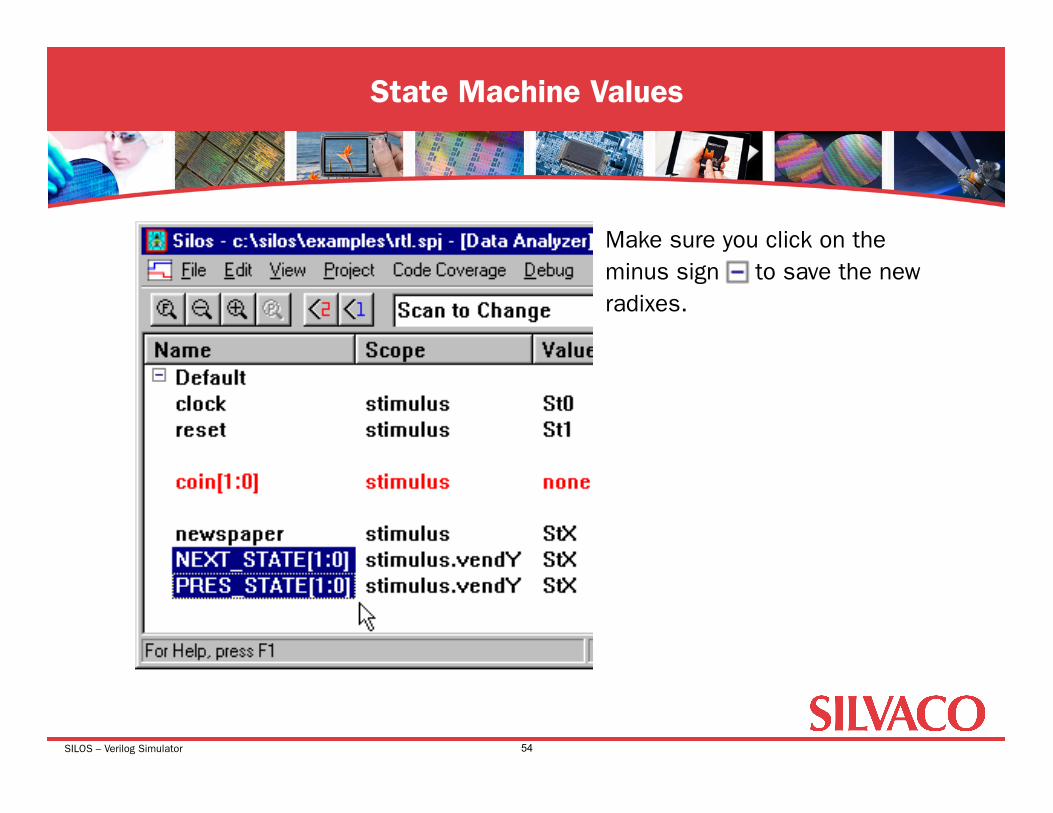
State Machine Values
54
Make sure you click on the minus sign to save the new radixes.

SILOS – Verilog Simulator
State Machine Values
55
Symbolic names for state values for vectors.

SILOS – Verilog Simulator
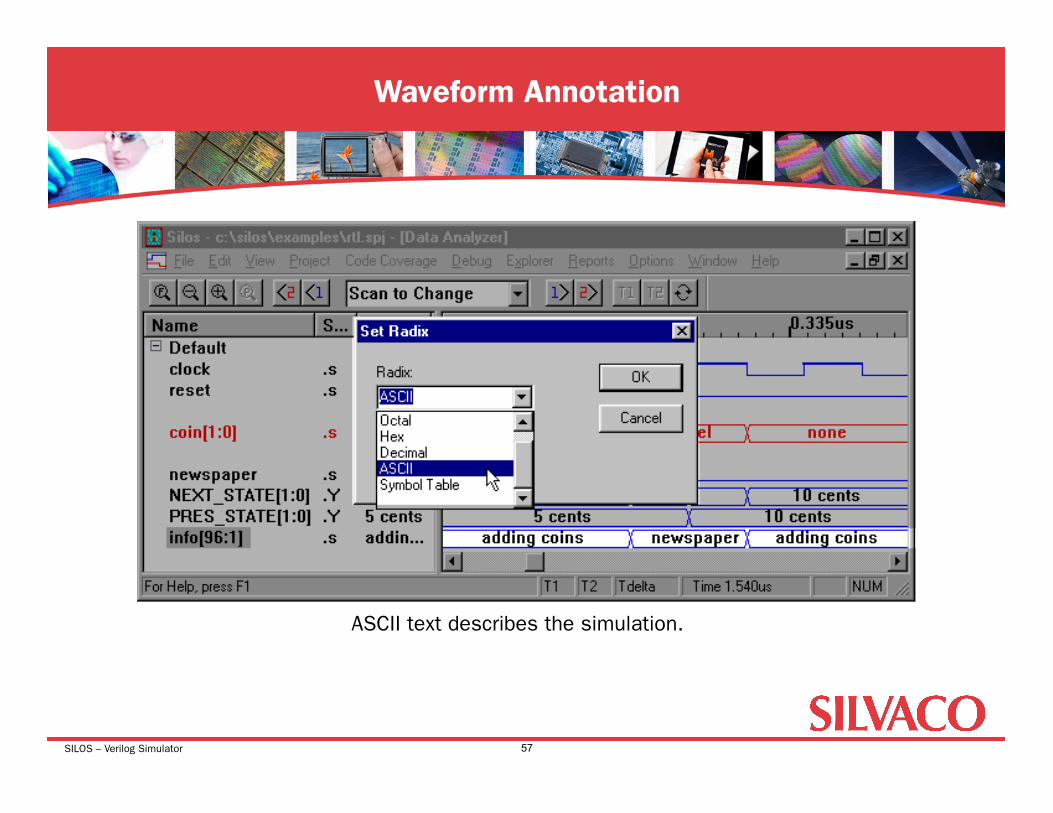
Waveform Annotation
56
Case statement for ASCII vector “info”.
SILOS – Verilog Simulator
Waveform Annotation
57
ASCII text describes the simulation.
SILOS – Verilog Simulator
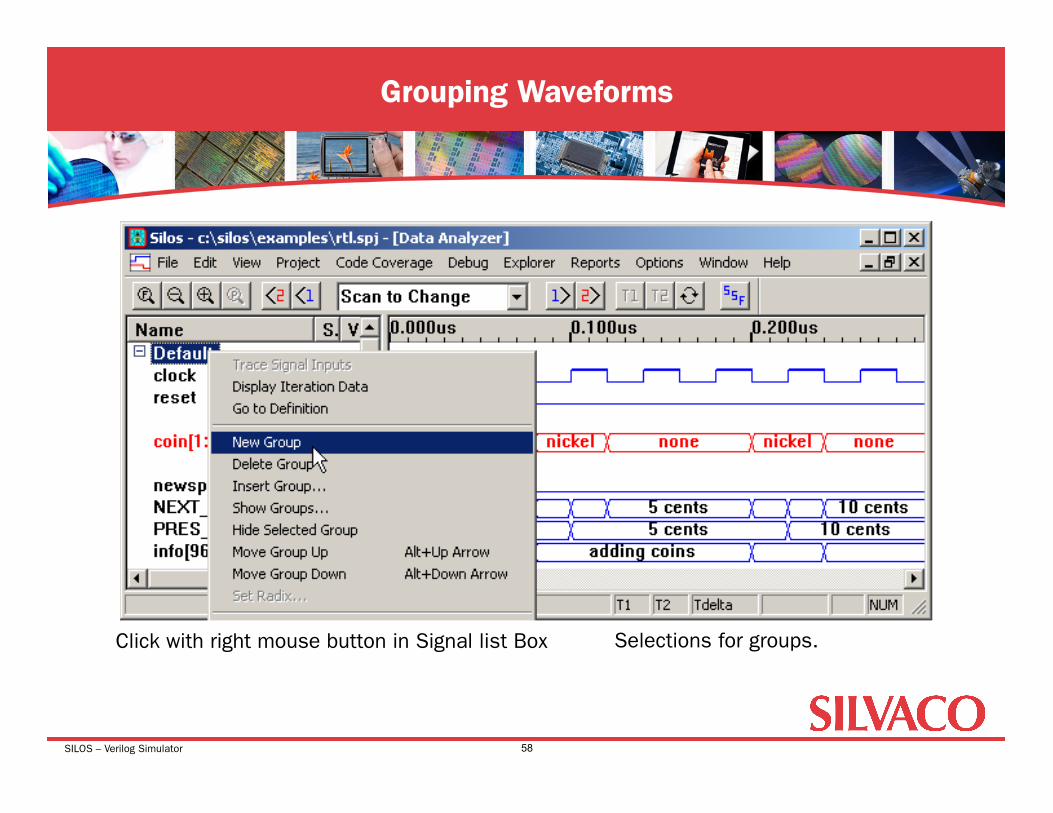
Grouping Waveforms
58
Click with right mouse button in Signal list Box Selections for groups.

SILOS – Verilog Simulator
Conditional Search
59
Expression “(clock && coin[1])”. Notice that if you click on the expression a
second time, you can modify the expression.
SILOS – Verilog Simulator
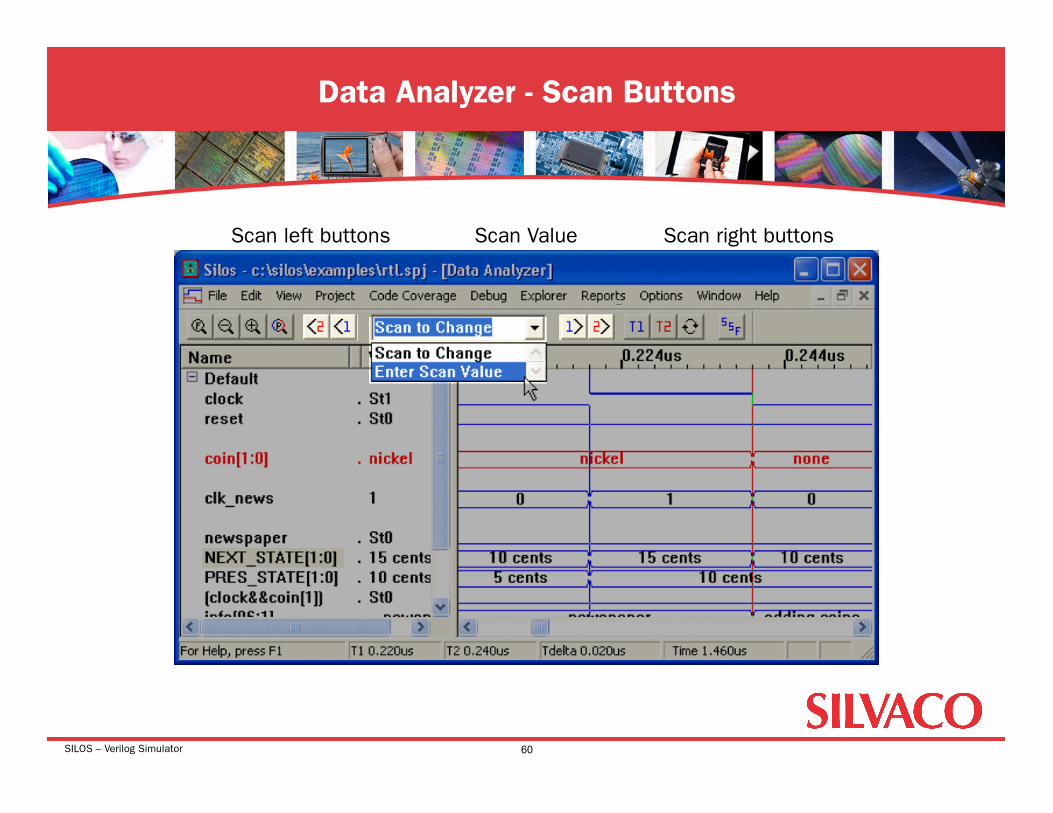
Data Analyzer - Scan Buttons
60
Scan left buttons Scan right buttons Scan Value
SILOS – Verilog Simulator
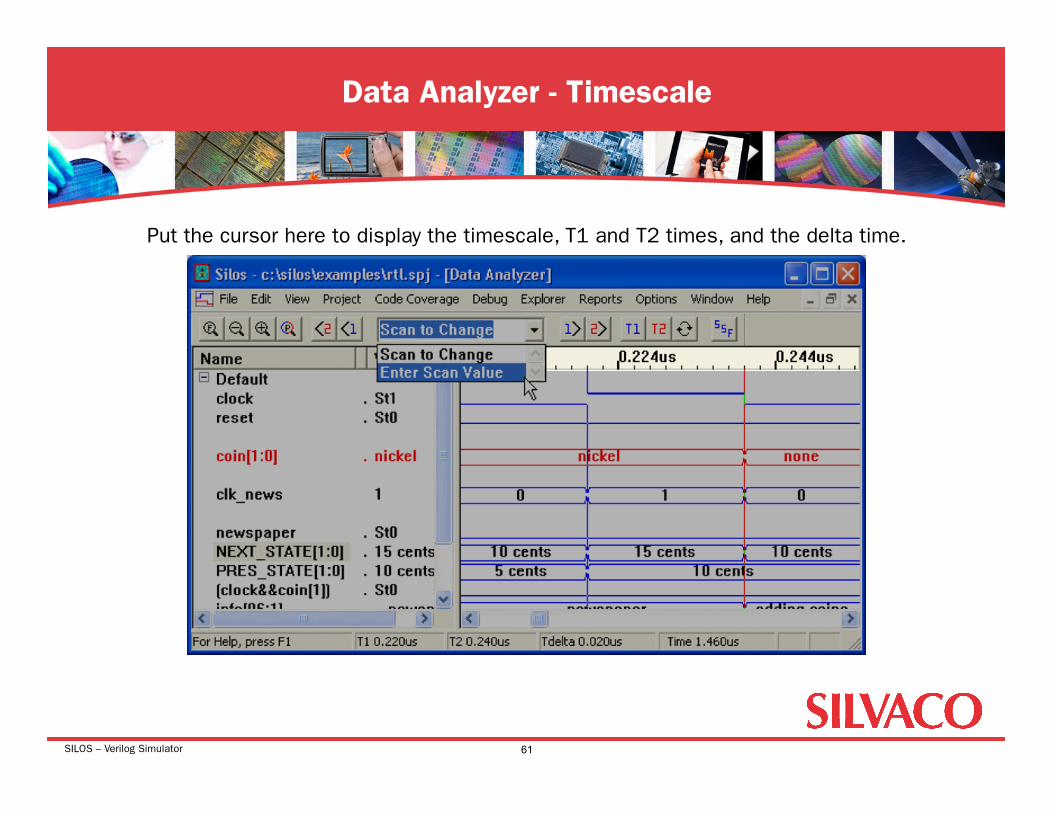
Data Analyzer - Timescale
61
Put the cursor here to display the timescale, T1 and T2 times, and the delta time.

SILOS – Verilog Simulator
Data Analyzer
62
T1 and T2 timing markers, set by the left and right mouse buttons respectively. Hold down the shift key to snap to edge.
Value for the signal
T1, T2, and delta time

SILOS – Verilog Simulator
Data Analyzer - Scan to Value
63
Scan to value does a character search, so you can scan a signal that is a single bit, a vector, or that uses symbolic names.
SILOS – Verilog Simulator
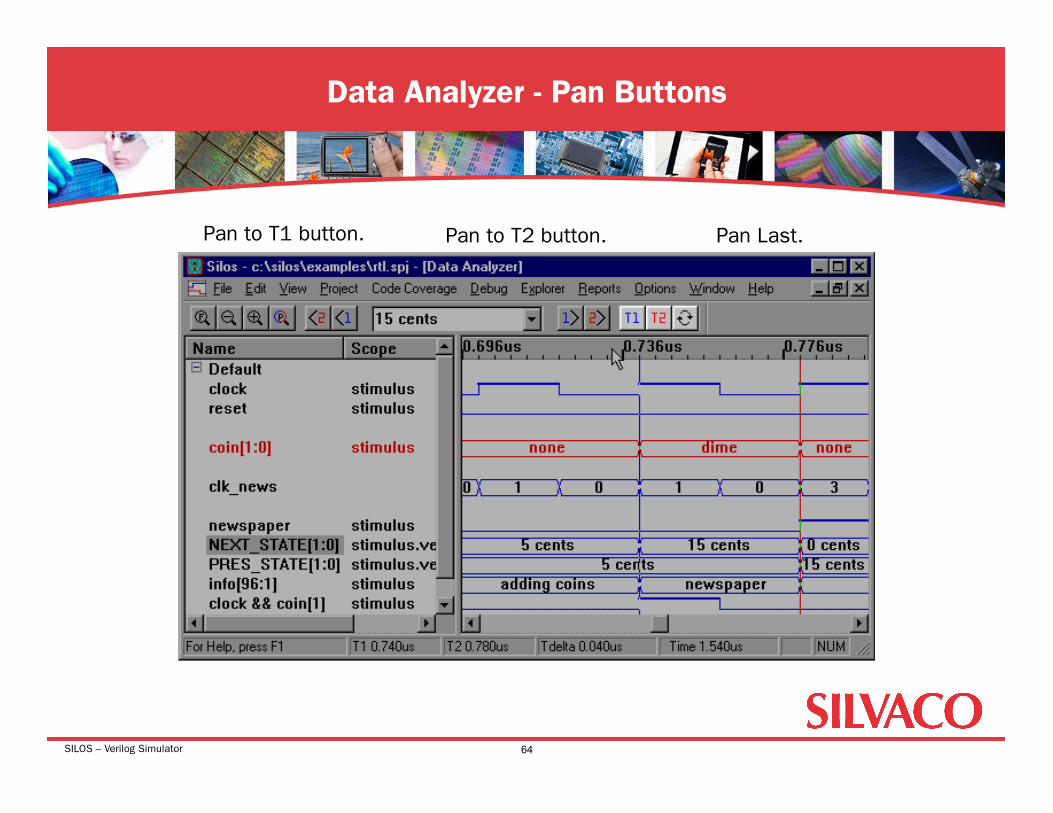
Data Analyzer - Pan Buttons
64
Pan Last. Pan to T2 button. Pan to T1 button.
SILOS – Verilog Simulator
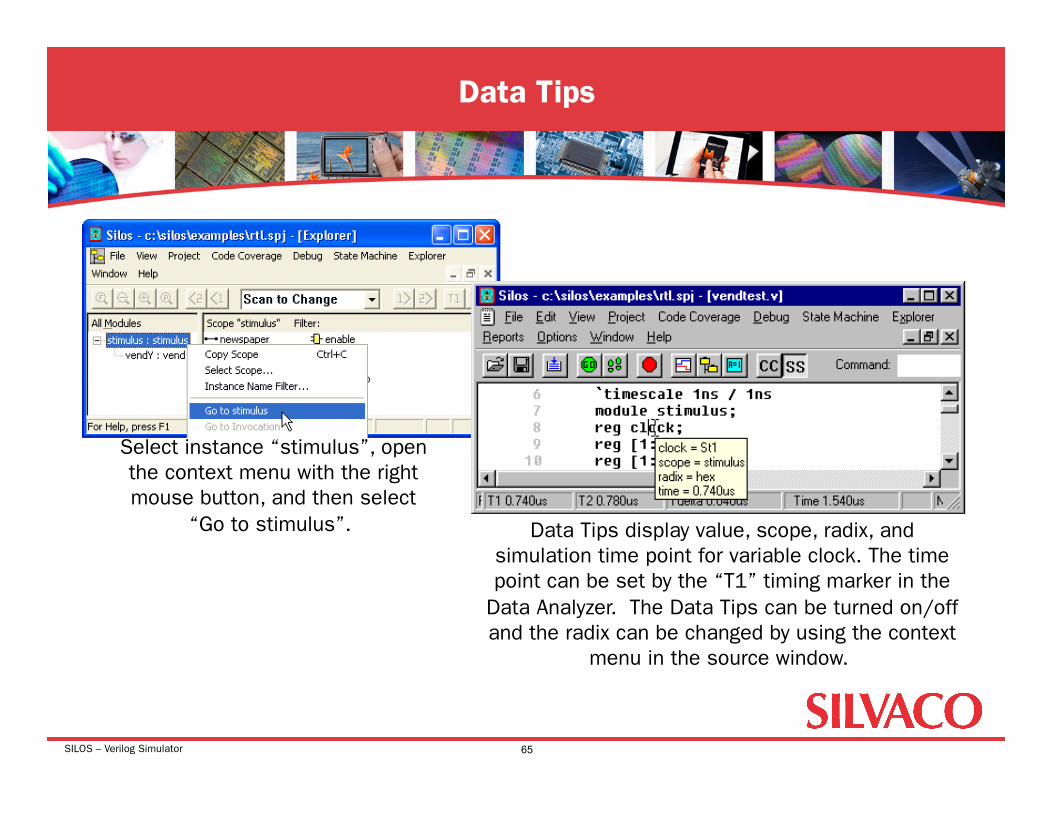
Data Tips
65
Select instance “stimulus”, open the context menu with the right mouse button, and then select
“Go to stimulus”. Data Tips display value, scope, radix, and simulation time point for variable clock. The time point can be set by the “T1” timing marker in the
Data Analyzer. The Data Tips can be turned on/off and the radix can be changed by using the context
menu in the source window.
SILOS – Verilog Simulator
• Introduction • Starting Silos Project • Explorer and Analyzer • Source Code Debugging • State Machine Design Entry • Advanced Debugging Features • Finite State Machine Example • Gate Level Debugging
Agenda: Advanced Debugging Features
66
SILOS – Verilog Simulator
Single Stepping
67
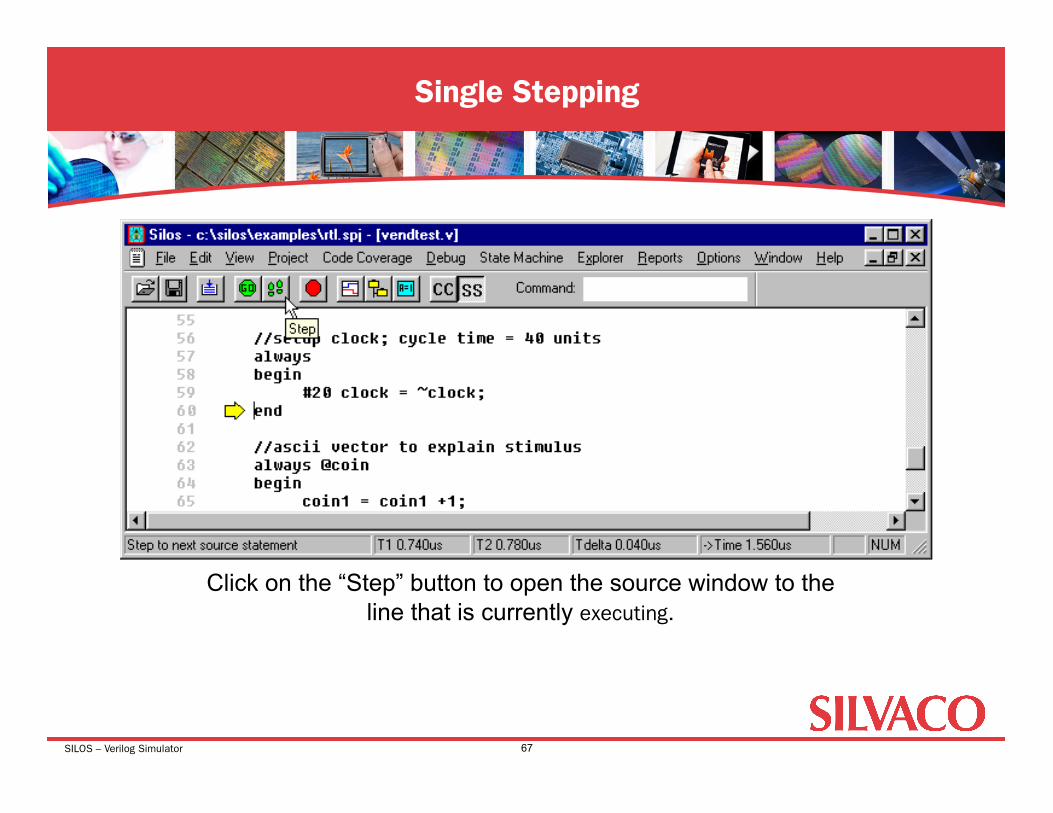
Click on the “Step” button to open the source window to the line that is currently executing.
SILOS – Verilog Simulator
Single Stepping
68
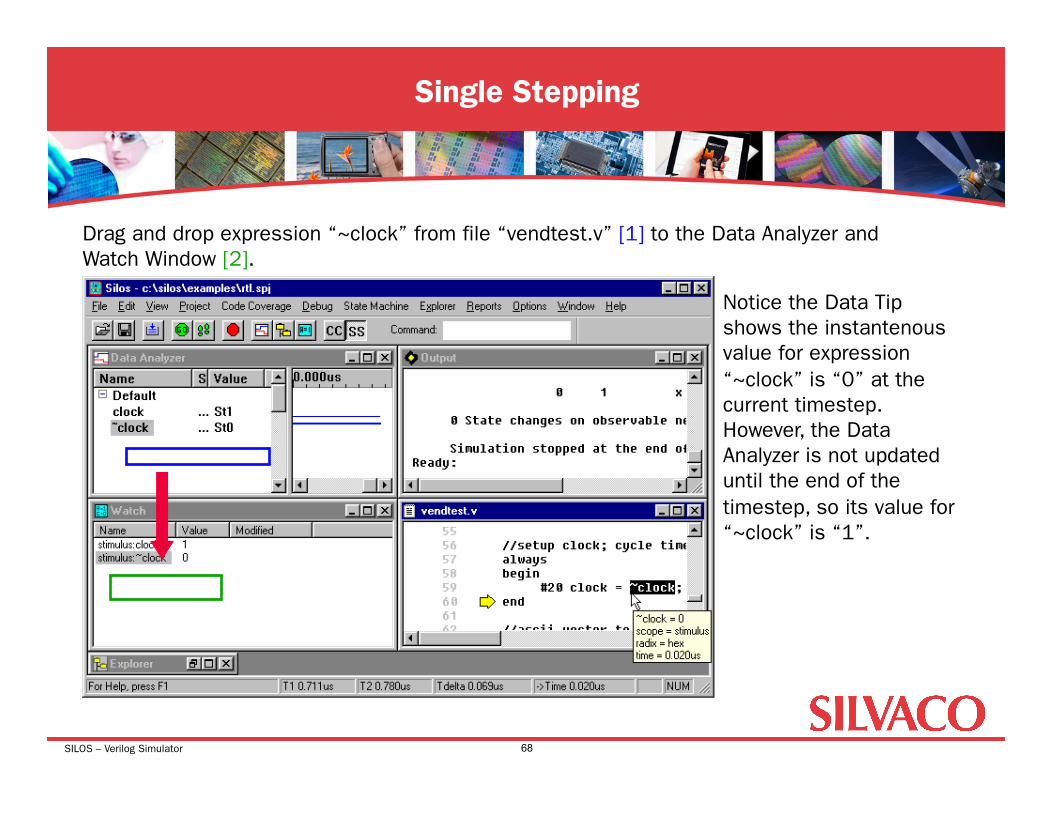
Drag and drop expression “~clock” from file “vendtest.v” [1] to the Data Analyzer and Watch Window [2].
Notice the Data Tip shows the instantenous value for expression “~clock” is “0” at the current timestep. However, the Data Analyzer is not updated until the end of the timestep, so its value for “~clock” is “1”.
SILOS – Verilog Simulator
Single Stepping
69
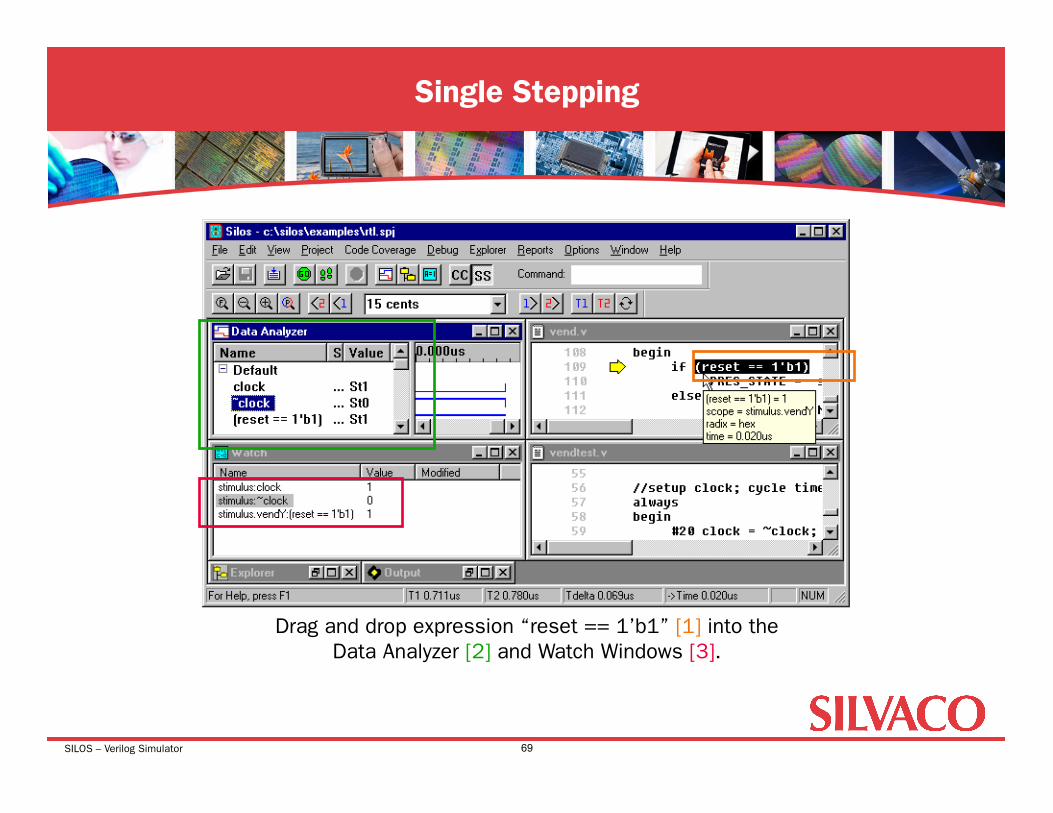
Drag and drop expression “reset == 1’b1” [1] into the Data Analyzer [2] and Watch Windows [3].
SILOS – Verilog Simulator
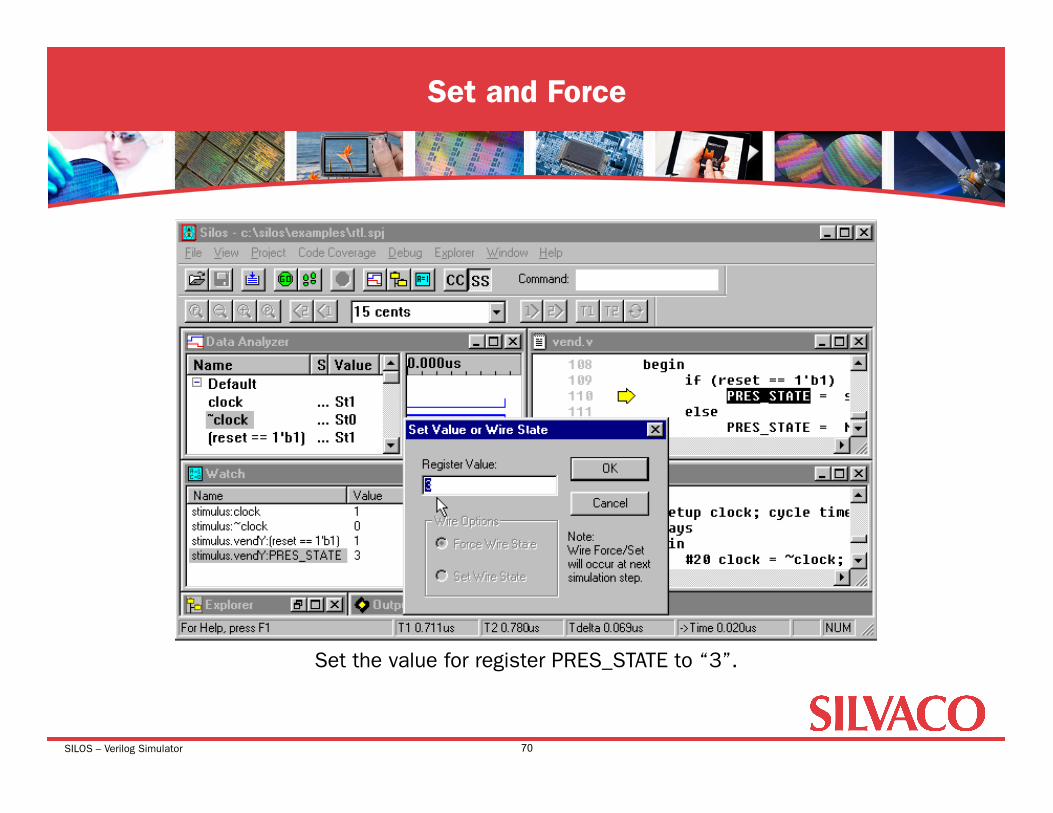
Set and Force
70
Set the value for register PRES_STATE to “3”.

SILOS – Verilog Simulator
Breakpoints
71
SILOS – Verilog Simulator
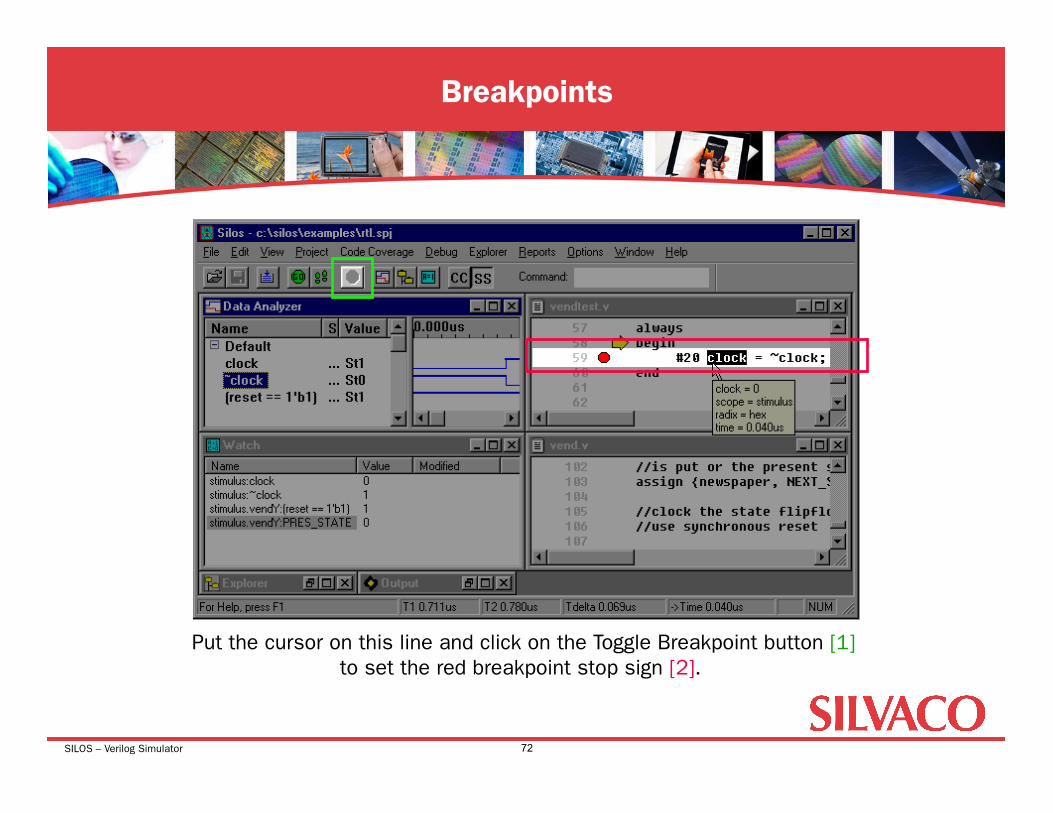
Breakpoints
72
Put the cursor on this line and click on the Toggle Breakpoint button [1] to set the red breakpoint stop sign [2].

SILOS – Verilog Simulator
Code Coverage
73
Code Coverage button should be depressed. Double click on the first line in the Operator report [1] to open
the source file at that line. Lines not executed have a purple dot [2]. Click on a column header [3] to change the sort order.
1
2
3
SILOS – Verilog Simulator
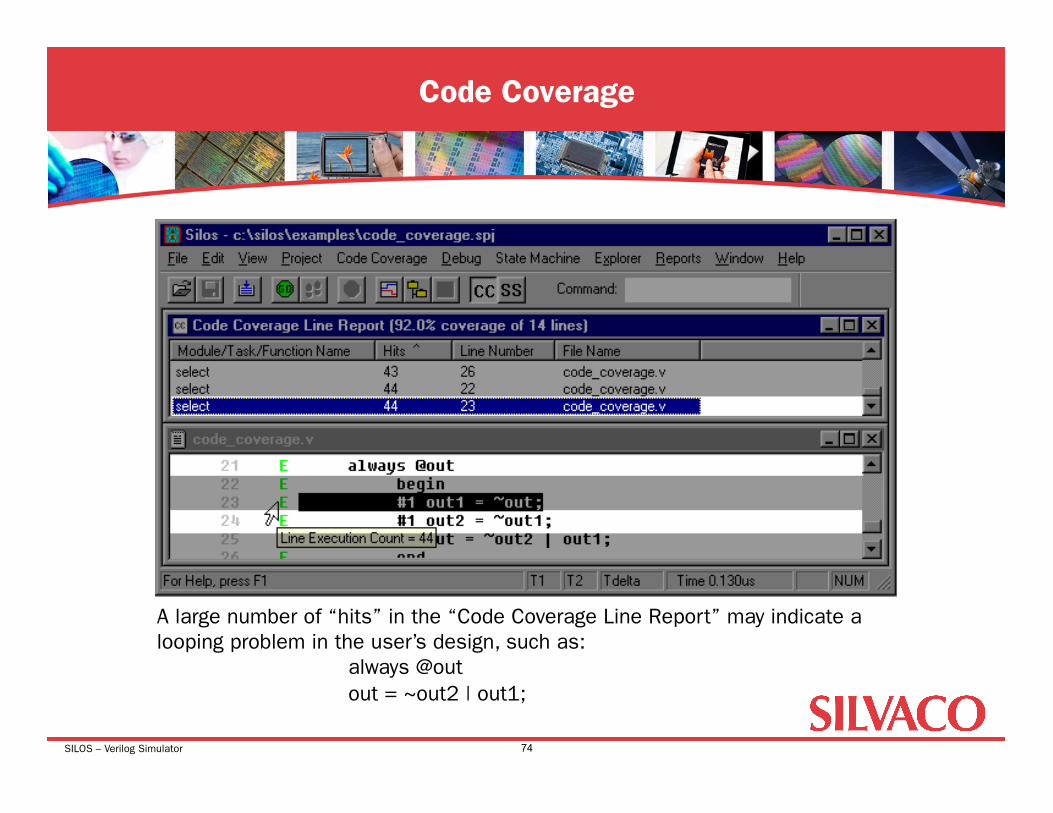
Code Coverage
74
A large number of “hits” in the “Code Coverage Line Report” may indicate a looping problem in the user’s design, such as:
always @out out = ~out2 | out1;
SILOS – Verilog Simulator
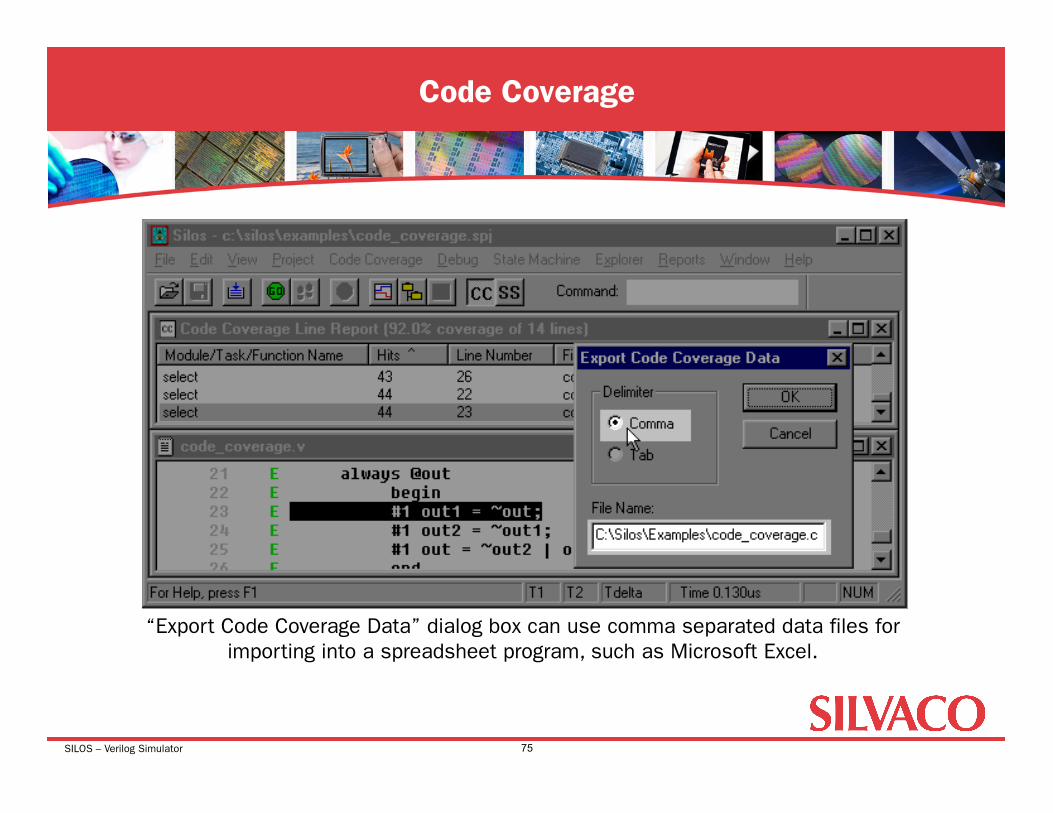
Code Coverage
75
“Export Code Coverage Data” dialog box can use comma separated data files for importing into a spreadsheet program, such as Microsoft Excel.
SILOS – Verilog Simulator
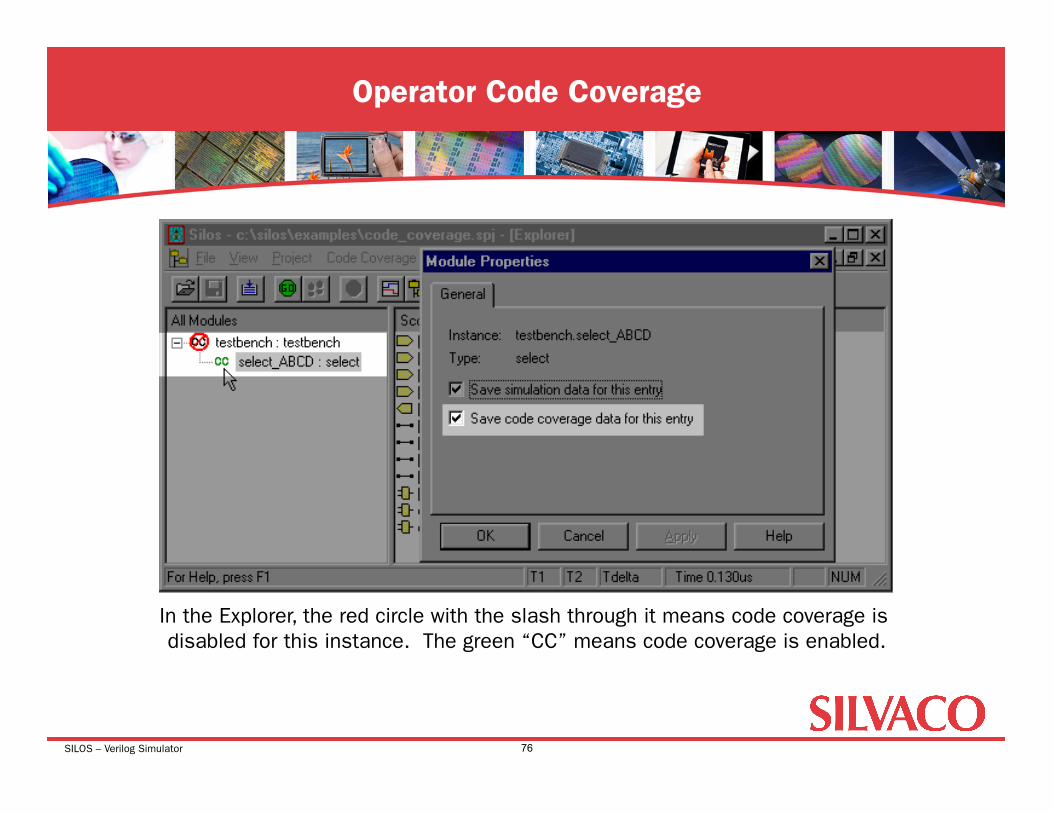
Operator Code Coverage
76
In the Explorer, the red circle with the slash through it means code coverage is disabled for this instance. The green “CC” means code coverage is enabled.

SILOS – Verilog Simulator
Operator Code Coverage
77
The “<” and the “>” operators failed to be true. When expressions have more than one operator, you can use separate lines to display the purple dot for each failed operator.
SILOS – Verilog Simulator
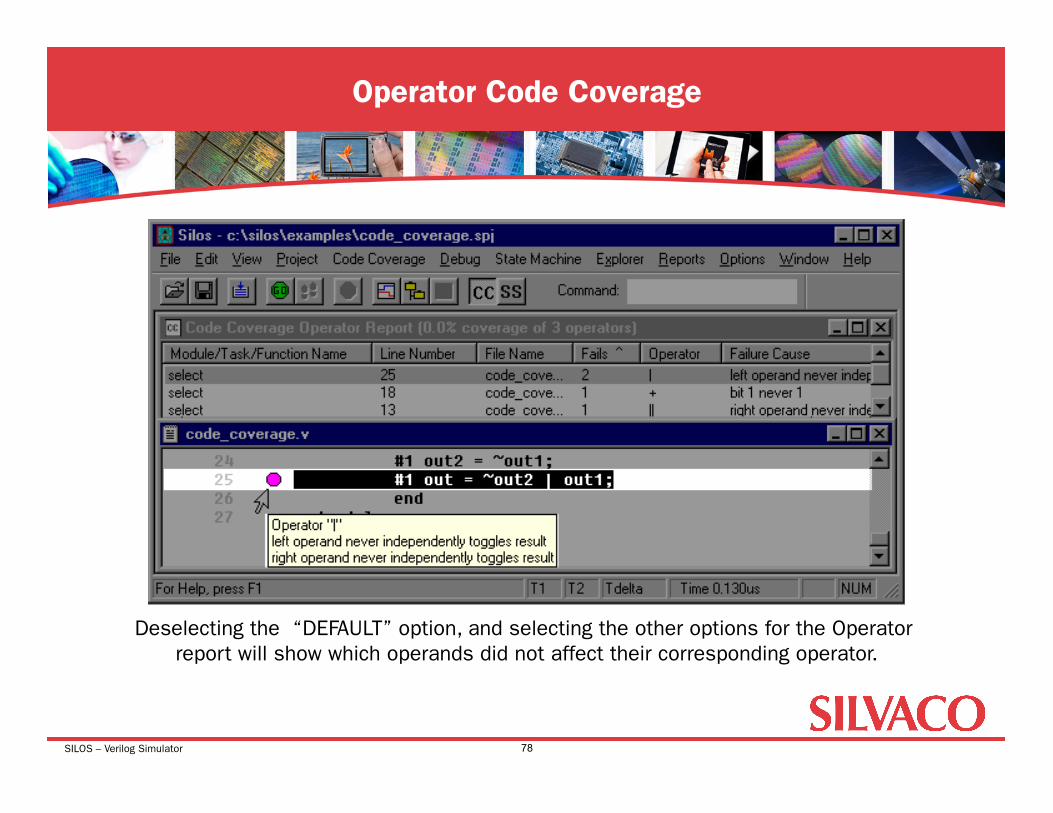
Operator Code Coverage
78
Deselecting the “DEFAULT” option, and selecting the other options for the Operator report will show which operands did not affect their corresponding operator.
SILOS – Verilog Simulator
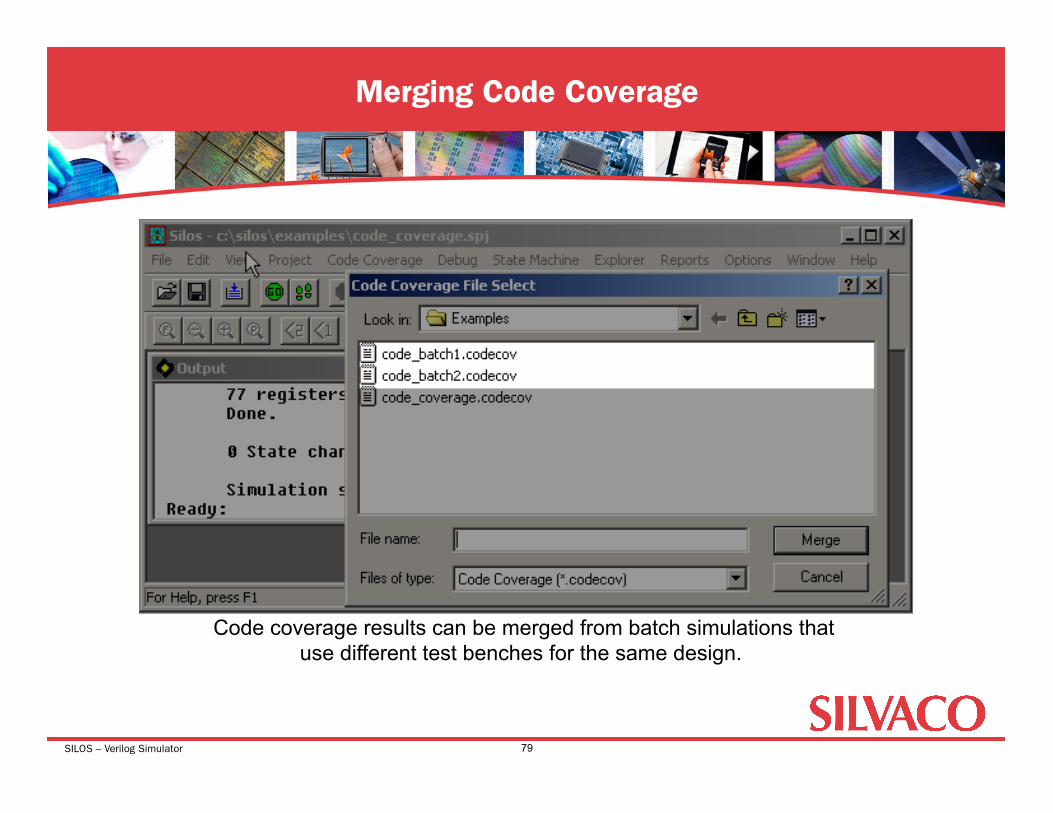
Merging Code Coverage
79
Code coverage results can be merged from batch simulations that use different test benches for the same design.
SILOS – Verilog Simulator
• Introduction • Starting Silos Project • Explorer and Analyzer • Source Code Debugging • State Machine Design Entry • Advanced Debugging Features • Finite State Machine Example • Gate Level Debugging
Agenda: Finite State Machine Example
80

SILOS – Verilog Simulator
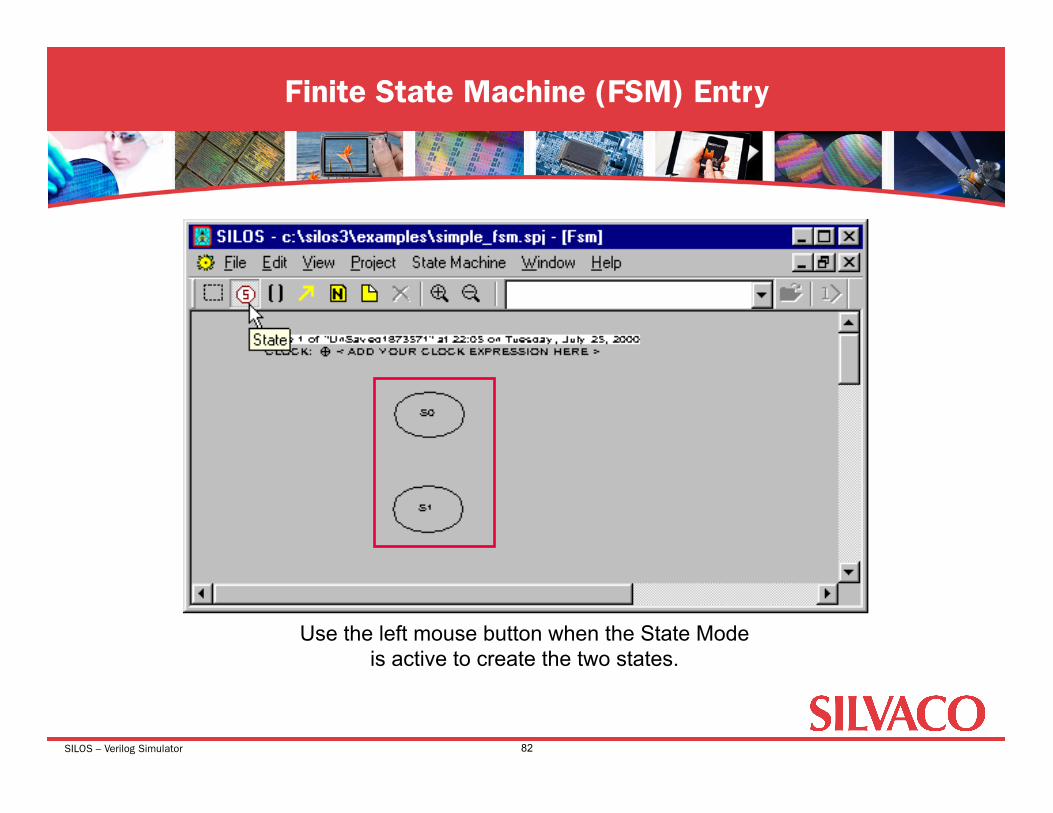
Finite State Machine (FSM) Entry
81
FSM Toolbar. State drawing button.
SILOS – Verilog Simulator
Finite State Machine (FSM) Entry
82
Use the left mouse button when the State Mode is active to create the two states.
SILOS – Verilog Simulator
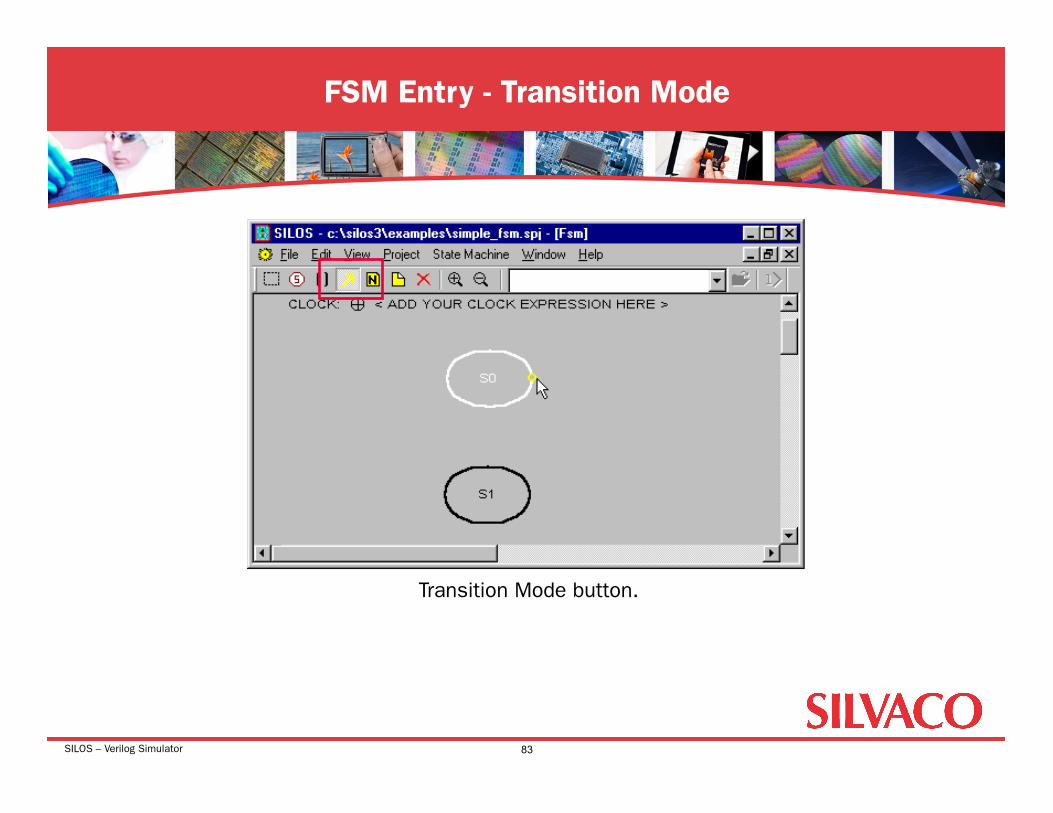
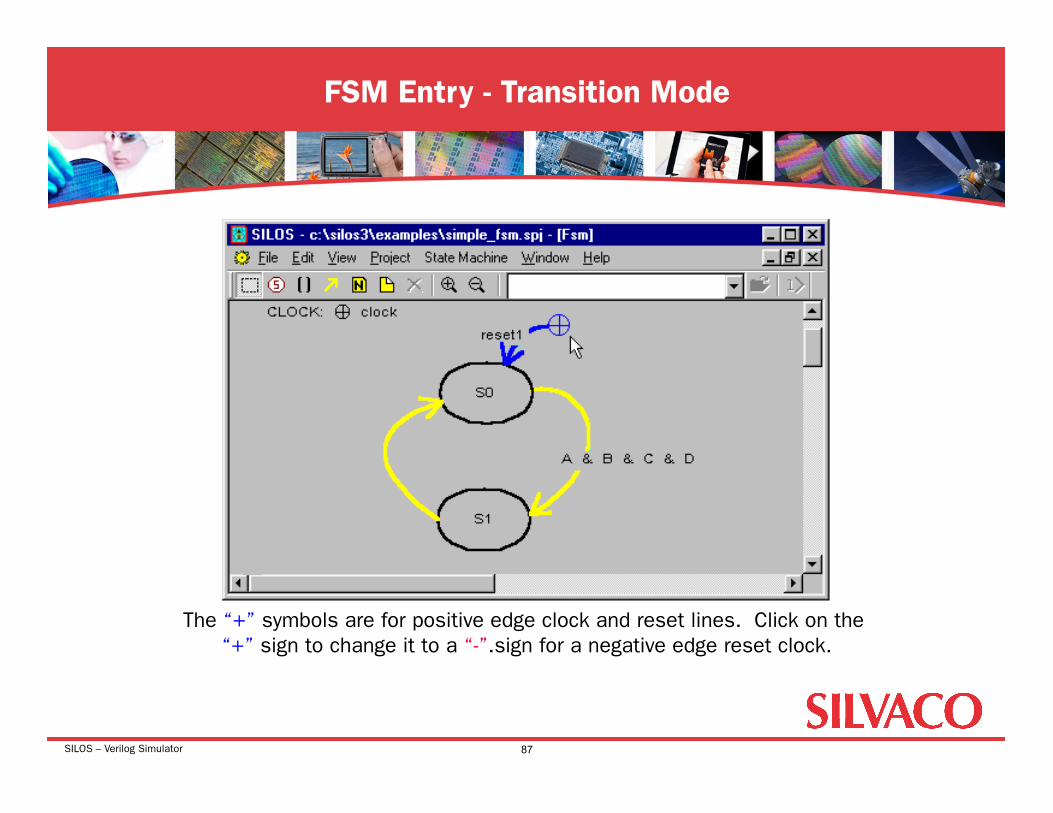
FSM Entry - Transition Mode
83
Transition Mode button.
SILOS – Verilog Simulator
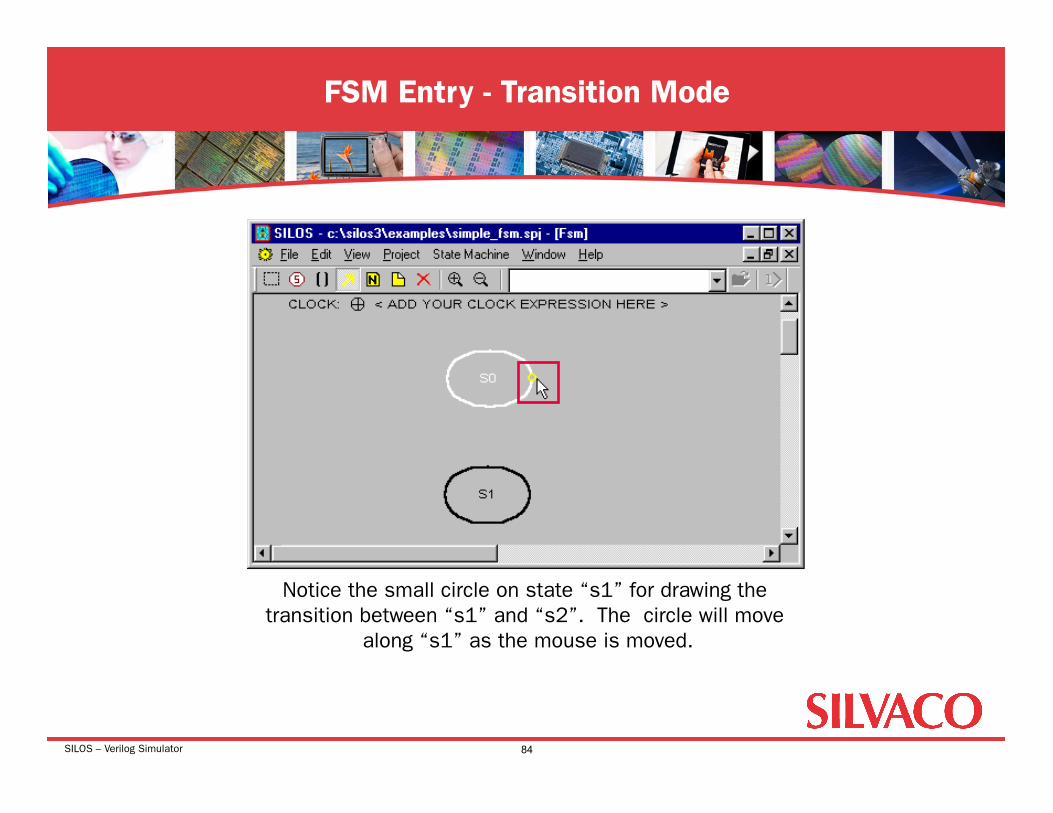
FSM Entry - Transition Mode
84
Notice the small circle on state “s1” for drawing the transition between “s1” and “s2”. The circle will move
along “s1” as the mouse is moved.

SILOS – Verilog Simulator
FSM Entry - Transition Mode
85
Transition between states “s2”and “s1” will change at the next positive clock edge because the expression has been deleted.
Notice a state symbol can be moved when there is a circle with cross hairs. If instead you see a star on the state symbol, this will change the shape of the state symbol instead of moving it.
SILOS – Verilog Simulator
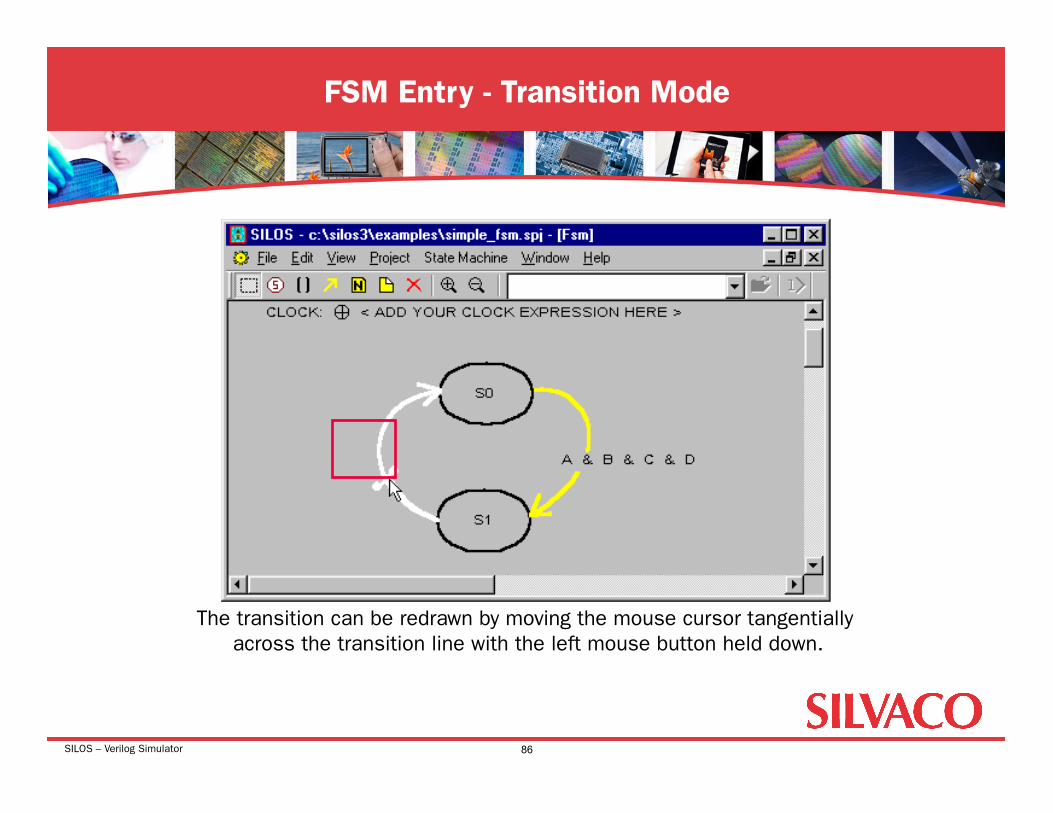
FSM Entry - Transition Mode
86
The transition can be redrawn by moving the mouse cursor tangentially across the transition line with the left mouse button held down.
SILOS – Verilog Simulator
FSM Entry - Transition Mode
87
The “+” symbols are for positive edge clock and reset lines. Click on the “+” sign to change it to a “-”.sign for a negative edge reset clock.

SILOS – Verilog Simulator
FSM Entry - Notes
88
Notes can be used to document output signals on the diagram.
SILOS – Verilog Simulator
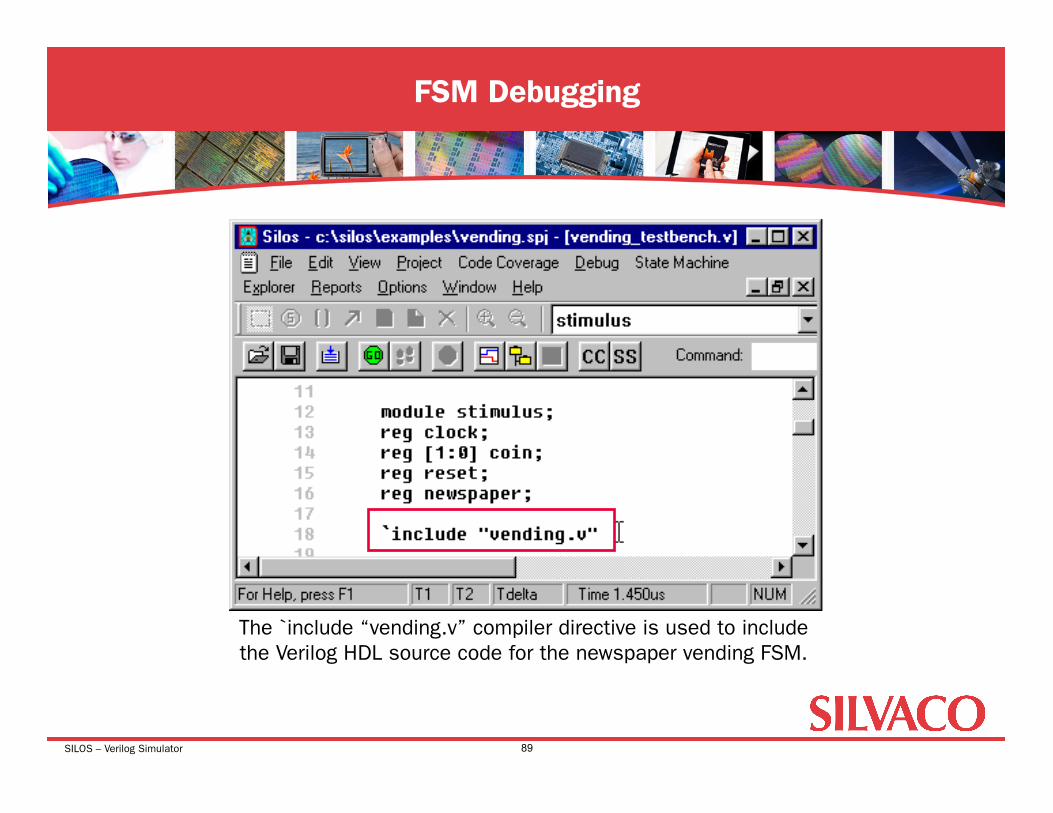
FSM Debugging
89
The `include “vending.v” compiler directive is used to include the Verilog HDL source code for the newspaper vending FSM.
SILOS – Verilog Simulator
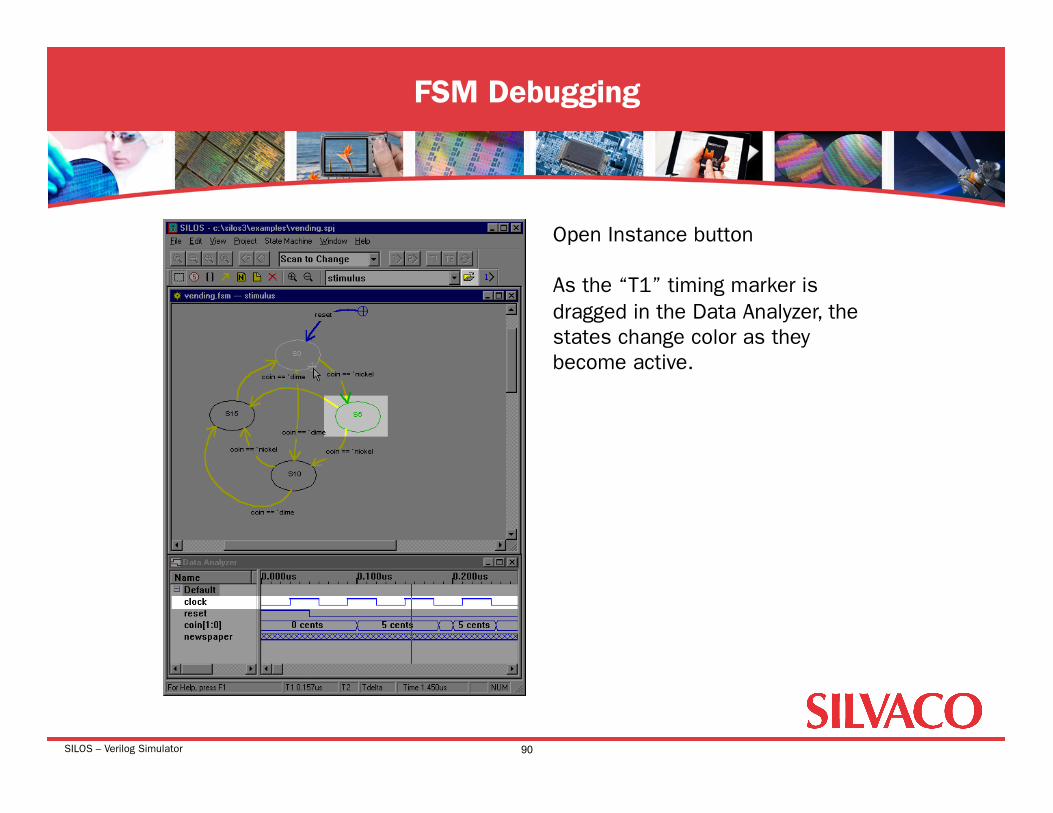
FSM Debugging
90
Open Instance button
As the “T1” timing marker is dragged in the Data Analyzer, the states change color as they become active.
SILOS – Verilog Simulator
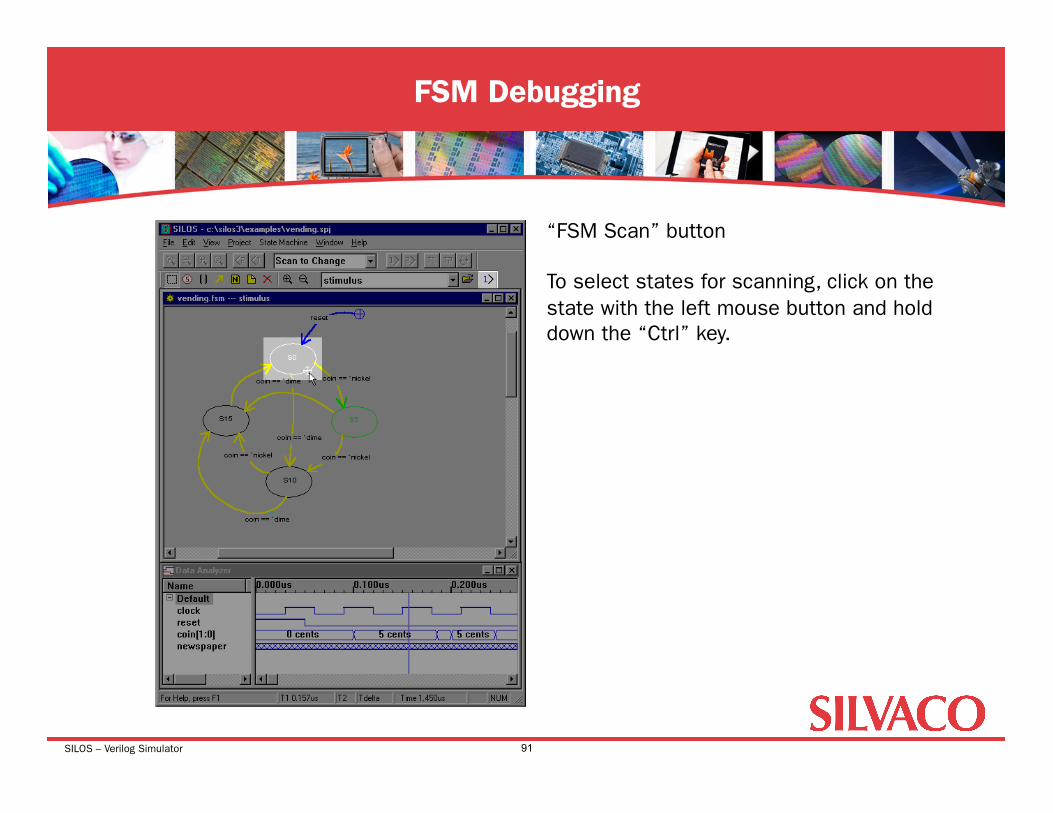
FSM Debugging
91
“FSM Scan” button
To select states for scanning, click on the state with the left mouse button and hold down the “Ctrl” key.

SILOS – Verilog Simulator
FSM Debugging - Finite State Machine Window
92
The minimized Finite State Machine window shows the active state as you scan in the Data Analyzer.
SILOS – Verilog Simulator
• Introduction • Starting Silos Project • Explorer and Analyzer • Source Code Debugging • State Machine Design Entry • Advanced Debugging Features • Finite State Machine Example • Gate Level Debugging
Agenda: Gate Level Debugging
93

SILOS – Verilog Simulator
Gate Level Debugging
94
Highlight signal “newspaper” and click with the right mouse button in the Signal Name list box. Select “Trace Signal Inputs” when the context menu opens.
At time=0.021us, “newspaper” changes from Unknown to Low.
1
1 1
x
x
x
newspaper
IN1
SILOS – Verilog Simulator
Gate Level Debugging
95
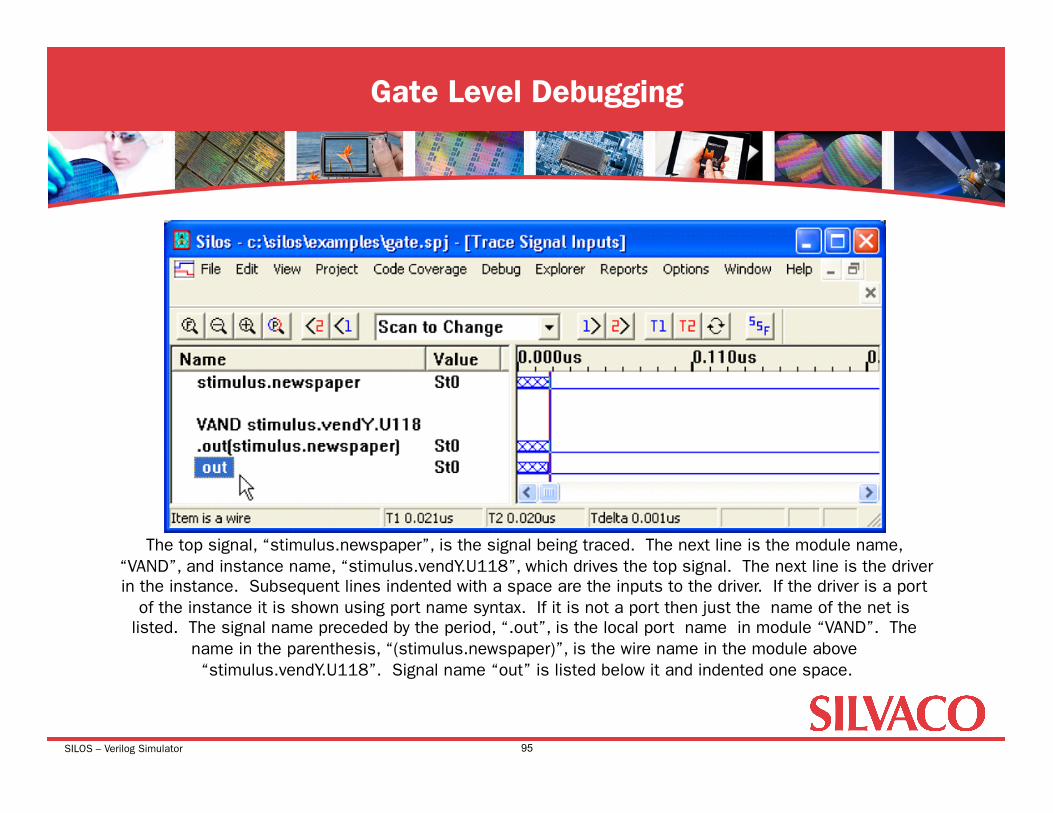
The top signal, “stimulus.newspaper”, is the signal being traced. The next line is the module name, “VAND”, and instance name, “stimulus.vendY.U118”, which drives the top signal. The next line is the driver in the instance. Subsequent lines indented with a space are the inputs to the driver. If the driver is a port
of the instance it is shown using port name syntax. If it is not a port then just the name of the net is listed. The signal name preceded by the period, “.out”, is the local port name in module “VAND”. The
name in the parenthesis, “(stimulus.newspaper)”, is the wire name in the module above “stimulus.vendY.U118”. Signal name “out” is listed below it and indented one space.
SILOS – Verilog Simulator
Gate Level Debugging- Resize Interface
96
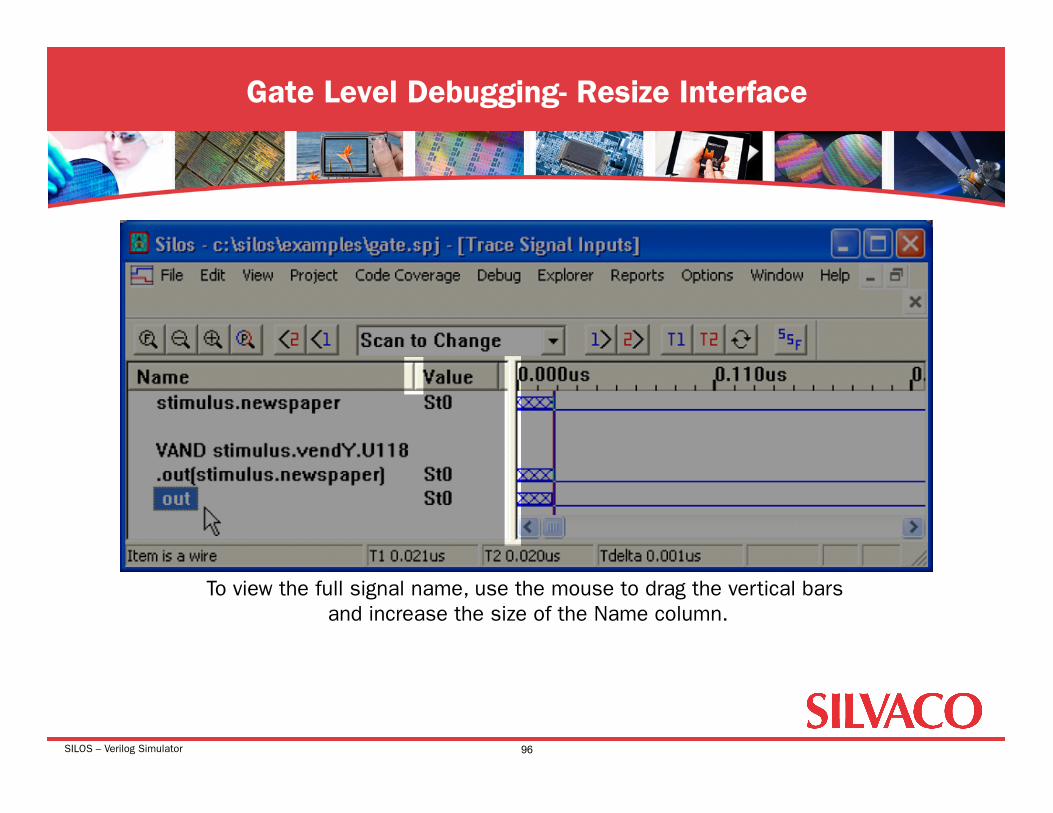
To view the full signal name, use the mouse to drag the vertical bars and increase the size of the Name column.
SILOS – Verilog Simulator
Gate Level Debugging
97
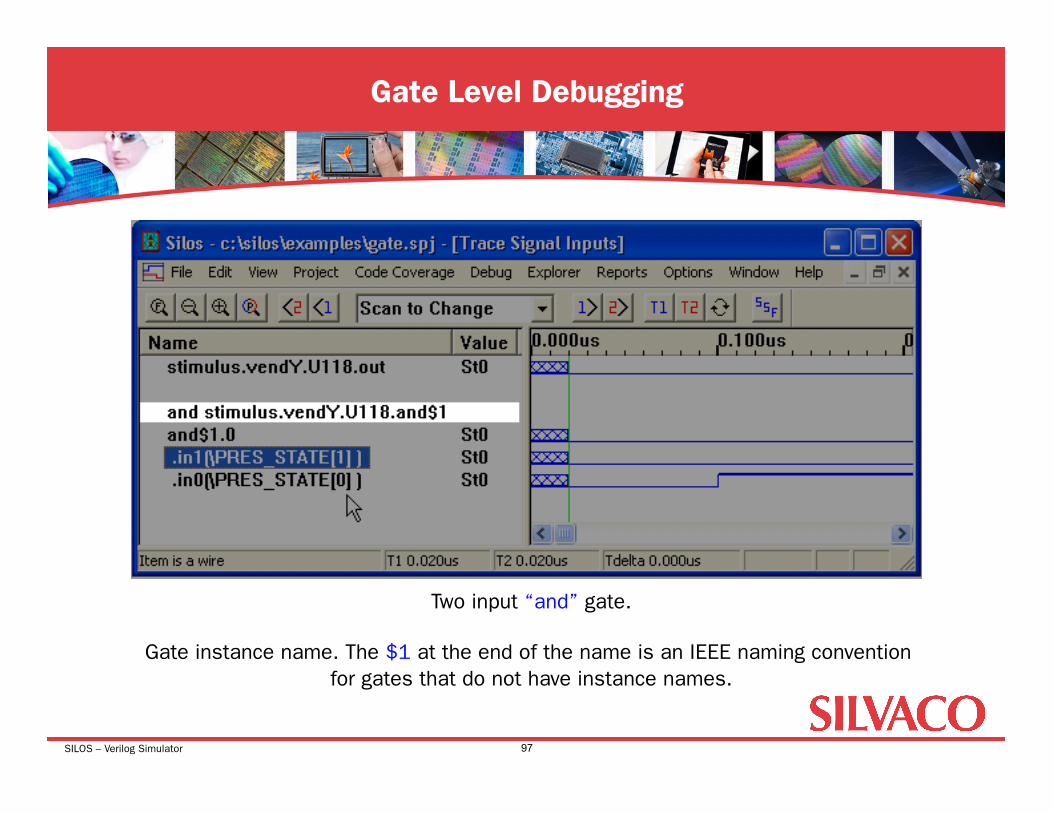
Two input “and” gate.
Gate instance name. The $1 at the end of the name is an IEEE naming convention for gates that do not have instance names.
SILOS – Verilog Simulator
Gate Level Debugging
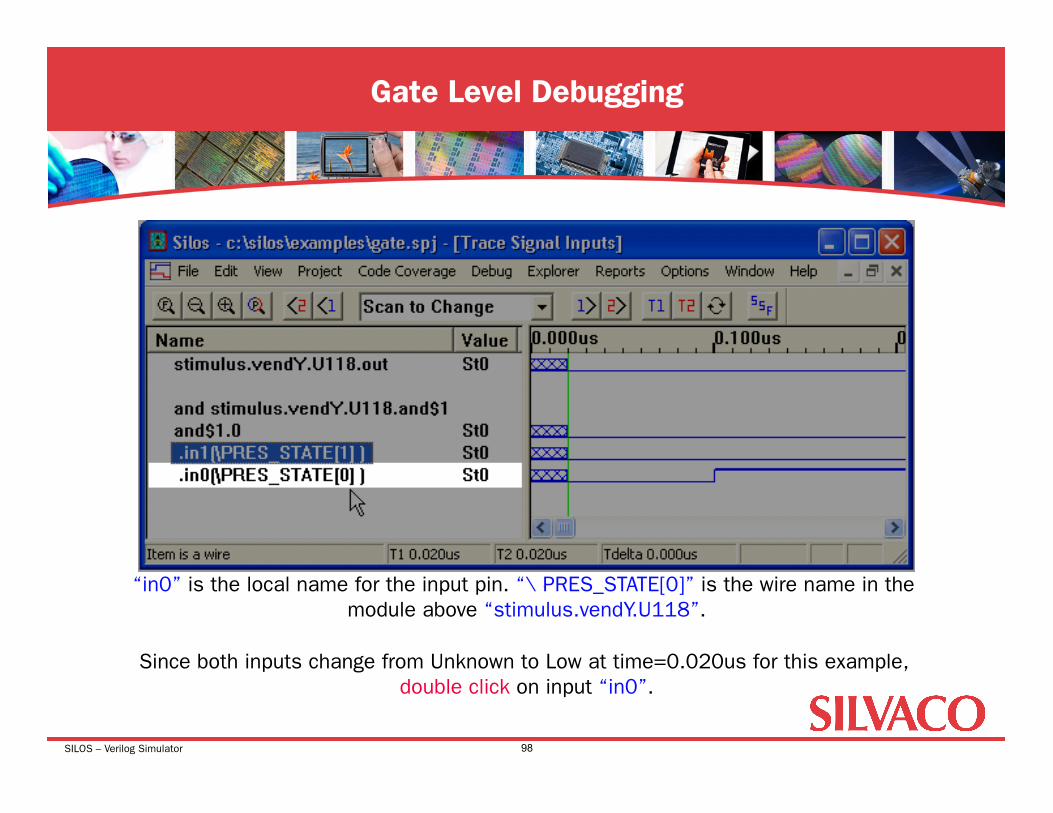
98
“in0” is the local name for the input pin. “\ PRES_STATE[0]” is the wire name in the module above “stimulus.vendY.U118”.
Since both inputs change from Unknown to Low at time=0.020us for this example, double click on input “in0”.

SILOS – Verilog Simulator
Gate Level Debugging - Buffer Gate
99
Buffer gate [1]
Double-click on the input to the buffer to continue tracing back through the topology.
1
SILOS – Verilog Simulator
Gate Level Debugging - Buffer Gate - “qqbar”
100
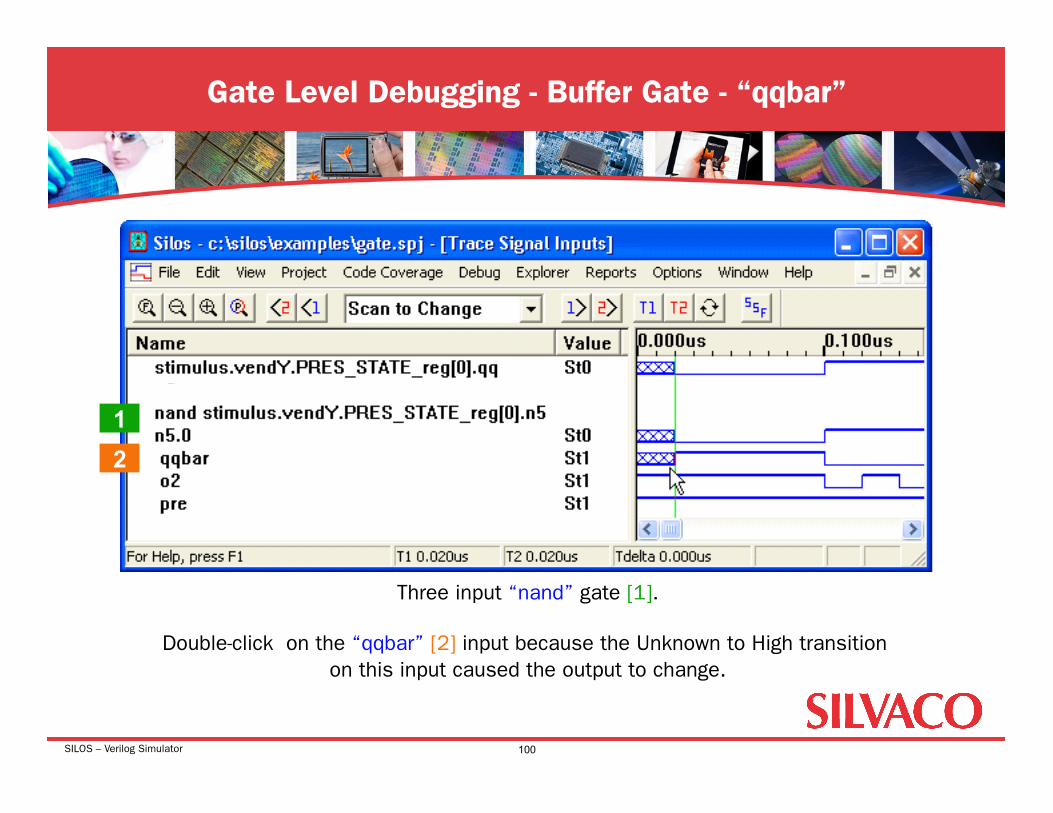
Three input “nand” gate [1].
Double-click on the “qqbar” [2] input because the Unknown to High transition on this input caused the output to change.
1 2

SILOS – Verilog Simulator
Gate Level Debugging - Buffer Gate - “o3”
101
1
2
Three input “nand” gate [1].
Double-click on the “o3” [2] input to the “nand” gate because the High to Low transition on this input caused the output to change.

SILOS – Verilog Simulator
Gate Level Debugging - Buffer Gate - “ck”
102
1
2
Three input “nand” gate [1].
Double-click on the “ck” [2] input to the “nand” gate. The Low to High change on “ck” caused the “nand” gate to change.
SILOS – Verilog Simulator
Gate Level Debugging
103
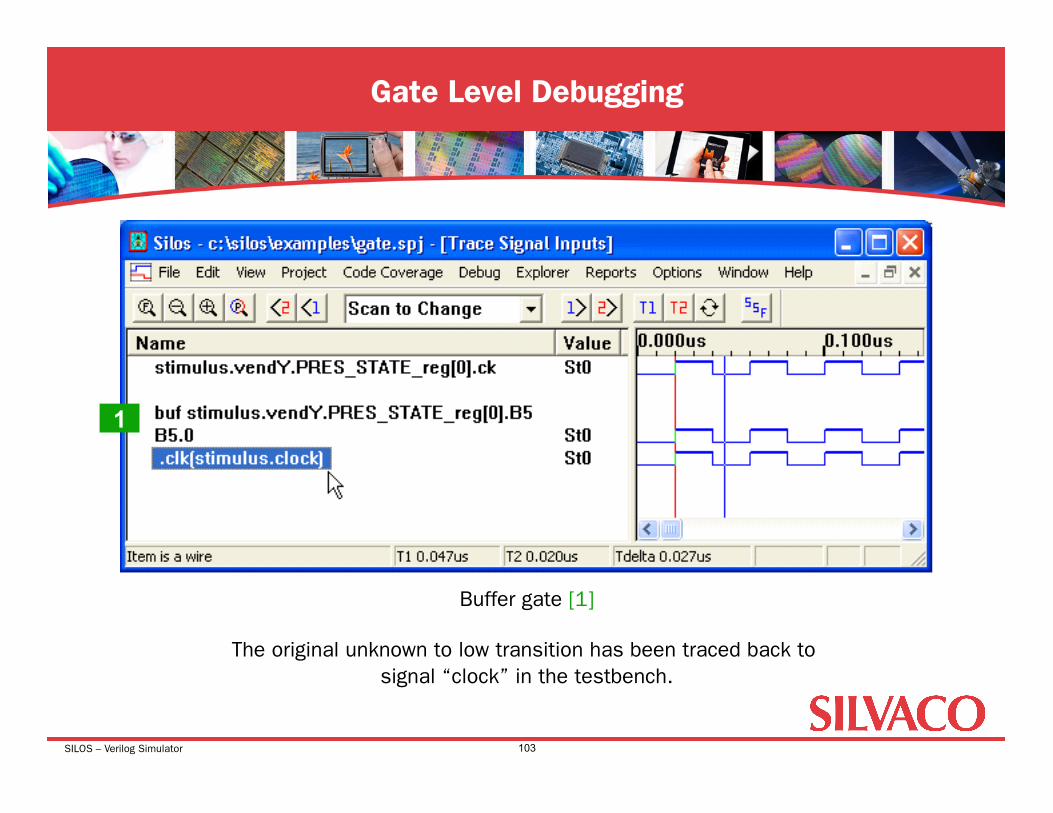
Buffer gate [1]
The original unknown to low transition has been traced back to signal “clock” in the testbench.
1

SILOS – Verilog Simulator
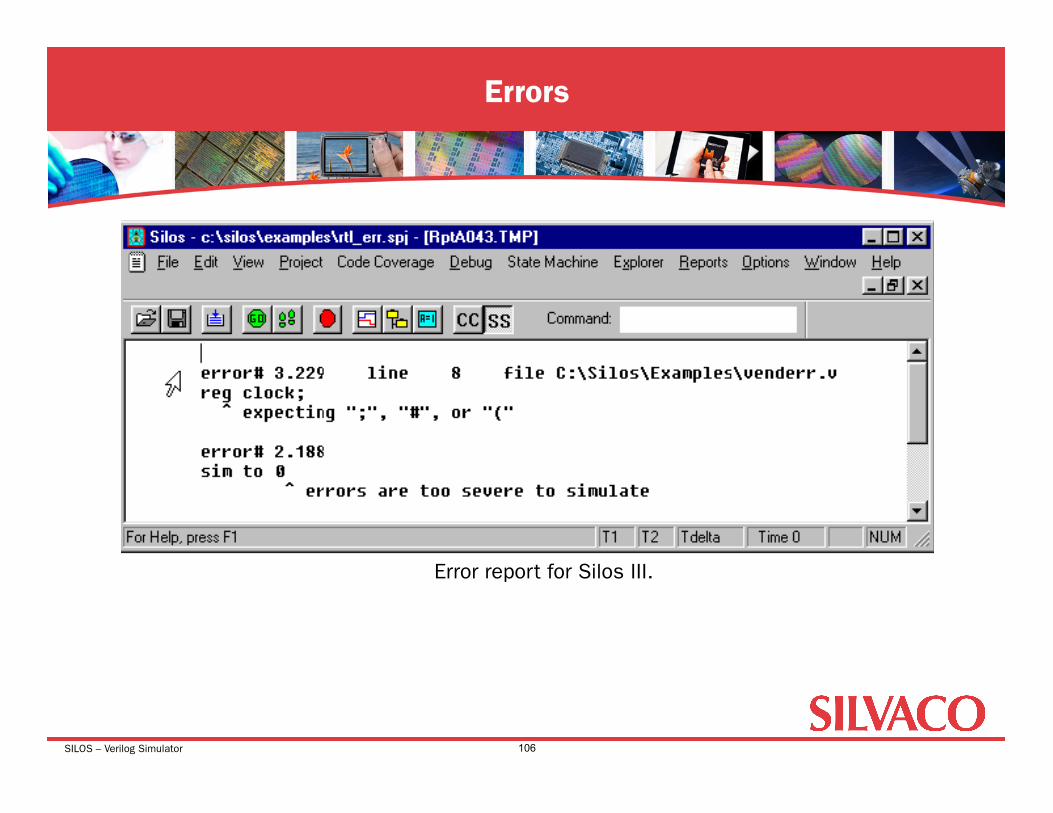
Errors
104
Double click on the error message to automatically open the source file and see the error.
SILOS – Verilog Simulator
Errors
105
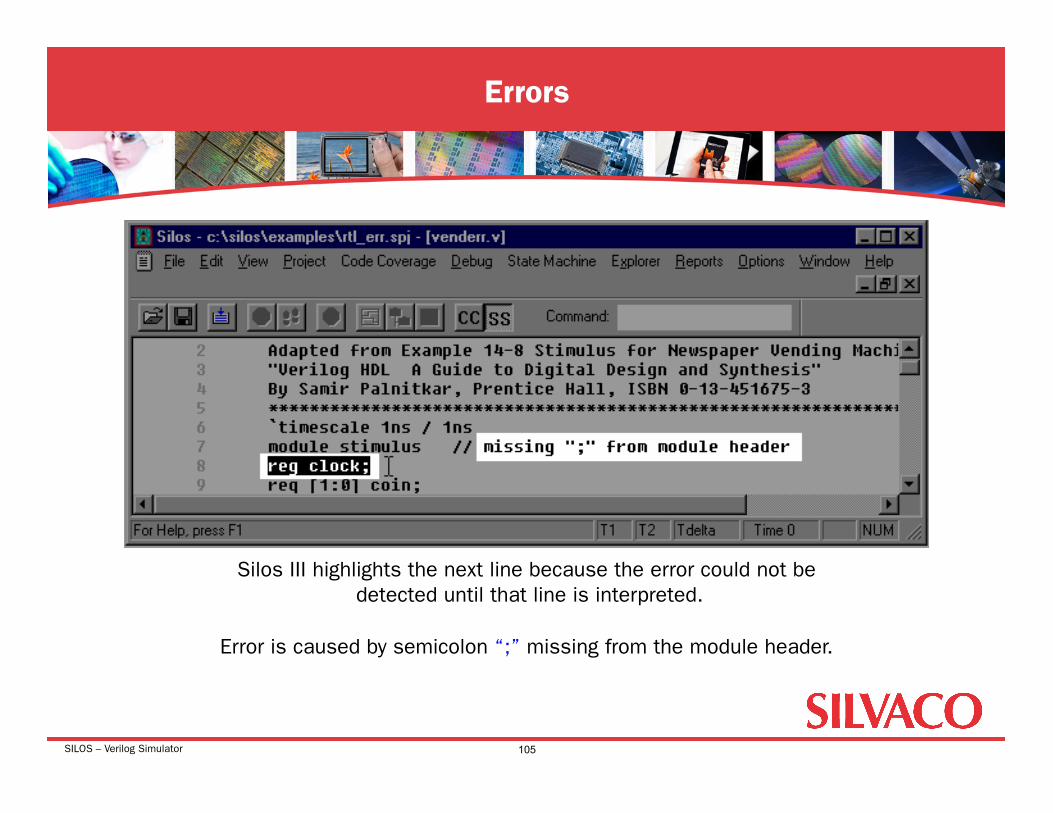
Silos III highlights the next line because the error could not be detected until that line is interpreted.
Error is caused by semicolon “;” missing from the module header.
SILOS – Verilog Simulator
Errors
106
Error report for Silos III.
SILOS – Verilog Simulator
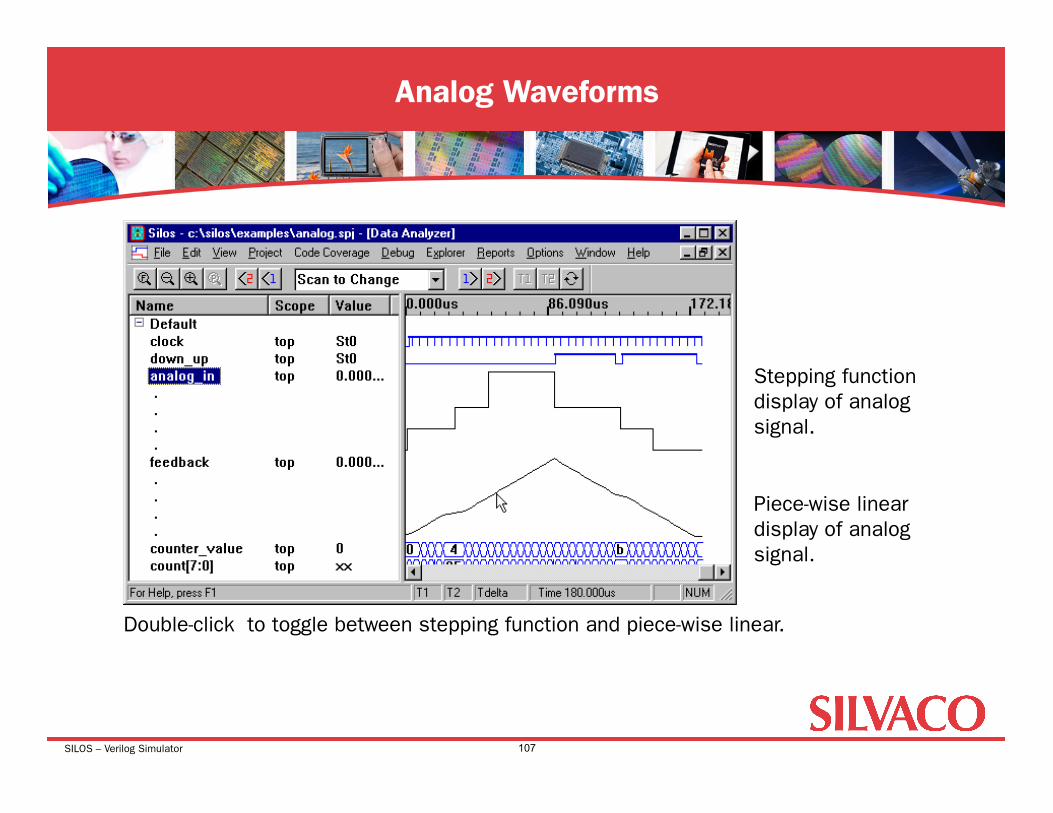
Analog Waveforms
107
Double-click to toggle between stepping function and piece-wise linear.
Piece-wise linear display of analog signal.
Stepping function display of analog signal.
SILOS – Verilog Simulator
• Supports Industry-Standard PLI 1.0 Interface • Currently implementing PLI 2.0
• Silos supports the SDF language as defined by the IEEE 1497 standard for SDF. Silos also supports a commonly used extension used to specify the SDF file of delay values, the “$sdf_annotate” system task. • $sdf_annotate(“file_name”, module_instance);
• Interface for SystemC
Silos Advanced Features
108
SILOS – Verilog Simulator
• Silos-AMS beta release in May 2004 • Integrated power of SmartSpice • Solver improvements for simulation speed • Common Silos GUI on WINDOWS, SUN, and LINUX platforms • STA (Static Timing Analyzer) capability September 2004
Silos Future – Analog Mixed-Signal Solution
109
SILOS – Verilog Simulator
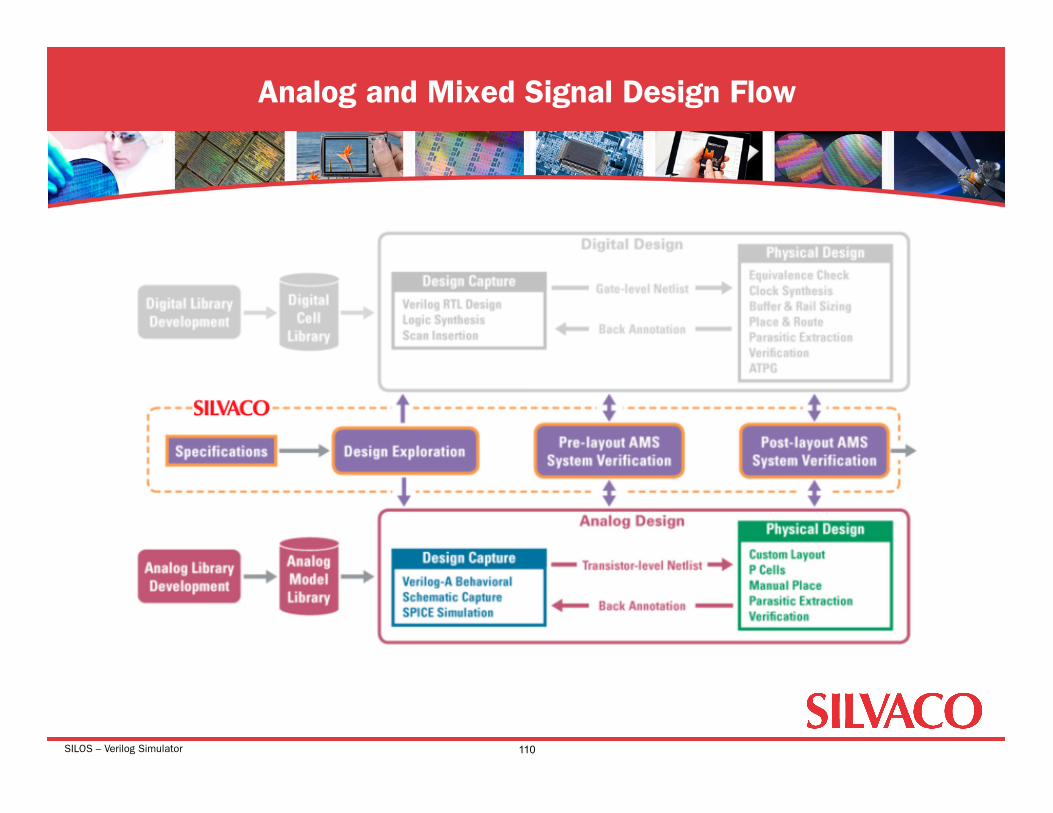
Analog and Mixed Signal Design Flow
110