methane, climate change and waste management
TRANSCRIPT

Methane, Climate Change
and Waste Management:
A review of efforts by Toronto, Ontario and Canada
to reduce waste related emissions of methane
prepared by Greg Jenish
Project Officer
November, 1997
Copyright 1997 Canadian Institute for Environmental Law and Policy. All rights reserved. No part of this publication may be reproduced, stored in a retrieval system, or transmitted, in any form or by any means, photocopying, electronic, mechanical, recording or otherwise without prior written permission of the copyright holder.
Printed in Canada on 100% recycled paper.
Acknowledgements The Canadian Institute for Environmental Law and Policy (CIELAP) would like to thank the Toronto Atmospheric Fund and the George Cedric Metcalf Charitable Foundation for their financial support to this project. Without such support, CIELAP would be unable to undertake many of its research projects which help to inform debate over important public issues and advance reforms of environmental law and public policy in Canada. As well, thanks go to the reviewers of this document : Dr Danny Harvey, University of Toronto and Greg Allen, Allen Kani Associates as well as the Institute's Mark Winfield and Jack Gibbons. The author of this paper, does however assume responsibility for the views expressed in this paper and responsibility for any inaccuracies or misconceptions that may arise. A thank you is also extended to all of the agencies and organizations which provided technical information, background reports and data, including: City of Toronto, Composting Council of Canada, Environment Canada, Municipality of Metropolitan Toronto, Natural Resources Canada, Ontario Ministry of Environment, the US Environmental Protection Agency and many others.
For more information about this publication or its publisher contact the:
Canadian Institute for Environmental Law and Policy
517 College Street, Suite 400 Toronto, Ontario
M6G 4A2
telephone (416) 923-3529 facsimile (416) 923-5949 E-mail: [email protected]
http://www.web.net/cielap
ISBN 1-896588-20-4
Table of Contents
Introduction....................................................................................................................................1
Section 2 : Greenhouse Gas Science and Quantities...................................................................3 Greenhouse gases and their ability to contribute to Climate Change ..................................3 Greenhouse Gases in Canada...............................................................................................4 Nature of Methane and Sources of Emissions .....................................................................6 Compost Methane ..............................................................................................................11 Assessing Methane's Contribution to the Greenhouse Effect ............................................11 Sources of Methane under Study .......................................................................................12 Landfill Methane................................................................................................................13
Section 3: Canadian Commitments on Climate Change .........................................................16 Framework Convention on Climate Change......................................................................16 Canada................................................................................................................................16 Ontario ...............................................................................................................................17 Municipality of Metropolitan Toronto...............................................................................17 The City of Toronto ...........................................................................................................17 Other Relevant Commitments............................................................................................17
Ontario Hydro ........................................................................................................17 20% Club - Federation of Canadian Municipalities...............................................18 Commitments Complimentary to Methane Reduction ..........................................18 Solid Waste Targets ...............................................................................................18 Smog Reduction Targets........................................................................................18
Section 4 : Trends, Analysis of Strategies and Success to Date ..............................................20 Status of the FCCC ............................................................................................................20 Canada................................................................................................................................20 Province of Ontario............................................................................................................22 Municipality of Metropolitan Toronto...............................................................................24 City of Toronto...................................................................................................................27
Realizing Toronto's Targets for GHG Emission Reductions .................................28 Where Waste is Landfilled.....................................................................................28 Public / Private Methods of Disposal.....................................................................29 Waste Diversion / Packaging Reduction Efforts....................................................29 Level of Participation in Programs ........................................................................31 Higher Waste Management Goals .........................................................................31
Summary of Toronto's Strategy .........................................................................................32
Section 5 : Options for Emission Reductions: Preventative Measures .................................35 A Decision-Making Point ..................................................................................................35 The Dilemma of Prevent or Capture ..................................................................................36 Does Diversion Counteract Capture ?................................................................................37 The 'Ideal' Approach ..........................................................................................................37
Preventative Measures: Diversion of Digestible Wastes ...................................................38 Methods of Managing Digestible Waste................................................................38 Source separation to on-site composter .................................................................38 Source separation and processing off-site..............................................................39 Anaerobic Organic Digestion ................................................................................41 Disposal: landfill or incinerate as part of total waste stream .................................43
Section 6 : Options for Emission Reductions: Mitigative Measures .....................................48 Past versus Present Waste Management Practices.................................................48 Collect and combust on-site to reduce methane to carbon dioxide .......................48 Capture and combust for power generation ..........................................................50 Landfill Methane Uses in addition to on-site combustion .....................................51 Trends in Support of Methane Capture..................................................................51
Section 7: Reduction Potentials ..................................................................................................54
Section 8 : Summary, Conclusions and Recommendations .....................................................58
Glossary
Appendix A: Municipal Solid Waste Composition and % Digestible Waste
Appendix B: Landfill Sites in Canada with Gas Capture Systems
Appendix C: Calculations of Digestible Waste entering Landfills in Canada

1
Introduction
In 1992, Canada made a commitment under the United Nations Framework Convention on Climate Change to stabilize its emissions of greenhouse gases (GHGs) at the 1990 level by the year 2000. The principal greenhouse gases (GHG) emitted from sources in Canada are carbon dioxide, methane, nitrous oxide and chlorofluorocarbons. Carbon dioxide accounts for 81% of GHG emissions and has, accordingly, been the focus of much of the effort to date to reach the stabilization target. The process to achieve reductions of carbon dioxide has, however, been painfully slow. Hydrocarbon producers perceive any action on climate change to be a direct threat to their economic interests. This has been obvious at both national and international levels of processes that are intended to translate the objective of the Framework Convention on Climate Change (FCCC) into a working reality in society. The Parties to the FCCC will be meeting in Kyoto, Japan in December 1997 in an effort to reach an agreement on an emissions limiting mechanism. A realizable and binding method of reducing the world's emissions of carbon dioxide is fundamental to averting the possibility of rapid climatic change, yet some nations, such as Canada, are unlikely to offer much in the way of progress on reductions. To advance the goal of greenhouse gas emission reduction, this paper will review the efforts to and methods to reduce the number two GHG, methane. Methane accounts for almost 13% of Canada's GHG emission inventory. It is 21 times more powerful than carbon dioxide as a global warming gas over a 100 year period. On a worldwide basis, an estimated 54% of CH4 emissions are anthropogenic in origin. Important anthropogenic sources include municipal waste management operations (specifically solid waste landfills) and, though not addressed in this paper, fossil fuel extraction, processing and distribution and agricultural operations. Several aspects about the nature of methane gas and its sources of emissions may offer advantages in the quest to curb greenhouse gas emissions, particularly in the short run. Methane cycles through the atmosphere about 20 times more quickly than carbon dioxide, which means that stopping methane emissions today can make quick progress toward reducing the build-up of greenhouse gases in the atmosphere. Reduction of methane emissions may prove somewhat less politically challenging than the efforts to reduce carbon dioxide have proven to be. Methane management can be achieved through a variety of methods ranging from better waste management practices to emission control technology. Any efforts to reduce emissions of methane initiated before the year 2000 could still contribute to closing Canada's projected emission gap that is preventing the nation from achieving the goal of stabilization by 2000. The most recently published value of the emission gap is 8.2% (or 46,500 kt carbon dioxide equivalent). This value is expected to rise to between 11% and 13% in the next assessment. While the focus of this study is methane reduction potential at the municipal level, specifically the City of Toronto and the Municipality of Metropolitan Toronto, discussion is also provided about the potential roles of the Province of Ontario and Government of Canada. These jurisdictions are included for a number of important reasons. For one thing, neither waste nor air emissions obey
2
geographic boundaries - waste from the Toronto area is currently transported across and even out of the province of Ontario. Secondly, statistical information from other jurisdictions is valuable for comparative purposes. Finally, the Province and the federal government have an impact on what activities municipalities are and are not able to conduct through policy, legislation and revenue arrangements. The report begins with a breakdown of the methane inventory in Canada and how it and other greenhouse gases contribute to the likelihood that climate change will be brought on by society's activities. A review of the commitments by jurisdictions to curb greenhouse gas emissions, and their efforts and strategies to honour these commitments is provided. Options which may help to advance the goals of preventing methane production in future and managing the emissions that already exist are offered. Finally, an assessment of the potential of preventative methods and mitigative methods is provided.

3
Section 2 : Greenhouse Gas Science and Quantities
Greenhouse gases and their ability to contribute to Climate Change The Intergovernmental Panel on Climate Change (IPCC) is a United Nations body composed of international scientists that is charged with the task of assessing the impact of greenhouse gases on the global climatic system. In 1995 the IPCC said in regard to this matter that:
"The atmospheric concentrations of the greenhouse gases, and among them, carbon dioxide (CO2), methane (CH4) and nitrous oxide (N2O), have grown significantly since pre-industrial times (about 1750 A.D.): CO2 from about 280 to almost 360 ppmv, CH4 from 700 to 1720 ppbv and N2O from about 275 to about 310 ppbv. These trends can be attributed largely to human activities, mostly fossil fuel use, land-use change and agriculture. Concentrations of other anthropogenic greenhouse gases have also increased. An increase of greenhouse gas concentrations leads on average to an additional warming of the atmosphere and the Earth's surface. Many greenhouse gases remain in the atmosphere - and affect climate - for a long time." i
In 1995, the Intergovernmental Panel on Climate Change Working Group I released its most strongly worded statement regarding human influence on global climate. The Working Group said the following regarding climate change detection and attribution in its 1995 Summary for Policymakers:
"Global mean surface temperature has increased by between about 0.3 and 0.6°C since the late 19th century, a change that is unlikely to be entirely natural in origin. The balance of evidence, from changes in global mean surface air temperature and from changes in geographical, seasonal and vertical patterns of atmospheric temperature, suggests a discernible human influence on global climate."ii
According to the 1995 scientific assessment by the IPCCiii, global climate change could manifest itself in the following manner:
� A 2°C increase in the global mean surface air temperature relative to 1990, by the year 2100 based on the mid-range IPCC emission scenario and assuming the "best estimate" value of
climate sensitivity. The lowest emission scenario projected an increase of 1°C by 2100 while
the highest emission scenario projected a 3.5°C increase by 2100. This range had formerly
been projected to be 1 to 4.5°C. � In all scenarios, the average rate of warming would probably be greater than any experienced
in the past 10,000 years. Regional temperature changes could differ substantially from the global mean value.
� Average sea level is expected to rise 50 cm between now and 2100. The range, based on low
and high emission scenarios, is from 15 cm to 95 cm. Sea level rise is a consequence of
4
thermal expansion of the oceans as well as the melting of glaciers and ice sheets. � A general warming is expected to lead to an increase in the occurrence of extremely hot days
and a decrease in the occurrence to extremely cold days. � Warmer temperatures will lead to a more vigorous hydrological cycle; this translates into
prospects for more severe droughts and/or floods in some places and less severe droughts and/or floods in other places. Several models indicate an increase in precipitation intensity, suggesting a possibility for more extreme rainfall events.
The projected increase in global mean surface temperature forecast by the IPCC is 1.5 to 3.5°C.
While an increase of 1.5 to 3.5°C may seem small, two points must be emphasized. Firstly, this change reflects only the global average, and therefore the range of temperature change will vary
substantially worldwide with some areas experiencing as much as an 8°C change and others none at
all. Secondly, it should be noted that a change in the global mean temperature of even 1.5°C would make the Earth warmer than it has been for 150,000 years.iv
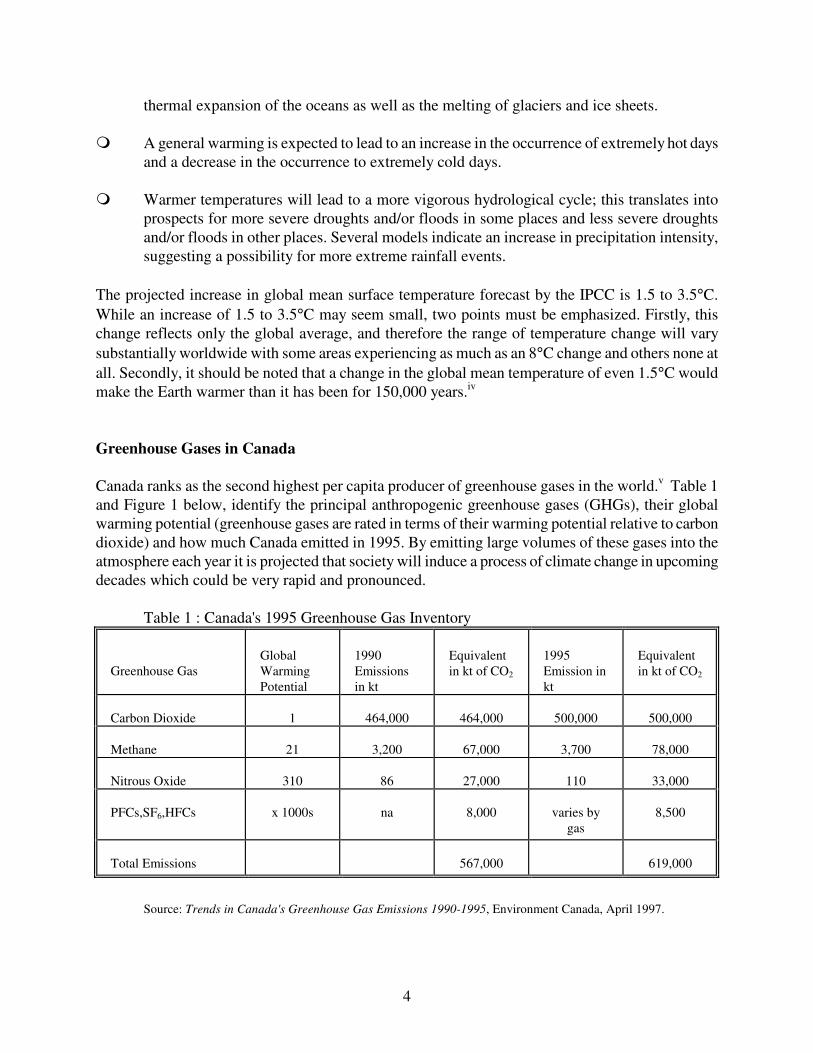
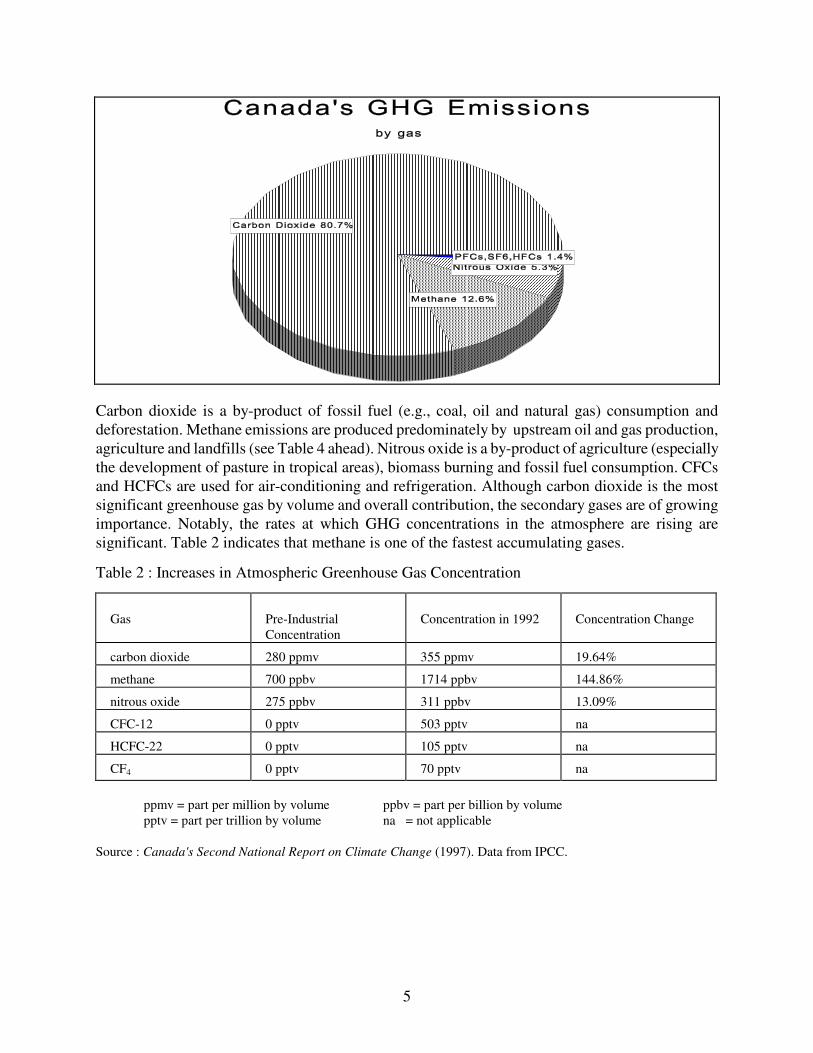
Greenhouse Gases in Canada Canada ranks as the second highest per capita producer of greenhouse gases in the world.v Table 1 and Figure 1 below, identify the principal anthropogenic greenhouse gases (GHGs), their global warming potential (greenhouse gases are rated in terms of their warming potential relative to carbon dioxide) and how much Canada emitted in 1995. By emitting large volumes of these gases into the atmosphere each year it is projected that society will induce a process of climate change in upcoming decades which could be very rapid and pronounced.
Table 1 : Canada's 1995 Greenhouse Gas Inventory
Greenhouse Gas
Global Warming Potential
1990 Emissions in kt
Equivalent in kt of CO2
1995 Emission in kt
Equivalent in kt of CO2
Carbon Dioxide
1
464,000
464,000
500,000
500,000
Methane
21
3,200
67,000
3,700
78,000
Nitrous Oxide
310
86
27,000
110
33,000
PFCs,SF6,HFCs
x 1000s
na
8,000
varies by
gas
8,500
Total Emissions
567,000
619,000
Source: Trends in Canada's Greenhouse Gas Emissions 1990-1995, Environment Canada, April 1997.
5
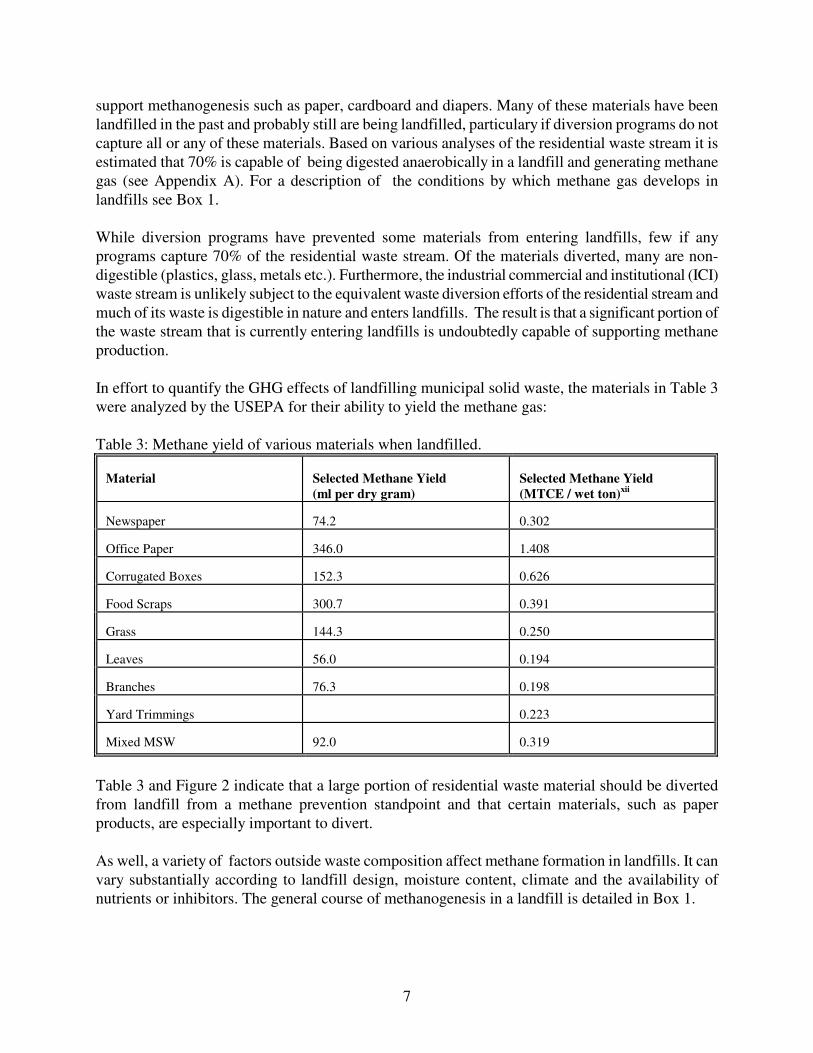
Carbon dioxide is a by-product of fossil fuel (e.g., coal, oil and natural gas) consumption and deforestation. Methane emissions are produced predominately by upstream oil and gas production, agriculture and landfills (see Table 4 ahead). Nitrous oxide is a by-product of agriculture (especially the development of pasture in tropical areas), biomass burning and fossil fuel consumption. CFCs and HCFCs are used for air-conditioning and refrigeration. Although carbon dioxide is the most significant greenhouse gas by volume and overall contribution, the secondary gases are of growing importance. Notably, the rates at which GHG concentrations in the atmosphere are rising are significant. Table 2 indicates that methane is one of the fastest accumulating gases.
Table 2 : Increases in Atmospheric Greenhouse Gas Concentration
Gas
Pre-Industrial Concentration
Concentration in 1992
Concentration Change
carbon dioxide
280 ppmv
355 ppmv
19.64%
methane
700 ppbv
1714 ppbv
144.86%
nitrous oxide
275 ppbv
311 ppbv
13.09%
CFC-12
0 pptv
503 pptv
na
HCFC-22
0 pptv
105 pptv
na
CF4
0 pptv
70 pptv
na
ppmv = part per million by volume ppbv = part per billion by volume pptv = part per trillion by volume na = not applicable
Source : Canada's Second National Report on Climate Change (1997). Data from IPCC.

6
Nature of Methane and Sources of Emissions Methane (CH4) is created by the anaerobic decomposition of organic material. Vast quantities of fossilized methane exist in the earth's crust (effectively what is known as 'natural gas') and trapped in frozen muskeg in polar regions. It is emitted from wetlands and decaying vegetation in forests. When fossil fuel extractions are made, natural gas (largely methane) may be released. When plant or other organic matter decays in the absence of oxygen, as in a landfill, methane is created. It is also produced within the digestive tract of ruminant animals. Natural sources of methane should be well managed by corresponding sinks of methane. In the absence of human intervention, sinks and sources and natural biological processes should be able to keep the atmospheric concentration of methane relatively constant at about 600 to 700 ppbv.vi This was the case during this millennium, up until the Industrial Revolution, before society began increasing its output of the substance. Now, after more than two centuries of industrialization, anthropogenic sources of methane outrank natural sources and the atmospheric concentration of methane is now at 1714 ppbv.vii Methane's atmospheric lifespan is quite brief as compared to other greenhouse gases. Methane has a residence of 10 years whereas carbon dioxide's is about 200 years. This short lifespan underscores its greenhouse effect reducing potential; if reductions are made, then the atmospheric concentration of methane should diminish relatively fast compared to the effect of reductions of carbon dioxide. Despite its short residence, methane's concentration has risen the most in percentage terms of all the greenhouse gases since the Industrial Revolution (see Table 4). This trend clearly illuminates the enormously consequential effects that rapid industrialization and alteration of the natural environment can have on the earth and it's atmosphere. On average, about 70% of the estimated 510 megatonnes (Mt) of methane released yearly comes from natural and human induced surface biological processes, about 20% from the escape of natural gas from fossil fuel sources and 10% from biomass burningviii. In terms of the natural and anthropogenic split, it is estimated that 275 Mt per year are anthropogenic (54%) and 235 Mt are natural in origin (46%).ix Wetlands are the largest contributor of the natural stock of methane emissions (about 75%).x Methane is also combustible and explosive in concentrations of between 5-15% when mixed with air.xi Obviously, this quality could present a public safety hazard, particularly if emissions are left unchecked. As a combustible hydrocarbon gas, methane has some desirable environmental properties. It has the lowest carbon content (4 hydrogen to 1 carbon atom) of any hydrocarbon fuel which means its use will yield the lowest amount of carbon dioxide per unit consumed. Gasoline and coal are much more carbon-rich and much more likely to yield other undesirable substances, such as air-borne toxins, acid precipitation precursors, phenolics and volatile organic compounds, when combusted. The methane stock which is most relevant to this study is produced from all types of anaerobically digestible waste in the municipal waste stream. This includes food wastes and yard wastes (referred to as the organic fraction and generally regarded as being about 30% of the municipal solid waste stream); however it also includes many other materials which are capable of providing carbon to
7
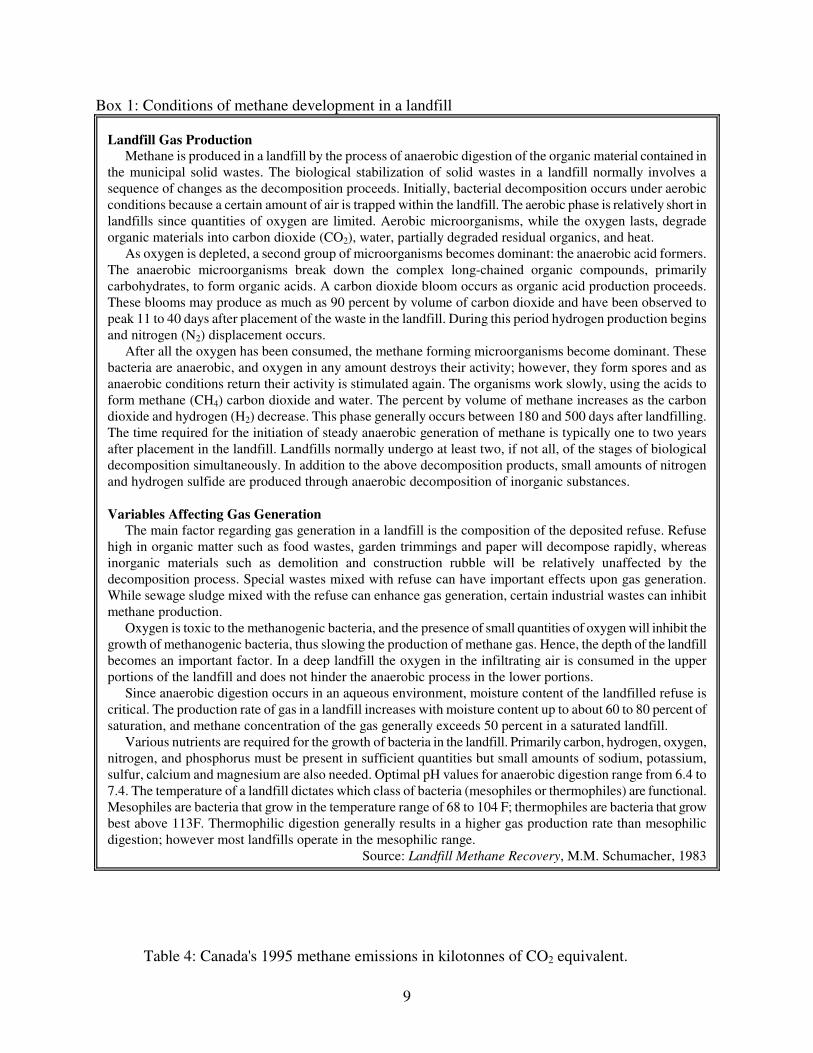
support methanogenesis such as paper, cardboard and diapers. Many of these materials have been landfilled in the past and probably still are being landfilled, particulary if diversion programs do not capture all or any of these materials. Based on various analyses of the residential waste stream it is estimated that 70% is capable of being digested anaerobically in a landfill and generating methane gas (see Appendix A). For a description of the conditions by which methane gas develops in landfills see Box 1. While diversion programs have prevented some materials from entering landfills, few if any programs capture 70% of the residential waste stream. Of the materials diverted, many are non-digestible (plastics, glass, metals etc.). Furthermore, the industrial commercial and institutional (ICI) waste stream is unlikely subject to the equivalent waste diversion efforts of the residential stream and much of its waste is digestible in nature and enters landfills. The result is that a significant portion of the waste stream that is currently entering landfills is undoubtedly capable of supporting methane production. In effort to quantify the GHG effects of landfilling municipal solid waste, the materials in Table 3 were analyzed by the USEPA for their ability to yield the methane gas: Table 3: Methane yield of various materials when landfilled.
Material
Selected Methane Yield
(ml per dry gram)
Selected Methane Yield
(MTCE / wet ton)xii
Newspaper
74.2
0.302
Office Paper
346.0
1.408
Corrugated Boxes
152.3
0.626
Food Scraps
300.7
0.391
Grass
144.3
0.250
Leaves
56.0
0.194
Branches
76.3
0.198
Yard Trimmings
0.223
Mixed MSW
92.0
0.319
Table 3 and Figure 2 indicate that a large portion of residential waste material should be diverted from landfill from a methane prevention standpoint and that certain materials, such as paper products, are especially important to divert. As well, a variety of factors outside waste composition affect methane formation in landfills. It can vary substantially according to landfill design, moisture content, climate and the availability of nutrients or inhibitors. The general course of methanogenesis in a landfill is detailed in Box 1.

8
Estimating Canada's Methane Emissions Environment Canada has assembled an inventory of all of Canada's greenhouse gases and their trends over the period 1990-1995. Those pertaining to methane for the year 1995 are detailed in Table 4. Landfills are the third largest source at 870 kilotonnes or 23% of all of Canada's methane emissions for that year.
9
Box 1: Conditions of methane development in a landfill Landfill Gas Production Methane is produced in a landfill by the process of anaerobic digestion of the organic material contained in the municipal solid wastes. The biological stabilization of solid wastes in a landfill normally involves a sequence of changes as the decomposition proceeds. Initially, bacterial decomposition occurs under aerobic conditions because a certain amount of air is trapped within the landfill. The aerobic phase is relatively short in landfills since quantities of oxygen are limited. Aerobic microorganisms, while the oxygen lasts, degrade organic materials into carbon dioxide (CO2), water, partially degraded residual organics, and heat. As oxygen is depleted, a second group of microorganisms becomes dominant: the anaerobic acid formers. The anaerobic microorganisms break down the complex long-chained organic compounds, primarily carbohydrates, to form organic acids. A carbon dioxide bloom occurs as organic acid production proceeds. These blooms may produce as much as 90 percent by volume of carbon dioxide and have been observed to peak 11 to 40 days after placement of the waste in the landfill. During this period hydrogen production begins and nitrogen (N2) displacement occurs. After all the oxygen has been consumed, the methane forming microorganisms become dominant. These bacteria are anaerobic, and oxygen in any amount destroys their activity; however, they form spores and as anaerobic conditions return their activity is stimulated again. The organisms work slowly, using the acids to form methane (CH4) carbon dioxide and water. The percent by volume of methane increases as the carbon dioxide and hydrogen (H2) decrease. This phase generally occurs between 180 and 500 days after landfilling. The time required for the initiation of steady anaerobic generation of methane is typically one to two years after placement in the landfill. Landfills normally undergo at least two, if not all, of the stages of biological decomposition simultaneously. In addition to the above decomposition products, small amounts of nitrogen and hydrogen sulfide are produced through anaerobic decomposition of inorganic substances.
Variables Affecting Gas Generation The main factor regarding gas generation in a landfill is the composition of the deposited refuse. Refuse high in organic matter such as food wastes, garden trimmings and paper will decompose rapidly, whereas inorganic materials such as demolition and construction rubble will be relatively unaffected by the decomposition process. Special wastes mixed with refuse can have important effects upon gas generation. While sewage sludge mixed with the refuse can enhance gas generation, certain industrial wastes can inhibit methane production. Oxygen is toxic to the methanogenic bacteria, and the presence of small quantities of oxygen will inhibit the growth of methanogenic bacteria, thus slowing the production of methane gas. Hence, the depth of the landfill becomes an important factor. In a deep landfill the oxygen in the infiltrating air is consumed in the upper portions of the landfill and does not hinder the anaerobic process in the lower portions. Since anaerobic digestion occurs in an aqueous environment, moisture content of the landfilled refuse is critical. The production rate of gas in a landfill increases with moisture content up to about 60 to 80 percent of saturation, and methane concentration of the gas generally exceeds 50 percent in a saturated landfill. Various nutrients are required for the growth of bacteria in the landfill. Primarily carbon, hydrogen, oxygen, nitrogen, and phosphorus must be present in sufficient quantities but small amounts of sodium, potassium, sulfur, calcium and magnesium are also needed. Optimal pH values for anaerobic digestion range from 6.4 to 7.4. The temperature of a landfill dictates which class of bacteria (mesophiles or thermophiles) are functional. Mesophiles are bacteria that grow in the temperature range of 68 to 104 F; thermophiles are bacteria that grow best above 113F. Thermophilic digestion generally results in a higher gas production rate than mesophilic digestion; however most landfills operate in the mesophilic range. Source: Landfill Methane Recovery, M.M. Schumacher, 1983
Table 4: Canada's 1995 methane emissions in kilotonnes of CO2 equivalent.

10
Source of Anthropogenic Methane
CH4 Emissions
in Kilotonnes
CH4 in CO2
Equivalent
% of Ttl CH4
Emissions Upstream Oil and Gas
1600
33600
42.35 %
Livestock/Manure
1000
21000
26.47 %
Landfills
870
18270
23.03 %
Natural Gas Distribution
150
3150
3.97 %
Coal Mining
82
1722
2.17 %
Wastewater/Compost
19
399
0.50 %
Firewood Residential
16
336
0.42 %
Prescribed Burning
13
273
0.34 %
Automobiles
10
210
0.26 %
Light Duty Gasoline Trucks
4
84
0.11 %
Industrial Applications
3
63
0.08 %
Heavy-Duty Diesel Vehicles
2
42
0.05 %
Residential
1
21
0.03 %
Municipal Solid Waste Incineration
1
21
0.03 %
Power Generation
1
21
0.03 %
Commercial
1
21
0.03 %
Producer Consumption
1
21
0.03 %
Firewood Industrial
1
21
0.03 %
Off-road Diesel
1
21
0.03 %
Rail
1
21
0.03 %
Air
1
21
0.03 %
Totals*
3700
78000
100.00 %
* Totals will not equal the sum of the columns due to rounding. Source: Trends in Greenhouse Gas Emissions 1990-1995. Environment Canada, April 1997.
Sources other than Landfills Although wastewater treatment plants and the network of mains that supply them are potential generators of methane, most modern facilities have been designed to specifically avoid methane gas production in their processes. The need to do so is obvious, given that methane presents both odour problems and a potential explosive hazard.xiii Most sewage treatment plants which do employ anaerobic digestion employ methane capture systems in their processes. The captured methane is
11
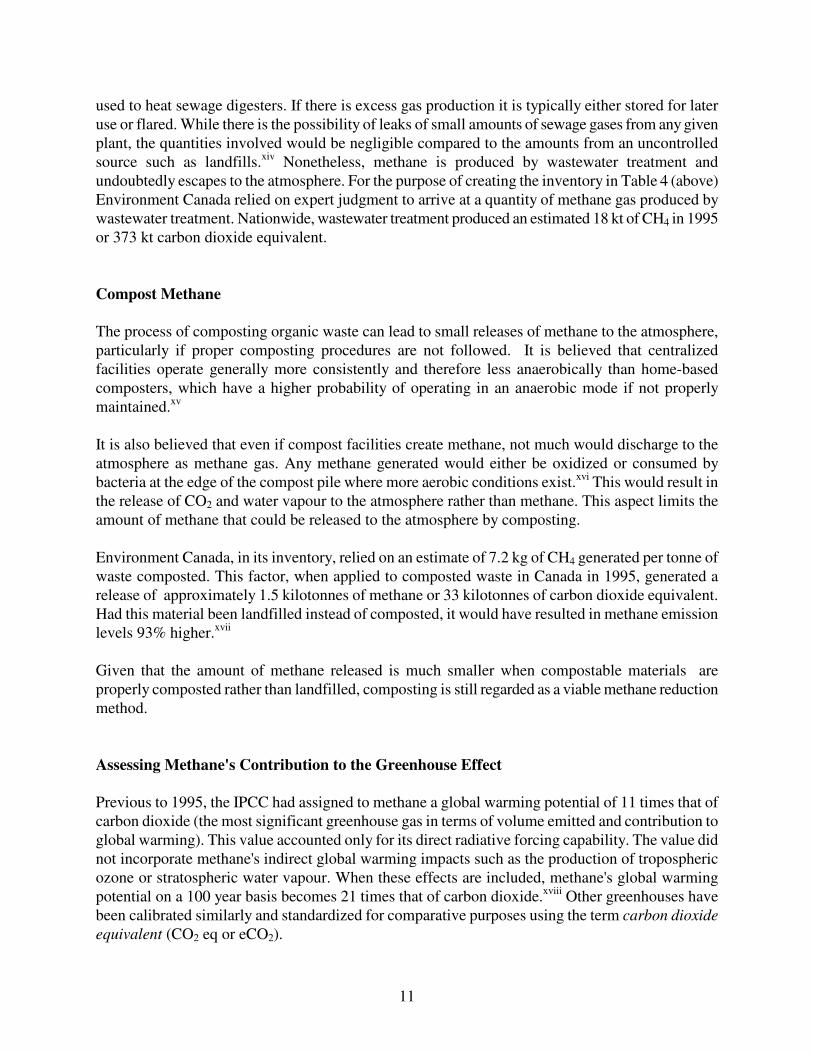
used to heat sewage digesters. If there is excess gas production it is typically either stored for later use or flared. While there is the possibility of leaks of small amounts of sewage gases from any given plant, the quantities involved would be negligible compared to the amounts from an uncontrolled source such as landfills.xiv Nonetheless, methane is produced by wastewater treatment and undoubtedly escapes to the atmosphere. For the purpose of creating the inventory in Table 4 (above) Environment Canada relied on expert judgment to arrive at a quantity of methane gas produced by wastewater treatment. Nationwide, wastewater treatment produced an estimated 18 kt of CH4 in 1995 or 373 kt carbon dioxide equivalent.
Compost Methane The process of composting organic waste can lead to small releases of methane to the atmosphere, particularly if proper composting procedures are not followed. It is believed that centralized facilities operate generally more consistently and therefore less anaerobically than home-based composters, which have a higher probability of operating in an anaerobic mode if not properly maintained.xv It is also believed that even if compost facilities create methane, not much would discharge to the atmosphere as methane gas. Any methane generated would either be oxidized or consumed by bacteria at the edge of the compost pile where more aerobic conditions exist.xvi This would result in the release of CO2 and water vapour to the atmosphere rather than methane. This aspect limits the amount of methane that could be released to the atmosphere by composting. Environment Canada, in its inventory, relied on an estimate of 7.2 kg of CH4 generated per tonne of waste composted. This factor, when applied to composted waste in Canada in 1995, generated a release of approximately 1.5 kilotonnes of methane or 33 kilotonnes of carbon dioxide equivalent. Had this material been landfilled instead of composted, it would have resulted in methane emission levels 93% higher.xvii Given that the amount of methane released is much smaller when compostable materials are properly composted rather than landfilled, composting is still regarded as a viable methane reduction method.
Assessing Methane's Contribution to the Greenhouse Effect Previous to 1995, the IPCC had assigned to methane a global warming potential of 11 times that of carbon dioxide (the most significant greenhouse gas in terms of volume emitted and contribution to global warming). This value accounted only for its direct radiative forcing capability. The value did not incorporate methane's indirect global warming impacts such as the production of tropospheric ozone or stratospheric water vapour. When these effects are included, methane's global warming potential on a 100 year basis becomes 21 times that of carbon dioxide.xviii Other greenhouses have been calibrated similarly and standardized for comparative purposes using the term carbon dioxide
equivalent (CO2 eq or eCO2).

12
Under the reassessed GWP value, the proportion of Canada's GHG inventory attributable to methane increased (as did all other national inventories which included methane emissions). Up until 1995, methane emissions were thought to account for about 8% of all of Canada's GHGs; using the latest reassessment, CH4 accounts for about 13%. Using more sensitive and detailed analyses suggests that methane's contribution to global warming may be even greater than 21 times CO2. As methane breaks down in the atmosphere by reacting with OH molecules it converts to CO2 and water vapour which both have global warming attributes.xix This breakdown ensures that the concentration of OH molecules decreases, which in turn increases the lifespan of remaining molecules of methane and contributes to an increase in ozone concentrations.xx When all of the indirect effects of methane emissions (which may be greater than the direct effects) are incorporated, methane's potential contribution to global warming is quite significant. In fact, it is estimated that the net contribution of methane emissions to the past decade's increase in potential global warming is more than one third of the net contribution made by carbon dioxide (see Figure 3).xxi
Sources of Methane under Study As detailed in Table 4 above, the sources of methane related to municipal functions include landfills, wastewater treatment plants, compost facilities and incineration. However, the topic of principal review in this paper will be the reduction of emissions from the largest single source within the municipal sphere: the landfilling of digestible waste (see Table 5 below). The approach involved will be the review of various jurisdictions' strategies to: a) divert waste from landfill, in particular those wastes which are digestible and that can form
13
methane gas (even in the event that waste diversion to prevent landfill gas production was not the primary design element of a jurisdiction's strategy, it is a consequence of such diversion and has become central to many jurisdiction's greenhouse gas management strategies since the time that they were initiated);
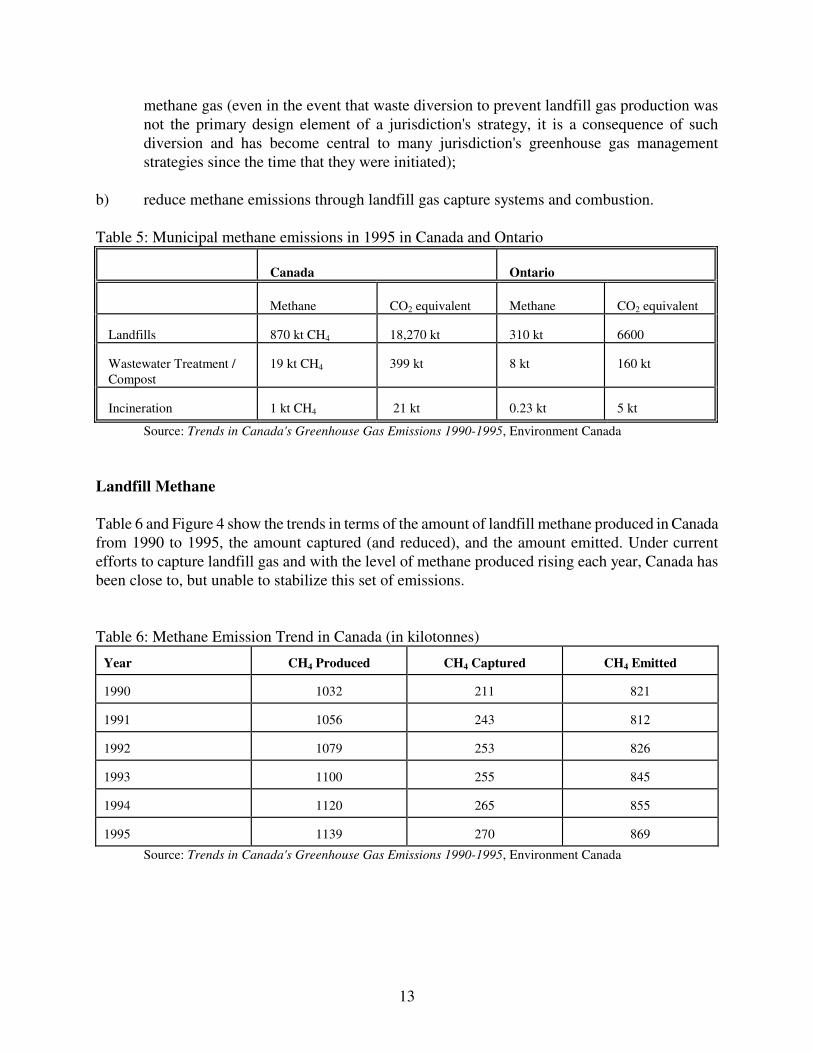
b) reduce methane emissions through landfill gas capture systems and combustion. Table 5: Municipal methane emissions in 1995 in Canada and Ontario
Canada
Ontario
Methane CO2 equivalent
Methane
CO2 equivalent
Landfills
870 kt CH4
18,270 kt
310 kt
6600
Wastewater Treatment / Compost
19 kt CH4
399 kt
8 kt
160 kt
Incineration
1 kt CH4
21 kt
0.23 kt
5 kt
Source: Trends in Canada's Greenhouse Gas Emissions 1990-1995, Environment Canada
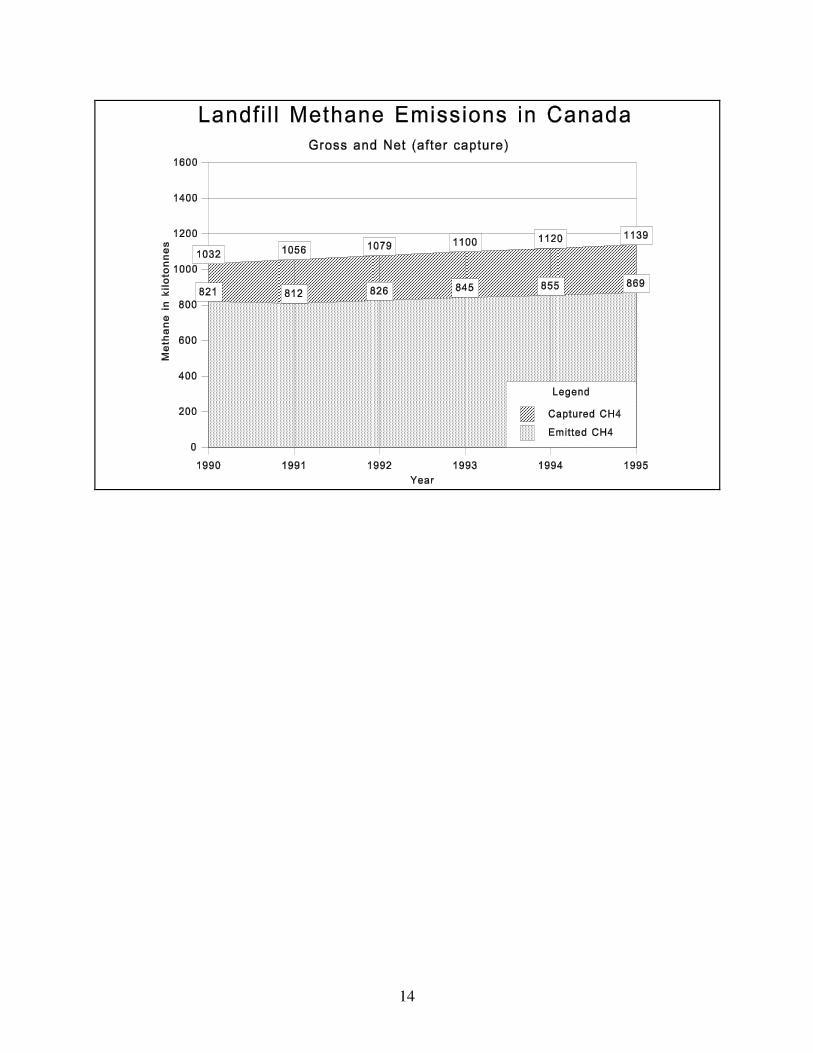
Landfill Methane Table 6 and Figure 4 show the trends in terms of the amount of landfill methane produced in Canada from 1990 to 1995, the amount captured (and reduced), and the amount emitted. Under current efforts to capture landfill gas and with the level of methane produced rising each year, Canada has been close to, but unable to stabilize this set of emissions. Table 6: Methane Emission Trend in Canada (in kilotonnes) Year
CH4 Produced
CH4 Captured
CH4 Emitted
1990
1032
211
821
1991
1056
243
812
1992
1079
253
826
1993
1100
255
845
1994
1120
265
855
1995
1139
270
869
Source: Trends in Canada's Greenhouse Gas Emissions 1990-1995, Environment Canada
14

15

16
Section 3: Canadian Commitments on Climate Change
Framework Convention on Climate Change The primary international agreement relating to the control of greenhouse gas emissions is the United Nations Framework Convention on Climate Change (FCCC). This international agreement, signed by 155 countries at the UN Earth Summit at Rio de Janeiro in 1992, embodies the concept of greenhouse gas emission stabilization. The ultimate objective of the Framework Convention on
Climate Change is to:
"achieve...stabilization of greenhouse gas concentrations in the atmosphere at a level that would prevent dangerous anthropogenic interference with the climate system. Such a level should be achieved within a time frame sufficient to allow ecosystems to adapt naturally to climate change, to ensure that food production is not threatened and to enable economic development to proceed in a sustainable manner." 1
In order to stabilize the concentrations of greenhouse gases in the atmosphere, the world's greenhouse gas emissions must be substantially reduced. In fact, according to the Intergovernmental Panel on Climate Change, global CO2 emissions must be reduced by more than 50% in order to stabilize the concentrations of greenhouse gases in the atmosphere at their present level2. As a first step towards the achievement of its ultimate objective, the Convention requires its signatories, including Canada, to stabilize their greenhouse gas emissions, excluding chlorofluorocarbons (CFC) emissions, at their 1990 levels by the year 20003. The Convention did not address the period after the year 2000 and what emission controls would be required to stabilize the concentration of greenhouse gases in the atmosphere and prevent dangerous interference with the climate system. However, in 1988, the Toronto Conference on the Changing Atmosphere: Implications For Global Security (the Toronto Conference) recommended that CO2 emissions should be reduced by approximately 20%, relative to the 1988 level, by the year 2005 and eventually by 50% or more.
Canada As a signatory to the FCCC, the Government of Canada is committed to stabilizing Canada's greenhouse gas emissions, at the 1990 level, by 2000. In addition, statements have been made by the Government of Canada which indicate that it supports the objective of reducing Canada's CO2 emissions by 20% by 20054 however, it is important to note that the Government of Canada has not made a binding commitment that Canada will actually reduce its CO2 emissions by 20% by 2005.
17
Ontario The Government of Ontario, like the Government of Canada, is committed to stabilizing Ontario's greenhouse gas emissions, at the 1990 level, by the year 2000. Furthermore, on June 9, 1994 the Legislative Assembly of Ontario endorsed the government of Canada's commitment to reduce Canada's greenhouse gas emissions by 20%, relative to the 1988 level, by 2005 by passing the following resolution:
"Therefore this assembly supports the federal government in its commitment to a 20% reduction in Canada's greenhouse gas emissions over 1988 levels by 2005, and further supports leadership on the part of Ontario in helping to develop and implement a national action plan to achieve this environmentally imperative goal."5
Like the government of Canada, the Government of Ontario has not made a binding commitment to reduce Ontario's CO2 emissions by 20% by a specific date.
Municipality of Metropolitan Toronto In 1993, Metro Council adopted a draft Carbon Dioxide Reduction Strategy which intends to reduce greenhouse gas emissions in Metro to achieve a 20 percent reduction in CO2 emissions from 1988 levels by the year 2005.6 To do so, the strategy included 15 initiatives designed to reduce greenhouse gas emissions. One of these initiatives was "Landfill Gas Recovery of Methane as Alternative Fuel for Co-generation of Electricity and Heat."7
The City of Toronto The City of Toronto has made a number of commitments with regard to greenhouse gases. Toronto is committed to the goal of stabilizing its greenhouse emissions at the 1990 level by the year 2000. Furthermore, on January 30, 1990, it committed itself to achieving a 20 percent reduction in its 1988 level of carbon dioxide emissions by the year 2005.8
Other Relevant Commitments
Ontario Hydro Since the production, capture and conversion of landfill gas is often coupled with electricity production, the commitments that Ontario Hydro has made regarding greenhouse emission reductions are relevant. In January, 1995, Ontario Hydro's Board of Directors voluntarily committed Ontario Hydro to stabilize its net greenhouse gas emissions at its 1990 level by the year 2000 and reduce its net greenhouse gas emissions by 26% relative to its 1988 level, by the year 2005.9 Ontario Hydro GHG emission targets technically cover only emissions generated in Ontario Hydro operations and not those created when electricity is purchased externally.10 However, by purchasing electricity generated by a source which displaces fossil fuel, Ontario Hydro could reduce its fossil full related
18
carbon dioxide emissions.
20% Club - Federation of Canadian Municipalities Since a significant portion of municipal solid waste management and material diversion services and infrastructure are owned and operated by municipalities, the commitments they have made are highly relevant. As of September 1997, thirty-four municipalities across Canada have committed to the target of a 20% reduction in greenhouse gas emissions by the year 2005, relative to their 1988 levels.
Commitments Complimentary to Methane Reduction There are a number of commitments which have been made by various levels of governments which may be coincidentally advanced in the process of pursuing methane emission reductions from a climate change mitigation perspective. These commitments involve solid waste reduction and smog reduction targets.
Solid Waste Targets The Canadian Council of Ministers of the Environment established in 1988, a National Packaging Protocol which called for a reduction in packaging waste of 35% by the year 1996 as compared to 1988 levels and an overall reduction of 50% by the year 2000.11 The protocol covers all types of packaging but initially focused on the following materials: old corrugated cardboard, plastic film and wood pallets. Many provincial waste reduction strategies and initiatives have drawn from this approach and embody the goal of a 50% reduction of municipal solid waste going to disposal by the year 2000 relative to 1988 levels. Since 1989, Ontario has had a policy objective of a 25% diversion of municipal solid waste from landfill or incineration by 1992 and a 50% diversion by the year 2000 from the base year of 1987.12
Smog Reduction Targets Although methane is not considered one of the more significant contributors to ground level ozone gas formation, such as other more reactive volatile organic compounds or nitrogen oxides, it can nonetheless react to cause the formation of ozone (O3) and contribute to smog. Landfill gas also contains a small amount (estimated to be about 1% by volume)13 of a variety of other volatile organic compounds and toxic substances.14 This portion, though small, is a contributor to poor air quality in the vicinity of landfills, which are often near urban areas. Consequently, actions which help to manage landfill gas discharges will assist the Canadian Council of Ministers of Environment (CCME) National Smog Strategy. The Ontario component of the plan, the Ontario Smog Management Plan, proposes the goal of initiating "reductions of Ontario nitrogen oxides and volatile organic compounds annual emissions, to attain a 45 per cent reduction of the
19
1990 emissions by 2015, leading towards the reduction of ground level ozone."15

20
Section 4 : Trends, Analysis of Strategies and Success to Date
Status of the FCCC The Third Conference of the Parties (COP-3) to the Framework Convention on Climate Change will be held in Kyoto, Japan from December 1-12, 1997. The objective of COP-3 is to formulate a protocol or legal instrument to ensure that binding limits are placed on greenhouse gas emissions. It appears that the strongest measure of agreement at the Kyoto meeting will be to extend the time frame to meet the stabilization target. At a lead-up meeting to the Kyoto meeting, in Bonn, Germany in August 1997, parties were even unable to produce an agreed upon timetable for industrial countries to reduce their emissions of greenhouse gases in the post year 2000 period.1 This timetable is critical to the success of on-going greenhouse gas reduction efforts. Furthermore, some of the members of the block of countries JUSCANZ (Japan, the United States, Canada, Australia, New Zealand), in which Canada is situated, are those least willing to commit to binding targets. These countries include Australia, Japan and the United States. Some countries, such as Britain, have discussed a willingness to advance greenhouse gas reductions beyond the stabilization target.
Canada The latest emission forecast indicates that Canada will not achieve its commitment of GHG stabilization at the 1990 level by the year 2000. It is forecast to exceed its 1990 level by 8.2% by the year 2000, 19% higher by 2010, and 36% higher by 2020 (from 564 Mt eCO2 in 1990 to 767 Mt eCO2 in 2020).2 Referring specifically to the greenhouse gas, methane, it is expected to follow this general upward trend unless additional measures are taken. At the United Nations General Assembly Special Session in June, 1997 the Prime Minister of Canada acknowledged that "...the potential human and economic costs of unchecked climate change are simply too high for us not to take action now."3 However, the government was not prepared to make short-term commitments. Instead, the Prime Minister proposed only to establish legally-binding medium-term targets for post-2000 greenhouse gas reductions. Medium-term targets, which are the content at the Third Conference of the Parties meeting in December 1997, may further roll back the timetables for commitments made in the 1992 United Nation's Framework Convention on Climate Change. Canada's rationale for not meeting its climate change commitment has been that the target outlined in the Framework Convention on Climate Change was too high, and would have a negative effect on the economy.
Canada's National Action Program on Climate Change
The climate change strategy for Canada, Canada's National Action Plan on Climate Change, as initiated by the federal government, principally Environment and Natural Resources Canada, has evolved to employing the use of challenges and voluntary measures brought forward by private and public sector organizations (Voluntary Climate Program and Registry). Examples include fuel switching from coal to natural gas or energy conservation measures such as building retrofits. The
21
federal government had previously, however, identified a wide array of options in 1994 that could have been pursued (see Canada's NAPCC Waste Management Options below). NAPCC Waste Management Options
In 1994, the Climate Change Task Group (CCTG), the body of the federal government charged with the task of devising an inventory of greenhouse gas management measures that could form a national action plan, released Potential Measures of Canada's National Action Program on Climate Change. The document included a wide a range of measures that could be adopted to reduce greenhouse gas emissions of all types. In terms of reducing methane production from landfills, the measure was regarded as having multiple environmental and safety benefits:
" In addition to reducing GHG emissions, properly designed and operated landfill gas management systems could reduce emissions of volatile organic compounds (which are precursors of ground level ozone and smog) as well as odours and the associated public complaints. In addition, the use of landfill gas to produce useful heat and electricity would result in the displacement and conservation of fossil fuel resources. Improvements in site safety may also be realized by reducing the threat of explosions and uncontrolled fires. "
The CCTG suggested a number of very promising measures that could be pursued as part of Canada's National Action Plan, including: 1) The Canadian Council of Ministers of the Environment (CCME), in collaboration with the
NAICC, should establish a national reduction target for landfill GHG emissions by a date to be decided.
2) Environment Canada, in collaboration with Natural Resources Canada, the Canadian Electrical Association (CEA) and other stakeholders, should undertake a qualitative assessment of the realistic technical and economic potential of using landfill gas to generate electricity and effect a reduction in the current utility use of fossil fuel(s).
3) Environment Canada, in collaboration with appropriate provincial government agencies and
other stakeholders, should coordinate the development of an Environmental Code of Practice for Solid Waste Landfill Gas Management. This Code would identify and share best engineering and operating practices and identify the economic implications of its implementation on the basis of typical case studies.
4) Provincial environmental agencies should establish regulations requiring the installation of
gas recovery systems for new and existing large and medium size landfills, if these systems are not already installed or planned for.
5) Electric utilities or provincial energy regulatory agencies should offer appropriate price and
conditions to encourage the use of landfill gases for electricity generation.

22
6) The CCME and NAICC should evaluate and define conditions under which adoption of the Code by operators of municipal solid waste landfills should be considered a mandatory requirement by October, 1995.
Unfortunately, most of these measures were not pursued to a significant degree by the federal government. The federal government has not, to date, attempted to regulate or set standards for greenhouse gas reductions from waste management activities, nor does it have a strategy specific to this subset of emissions. It must be noted, however, that most matters of waste management, particularly non-hazardous municipal solid waste, are in the realm of provincial or municipal jurisdiction.
Environment Canada's National Office of Pollution Prevention does, however, maintain a technical assistance service for landfill operators. This office has held workshops for waste managers interested in pursuing landfill gas capture opportunities. As well, this office has published a manual, Guidance Document for Landfill Gas Management, which provides much of the preliminary technical information to start such a process. This, in effect, qualifies as the development of an "Environmental Code of Practice for Solid Waste Landfill Gas Management" as outlined above. Item 4, that "provincial environmental agencies should establish regulations requiring the installation of gas recovery systems" is being partially undertaken in some provinces through the creation of guidelines or standards but not regulations (see Province of Ontario below). The CCME has not become actively involved in this issue.
Province of Ontario
The Ontario government has not produced a strategy to achieve the goal of GHG stabilization by the year 2000. Previous governments have, however, implemented a variety of measures over the past decade which intentionally or coincidentally may have led to greenhouse gas emission reductions. Some of these measures include the Tax for Fuel Conservation, the Green Communities initiatives, advancing energy efficiency standards for appliances and equipment and sponsoring energy retrofit projects. On the waste management side, the province moved rapidly during the early 1990s to implement waste diversion and promulgate 3Rs regulations. Previously, Ontario had adopted a policy enshrining the goal of diverting 50% of the province's waste from disposal by the year 2000 (baseline 1987). The most recent emission forecast conducted by the province projected that Ontario would be very close to achieving the stabilization target by the year 2000 (one per cent above the 1990 level by the year 2000).4 However, a number of factors and assumptions employed in this forecast demand review. Most significant of these, are the projections and assumptions about Ontario's electricity related greenhouse gas emissions in light of the need for extensive repairs to Ontario Hydro's nuclear generating infrastructure.5 Ontario Hydro's Sustainable Energy Development Strategy (which was incorporated into the province's assessment) includes a target to stabilize corporate greenhouse gas emissions at the 1990 level of 26,000 kilotonnes CO2 per year the year 2000 and further reduce emissions by 10% by 2005.6 By the year 2000, Ontario Hydro had been anticipating to be produce 8000 kilotonnes less CO2 equivalent per year.7 These projections, which have been factored into Ontario's greenhouse gas inventory forecasts, will not be met given the province's scheduled increase of coal-fired electricity production.

23
Further disconcerting for the pursuit of greenhouse gas reduction may be some of the many changes to Ontario's environmental policy and regulatory regime undertaken over the past two years by the current government.8 Many changes have been made or are still under consideration in the areas of waste management, diversion and recycling, energy, transportation and land use planning regulation.9 Ontario has a wide array of powers available under the Environmental Protection Act, Environmental
Assessment Act and the Waste Management Act and their associated regulations, to govern the fate of most types of waste. These could be applied to advance the regulatation of waste which is organic, paper-based, compostable or digestible. For example the Waste Management Act was amended in 1993 to provide an accelerated approval process for recycling and leaf and yard waste composting facilities operated by municipalities or private operators.10
Recent Relevant Initiatives Since the provincially led build-up of waste diversion and 3Rs capacity in the Province of Ontario, little has been done to advance waste reduction and reduce the dependence on landfill disposal. Most of the amendments to Ontario's environmental protection framework announced since 1995 have been to reduce the regulatory requirements and statutory obligations governing waste management and diversion in the province. Many other changes are still under consideration. For example, through its autumn 1996 regulatory reform initiative, Responsive Environmental Protection, the provincial government produced proposals to amend regulations governing compost sites, municipal solid waste, agricultural wastes, grasscycling (mulching grass and leaving on-site), the use of soil conditioners, two-stream recycling and a number of other regulations which could greatly impact the fate of solid waste in Ontario.
Limits on Atmospheric Emissions of Landfills The Ministry to Environment and Energy is currently finalizing standards for atmospheric emissions from landfills (Design Criteria for Groundwater Protection and Atmospheric Emissions of Landfill
Gas as part of Proposed New Landfill Standards). These standards would apply, however, only to larger landfills in the province ie. where "the waste total waste disposal volume at a new or expanded site is greater than 3.0 million m3", (assumed to be about 2.5 million tonnes). Also they will only apply to new landfills or landfill expansions. Finally, the standards will include exemptions for "a landfilling site associated with a lumber mill, pulp mill or similar facility where the waste deposited at the site is predominately woodwaste." The standards could however be invoked in cases where landfill size was less than the prescribed trigger by director's order or condition of approval. Nonetheless, the probable application of the standards to only larger landfill facilities may leave many smaller landfills throughout the province without any form of atmospheric control. The pattern of where and when landfill gas capture systems have been installed in landfills across Canada suggests that the design trigger may be set higher than necessary. This, particularly, if climate change mitigation is to be considered. Of the 27 installations in Canada, 11 of them are less than 2.5 million tonnes capacity; several are as small as 0.5 million tonnes.11 As well, eleven of the
24
landfills that have capture systems, had the systems installed after the landfill had closed or virtually as it was closing.12 This suggests that Ontario's guidelines could be made more inclusive and effective by targeting closed landfills and those of much smaller sizes in addition to new landfills over 2.5 millions tonnes. Landfills in the Province At present there are twelve landfill sites in Ontario with gas collection systems. Of these, only three employ collected gas in energy recovery systems: the Brock West Landfill in Pickering generating 23 megawatts of electricity and Keele Valley in Maple generating 15 megawatts and Beare Road in Scarborough.13 All of these sites are under the responsibility of Metropolitan Toronto, who has contracted an independent power producer to manage the generating facilities. According to a 1992 study14, there are as many as 26 landfills in the Province of Ontario that would meet the economic feasibility conditions required to install and operate a landfill gas capture system. Since 1992, only four landfill in the province have been outfitted with landfill gas capture systems: Waterloo (1995), Britannia (1995), Beare Road (1995) and Storrington (1994).15 A complete list of landfill gas capture systems in Canada is included in Appendix B.
Summary of Ontario's Progress Between 1980 and 1995 Ontario introduced a number of reforms to solid waste management in the province and made or encouraged substantial investments in waste diversion. Many of these initiatives are beginning to have an impact on the overall quantity of waste diverted from disposal. Very little has been done to advance the technique of landfill gas capture by the province until very recently. The province is in the process of finalizing guidelines for landfill gas capture. Ontario has been apprised of its methane capture potential since 1992, yet only 4 landfills havew been outfitted since this time. Despite the lack of a regulatory requirements, some gas capture systems have been installed in the province over the past decade. Measures such as this, and other fossil fuel displacing measures, will be required to diminish the expected increase in greenhouse gas emissions that could arise from Ontario Hydro's increased use of coal-fired electrical production.
Municipality of Metropolitan Toronto Metro's Greenhouse Gas Reduction Strategy In 1993, Metro Council adopted a draft Carbon Dioxide Reduction Strategy, the objective of which is to reduce greenhouse gas emissions in Metro to achieve a 20 percent reduction in CO2 emissions from 1988 levels by the year 2005.16 The strategy has remained in draft form as it was expected to evolve over time. Most of the measures in the strategy were carbon dioxide related, however, two related partly or largely to reducing methane emissions, these were:
25
1) a "Blue Box Program for Energy Conservation" and 2) a "Landfill Gas Recovery of Methane as Alternative Fuel for Co-generation of
Electricity and Heat"17
Blue Box / Waste Diversion Measures In 1993 Metro Toronto Council approved the target of a 50% reduction in the waste being sent to landfill by the year 2000.18 Recycling activities have however commenced as early as 1986, under the Solid Waste Environmental Assessment Plan.19 Metro currently has a program to manage virtually every type of waste that is anaerobically digestible and which is likely to be sent to landfill if disposed:
° Through Metro's Blue Box and Grey Box systems nearly every form of paper product can be captured including: newspapers (including advertising inserts), magazines catalogues, direct mail items, telephone books, hard cover and soft cover books, gift wrap, brown paper products, greeting cards, all types and colours of envelopes and fine paper, paper egg cartons, cardboard rolls, boxboard (from cereal or tissue products), pizza boxes and corrugated cardboard. Disposal bans have been placed on most of these materials as well.
° 110,000 home composters have been made available to citizens at a reduced cost to maximize diversion of most types of residential organic waste. Centralized compost sites manage clippings and yard wastes from parks and residences. Metro also operates several diaper reclamation depots.
° Almost all residences in Metro and 65% of apartments have access to curbside or bin recycling.
Even with this coverage, Metropolitan Toronto is currently diverting not more than one-quarter of its waste from disposal to 3Rs reclamation through the collective efforts of citizens, cities and boroughs and Metro Works. While this is a substantial improvement over previous practices, this level of diversion represents only half of the progress needed to reach the year 2000 waste diversion target. The Municipality will need to expand this level of diversion if it is to meet the design criteria for its future waste management system.
The development of markets for collected materials is still regarded as one of the leading obstacles impeding expansion of many municipal diversion systems. As well, the vast amount of materials diverted and collected by Metro and area municipalities has an impact on how readily the material can be liquidated. Given that Metro has stated that its goal is to achieve a minimum 50% waste diversion rate from its residential waste stream20 and that whether this target is met or not will impact on the decisions regarding the size of disposal capacity required, it is paramount that high and stable rates of diversion are achieved. The Municipality is currently engaged in a process of configuring Toronto's future waste management system.21
26
Landfill Gas Capture Measures The two most significant landfill facilities employed by Metro over the past decade are the Brock West landfill site in Pickering and the Keele Valley Site in Maple Ontario. Both sites are owned by Metropolitan Toronto, have been or still are operated by Metro works and both have landfill gas capture systems. Brock West closed in November 1996.22 The year 2002 is being used for planning purposes as the closing date for Keele Valley. As well, the BFI Landfill in Arbor Hills, Michigan, U.S.A., where Metro solid waste is slated to be shipped includes facilities for the capture of landfill gas.23 There appears to be only a small amount of progress made in the area of outfitting closed sites with capture systems since Metro's 1993 commitment to reduce its greenhouse gases. Only one new site (the Beare Road Landfill) has installed a gas capture system this decade. To some degree a number of factors, not entirely in Metro's control, complicate the extraction and processing of landfill gas from closed landfills. A gas capture system is most effective when designed before and built into the landfill while active rather than outfitting a landfill after its closure. The older a site is, the more likely it is that gas emissions have already discharged and that methanogenic activity has begun to diminish. This would most likely be the case with sites which have closed over 50 years ago. The older a site is, the less likely it is that the contents of the site will be known accurately. Some of the sites in the oldest parts of Toronto, or other urban areas of Canada, are now covered by residential or commercial land use which may make access somewhat complicated.
For municipalities attempting to install a landfill gas capture system that includes electricity production it is probable that an agreement will need to be reached with the province's electrical utility Ontario Hydro. Given the remote location of most landfills and the location of users of electricity, it is unlikely that municipalities would be able to make use of the electricity without first transporting it on Ontario Hydro's distribution grid. If electricity is distributed on the province's electrical grid, Ontario Hydro must be willing to purchase the generated electricity. At least one closed landfill site within Metropolitan Toronto has been unable to be developed as a consequence of the utility being unable or unwilling to accept the additional electrical capacity.24 Exceptions to this arrangement would be: the case where the municipality could use the electricity, for its own uses in the immediate vicinity of source of methane; if the captured gas itself could be taken off-site rather than combusted on-site; or if the upgraded, purified gas could be directed to a nearby natural gas line. In future, due to recent developments, suppliers of electricity should theoretically have easier access to the province's electricity grid, as the government of Ontario has indicated that it intends open up the distribution system to suppliers other than Ontario Hydro.25
The drawbacks of doing little or nothing about closed landfills are also numerous. Many are located in urban areas and could continue to pose a public safety hazard. Without any sort of monitoring or capture system, the gases which are produced, escape unabated to the atmosphere. Of the 81 Metro area landfills listed in the MoEE's Waste Disposal Site Inventory, 54 of them closed on or after 1950 (see Table 7).

27
Table 7- Landfills in Metropolitan Toronto closed on or after 1950.
City / Borough
Number of sites closed 1950 or later
Etobicoke
11
North York
11
Toronto
2
East York
11
Scarborough
19
Source: Metropolitan Toronto, State of the Environment Report, 1995 Many of the closed landfills in the geographic area of Metro are not actually under the responsibility of Metro. Those that were a city's responsibility at the time of closure still are that city's responsibility (up until at least 1998) and those that were Metro's still are the responsibility of Metro. After the process of municipal amalgamation, the new City of Toronto should be without this administrative matter.
Summary of Metro Efforts Currently, through the collective efforts of citizens, cities and boroughs and Metro Works, Metropolitan Toronto diverts approximately 23% of its waste from disposal to 3Rs reclamation. This level of diversion represents about half of the progress needed to reach the year 2000 waste diversion target. About three-quarters of the waste diverted would be anaerobically digestible if it had been landfilled. In terms of the effort to mitigate the effects of previous consumption and disposal, Metro has actually been a more active municipality prior to making its 1993 commitment than after. The two largest landfills used by Metro have had gas capture systems since 1986 and both employ energy recovery. Only one additional landfill (Beare Road) has been outfitted since 1993. Given the number of sites in the Metro area that exist and which could be producing emissions, and given Metro's commitment to act in this area, there remains a number of opportunities for action.
City of Toronto The City of Toronto is projected to do better than meet the stabilization goal by the year 2000. It is also very actively pursuing the 20% by 2005 target. Administratively, the current City of Toronto is in the midst of being amalgamated with the other cities and borough of Metropolitan to become a single new City of Toronto. This could present challenges in terms of ensuring that the City of Toronto goals are met over the wider area and larger population (approximately 2.4 million). In May of 1997 the Toronto Atmospheric Fund released the report Realizing Toronto's Target for
Greenhouse Gas Emissions Reduction -- Current Trends and Outlook. The measures outlined in this report to achieve the target of a 20% reduction by the year 2005 do not represent an official policy for the City of Toronto. However, the report does serve the purpose of providing a very thorough

28
review of the city's emission forecast and reduction requirements and it does helps to illuminate the hurdles ahead. For these reasons its assumptions and analysis will be reviewed here. Realizing Toronto's Targets for GHG Emission Reductions The City of Toronto is projected to met its year 2000 stabilization target and without additional programs or efforts is projected to reduce its greenhouse gas emissions by 3% further in 2005 relative to 1990. Additional efforts or intensification of efforts would be required to ensure that 3% becomes 20% by 2005. While that report and its modelling deal with the total stock and sources of GHG emissions in Toronto, the components reviewed below are only those related to waste diversion and landfill emissions. The report detailed statistics from two modelling runs for the year 2005: a reference scenario which could be described as 'what would be the result if no further GHG or waste reduction measures were
implemented' and a 20% scenario in which 'the city's 20% target is met through a combination of
measures for reducing both energy-related carbon dioxide emissions and methane emissions from
organic waste.' The analysis was based upon or guided by the following factors, which can have a substantial effect on the amount of emissions generated : 1) Where waste is landfilled. 2) Public / Private methods of disposal. 3) Waste diversion / packaging reduction efforts 4) Level of participation in programs. 5) Higher waste management goals
Where Waste is Landfilled. Where waste from the City of Toronto is landfilled is currently critical to methane emission reduction efforts. There are only 12 landfill sites in the province of Ontario with landfill gas capture and conversion facilities but only 4 are still receiving waste (Keele Valley near Toronto, Britannia in Mississauga, Trail Road in Nepean and the Waterloo Landfill). The analysis requires that any new landfill that the City or Metro employs has a gas capture system: "In this analysis we assume that all publicly collected waste is landfilled at Keele
Valley, which is a well managed with [a] modern methane collection system in place (they burn gas to generate electricity) and which will be maintained for the next 60 years."
"Keele Valley is scheduled to close before the year 2005, however in this analysis we are assuming that City collected waste will be landfilled at a site that is as well managed as Keele Valley."
The fate of waste after the closure of the Keele Valley is not entirely known at this point in time other than additional capacity secured from BFI at Arbor Hills, Michigan. The Municipality of

29
Metropolitan Toronto is currently undergoing an environment assessment process for the purposes of securing future waste disposal capacity. If this disposal capacity takes the form a landfill in Ontario, it will in most likelihood incorporate a methane capture system as its size should trigger its requirement under Ontario's landfill guidelines.
Public / Private Methods of Disposal. The distinction between privately and publicly managed waste is important for a number of reasons. About half of all the municipal solid waste in the City of Toronto is privately collected (see Table 8) and as such the City has little or no control over its fate. This waste may end up in a variety of different landfills in the province, outside the province or potentially in incinerators. Approximately half of this waste is likely to be paper-based, cardboard or organic in nature as it arises from the ICI sector. The assumptions made about this waste include:
"Privately collected waste is assumed to be taken to be taken to various landfills (including Keele Valley) which are modeled as a single "composite" landfill with an average landfill gas recovery rate of 60% (compared to 85% for Keele Valley) and a 35 year lifecycle for the collection hardware."
The landfill gas recovery rate assumed for Keele Valley is 85%. This rate of capture is quite exceptional as compared to values cited elsewhere which range between 30-80%.26 Given that there are more destinations for waste hauled by private haulers than there are for publicly hauled waste, it may be rather optimistic to assume that the landfill gas recovery rate for the waste (in its many different landfills) would approach 60%. Table 8 - Method of Waste Collection in City of Toronto Collection Agency
Quantity of Waste Collected (tonnes)
City of Toronto
273,612
Privately Collected Waste (1)
330,848
Metro Agencies (2)
75,312
(1)Includes waste from high-rise apartments, large commercial buildings, industrial facilities, construction and demolition sites along with waste that is taken directly to Keele Valley or Brock West Landfills by private residents and businesses. (2) TTC, Metro Parks, Metro Housing
Waste Diversion / Packaging Reduction Efforts To carry out the 2005 GHG reduction target, the City of Toronto will need to rely on the work of other governments, government bodies and industry efforts according to the projection:

30
"In the reference projection, we have assumed that total waste generation levels will be lower than 1995 values by a decline similar to that observed between 1990 and 1995 [see Table 9, below]. In per capita terms, this translates to a 24% reduction in waste. This assumption is based in part on new packaging rules [CCME's National Packaging Protocol] that aim to reduce packing waste going to landfill by 50% relative to 1988 as well as the continuing efforts of the City and Metro governments to increase recycling and waste diversion. (Packaging waste accounts for approximately 20% of all waste)."
"The reference scenario already includes moderately aggressive reductions in waste going to the landfill for the 1996 to 2005 period. These reductions are applied to publicly and privately collected waste equally. To achieve this reduction in the reference scenario we assumed increased activity on the part of the City and private recycling programs as well as the successful implementation of the National Packaging Protocol..."
The CCME goal has two benchmarks to reach before the year 2000 target: a target of a 20% reduction by the year 1992 (which was achieved) and a target of 35% reduction by 1996 (this has not yet been verified as achieved). The 35% / 1996 and 50% / 2000 targets are viewed as challenging. The efforts to reach these targets are currently being undertaken on a voluntary basis, however Canadian municipalities are currently considering options should these targets not be reached. The Federation of Canadian Municipalities has endorsed a resolution supporting deposit/returns regulations, the development of a national packaging stewardship model, and regulations on packaging waste if industry fails to meet the 1996 National Packaging Protocol Target.27 Table 9- Forecast waste reduction efforts for the City of Toronto
1990 (tonnes)
1995 (tonnes)
2005 (tonnes)
Inc 1990-95 (percent)
Inc. 1996-2005 (percent)
Waste Collected by City of Toronto *
273,000
249,000
203,000
-9.0%
-18.4%
* "The trend to the year 2005 is extrapolated by assuming the same rate of reductions achieved in the 1990 to 1995
period."
It should also be noted that the waste reduction achievements of the 1990-95 period may be difficult to replicate as many of the materials tackled during this period were considered the most readily approachable from a waste diversion, reuse and recycling perspective. The 'remainder' waste materials are likely to be generally more difficult to manage. As well, during the period 1990-95, the provincial government was active in both installing regulations for and funding waste diversion schemes.
As optimistic as the City of Toronto waste reduction goals are, they would be very effective if achieved. Source reduction of waste is considered one of the most highly effective means of reducing GHGs from the waste system.28 Since less packaging and less material would require less energy to produce and transport and would generate less methane in a landfill, source reduction almost invariably leads to GHG emission reduction.
31
Based on these assumptions the City of Toronto will need to be extremely diligent in its waste diversion efforts and will need to rely on other levels of government, the CCME and industry to carry out their commitments, if not strengthen their collective resolve to reduce packaging, divert materials from disposal, and effectively manage post-consumer materials.
Level of Participation in Programs Much of the responsibility for the continuing effectiveness of programs and their ability to achieve Toronto's reduction targets is placed on the citizens of the City:
"The City already has many programs and regulations for the promotion of energy efficiency and environmental improvement, and closing the gap between current trend lines and the 20% target is more a question of the level and participation than it is a question of inventing new programs."
Maintaining public participation will be vital. Part of doing so could involve regular monitoring and reporting of results to ensure that citizen efforts or activities can be compared, recognized, encouraged or used to ensure that better results are achieved. By way of example, the periodical, Waste Talk, produced by the City of Toronto City Works Services is an excellent source of information for keeping citizens knowledgeable and motivated about recycling efforts.
Higher Waste Management Goals The 20% reduction scenario for the City of Toronto includes a number of waste reduction measures that if implemented would help ensure that the goal was reached: "� Increase quantity of privately collected waste landfilled locally by 110,000 tonnes (1/2 of all
privately collected waste) and landfill it a managed site such as Keele Valley (presently most of the waste goes out of the region).
� Reduce City of Toronto collected and Metro Agencies waste to landfill by another 20% on
top of the 18% assumed in the reference scenario. � Reduce paper (and paper product's) share of total waste by 5%, reduce food waste's share of
total waste by 5%." If the measures outlined above are to be pursued, then a substantial intensification of current efforts will certainly be required if not additional resources or programs to meet the challenge.
32
Summary of Toronto's Strategy Many of the assumptions employed in Realizing Toronto's Target for Greenhouse Gas Emission
Reductions rely on near optimal conditions, participation or results. This observation does not cast doubt on the effectiveness of the given measures but it does suggest that if greenhouse gas targets are to be met, then Toronto and all other municipalities will need to work very diligently to ensure that program participation is high, that other bodies and agencies maintain their progress and that current levels of funding to waste diversion programs are maintained or increased. Furthermore, the reductions required to achieve the greenhouse gas and waste reduction targets set for 2005 for the City of Toronto will in all likelihood require new programs, initiatives or infrastructure.
Summary of Progress Overall The jurisdictions reviewed have made widely varying degrees of progress toward their goals. In terms of greenhouse gas emissions, the City of Toronto is projected to stabilize its emissions by the year 2000. Ontario was expected to as well, but in all likelihood will not given recent events in its electricity production sector. Canada as a whole is not expected to meet the year 2000 stabilization target and is projected to exceed the target by at least 8.2% (46,500 kt eCO2 greater).29 The City of Toronto, Metropolitan Toronto and many other cities across Canada still have their commitments to a 20% reduction by the year 2005 to meet which will require a continued, if not expanded effort. In terms of waste diversion efforts, all the jurisdictions reviewed are approaching the 25% mark for diversion of waste from disposal. This as much indicates that significant progress has been made as it does the need to continue working diligently if the goal of 50% diversion from disposal by the year 2000 is to be met. Taken together, all levels of jurisdiction have work to do.

33

34

35
Section 5 : Options for Emission Reductions: Preventative Measures
The fate of virtually all municipal organic waste is bacterial digestion, either in highly anaerobic conditions (as in a landfill) or in predominately aerobic conditions (as in compost facility). It would be sensible from an emission limiting standpoint to have whichever type of digestion take place in as conducive conditions as possible. Digestion would then create a gas with either a relatively high concentration of methane or of carbon dioxide (plus water vapour). Methane from anaerobic digestion would be captured for energy purposes and reduced to carbon dioxide1 before discharge. Currently, many components of municipal waste digest under both anaerobic or aerobic conditions. As most municipal solid waste in Canada is landfilled, the digestion can be variable - at some times and in some sections of a landfill, aerobic conditions and at other times and in other sections, anaerobic conditions. This produces a landfill gas or biogas that is approximately and on average half methane and half carbon dioxide; over time its composition varies considerably. The effect of these rather uncontrolled circumstance is to create an emission or 'product' that is significantly more variable in composition than is desirable, particularly if the emission is to be regarded as a useful product. If biogas is to be viewed as a 'product', some quality control should be employed. Ideally, municipal organic waste would be managed in much more controlled conditions than exist in landfills in order to produce purer products of digestion. Properly maintained aerobic compost facilities operate under more controlled circumstances and tend to release to the atmosphere carbon dioxide almost exclusively. This carbon dioxide is not not considered a net increase as it arises from plant matter which orginally derived its carbon, in part from the atmosphere. The worst predicament, from a greenhouse gas emission perspective would be maximum rates of methane generation from organic waste without any controls on its discharge to the atmosphere. This was the waste management situation throughout Canada up until approximately a decade ago. Since that time, some modest progress has been made in both preventing emissions of methane from developing and managing those stocks which exist.
A Decision-Making Point A recent study conducted by the US Environmental Protection Agency, Greenhouse Gas Emissions
from Municipal Waste Management, examined the relation between municipal solid waste and greenhouse gas emissions by examining how different management options for municipal solid waste may reduce or increase GHG emissions. As the report includes an analysis and comparison of the greenhouse gas emissions related to composting and landfilling, some of its conclusions are relevant to this discussion. The study does conclude that there may be little difference, in terms of net GHG emissions, between
36
composting or landfilling many digestible materials, however, there are two key assumptions supporting this conclusion. First, many materials, when landfilled constitute a carbon sink, that is, much of the carbon in the material is sequestered and prevented from oxidizing to carbon dioxide. This factor favours the landfilling of some organic waste from a greenhouse gas perspective. Even if some waste materials sequester their carbon when landfilled, this 'reduction' would have to achieved at the expense of waste diversion goals. Secondly, and more importantly, however, is the assumption used in the US study about the rates of methane recovery. US rates for both capture and use of methane were projected and assumed to be quite high, at least relative to those in Canada today. For example, the study used the projection that 58% of all methane generated at landfills will be generated at landfills with recovery systems and 91% of all methane recovered will be used to generate electricity (53% of all methane). As of 1995, Canada captured just 24% of all the methane produced in landfills (270 kt captured of 1139 kt of CH4 produced). The USEPA study concludes:
"Our results showed that landfilling of office paper results in substantial positive net GHG emissions and that landfilling of food scraps and grass have small positive net GHG emissions (in absolute terms). For these three materials, the net GHG emissions from methane generation exceed the carbon sequestration (for the fraction of these materials that does not degrade in landfills). For all other materials that we examined, landfilling results in negative net GHG emissions in absolute terms - ranging from slight negative net emissions for corrugated boxes, mixed MSW, and yard trimmings, to moderate negative net emissions for branches, leaves, and newspaper. For these materials, carbon sequestration exceeds the net GHG emissions from methane generation (after accounting for projected LFG recovery)."
However:
"The results would differ if a different assumption were used for the percentage of landfill methane recovered in the year 2000. At lower (e.g. current) rates of LFG recovery, the net GHG emissions of office paper, food scraps, and grass increase further and the net GHG emissions of corrugated boxes, yard trimmings and mixed MSW turn from negative to positive."
This analysis underscores the need for jurisdictions to advance higher rates of diversion of organic and other wastes to proper facilities and to make efforts to capture methane from landfills in order to reduce GHG emission impacts from their waste management activities. Until jurisdictions are able to divert the vast majority of waste produced, landfills will continue to be substantial contributors of methane. Capture systems can mitigate the climate change impacts of landfills but they are unlikely to be installed in every landfill.
The Dilemma of Prevent or Capture From a greenhouse gas limiting perspective, it may not seem to matter which is practised: waste diversion to reduce the production of methane or methane capture after it is produced. However,

37
waste diversion, rather than disposing waste in a landfill and attempting to capture its emissions later could be regarded as the preferred method for a number of reasons : 1) waste diversion furthers the goal of a 50% diversion from disposal by 2000; 2) composting programs can yield a high vital product, compost; 3) diverting and recycling material conserves resources of all types; 4) methane from organic waste can be produced and captured outside of a landfill to maximize the energy production value of organic waste. Based on these criteria, methane capture would be a valid, and the only, approach for landfills that are already closed. If for some reason a jurisdiction is not employing diversion and 3Rs programs as part of its waste management strategy, then methane capture becomes all the more vital to implement if all of the jurisdiction's waste is being landfilled. Finally, if methane is captured it should be used for a productive purpose (ie. heating or electricity generation) rather than simple being flared.
Does Diversion Counteract Capture ? A municipality operating both an aggressive and effective waste diversion system and installing gas capture systems in its landfills may appear to counteract the effectiveness of gas capture (i.e. the more waste that is diverted, the less effective and productive the capture system will become as there will be less waste digesting in the landfill). An observation that somewhat dilutes the view above is that, from the experience of waste diversion programs to date, there may be difficulties ensuring continuing high rates of diversion for of all types of digestible (as well as other types of) waste. Diversion rates will be subject in part to the degree to which they are funded and have resources. The cost of recycling is often compared to the cost of landfilling in order to argue that many materials should be disposed. the prices paid for recycled materials has varied widely which limits the ability to market all materials. Also, though participation rates are generally high in curbside, diversion and source separation programs, there will likely be some non-participation. As well, waste composition arriving at a landfill in any given year may vary according to tipping fees, the waste market, who is hauling the waste, change of industries or other factors. These 'complicating' aspects of the waste diversion and management sector suggest that prevention and capture are not significantly contradictory if organic waste or paper products, at various times could be finding their way into landfills.
The 'Ideal' Approach For the purposes of this report, maximizing waste diversion is regarded as preferable to landfilling all wastes and attempting to capture methane later. Greenhouse gas reduction would also tend to favour anaerobic digestion with methane capture to displace fossil fuel use. Methane capture can be considered an effective mitigative approach for wastes which have already been landfilled. In the absence of an aggressive waste separation, diversion and 3Rs program, methane capture is still preferable to not capturing at all. If methane is captured it should be used for a productive purpose (ie. heating or electricity generation) rather than simple being flared.

38
Preventative Measures: Diversion of Digestible Wastes Methods of Managing Digestible Waste Most materials in the waste stream that are anaerobically digestible have some means of being diverted from the waste stream and treated rather than landfilled. For example, organics can be composted or anaerobically digested. Composting can be conducted either on-site or off-site. Organic waste can be diverted through curbside or be separated from municipal solid waste at a processing facility. Some materials such as grass clippings can be mulched and left on site. Paper and cardboard can and should be recycled. Some of the methods of materials are reviewed below, and where possible, approaches are offered that may advance their effectiveness.
Source separation to on-site composter It is estimated that a single 300 litre residential composter can manage between 500-1000 kg of organic waste per year through aerobic digestion under proper use.2 The rate of production, quantity and quality of compost from residential composters depends heavily on how well they are maintained. If material is turned frequently and cycled through rapidly (ie. 4 times per year in southern Canada), then the units can successfully divert large amounts of residential organic waste (1000 kg). If composters are not well managed, they will divert very little waste and could lead to anaerobic conditions. The City of Toronto and Metro have been active at deploying compost bins to citizens. A benefit of the use of compost bins over centralized compost facilities is the avoidance of the need to transport organic waste which in turn avoids fossil fuel related carbon dioxide emissions. Key concerns about the use of home-based composters is the degree to which they are properly maintained and the level of participation by the public. Maintaining participation with this method as well as ensuring that the compost materials are being properly managed are critical to the success of this infrastructure. Given that it would be somewhat labour-intensive to offer instruction and provide monitoring for hundreds or thousands of bins throughout a municipality, more efficient outreach methods are required if on-site bins are to be employed. Municipalities, recycling agencies and environmental organizations have been offering information services and instruction about composting which helps improve the performance of many composting systems. This information is consumed by those who seek instruction or advice but would not be reaching those who have not sought advice or instruction. Public service announcements could help boost the use or effectiveness of on-site composters by acting as a reminder for those who are less active about compost management. A means of ensuring that composters are used and that compostable products find their way to a composter could be the labelling of packaging or provision of information at the point of purchase of products that have a high component of compostable material (eg. the peelings from fruit and

39
vegetables, the grounds of coffee etc.) Those products, that are already packaged, could be labelled to remind consumers that the residual, or that portion of produce not consumed, can be composted. Such a label, signifying compostable matter, could constitute the organic equivalent of the mobius loop. Information about home composting and its maintenance could be made available at produce counters, particularly during National Composting Week.3 The information could portray produce as the ideal consumer good - "whatever part of fresh fruits and vegetable are not consumed are readily
biodegradable in your backyard composter." Municipal governments could approach food and grocery industries about carrying out some of this activity as part of a contribution through the National Packaging Protocol exercise. For small commercial establishments that produce organic waste, municipalities could offer a small amount of compensation in the form a tax rebate for those who practise on-site composting. This could be regarded as the equivalent of the container handling compensation offered to retailers who participate in soft drink deposit return systems.4 The amount could be based on some fraction of the avoided cost of disposal and could help to compensate for the use of commercial space occupied by an on-site composter. This 'top-up' combined with the reduced disposal cost for the operator might be sufficient to encourage non-practitioners to become practitioners. This arrangement would work best where the on-site composting reduced the demand for municipally hauled waste, as the municipality would incur a reduction in the cost of waste collection. This reduced cost could help to sponsor the operator compensation. Some restaurants and grocery outlets in Ontario have acquired on-site compost facilities. For municipalities that have relied heavily on the use of on-site based composters to meet diversion targets, a point for consideration is the lifespan of a bin. Those distributed by Metro Toronto have a warranty of 10 years. If bins begin to deteriorate and lead to non-usage, then diversion rates will sag. Consideration could be given to the means of ensuring that the bin is replaced which will require that funding for on-going outreach programs continue and that a source of bin replacement and information is readily available to the user who would like to continue composting.
Source separation and processing off-site Centralized composters can manage large amounts of organic waste through predominately aerobic digestion. They have the advantage, over home composters, of generally managing compostable material more thoroughly and more quickly given that the sites usually include effective processing. Generally, compost from programs has had demand in the communities and has been used by municipalities in park programs. The quality of the compost product and the uptake of the product in the community and marketplace is vital to diverting organic waste from landfills. From a greenhouse gas perspective it may make little difference whether organic waste is composted or landfilled in a landfill with a highly efficient gas capture system5 however, by diverting the material and refining it into a marketable product, many added benefits are acheived such as reduced waste disposal, soil enhancement and possibly revenue for the municipality. Metro and the City of Toronto have supported or operated various pilot programs to boost residential waste diversion rates by focussing on organic waste diversion. Almost every scale (except large scale

40
which has not been attempted yet) and type has had some success: � In the summer of 1996, the Metro Toronto Task Force devised a wet-waste project for 1400
households in the City of Toronto which achieved a 55% participation and demonstrated that 17 tonnes of wet organic waste could be diverted from landfill to compost.6
� A pilot wet waste program diverts waste from 20 grocery stores and restaurants in the City's
downtown.7 � A diversion program for organic waste and diapers designed for apartment buildings has
been operating in Scarborough.8 � More than 110,000 residential compost bins have been distributed.
The new City of Toronto will need to expand the coverage of these programs or adopt other methods in order to reach the 50% waste diversion target and maintain its quest to achieve a 20% reduction in greenhouse gas emissions by the year 2005. Metro Toronto is currently considering the introduction of a large scale composter (in the range of 20,000 tonnes per annum but modular to permit expansion) to reduce the amount of organic waste sent to disposal. This could have a large impact on Toronto's diversion rate9, and if its design is anaerobic with gas utilization, it could significantly displace fossil fuel use.
Other municipalities in New Brunswick and Ontario have been attempting different diversion schemes. Wet-dry programs (two streams: wet for compostables and dry for recyclables) have proven to be successful at increasing the rate of diversion from disposal. A wet-dry program has been operating on a pilot basis in the City of Guelph since August, 1989 and is in now operating on city-wide basis. Another program is operating in Northumberland County. The Guelph wet-dry recycling centre can manage up to 44,000 tonnes of compostables and 91,000 tonnes of recyclable per year.10 The system claims a 98% participation rate by households and is currently diverting over 50% of materials collected away from landfill.11 The wet stream is composed of all organic and kitchen and yard waste plus food contaminated packaging, diapers, pet waste, floor sweepings and vacuum cleaner catchings.12 Tests of finished compost product from this stream indicate that the finished compost is within provincial guidelines which suggests that contamination is low and or that screening is effective.13
Diversion rates from wet-dry pilot projects in Ontario are at or above 50% with the residue that remains being sent to landfill. The residue rates are still somewhat higher than projected (35% for wet waste and 48-53% for dry waste) but are expected to reduce as more materials re-enter the marketplace.14 This level of diversion is quite impressive compared to the level achieved through Blue Box Systems (currently between 20-25%).
Some criticisms of wet-dry include the system's cost, which is at the moment greater than the Blue Box, the replacement of volunteer (citizen) sorting with sorting labour (MRF staff) and the possible reduced incentive the user may have for actually reducing waste quantities.15 As well, the user may not as readily be apprised of the proportion of diverted material versus the amount of waste they leave at curbside with the wet-dry system. Systems like the Blue Box, Grey Box and home composters more readily inform the user how much material they are diverting and how much waste
41
they are directing to disposal. One of the most significant requirements of a wet-dry system, in terms of keeping organic waste out of landfills, is a high quality of finished compost. At present, the compost from Ontario's two stream systems has been used in parks, distributed to citizens and for landfill cover. It has not however yet been accepted by greenhouses and nurseries.16 Operators of centralized systems may have difficulty ensuring that compost is as free of contaminants as the operators of backyard or neighbourhood composters, who are likely to ensure that only organic, digestible, non-contaminating materials enter their system. Factors that are impeding municipalities from advancing more aggressive waste diversion and composting programs appear to be predominately cost and market issues. Many municipalities currently have fleets of equipment and infrastructure that would need to be retired or replaced in order to adopt a new more aggressive diversion system. It is noteworthy, however, that revenues from tipping fees and material sales (if prices are high enough) can contribute to, and by design should match, operating costs, which makes more aggressive diversion economically attractive once the capital investment has been made. An additional impediment is the relatively low cost of composting's competition, the landfill. Incorporating the complete costs of waste disposal (ie cost of mitigating environmental impacts) into higher tipping fees would help make composting a lower cost solution. As well, curtailing municipal waste export which allows waste to seek the lowest (financial) cost solution even if it is at very distant point from source, would help.
Anaerobic Organic Digestion Anaerobic digestion of the organic fraction of municipal solid waste in a facility designed for this purpose is not very common in Canada but is so in other countries. Anaerobic digesters or biogas plants digest products such as agricultural and food wastes, manures and the organic fraction of municipal solid waste using methanogenic bacteria in a sealed vessel to reduce the material to methane gas, carbon dioxide and a residual sludge. There are currently no biogas plants operating either in the City of Toronto or Metropolitan Toronto; however, a proposal for a 40,000 t/a commercial plant has been under consideration in the City of Newmarket that would handle commercial biowaste.17 Denmark has 10 biogas plants in operation which process predominately manure from agricultural operations but also organic waste from abattoirs, food industries and the organic portion of residential waste.18 The technology is also being applied extensively in Germany, the Netherlands and in other countries in Europe.19 By 1996, Germany plans to have 46% of its population connected to biological treatment plants in an effort to manage the organic fraction of source separated municipal solid waste.20 A significant advantage of biogas generators could be the improved management of certain types of organic problem wastes. Some digesters use thermophilic bacteria and operate at about 55 degrees Celsius (the heat of pasteurization). This feature allows them to neutralize a number of pathogens.21 Denmark has created a categorization system for waste types, minimum digestion temperatures and residence time and the destination of residual sludge to reduce or eliminate the conveyance of

42
pathogens.22 As well, there is the ability to test the residual sludge from digested material before it leaves the facility and is applied to an outdoor environment. These features suggest it would be more hygienic to process organic waste, that could be putrescent or pathogenic, by anaerobic digestion in stead of the current mix of fates of this waste. For example, soiled diapers, products of incontinent adults, rotting or spoiled food products and manures might be processed by such a method in place of composting, landfilling or landfarming. The organic portion23 of a municipality's residential or ICI waste stream could be used as feedstock for a biogas plant. Biogas are generators similar to wastewater treatment plants in their process (except that most wastewater treatments plants use primarily aerobic processes to manage wastewater). In addition to reducing the organic fraction that might enter a landfill, they produce a useable sludge (stabilized to compost) and generate methane gas. Higher and more consistent rates of methane gas can be produced than under landfill conditions. 24 Sight and odour problems that might be associated with some compost facilities would be much more controllable with such a facility. A biogas generator could be situated much closer to the source of waste than a landfill. This aspect could help reduce transportation emissions. They can be effective where space is constrained, such as in urban areas, as they can be designed to be fairly compact in size and process organics at a fairly rapid rate (sometimes in days instead of three to nine25 weeks compared with aerobic digestion).
Potential drawbacks to their use include the possibility that they could be used to manage recyclables (paper or cardboard) rather than ensuring these products are recycled. Mixed MSW might be attempted as a feedstock as well. If plastics, metals, liquid household hazardous waste and other products are not successfully screened from the feedstock, then they will contaminate the residual sludge. In this light, the quality of the residual sludge is as much dependent on careful source separation of wastes as is the quality of compost. In effect, the use of anaerobic digestion would be an improvement to what currently occurs (large amounts of digestible waste are converted to methane in landfill). Both the methane gas and residuals could be produced under much more controlled conditions and both could be captured and used as products. In California, a demonstration project captures the gas produced from a biogas plant, upgrades it and feeds it directly into a fuel cell to generate electricity.26 Fuel cells typically have a much higher conversion efficiency than internal combustion engines. The project is being sponsored by the Sacramento Municipal Utility District in conjunction with the University of California (Davis) in response to the utility's customer demands. After the closure of a nuclear power plant that supplied a portion of the District's electricity needs, SMUD directors surveyed their customers who indicated a preference for more environmentally sensitive electricity generation. In response, SMUD began to develop wind, solar and biogas generating programs.27 A development which could greatly impact how organic, food and agricultural wastes are treated is the Ontario government's August 1996 Responsive Environmental Protection. The provincial government in Ontario may be moving in an opposite direction to developments elsewhere. It has, for example, contemplated that regulations which currently restrict many food and animal wastes from being applied to agricultural lands be relaxed.28 The Ministry proposals, if implemented, would expand the definition of agricultural waste to permit the application of the following materials to
43
agricultural lands: fruit and vegetable waste from food packing, food processing and wholesale storage and distribution operations; field crop waste from screening, drying and storage operations; manure and animal bedding from stockyards, meat packing plants, riding stables, racetracks, fairs, and exhibitions; and dead fish, aquatic plants, animals, or settleable tank or impoundment solids, from aquaculture operations.
Disposal: landfill or incinerate as part of total waste stream Disposal of organic waste in a landfill with a methane capture system (as opposed to one without) is a solution from a GHG management perspective, though it does not constitute a preferred solution when waste diversion is considered. In Realizing Toronto's Target for Greenhouse Gas Emissions
Reductions it was suggested that ICI solid waste could be directed to a landfill that has a methane capture system. Metro Toronto's current landfill, Keele Valley, is equipped with a capture system as is one of its future sites (Arbor Hill, Mi.). This suggested approach would ensure that some of the climate change aspects of waste management were mitigated but that waste diversion efforts would not be further enhanced. Provincially or nationally, this recommendation may not be an option for many municipalities given the few landfills that capture and use landfill gases There are only 12 landfills in Ontario with landfill gas capture systems, and fewer than 30 in Canada overall. As well, many of the sites with capture systems are in place no longer receive waste. In terms of directing organic waste to incineration, analyses such as the US EPA study suggest that there is little difference between composting or incinerating from a greenhouse perspective.29 However, there are a number of points that flow from or can be added to this analysis. The USEPA notes that incinerating products such as cardboard or paper cause a net increase in greenhouse emissions. If these products were recycled or reduced through source reduction, they would cause a net decrease in greenhouse gas emissions. Since municipal incinerators frequently use more than simply the "non - recoverables" in the waste stream and may in fact undermine the recovery of recyclables, it should be regarded warily as a GHG emission reduction strategy. Even if municipal incinerators are not intended to combust more than the "non-recoverable" fraction of MSW, the temptation could develop on the part of operators of incinerators to resort to combusting more than just the non-recoverable portion of municipal solid waste. For example, in the case of hospital incinerators intended to manage only biomedical waste, it has been identified that these units often incinerate much more, namely municipal solid waste.30 Other undesirable features about incinerators are the toxic and hazardous ash and air emissions they produce,31 and their ability to be very energy and material intensive when the energy and material that were incorporated into some products combusted (ie. tires) are considered. For the above reasons, continuing to dispose of MSW by either incineration of landfill is not considered an optimal solution.
Paper and Cardboard
Paper and cardboard products are, of course, expected to be directed to recycling programs not compost programs. For a number of reasons, paper and cardboard should not be landfilled. Paper and cardboard products are among the most methane producing materials when digested by

44
methanogenic bacteria in a landfill. As well the creation of paper and cardboard products from recycled stocks generates fewer greenhouse gas emissions than if they were created from virgin materials.32 For these reasons it is critically important to ensure that paper and cardboard products continue to be recycled. Industries which employ multi-material packaging (ie. paper laminated with plastics or foils) could move to simplify their packaging, particularly reducing the container or packaging to a single material which is recyclable through the majority of municipal programs. Furthermore, it would help to reduce the confusion that can arise over whether a container/package is truly recyclable or not. Many multi-material packaging/containers which includes paper are entering landfills because they appear to be or truly are non-recyclable. Industry has an obligation to reduce packaging waste, through the National Packaging Protocol, and methods which could substantially contribute is source reduction and packaging simplification. A variety of methods are currently used to divert cardboard, newsprint and office paper including the Blue Box and Grey Box Systems, depots and office collection systems. These are often highly effective at capture and diversion. Some of the most effective means to ensure that the diverted materials are in fact taken up by the marketplace have been recycled content regulations and government procurement programs. The combination of government procurement programs, state and federally legislated recycled content standards as well as paper making infrastructure refitting and general improvements in market conditions are credited with turning recycled paper gluts in the early 1990s into a commodity in demand.33 Procurement by governments, given their size can have a substantial impact on a market. For example, the United States federal government issued an executive order in 1993 requiring that the paper it purchases be 20% recycled in content by 1995 and 25% by 2000.34 The US government uses about one-quater of a million tonnes per year. Similarly, recycled content legislation can create significant demand for used fibre. As a consequence, this 'manufactured' demand can help to re-assure manaufacturers that investment in plants and equipment are sound.
The recycled fibre markets have been helped and hurt by events in the U.S. The demand for recycled fibre helped to elevate its price which was helpful to municipalities attempting to cover the cost of retrieving the material. However, paper-making mills have now been set up in some U.S. cities, closer to the source of the fibre which has somewhat depressed demand for Canadian used fibre or paper with recycled content.35
Various levels of government could procure or set standards for increasing recycled content in paper which would greatly reinforce fibre demand which in turn, would ensure that fibre is noy needlessly disposed of in landfills. While prices are currently stable, they are low enough that some private collectors have abandoned the activity and some municipalities have considered dropping fibre
collection.36 Through the recycled content standards such as the Environmental Choice labelling system, Environment Canada could stimulate demand for used office fibre. By ramping up the current level which is only 10% post-consumer fibre (50% when non-used mill run, off-specification materials, ends of rolls and other pre-consumer materials are added) to between 25-50% post-consumer fibre over a period of ten years, the marketplace would ensure that used fibre was captured. Proper management of paper products should be emphasized. As organic waste diversion programs
45
continue to divert food and yard waste from landfills, the principal digestible material may become paper-based packaging, labels, spoiled cardboard and other paper-based materials that are not being successfully diverted.

46

47

48
Section 6 : Options for Emission Reductions: Mitigative Measures
Past versus Present Waste Management Practices The starting point for assessing the creation of methane and other landfill gases is that many of the materials diverted today were not in the past. A high percentage of the materials that were landfilled in the past must be considered when estimating emissions that are being generated at present or in future. Items such as paper or cardboard are more appropriately diverted for recycling or re-use but in past these were frequently landfilled. In many cases they probably still are, as diversion programs are not capturing all paper-based wastes. This has the effect of elevating the digestible matter in waste for those wastes landfilled prior to, or in the absence of, material diversion programs. In this light, as much as 70% of the residential waste stream landfilled in the past and approximately half of the current waste may be anaerobically digestible when landfilled. Methods of Methane Management Several methods have been employed to manage the methane gas emitted from landfills : collect and combust on-site to reduce methane to carbon dioxide; capture and combust for power generation; and capture and upgrade for use as natural gas. These applications will be reviewed against the current state of affairs in Canada. Also, trends in waste management which support the likelihood of gas capture will be reviewed.
Collect and combust on-site to reduce methane to carbon dioxide From a GHG perspective, capturing and combusting the methane portion of the landfill gases constitutes a mitigative measure, given methane's much more potent global warming potential relative to carbon dioxide. Some concern should be paid to the suggestion that landfill gases be simply flared. Firstly, a variety of toxic organic and inorganic substances are almost always present in landfill gases in trace quantities (see Table 10 below). If combustion is not highly controlled and monitored, flaring may open the possiblity of a significant escape of uncombusted or partially combusted substances. Open flame flaring from hydrobarbon production has been assessed as being only 62%-84% efficient.1 As well, a 'resource' which is capable of displacing coal or other hydrocarbon combustion is not being employed to its fullest extent. Flaring may be required to some degree in the development of a site which is to be outfitted for heat or electrical production.
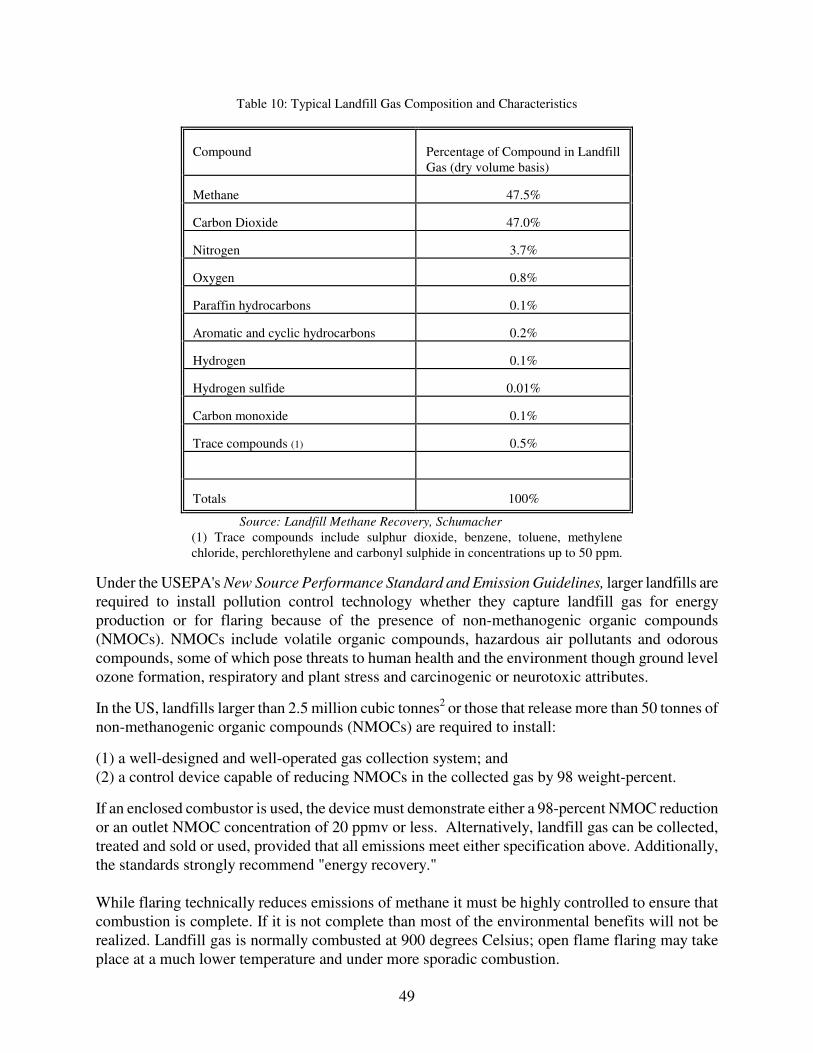
49
Table 10: Typical Landfill Gas Composition and Characteristics
Compound
Percentage of Compound in Landfill Gas (dry volume basis)
Methane
47.5%
Carbon Dioxide
47.0%
Nitrogen
3.7%
Oxygen
0.8%
Paraffin hydrocarbons
0.1%
Aromatic and cyclic hydrocarbons
0.2%
Hydrogen
0.1%
Hydrogen sulfide
0.01%
Carbon monoxide
0.1%
Trace compounds (1)
0.5%
Totals
100%
Source: Landfill Methane Recovery, Schumacher (1) Trace compounds include sulphur dioxide, benzene, toluene, methylene chloride, perchlorethylene and carbonyl sulphide in concentrations up to 50 ppm.
Under the USEPA's New Source Performance Standard and Emission Guidelines, larger landfills are required to install pollution control technology whether they capture landfill gas for energy production or for flaring because of the presence of non-methanogenic organic compounds (NMOCs). NMOCs include volatile organic compounds, hazardous air pollutants and odorous compounds, some of which pose threats to human health and the environment though ground level ozone formation, respiratory and plant stress and carcinogenic or neurotoxic attributes.
In the US, landfills larger than 2.5 million cubic tonnes2 or those that release more than 50 tonnes of non-methanogenic organic compounds (NMOCs) are required to install:
(1) a well-designed and well-operated gas collection system; and (2) a control device capable of reducing NMOCs in the collected gas by 98 weight-percent.
If an enclosed combustor is used, the device must demonstrate either a 98-percent NMOC reduction or an outlet NMOC concentration of 20 ppmv or less. Alternatively, landfill gas can be collected, treated and sold or used, provided that all emissions meet either specification above. Additionally, the standards strongly recommend "energy recovery." While flaring technically reduces emissions of methane it must be highly controlled to ensure that combustion is complete. If it is not complete than most of the environmental benefits will not be realized. Landfill gas is normally combusted at 900 degrees Celsius; open flame flaring may take place at a much lower temperature and under more sporadic combustion.

50
If a landfill operator is required to install a landfill gas collection system as well as pollution control technology, it would seem prudent to use the landfill gas for energy production purposes rather than simply flaring it. By using landfill gas for energy production, an attendant environmental benefit is achieved, the displacement of fossil fuels. Currently about half of the landfills in Canada with capture systems flare their gas. Some of these employ open flame flaring.
Capture and combust for power generation When landfill gas is captured and combusted for power generation, direct atmospheric emission of methane is avoided and the use of fossil fuel is also avoided. The latter benefit deserves emphasis. Energy related emissions of greenhouse gases account for 80.7% of all GHG emissions in Canada in 1995.3 Without substantial efforts related to energy conservation, fuel switching and the use of renewable energy sources, it is unlikely that Canada will succeed in stabilizing or reducing its greenhouse gas emissions. In the United States, the USEPA has been quite active in promoting the implementation of landfill gas capture systems. The Environmental Protection Agency has established a Landfill Methane Outreach Program that "encourages landfill owner / operators to turn a liability into an asset." The EPA estimates that there are over 700 landfills across the United States which could install landfill gas recovery systems on an economically viable basis. To date, approximately 150 energy recovery facilities have been installed and many more are in the developmental stage.4 It is projected that, by June 1998, 400 of 700 site will have been developed or under development. Part of the motivation to complete these project is the Internal Revenue Service's "Non-Conventional Fuels Tax Credit" which can be applied to landfill gas capture systems. This measure is available until June 1998. Through the Landfill Methane Outreach Program, which is voluntary in nature, the Non-Conventional Fuels Tax Credit and through Clean Air Act regulatory requirements (New Source Performance Standard and Emissions Guidelines) which cover large landfills, it is projected that by the year 2000, 58% of all landfill methane generated will be generated at sites which have recovery systems and 91% of these will capture methane for energy recovery puposes.5
Currently, Environment Canada does not regulate atmospheric emissions from landfills.
At the provincial level the Ontario government could advance landfill gas capture and energy recovery through a number of actions. Currently, the Select Committee on Ontario Hydro Nuclear Affairs is reviewing the utility's nuclear electrical generating capacity recovery plan. The Committee could recommend that Ontario Hydro adopt forms of electricity production that are more benign from an environmental impact perspective. Given Ontario Hydro's admission that its coal-fired electricity carbon dioxide emissions will rise while some nuclear capacity is out of commission, electricity production from landfill gas capture could help reduce carbon dioxide and other coal related emissions in the province. The province could also ensure that its landfill atmospheric guidelines are applied to more than just new landfills. Some landfill gas mitigation could be initiated by applying the guidelines to landfills which already exist.

51
Landfill Methane Uses in addition to on-site combustion Landfill gas can be captured, upgraded and stored or distributed. Stored methane could be used for mobile applications such as powering vehicles. If a landfill is located near natural gas lines it can be treated and distributed to customers. Natural gas utilities are reported to be receptive to this arrangement.6 Landfill gas has also been used as a fuel source for fuel cells. Fuel cells that use natural gas as their feedstock for electricity generation could make use of landfill gas after it has been purified and upgraded. Some fuel cells have been installed at landfills in the United States. The variability of landfill gas composition can be somewhat limiting for this application as fuel cells tend to be sensitive to gas purity. The advantage of employing fuel cell technology is their higher energy conversion efficiency relative to internal combustion engines. If captured methane can be used or directed to a nearby facility for electricity production as well as space heating (this is termed co-generation) then significant emission reduction and energy savings can result. Co-generation of heat and electricity from landfill gas was a component of Metropolitan Toronto's Draft Carbon Dioxide Reduction Strategy.
Trends in Support of Methane Capture A trend in Canada which should increase the effectiveness of employing landfill gas capture systems is the movement toward centralizing waste disposal activities into larger operations, specifically, closing small waste sites and re-directing disposal to larger, properly designed landfills. A number of provinces (Nova Scotia, New Brunswick and British Columbia) are closing as many as 50% -75% of the landfills in their jurisdictions and directing the waste to fewer but properly designed regional landfills.7 Larger landfills tend to make the installation of gas capture system more effective from the perspective of quantity of gases recovered (methane and VOCs) and from a financial viewpoint. The trigger level used by the Ontario Ministry of Environment and Energy and the US Environmental Protection Agency is 2.5 million tonnes. The City of Toronto and Metro both currently direct residential waste to a large site with a methane capture system, however privately collected waste within these jurisdictions may be going to a variety of different landfills, with and without gas capture systems. The City of Toronto has no active sites to close. Metro is scheduled to close Keele Valley in 2002, afterwhich it will may not have any active landfills under its direct ownership. There are however many small landfills across Ontario and Canada which could be retired. Programs in Support of Environmental Technology The province of Ontario announced in its 1997 budget, the Research and Development Challenge

52
Fund, an advanced technology promotion fund. The Fund will provide tax credits and some direct support to industries conducting research and development primarily in advanced technology. Environmental Sciences is listed as one of four target areas after Natural Sciences and Engineering, Mathematics and Health Sciences. All disciplines, however, are eligible to apply to the Fund. In May of 1997, the Ontario Ministry of Environment and Energy announced a environmental technology advisory project. Under the project, Ministry experts will be made available to provide written evaluations of new technologies. It is intended that this will give investors or buyers of the technology the confidence to proceed with its development or implementation. The program will initially focus on evaluating methods for treating water and wastewater, air pollution control, site remediation and the handling and treatment of hazardous waste. Ontario-based companies with technologies that are generally unproven, or unproven in Ontario, are eligible to apply for this service.

53

54
Section 7: Reduction Potentials
The tabulations in this section estimate the potential for carrying out preventative and mitigative measures in the waste management sector in Canada. Preventative potential is provided in terms of the number of tonnes of digestible waste that is currently entering landfills in Canada. Mitigative potential is provided in terms of the amount of methane that could be reduced and what contribution this could make to closing Canada's year 2000 stabilization gap.
Summary of Preventative Reduction Potential Despite commendable diversion efforts by municipalities across Canada, large amounts of digestible waste are still entering landfills (see Tables 11 and 12). Table 11: Estimated amount of digestible waste sent to landfills in 1996 from the City of, and Metro Toronto. Jurisdiction (1996)
Total Waste Collected
Total Digestible Waste Fraction
Digestible Waste Entering Landfill
MSW
323 k tonnes
226 k tonnes
165 k tonnes
Toronto, City of
ICI
331 k tonnes
136 k tonnes
136 k tonnes
MSW
995 k tonnes
696 k tonnes
525 k tonnes
Metro Toronto
ICI
1,000 k tonnes
400 k tonnes
400 k tonnes
Sources: Metropolitan Toronto and City of Toronto (for calculations see appendix c)
Table 12: Estimated amount of digestible waste sent to landfills in 1995 for Ontario and Canada. Jurisdiction (1995)
Total Waste Generated
Total Waste Landilled
Digestible Waste Fraction
Portion of Digestible Waste Entering Landfill
Ontario (1995)
8.7 m tonnes
7.0 m tonnes
4.8 m tonnes
3.4 m tonnes
Canada (1995)
25.1 m tonnes
18.3 m tonnes
13.8 m tonnes
8.9 m tonnes
Sources: Biocycle (for calculations see appendix c) To highlight the significance of these numbers, a comparison could be drawn between the amount of waste landfilled in Canada each year and one of Canada's largest landfills (Brock West in Pickering, Ontario). In 1995 Canada landfilled a total of 18.3 million tonnes of solid waste. The Brock West Landfill has a capacity of 19 million tonnes and generates enough methane to produce electricity for 6000 homes. In effect, Canada's organic material disposal each year could provide the electrical needs of a small city.

55
Summary of Mitigation Potential If all the methane from all of the landfill sites in Canada could be captured and reduced, then Canada's year 2000 emission gap would be reduced by 40% (or 18,270 kilotonnes). This level of capture is unlikely practical or achievable given the thousands of landfills sites in Canada. However, if even some of the larger landfills in the country were outfitted with gas capture systems, a sizeable reduction in methane emissions could be made. Environment Canada estimates that outfitting approximately 35 more landfill sites (1-2 million tonnes or larger) would double Canada's current landfill gas capture rate of approximately 24% to 50%.1 Canada currently has 27 sites outfitted. A landfill gas capture rate of 60% (the "Enhanced Scenario" below) would be in line with the projected rate of capture (58%) at landfills in the US by the year 2000.2 If 60% of Canada's landfill methane emissions could be captured and reduced, then Canada could trim its emission gap by 19%.3 If Canada's emission gap is as high as 13%, then the same effort (60% capture) would trim the emission gap by 12%. In 1990 Canada emitted 567,000 kt of CO2 equivalent. In the year 2000, it is forecast that Canada will emit at least 8.2% more (or 46,500 kilotonnes CO2 eq more than it did in 1990). Given recent projected increases in fossil fuel use, the gap could be as high as 13% or 73,700 kilotonnes of CO2 eq. Table 13: Comparison of current and enhanced capture rates Current Scenario : 24 % Methane Capture in Canada
Methane
CO2 Equivalent
Total CH4 produced by all landfills in 1995
1139 kt
23,919
Total CH4 captured and reduced by current systems
- 269 kt
5,670
Total CH4 emitted
870 kt
18,270 kt
Enhanced Scenario : 60% Methane Capture in Canada
Methane
CO2 Equivalent
Total CH4 produced by all landfills in 1995
1139 kt
23,919
Reduction if 60% of landfill CH4 is captured and reduced.
- 683 kt
14,301
Total CH4 emitted
456 kt
9,555
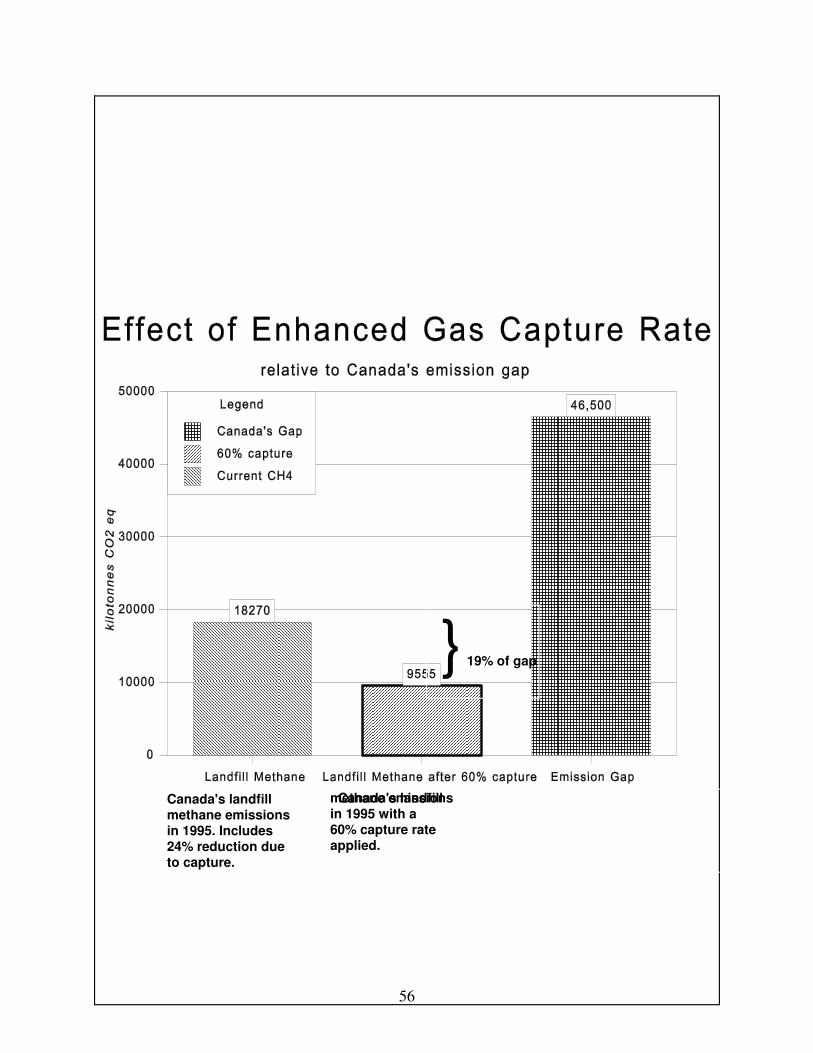
56
Canada's landfill methane emissions in 1995. Includes 24% reduction due to capture.
} 19% of gap
Canada's landfill methane emissions in 1995 with a 60% capture rate applied.

57
58
Section 8 : Summary, Conclusions and Recommendations
Summary Managing the risks associated with human induced climate change, particularly through greenhouse gas emission reduction remains one of the most politically challenging issues facing the nations of the globe as the year 2000 approaches. The combustion of hydrocarbons, the number one cause of greenhouse gases in the world, is considered so integral to so many industries, activities and products that many segments of society regard greenhouse gas reduction measures as a significant threat to their economic interests. Nevertheless, a great deal of research has concluded that meaningful reductions can be made in carbon dioxide emissions (the number one anthropogenic greenhouse gas by volume and overall global warming potential) without substantial sacrifice or undue burden on any particular segment of society and often with coinciding environmental or social benefits. This paper reviewed the potential to reduce emissions in Canada of the number two greenhouse gas, methane, and in particular emissions of methane from sources within the municipal realm. Emissions of methane account for almost 13% of Canada's greenhouse gas emissions. Methane's contribution to the global warming effect is thought to exceed, its share of the inventory because of its indirect effects. Estimates place its contribution over the past decade between one half and one third of that of carbon dioxide. Important sources of methane include upstream oil and gas production and downstream distribution, agriculture and landfills. Solid waste landfills account for approximately one-quarter of Canada's methane emissions. This paper reviewed two major approaches to reducing waste related emissions of methane: (i) prevent anaerobically digestible waste from entering landfills; and (ii) capture and reduce the emissions from existing and future landfills. Both approaches need to be applied to manage to successfully tackle this set of emissions as large amounts of digestible waste are still not being diverted from landfill and the vast majority of landfills in Canada do not have landfill gas capture systems.
Conclusions and Recommendations Waste Diversion and Reduction The best means to prevent emissions of methane from waste management activities is through the diversion from landfill of wastes that are anaerobically digestible. Digestible materials (yard waste, foods scraps, paper products, cardboard, organic materials), account for approximately 70% of municipal solid waste (before diversion). If all of this material were capable of being diverted, Canada would avoid the production of approximately 1140 kilotonnes of landfill methane per year or the equivalent of 24,000 kilotonnes of carbon dioxide. Source reduction of waste is considered one of the most highly effective means of reducing GHGs from the waste system because it avoids emissions at various points in the lifecycle of products and packaging. Since less packaging and less material would require less energy to produce and transport
59
and would generate less methane in a landfill (if disposed), source reduction efforts almost invariably lead to GHG emission reduction.
Municipal programs which promote composting and the diversion paper products can have a significant effect in avoiding future emissions of methane. For example, the City of Toronto diverted 74,650 tonnes of material from disposal in 1996, of which 56,000 tonnes were digestible materials. Similarly, on Metropolitan Toronto basis, citizens of that city diverted 223,979 tonnes of materials from disposal of which 171,816 tonnes were digestible.
Paper products can be significant generators of methane which makes curbside paper recycling a valuable program for methane avoidance in addition to resource conservation goals.
Composting programs effectively manage that portion of digestible waste that is not recyclable (ie food and yard wastes). Composting these materials, as opposed to landfilling them, leads to slightly lower greenhouse gas emissions unless the landfill is outfitted with a highly efficient gas capture system in which case the options become about equal. Even if composting or landfilling can have roughly equal emission values under certain circumstances, composting also advances the goal of waste diversion and yields a valuable product, compost. The most effective means of securing greenhouse gas reductions from municipal organic waste material would be combining organic waste diversion with anaerobic digestion in a sealed vessel to create, capture and use surplus methane gas. The gas could be used to displace fossil fuel use and the residual sludge can be stabilized to compost. If surplus digester gas is used for heat production and / or electricity production, an equivalent amount of fossil fuel use is displaced, thereby making the reductions in greenhouse gas emissions more significant.
Preventing emissions of methane from waste management activities could be advanced through the following measures.
° Provincial and industry efforts to achieve a 50% reduction in waste to landfill should not abate. Overall, Canada is approaching the half-way point of this target.
° Environment Canada should initiate a process of advancing recycled content standards for
paper products under its Environmental Choice labelling program, to ensure that high rates of post-consumer fibre are captured and not landfilled.
° Municipalities, in conjunction with electrical and gas utilities, could explore the use of anaerobic digester technology and the sale or use of any surplus gas from processing organic waste.
° Members of the Federation of Canadian Municipalities could act on their resolution supporting deposit/returns regulations, the development of a national packaging stewardship model, and regulations on packaging waste if industry fails to meet the 1996 National Packaging Protocol Target of a 35% diversion rate from disposal.
° In municipalities where residential composting is employed extensively, public outreach campaigns will continue to be required to ensure that this infrastructure is properly
60
maintained and operated.
° The newly amalgamated City of Toronto should continue to honour the commitments that were made by the former Metro and City of Toronto levels of government regarding greenhouse gas stabilization and reduction. With 8% of the population of Canada, the City's contribution to greenhouse gas reduction and waste reduction goals will be vital.
Landfill Gas Capture The best means of reducing the impact of methane emissions from landfill sites that already exist is to capture their methane and reduce it through combustion to carbon dioxide. This converts the emission of a gas with a global warming potential of 21, to a gas with the global warming potential of 1. Furthermore, additional environmental benefits can arise from the capture and combustion of landfill methane. Other compounds in landfill gas, termed non-methanogenic organic compounds (NMOCs), are also reduced when landfill gas is properly combusted. NMOCs can include smog precursors such as volatile organic compounds. If landfill gas is captured, combusted and used for heat production and/or electricity production an equivalent amount of fossil fuel use is displaced, thereby making the reductions in greenhouse gas emissions more significant. In terms of mitigating the atmospheric impacts of previously landfilled waste, an enormous opportunity still exists. Landfills in Canada, in 1995, generated 1139 kilotonnes of methane of which 870 kt were released (18,270 kilotonnes of carbon dioxide equivalent). The balance, 269 kt was captured and reduced. These emissions arose from previously landfilled organic waste (food and yard waste) and other digestible waste (paper, cardboard) which decomposed anaerobically.
Canada currently has 27 landfill gas capture installations but thousands of landfills. These installations currently reduce Canada's landfill methane emissions by 24%. If Canada could boost its capture rate to 60%, it could reduce its emission gap by as much as 19%. In Ontario, 26 landfills were identified in 1992 as being highly likely to be able to support a capture system. Since that time only 4 landfills have been outfitted. In total, the province has 12 installations.
Means of advancing mitigation methods for existing sources of landfill methane include the following.
° Environment Canada should regulate atmospheric emissions from landfills as the USEPA does. Methane emissions are a greenhouse gas and are therefore an area of legitimate federal environmental jurisdiction.
° The federal government could enhance tax treatment for the utilization of landfill methane as has been done by the Internal Revenue Service in the United States.
° Provinces with landfill gas capture guidelines (British Columbia, Ontario and Quebec) should lower the trigger size of installation and broaden their application. Ontario uses a capacity of 2.5 million tonnes. It could be reduced to 1.0 million tonnes or less and apply to existing, as well as, new landfills. The application of such guidelines is one means to ensure that ICI waste related methane emissions are reduced.
61
° Municipalities and private landfill operators that have not studied the feasibility of landfill gas capture from landfills in their jurisdiction should undertake such studies.

62
Glossary BFI Browning Ferris Industries CCME Canadian Council of Ministers of the Environment CCTG Climate Change Task Group CEA Canadian Electrical Association CFCs Chlorofluorocarbons CH4 Methane CO2 Carbon Dioxide COP-3 The Third Conference of the Parties EAA Environmental Assessment Act EAB Environmental Assessment Board EPA Environmental Protection Act FCCC Framework Convention on Climate Change GHG Greenhouse Gases GWP Global Warming Potential H2 Hydrogen HFCs Hydrofluorocarbons HCFCs Hydrochlorofluorocarbons ICI Industrial, Commercial and Institutional IPCC Intergovernmental Panel on Climate Change JUSCANZ A bloc of countries comprising of Japan, United States, Canada, Australia, and New Zealand kt Kilotonne LFG Landfill Gas MoEE Ministry of Environment and Energy (Now Ministry of Environment) MSW Municipal Solid Waste MTCE Metric Tonnes Carbon Equivalent Mt Megatonne N2 Nitrogen N2O Nitrous Oxide OH The hydroxyl radical ppbv Part per billion by volume ppmv Part per million by volume pptv Part per trillion by volume SF6 Sulphur hexaflouride SMUD Sacramento Municipal Utility District TTC Toronto Transit Commission USEPA United States Environmental Protection Agency VOCs Volatile Organic Compounds WTP Wastewater Treatment Plant

Appendix A: Estimates of Waste Composition
The following information includes a number of analyses of the composition of municipal solid waste (before source separation). Based on these analyses it is estimated that up to 70% of municipal solid waste is capable of being digested anaerobically in a landfill and generating methane gas. These materials include food, yard trimmings, sanitary products, diapers, pet droppings, ashes, vacuum bags, newsprint, glossy paper, fine paper, boxboard, mixed paper and corrugated cardboard. Other materials such as wood1 and textiles may also contribute depending on their size and composition. To be conservative these materials were excluded. While diversion programs have prevented some materials from entering landfills, many programs are not capturing more than 25% of the residential waste stream. Of these materials diverted, many are non-digestible (plastics, glass, metals etc.). Furthermore, the ICI waste stream may or may not be subject to waste diversion efforts and much of its waste (at least 40%) may be digestible in nature and is being landfilled. The result is that a significant portion of the waste stream that is currently entering landfills is undoubtedly capable of supporting mathane production.
1 Wood, particularly in large peices, is unlikely to digest anaerobically and is more likely to sequester its carbon
in a landfill. See USEPA Greenhouse Gas Emissions from Municipal Waste Management, Draft Working Paper, March 1997.
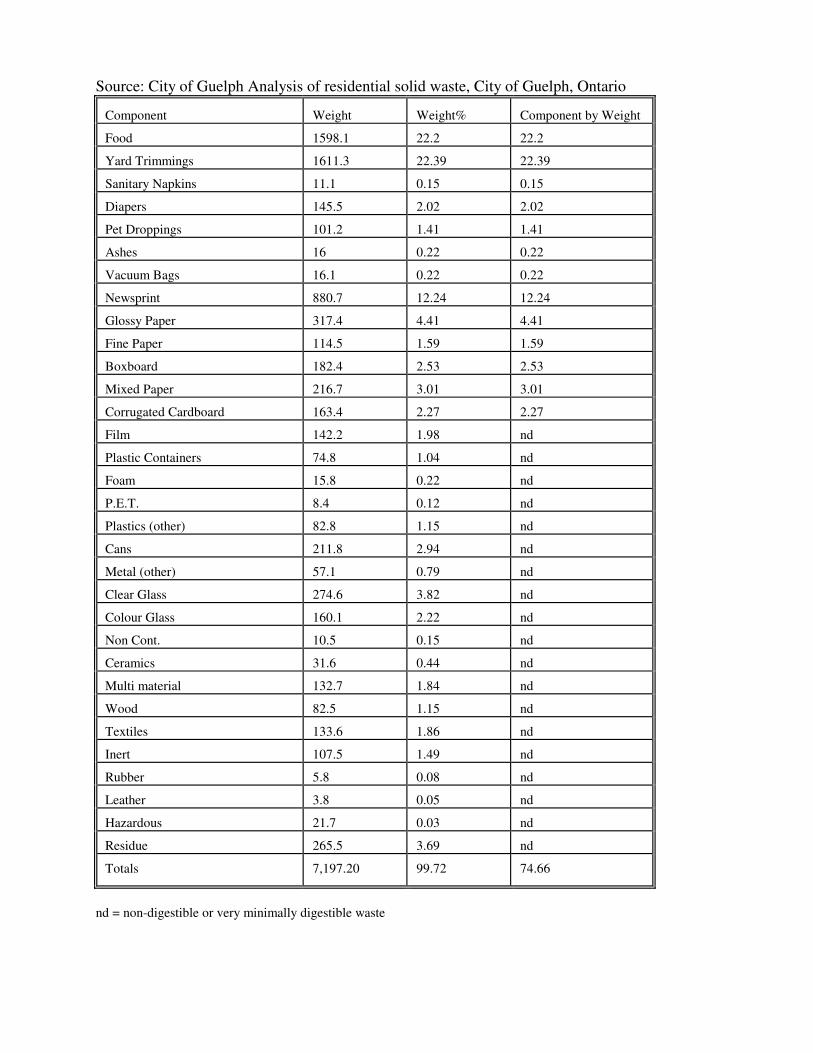
Source: City of Guelph Analysis of residential solid waste, City of Guelph, Ontario Component
Weight
Weight%
Component by Weight
Food
1598.1
22.2
22.2
Yard Trimmings
1611.3
22.39
22.39
Sanitary Napkins
11.1
0.15
0.15
Diapers
145.5
2.02
2.02
Pet Droppings
101.2
1.41
1.41
Ashes
16
0.22
0.22
Vacuum Bags
16.1
0.22
0.22
Newsprint
880.7
12.24
12.24
Glossy Paper
317.4
4.41
4.41
Fine Paper
114.5
1.59
1.59
Boxboard
182.4
2.53
2.53
Mixed Paper
216.7
3.01
3.01
Corrugated Cardboard
163.4
2.27
2.27
Film
142.2
1.98
nd
Plastic Containers
74.8
1.04
nd
Foam
15.8
0.22
nd
P.E.T.
8.4
0.12
nd
Plastics (other)
82.8
1.15
nd
Cans
211.8
2.94
nd
Metal (other)
57.1
0.79
nd
Clear Glass
274.6
3.82
nd
Colour Glass
160.1
2.22
nd
Non Cont.
10.5
0.15
nd
Ceramics
31.6
0.44
nd
Multi material
132.7
1.84
nd
Wood
82.5
1.15
nd
Textiles
133.6
1.86
nd
Inert
107.5
1.49
nd
Rubber
5.8
0.08
nd
Leather
3.8
0.05
nd
Hazardous
21.7
0.03
nd
Residue
265.5
3.69
nd
Totals
7,197.20
99.72
74.66
nd = non-digestible or very minimally digestible waste
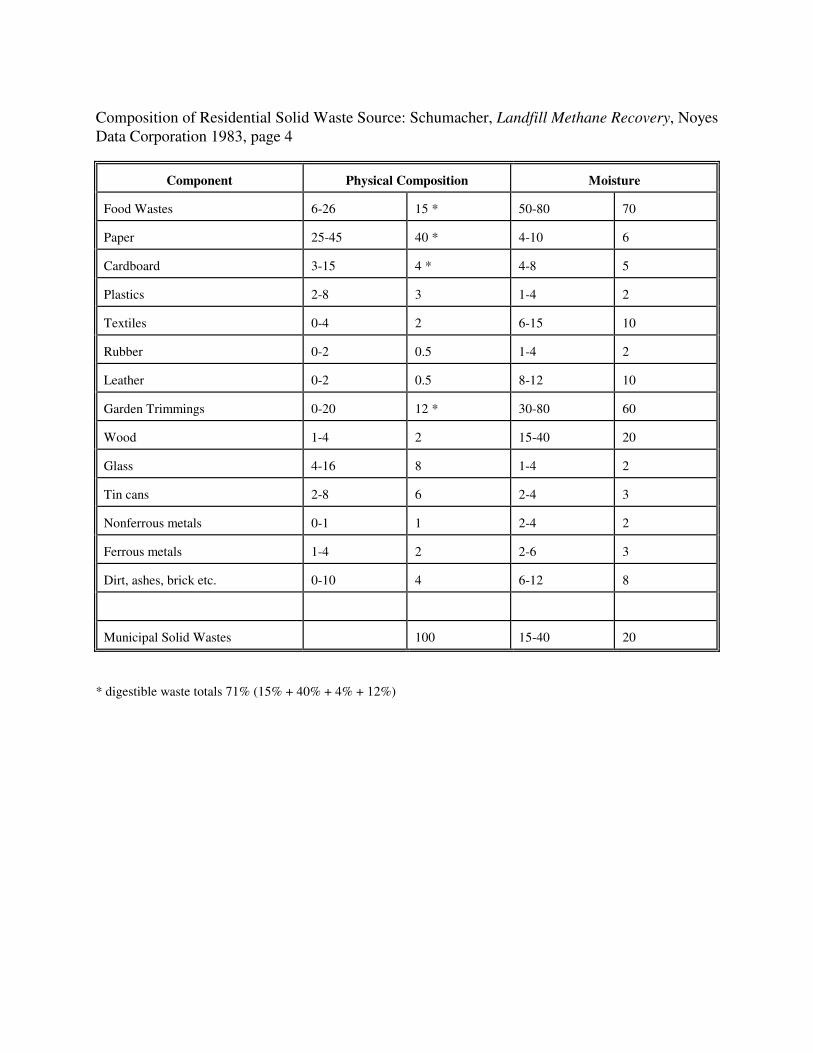
Composition of Residential Solid Waste Source: Schumacher, Landfill Methane Recovery, Noyes Data Corporation 1983, page 4
Component
Physical Composition
Moisture Food Wastes
6-26
15 *
50-80
70
Paper
25-45
40 *
4-10
6
Cardboard
3-15
4 *
4-8
5
Plastics
2-8
3
1-4
2
Textiles
0-4
2
6-15
10
Rubber
0-2
0.5
1-4
2
Leather
0-2
0.5
8-12
10
Garden Trimmings
0-20
12 *
30-80
60
Wood
1-4
2
15-40
20
Glass
4-16
8
1-4
2
Tin cans
2-8
6
2-4
3
Nonferrous metals
0-1
1
2-4
2
Ferrous metals
1-4
2
2-6
3
Dirt, ashes, brick etc.
0-10
4
6-12
8
Municipal Solid Wastes
100
15-40
20
* digestible waste totals 71% (15% + 40% + 4% + 12%)

Source: Ontario's Waste Reduction Action Plan, 1991, Ontario Ministry of the Environment Table 2: Combined waste streams from the residential and ICI sectors in Ontario
Weight (%)
Category
Examples 43.0
Other
textiles, leather, plastic, rubber, white goods (appliances).
21.0
Packaging
boxboard, corrugated cardboard, glass, metal, plastic and aluminum containers.
20.0
Paper
newsprint, fine paper, telephone books, tissue.
16.0
Organics
food and yard wastes.
Table 2: Composition of waste from the residential and ICI sectors in Ontario Residential Sector
ICI Sector
Weight (%)
Category
Weight (%)
Category 31.6
Organics*
23
Cardboard*
29.2
Paper*
22
Other**
19.5
Packaging**
19
Wood
11.6
Other
13
Paper*
2.8
Diapers*
10
Metal
2.5
White Goods
5
Organics*
1.6
Demolition Materials
5
Glass
1.2
Wood
3
Plastic
* digestible waste ** partially digestible waste
The portion of the Residential Sector waste stream that is digestible is estimated to be at least 63.6% (31.6% + 29.2% + 2.8%). This sum does not include the 'Packaging' and 'Other' categories which would also contribute to the digestible waste total. The portion of the ICI Sector Waste Stream that is digestible is estimated to be approximately 41% (23.0% + + 13.0% + 5.0% ).This sum does not include the 'Other' categories which could also contribute to the digestible waste total and therefore is a conservative estimate.
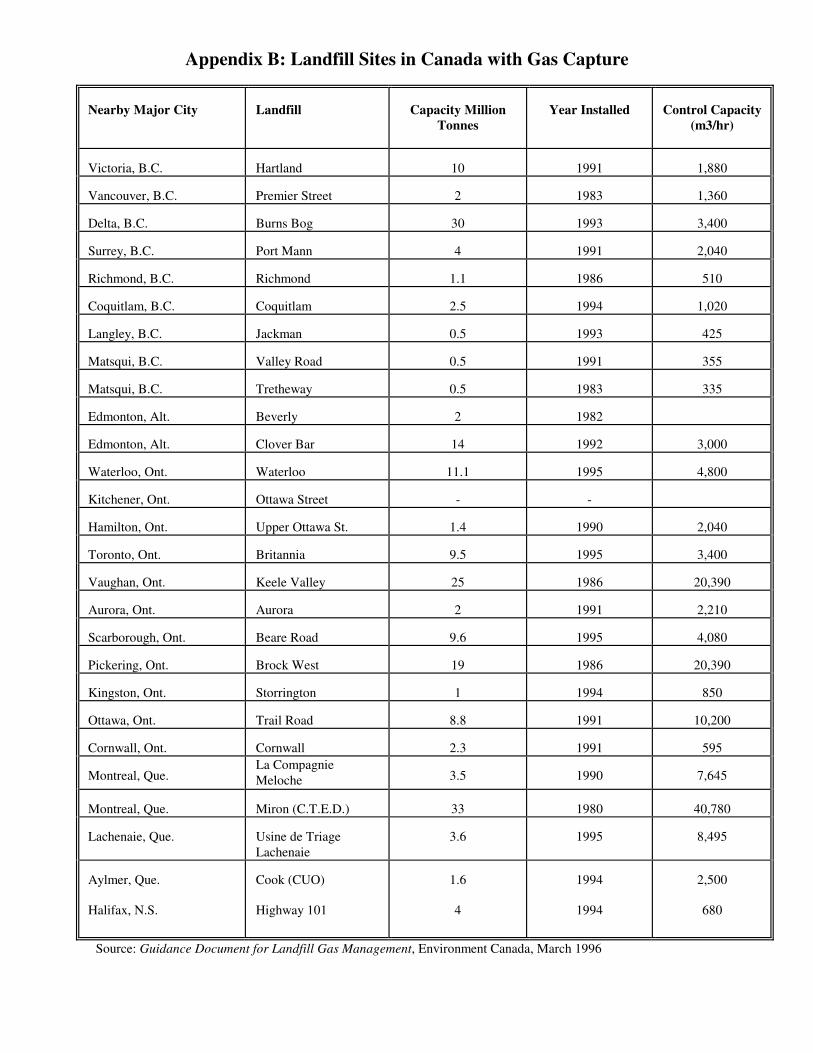
Appendix B: Landfill Sites in Canada with Gas Capture
Nearby Major City
Landfill
Capacity Million
Tonnes
Year Installed
Control Capacity
(m3/hr)
Victoria, B.C.
Hartland
10
1991
1,880
Vancouver, B.C.
Premier Street
2
1983
1,360
Delta, B.C.
Burns Bog
30
1993
3,400
Surrey, B.C.
Port Mann
4
1991
2,040
Richmond, B.C.
Richmond
1.1
1986
510
Coquitlam, B.C.
Coquitlam
2.5
1994
1,020
Langley, B.C.
Jackman
0.5
1993
425
Matsqui, B.C.
Valley Road
0.5
1991
355
Matsqui, B.C.
Tretheway
0.5
1983
335
Edmonton, Alt.
Beverly
2
1982
Edmonton, Alt.
Clover Bar
14
1992
3,000
Waterloo, Ont.
Waterloo
11.1
1995
4,800
Kitchener, Ont.
Ottawa Street
-
-
Hamilton, Ont.
Upper Ottawa St.
1.4
1990
2,040
Toronto, Ont.
Britannia
9.5
1995
3,400
Vaughan, Ont.
Keele Valley
25
1986
20,390
Aurora, Ont.
Aurora
2
1991
2,210
Scarborough, Ont.
Beare Road
9.6
1995
4,080
Pickering, Ont.
Brock West
19
1986
20,390
Kingston, Ont.
Storrington
1
1994
850
Ottawa, Ont.
Trail Road
8.8
1991
10,200
Cornwall, Ont.
Cornwall
2.3
1991
595
Montreal, Que.
La Compagnie Meloche
3.5
1990
7,645
Montreal, Que.
Miron (C.T.E.D.)
33
1980
40,780
Lachenaie, Que.
Usine de Triage Lachenaie
3.6
1995
8,495
Aylmer, Que.
Cook (CUO)
1.6
1994
2,500
Halifax, N.S.
Highway 101
4
1994
680
Source: Guidance Document for Landfill Gas Management, Environment Canada, March 1996

Appendix C: Calculations of Waste Diversion Potential
Residential Waste Stream Tables 1 and 2 below provide an estimate of the amount of materials, that are currently being disposed, that sponsor methane gas production in a landfill. By subtracting the amount of diverted materials that are anaerobically digestible (F) from the entire mass of digestible waste in the waste stream (E), the amount of waste that requires diversion to prevent all digestible waste from entering landfills is produced (H).
G = E - F
Digestible Materials = Waste that is digestible (70% of MSW) - Estimated diversion of dig.waste
Table 1: Waste diversion statistics for the City of Toronto for 1996
Category
tonnes of material/waste
A
Total waste/materials collected through residential stream (1)
322,826
B
Current Diversion rate (all types of material)
74,650
C
Waste disposed
248,176
D
Rate of Diversion (%)
23.1
E
Waste that is digestible (assuming 70% of Total waste materials (A) above)
225,978
F
Estimated diversion of digestible waste through 3Rs programs (2)
60,617
G
Digestible Materials being directed to disposal
165,361
(1) includes waste, recyclables and compost (ie. everything passed from consumer to waste manager). (2) includes just the digestible components of the waste diverted (ie. organics, paper, leaves, etc). Materials such as plastic, glass and metal removed as they do not contribute to methane production. (3) for the components of the waste stream that comprise total digestible waste, see Appendix A

Table 2: Waste diversion statistics for Metropolitan Toronto for 1996
Category
tonnes of material/waste
A
Total waste/materials collected through residential stream (1)
995,053
B
Current Diversion rate (all types of material)
223,979
C
Waste disposed
771,074
D
Rate of Diversion (%)
22.5
E
Waste that is digestible (assuming 70% of Total waste materials (A) above)
696,537 t
F
Estimated diversion of digestible waste through 3Rs programs (2)
171,816 t
G
Digestible Materials being directed to disposal
524,721 t
(1) includes waste, recyclables and compost (ie. everything passed from consumer to waste manager). (2) includes just the digestible components of the waste diverted (ie. organics, paper, leaves, etc). Materials such as plastic, glass and metal removed as they do not contribute to methane production. (3) for the components of the waste stream that comprise total digestible waste, see Appendix A
Industrial Institutional and Commercial For the City of Toronto, a value of 331,000 tonnes of ICI waste for the 1996 year was obtained from Realizing Toronto's Target for Greenhouse Gas Emission Reductions - Current Trends and Outlook.
This value reflects the amount of ICI waste generated in the City of Toronto and disposed. To obtain the digestible fraction, this value was multiplied by 0.4 (the value employed to represent the ICI digestible waste fraction, as identified in Appendix A). For Metropolitan Toronto, a value of 1,000,000 tonnes of ICI waste was estimated by calculating total waste generation for Metro (2.4 million persons x 0.83 tonnes / person) and subtracting the residential waste component. This yeilds a value of 1,000,000 tonnes of ICI waste which is in proportion with values for ICI waste from other jurisdictions. The digestible fraction of this stream is estimated to be 400,000 tonnes.
Ontario and Canada
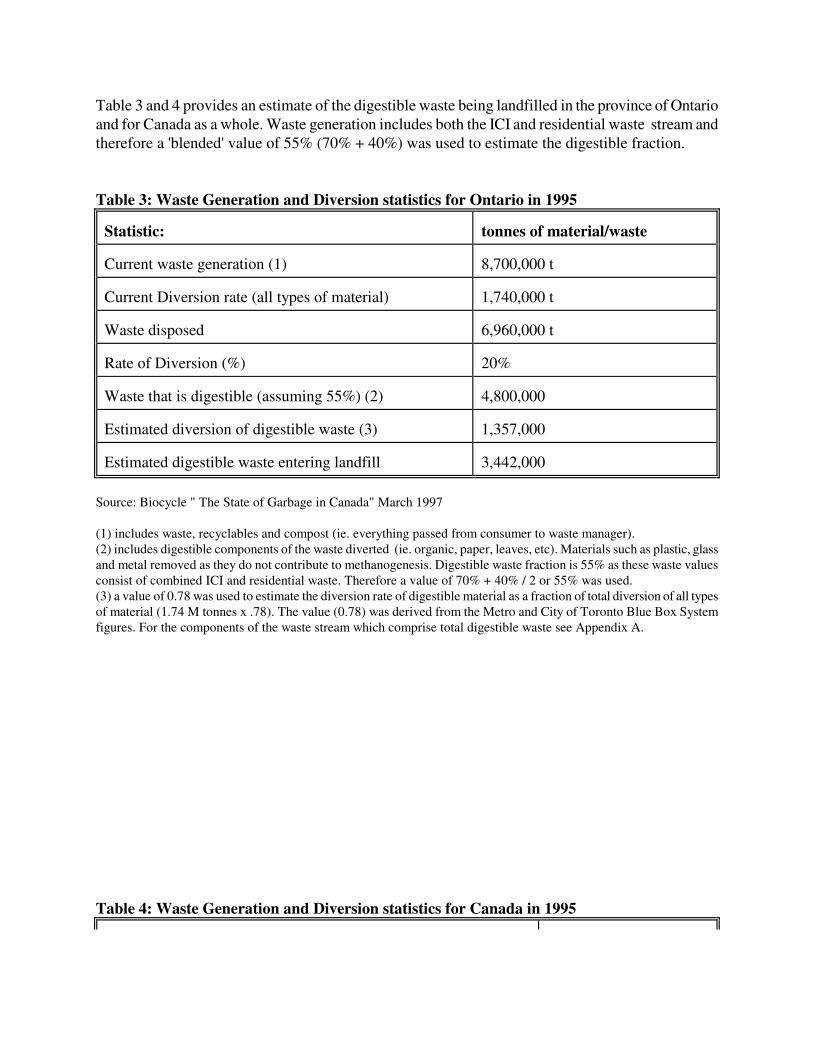
Table 3 and 4 provides an estimate of the digestible waste being landfilled in the province of Ontario and for Canada as a whole. Waste generation includes both the ICI and residential waste stream and therefore a 'blended' value of 55% (70% + 40%) was used to estimate the digestible fraction.
Table 3: Waste Generation and Diversion statistics for Ontario in 1995 Statistic:
tonnes of material/waste
Current waste generation (1)
8,700,000 t
Current Diversion rate (all types of material)
1,740,000 t
Waste disposed
6,960,000 t
Rate of Diversion (%)
20%
Waste that is digestible (assuming 55%) (2)
4,800,000
Estimated diversion of digestible waste (3)
1,357,000
Estimated digestible waste entering landfill
3,442,000
Source: Biocycle " The State of Garbage in Canada" March 1997 (1) includes waste, recyclables and compost (ie. everything passed from consumer to waste manager). (2) includes digestible components of the waste diverted (ie. organic, paper, leaves, etc). Materials such as plastic, glass and metal removed as they do not contribute to methanogenesis. Digestible waste fraction is 55% as these waste values consist of combined ICI and residential waste. Therefore a value of 70% + 40% / 2 or 55% was used. (3) a value of 0.78 was used to estimate the diversion rate of digestible material as a fraction of total diversion of all types of material (1.74 M tonnes x .78). The value (0.78) was derived from the Metro and City of Toronto Blue Box System figures. For the components of the waste stream which comprise total digestible waste see Appendix A.
Table 4: Waste Generation and Diversion statistics for Canada in 1995

Statistic: tonnes of
material/waste Current waste generation (1)
25,087,000
Current Diversion rate (all types of material) (2)
6,271,000
Waste disposed
18,815,000
Rate of Diversion (%)
25%
Waste that is digestible (assuming 55%) (3)
13,800,000
Estimated diversion of digestible waste (4)
4,891,000
Estimated digestible waste entering landfill
8,900,000
Source: Biocycle " The State of Garbage in Canada" March 1997 (1) includes waste, recyclables and compost (ie. everything passed from consumer to waste manager). (2) includes digestible components of the waste diverted (ie. organic, paper, leaves, etc). Materials such as plastic, glass and metal removed as they do not contribute to methanogenesis. Digestible waste fraction is 55% as these waste values consist of combined ICI and residential waste. Therefore a value of 70% + 40% / 2 or 55% was used. (3) a value of 0.78 was used to estimate the diversion rate of digestible material as a fraction of total diversion of all types of material (1.74 M tonnes x .78). The value (0.78) was derived from the Metro and City of Toronto Blue Box System figures. For the components of the waste stream which comprise total digestible waste see Appendix A.
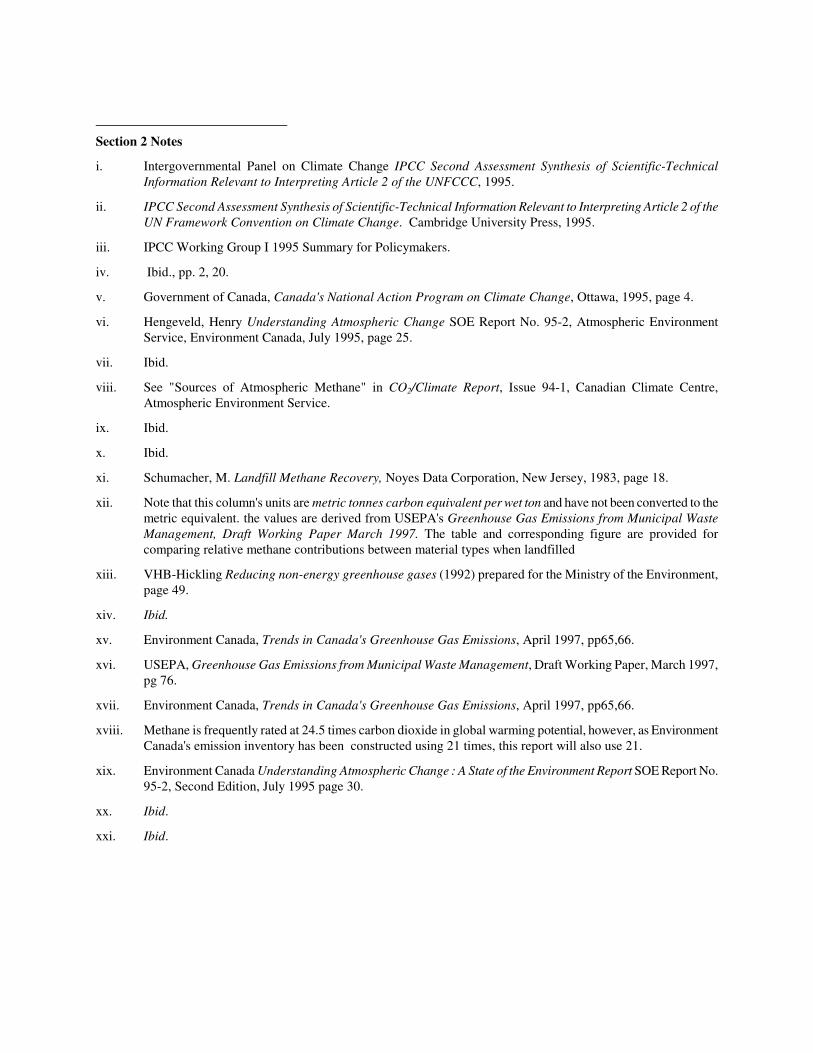
Section 2 Notes
i. Intergovernmental Panel on Climate Change IPCC Second Assessment Synthesis of Scientific-Technical
Information Relevant to Interpreting Article 2 of the UNFCCC, 1995.
ii. IPCC Second Assessment Synthesis of Scientific-Technical Information Relevant to Interpreting Article 2 of the
UN Framework Convention on Climate Change. Cambridge University Press, 1995.
iii. IPCC Working Group I 1995 Summary for Policymakers.
iv. Ibid., pp. 2, 20.
v. Government of Canada, Canada's National Action Program on Climate Change, Ottawa, 1995, page 4.
vi. Hengeveld, Henry Understanding Atmospheric Change SOE Report No. 95-2, Atmospheric Environment Service, Environment Canada, July 1995, page 25.
vii. Ibid.
viii. See "Sources of Atmospheric Methane" in CO2/Climate Report, Issue 94-1, Canadian Climate Centre, Atmospheric Environment Service.
ix. Ibid.
x. Ibid.
xi. Schumacher, M. Landfill Methane Recovery, Noyes Data Corporation, New Jersey, 1983, page 18.
xii. Note that this column's units are metric tonnes carbon equivalent per wet ton and have not been converted to the metric equivalent. the values are derived from USEPA's Greenhouse Gas Emissions from Municipal Waste
Management, Draft Working Paper March 1997. The table and corresponding figure are provided for comparing relative methane contributions between material types when landfilled
xiii. VHB-Hickling Reducing non-energy greenhouse gases (1992) prepared for the Ministry of the Environment, page 49.
xiv. Ibid.
xv. Environment Canada, Trends in Canada's Greenhouse Gas Emissions, April 1997, pp65,66.
xvi. USEPA, Greenhouse Gas Emissions from Municipal Waste Management, Draft Working Paper, March 1997, pg 76.
xvii. Environment Canada, Trends in Canada's Greenhouse Gas Emissions, April 1997, pp65,66.
xviii. Methane is frequently rated at 24.5 times carbon dioxide in global warming potential, however, as Environment Canada's emission inventory has been constructed using 21 times, this report will also use 21.
xix. Environment Canada Understanding Atmospheric Change : A State of the Environment Report SOE Report No. 95-2, Second Edition, July 1995 page 30.
xx. Ibid.
xxi. Ibid.

Section 3 Notes
1. United Nations Framework Convention On Climate Change, Article 2
2. World Meteorological Organization/United Nations Environment Programme, Scientific Assessment of Climate
Change: The Policymakers' Summary of the Report of Working Group I to the Intergovernmental Panel on
Climate Change, (1990), pp. 9-12.
3. Framework Convention On Climate Change, Article 4. CFC emissions are controlled by the Montreal Protocol.
4. Letter from the Honourable Sheila Copps to Louise Comeau, Sierra Club, Ottawa, February 10, 1994.
5. Legislative Assembly of Ontario, Third Session, 35th Parliament, Official Report of Debates (Hansard), 9 June 1994, pp. 6757, 6772
6. Municipality of Metropolitan Toronto State of the Environment Report : Metropolitan Toronto 1995, page 77.
7. Ibid., page 78.
8. City of Toronto Special Advisory Committee on the Environment The Changing Atmosphere: Strategies for
Reducing CO2 Emissions Toronto (Technical Volume) 1991 page 1.
9. Ontario Hydro, A Strategy to Manage Greenhouse Gas Emissions, page 1,2.
10. Ontario CO2 Collaborative, A CO2 Strategy for Ontario: A Discussion Paper, Canadian Institute for Environmental Law and Policy, September 1996, page 41.
11. "Targeted approach expected to get results" in Envirogram Volume 4, number 1, the newsletter of the Canadian Council of Ministers of the Environment, spring 1995.
12. Canadian Institute for Environmental Law and Policy Looking Back and Looking Ahead Municipal Solid Waste
Management in Ontario, 1992 page 4.
13. Schumacher M., Landfill Methane Recovery Noyes Data Corporation, New Jersey, 1983, Page 17.
14. United States Environmental Protection Agency Turning a Liability into an Asset: A Landfill Gas-to-Energy
Project Development Handbook EPA430-B-96-0004, September 1996, Page 1-2.
15. Ontario Ministry of Environment and Energy Towards a smog plan for Ontario : A Discussion Paper June 1996, page 2.
Section 4 Notes
1. "No deal from UN Conference" Globe and Mail, August 8, 1997, page A10.
2. Natural Resources Canada, Canada's Energy Outlook 1996-2020, April 1997, page 73-75.
3. Notes for an Address by Prime Minister Jean Chretien, June 24, 1997.
4. Ontario Ministry of Environment and Energy Meeting the Challenge of Climate Change : 1996 Update on
initiatives in Ontario to reduce greenhouse gas emissions December 12 1996, page i.
5. Rusk, James "Ontario Hydro CEO quits - Utility to close seven reactors for overhaul, promises electricity rate won't rise" Globe and Mail, August 13, 1997, page A-1.
6. Ontario Ministry of Environment and Energy Meeting the Challenge of Climate Change : 1996 Update on
initiatives in Ontario to reduce greenhouse gas emissions December 12 1996, page 25.
7. Ibid., page 26.

8. See Ontario's Environment and the "Common Sense Revolution" : A First Year Report Canadian Institute for
Environmental Law and Policy, 1996 and Ontario's Environment and the "Common Sense Revolution" : A
Second Year Report Canadian Institute for Environmental Law and Policy, 1997.
9. Ibid.
10. 3Rs Regulations (Unofficial Copy), Ontario Ministry of Energy and the Environment, June 1993.
11. Environment Canada, Guidance Document for Landfill Gas Management, Hazardous Waste Branch 2/UP/5 E March 1996, page 11-12.
12. Ibid.
13. Environmental Science and Engineering Vol. 5, No. 3, July 1992, Page 20-22 and Personal Communications with Kevin Loughborough, MetroWorks.
14. VHB-Hickling Reducing Non-Energy Greenhouse Gases page 53, 1992.
15. David, Alain Landfill Gas Management in Canada, Presentation 97-1976, June 1997.
16. Municipality of Metropolitan Toronto State of the Environment Report : Metropolitan Toronto 1995, page 77.
17. Municipality of Metropolitan Toronto State of the Environment Report : Metropolitan Toronto 1995, page 78.
18. This target has required the cooperation of Metro's constituent municipalities as, since 1967, the Municipality of Metropolitan Toronto in conjunction with the cities/boroughs of Metro, have operated a coordinated waste collection and disposal system. Under the plan collection of waste is a city/borough responsibility and disposal a Metro responsibility. The dominant form of disposal over the period of this arrangement has been landfill, although some incineration has been employed as well. Municipality of Metropolitan Toronto Waste
Management, Past and Present Factsheet 4, Vol.3 1996.
19. Since SWEAP, Metro has initiated Blue Box / Grey Box recycling, opened two material recovery facilities, opened 1 leaf and yard waste compost sites, distributed home composters and has instituted a variety of other programs and infrastructure to divert waste to 3Rs reclamation. As well, waste disposal bans have been invoked covering materials such as large appliances, drywall, corrugated cardboard, recyclable wood waste, tires, fine paper, scrap metal, clean fill, concrete, petroleum and contaminated soils. See Waste Management, Past and
Present Factsheet 4, Vol.3 1996.The Municipality of Metropolitan Toronto
20. MetroWorks, After the 3Rs, Public Consultation Notice and Workshop on May 24, 1997.
21. On December 18, 1996 Metro council made two strategic decisions concerning the disposal of Metro's residual solid waste (that material not diverted). One measure was an interim solution - the approval of a contract with Browning Ferris Industries Ltd. (BFI) for the shipment of solid waste to the Arbor Hills Landfill in Michigan, U.S.A. Under this contract, services will commence in January 1998 for a 3-5 year term with a guaranteed annual minimum tonnage of 250,000 tonnes and a maximum of 500,000 tonnes. This measure is intended to extend the life of the Keele Valley site (extended one year to 2002) and allow the time necessary for the acquisition of new disposal capacity. Additionally, Council authorized the Commissioner of Works to begin preparing Terms of Reference for an environmental assessment for the disposal of Metro's residual solid waste. See Long-term Solid Waste Disposal Planning Letter of Submission from M.G. Thorne, the Commissioner of Works to Environment and Public Space Committee, March 13, 1997. Since this authorization, Metro has stated that its goal is to achieve a minimum 50% waste diversion rate from its residential waste stream. See MetroWorks, After the 3Rs, Public Consultation Notice and Workshop on May 24, 1997.
22. The Municipality of Metropolitan Toronto Waste Management, Past and Present Factsheet 4, Vol.3 1996.
23. Personal Communications with Kevin Loughborough at Metro Works.
24. The Thackery Landfill Site in Etobicoke has been verified as worthy of a gas capture and electricity generating facility, however Ontario Hydro has not yet agreed to purchase the power from the 2MW generator that would
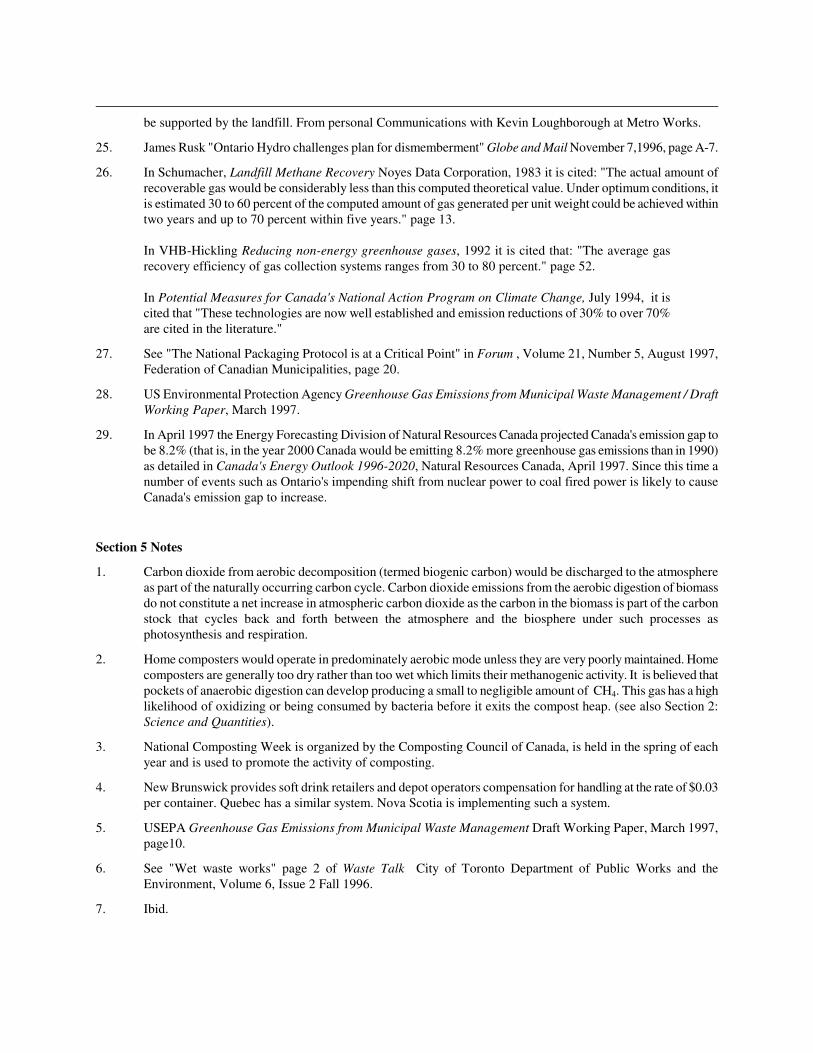
be supported by the landfill. From personal Communications with Kevin Loughborough at Metro Works.
25. James Rusk "Ontario Hydro challenges plan for dismemberment" Globe and Mail November 7,1996, page A-7.
26. In Schumacher, Landfill Methane Recovery Noyes Data Corporation, 1983 it is cited: "The actual amount of recoverable gas would be considerably less than this computed theoretical value. Under optimum conditions, it is estimated 30 to 60 percent of the computed amount of gas generated per unit weight could be achieved within two years and up to 70 percent within five years." page 13.
In VHB-Hickling Reducing non-energy greenhouse gases, 1992 it is cited that: "The average gas recovery efficiency of gas collection systems ranges from 30 to 80 percent." page 52.
In Potential Measures for Canada's National Action Program on Climate Change, July 1994, it is cited that "These technologies are now well established and emission reductions of 30% to over 70% are cited in the literature."
27. See "The National Packaging Protocol is at a Critical Point" in Forum , Volume 21, Number 5, August 1997, Federation of Canadian Municipalities, page 20.
28. US Environmental Protection Agency Greenhouse Gas Emissions from Municipal Waste Management / Draft
Working Paper, March 1997.
29. In April 1997 the Energy Forecasting Division of Natural Resources Canada projected Canada's emission gap to be 8.2% (that is, in the year 2000 Canada would be emitting 8.2% more greenhouse gas emissions than in 1990) as detailed in Canada's Energy Outlook 1996-2020, Natural Resources Canada, April 1997. Since this time a number of events such as Ontario's impending shift from nuclear power to coal fired power is likely to cause Canada's emission gap to increase.
Section 5 Notes
1. Carbon dioxide from aerobic decomposition (termed biogenic carbon) would be discharged to the atmosphere as part of the naturally occurring carbon cycle. Carbon dioxide emissions from the aerobic digestion of biomass do not constitute a net increase in atmospheric carbon dioxide as the carbon in the biomass is part of the carbon stock that cycles back and forth between the atmosphere and the biosphere under such processes as photosynthesis and respiration.
2. Home composters would operate in predominately aerobic mode unless they are very poorly maintained. Home composters are generally too dry rather than too wet which limits their methanogenic activity. It is believed that pockets of anaerobic digestion can develop producing a small to negligible amount of CH4. This gas has a high likelihood of oxidizing or being consumed by bacteria before it exits the compost heap. (see also Section 2: Science and Quantities).
3. National Composting Week is organized by the Composting Council of Canada, is held in the spring of each year and is used to promote the activity of composting.
4. New Brunswick provides soft drink retailers and depot operators compensation for handling at the rate of $0.03 per container. Quebec has a similar system. Nova Scotia is implementing such a system.
5. USEPA Greenhouse Gas Emissions from Municipal Waste Management Draft Working Paper, March 1997, page10.
6. See "Wet waste works" page 2 of Waste Talk City of Toronto Department of Public Works and the Environment, Volume 6, Issue 2 Fall 1996.
7. Ibid.

8. Ibid.
9. If this large scale project reaches it final scaleable size of 100, 000 tonnes per annum, then the new City of Toronto will boosts its diverison rate from approxiamtely 23% to approximatley 35%.
10. The Guelph wet-dry recycling centre can manage up to 44,000 tonnes of compostables and 91,000 tonnes of recyclable per year. It employs 40-50 people, cost $24.4 million to build, has a projected annual operating cost of $4.9 million and projected annual revenues of $5.9 million. Source: City of Guelph City of Guelph Wet/Dry
Recycling Centre Facts (Factsheet).
11. City of Guelph EnviroWorks (Newsletter) Winter 1997.
12. City of Guelph City of Guelph's Wet-Dry Program April 1991.
13. Ibid.
14. Recycling Council of Ontario "Wet-Dry: The Next Step in Recycling?" RCO Update Vol. 16, No.8, September 27, 1996.
15. Ibid.
16. Ibid.
17. Ibid., pg 47
18. Tafdrup, S., "Centralized Biogas Plants Combine Agricultural and Environmental Benefits with Energy Production" Water Science and Technology Volume 30, No.12 pp 133-141.
19. Fouhy, K., "Europe Warms to Biogas" Chemical Engineering, pp 45-49, May 1993.
20. Ibid, pg. 47.
21. Heating to 60 degrees Celsius for 30 minutes (pasteurization) destroys endotoxins and kills most bacterial cells. This has proved an effective means of protection against botulism in canned foods, brucellosis and tuberculosis transmitted in milk and dysentery caused by drinking water contaminated with human sewage. Arms K., Camp P. Biology Second Edition, Saunders College Publishing, New York, 1982, Page 339.
22. Bedixen, J. "Safeguards Against Pathogens in Danish Biogas Plants" Water Science and Technology Volume 30, No. 12 , pp 171-180.
23. The terms "organic waste" and "digestible waste" are used in this report to refer to two specific fractions of the waste stream. Organic waste is food and yard waste, is best managed through composting and accounts for approximately 30% of the residential waste stream. Digestible refers to the fraction of waste that would decompose in a landfill if it is landfilled. Up to 70% of residential waste would decompose in a landfill when paper , cardboard and other products are included as waste.
24. Under controlled conditions, methane yields as a component of the total biogas volume can range between 50-70%. Landfill biogas rarely exceeds 50% methane by volume. Cheremisinoff, et al. Biomass: Applications,
Technology and Production, Marcel Dekker Inc., New York, 1980, page 131.
25. The time required to produce compost varies in each municipal compost program according to methods used and conditions. Metro Toronto has identified 21 days at the Wright Environmental Composter; the City of Guelph requires nine weeks in a two stage process; programs in the Northwest Territories require up to two seasons because of the temperature regime.
26. Wichert, B. "Biogas, Compost and Fuel Cells" Biocycle Vol. 35, Iss. 8, August 1994, pp. 34-36.
27. Wichert, B., "Biogas, Compost and Fuel Cells" BioCycle Vol. 35, Iss. 8, August 1994, p.36.
28. See generally Responsive Environmental Protection : A Consultation Paper from the Ministry of Environment

and Energy 1996 and Comments Regarding Responsive Environmental Protection : A Consultation Paper, Canadian Institute for Environmental Law and Policy 1996.
29. US EPA, Greenhouse Gas Emissions from Municipal Waste Management (Draft Working Paper) March 1997, page 8-10; Exhibit ES-4.
30. MoEE Regulation Review: Regulation 347 - General Waste Management, Existing Hospital Incinerators, Sections 1 and 29.
31. Cohen et. al., Quantitative Estimation of the Entry of Dioxins, Furans and Hexachlorobenzene into the Great
Lakes Great Lakes.
32. USEPA, Greenhouse Gas Emissions from Municipal Waste Management (Draft Working Paper) March 1997.
33. Young J.E., "The Sudden New Strength of Recycling" World Watch Vol 8, No.4, July/August 1995.
34. Ibid.
35. Recycling Council of Ontario "Forecasters Optimistic on Fibre Future" RCO Update Vol.17, No.5 June 1997.
36. Recycling Council of Ontario "Forecasters Optimistic on Fibre Future" RCO Update Vol.17, No.5 June 1997.
Section 6 Notes
1. Engman, Kathleen "Flare gas suggested for generating electricity" The Calgary Herald, page B3, Sept 27, 1997. Based on a report released by the Alberta Research Council.
2. A landfill of 2.5 million tonnes is appropriate for a city of approximately 100,000 people.
3. Environment Canada Trends in Canada's Greenhouse Gas Emissions 1990-1995, April 1997, Page xiii.
4. Conversation with Tom Kerr from the USEPA's Landfill Methane Outreach Program.
5. USEPA, Greenhouse Gas Emissions from Municipal Waste Management Draft Working Paper EPA530-R-97-010, March 1997, Page 100.
6. Conversation with Greg Allen, Allen Associates.
7. Nova Scotia Department of the Environment Solid Waste - Resource Management Strategy October 1995.
Section 7 Notes
1. Conversation with Alain David, National Office of Pollution Prevention, Environment Canada.
2. USEPA, Greenhouse Gas Emissions from Municipal Waste Management, Draft Working Paper, March 1997, page 100.
3. The contribution that landfill methane can make to reducing Canada's emission gap will vary according to a number of factors. For example, if Canada's emission gap is greater than 8.2 %, then methane's contribution, on a percentage will be lower. However, if the captured methane is used to displace fossil fuel use, then its contribution will be significantly greater than the estimate of 19 %.