presentation - global methane emissions and impacts on climate
TRANSCRIPT

Global methane emissions and impacts on climate, air quality, and
vegetation
2015 International Emission Inventory Conference04/15/2015
Daven Henze, Kateryna Lapina, Jana MilfordUniversity of Colorado Boulder

CH4 cycles in the atmosphere
Main loss from reaction with OH in the atmosphere- 9.8 ± 1.6 yrs (Voulgarakis et al., 2013), 11.2±1.3 year (Prather et al., 2012)
- Lifetime extended by increased CH4 (e.g., Holmes et al., 2013)
- Products include O3
- NOx reductions will decrease O3 but also decrease OH, thereby increasing CH4

CH4 emissions sources
Sources 2000-2009
Tg CH4 yr-1 Top-down Bottom-up
Ag. & waste 209 [180-241]
200 [187-224]
Wetlands 175 [142-208]
217 [177-284]
Anthro. Fossil fuels
96 [77–123]
96 [85 – 105]
Other natural
43 [37 – 65]
130 [61-200]
Biomass burn.
30 [24–45]
35 [32– 39]
Total Sources
548[526–569]
678 [542-852]
Total Sinks 540[514–560]
632[592-785]
(Kirschke et al., 2013)
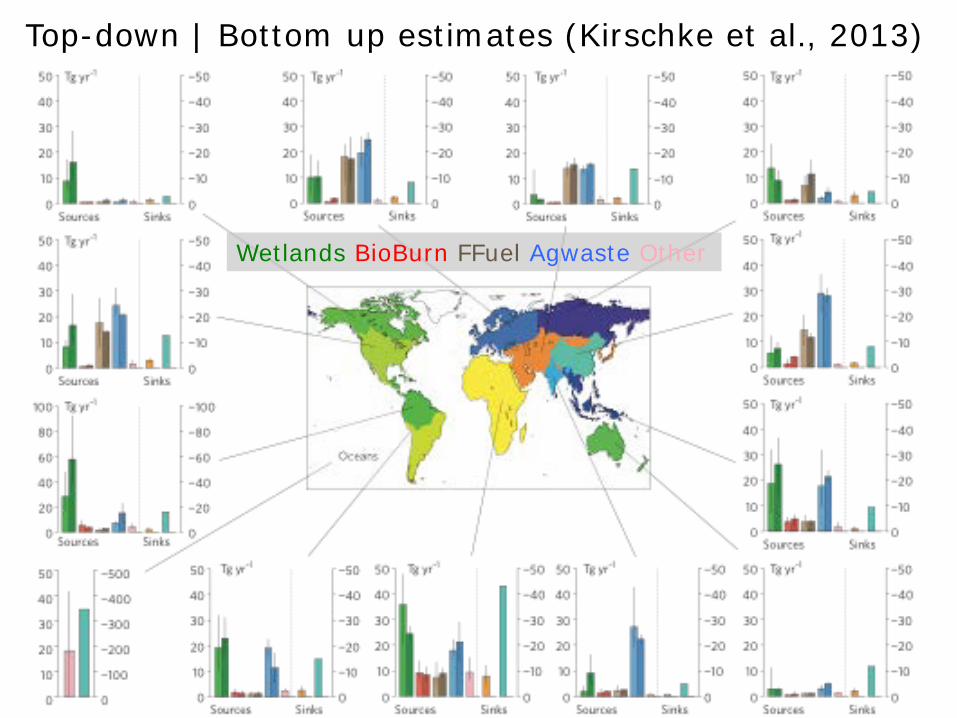
Top-down | Bottom up estimates (Kirschke et al., 2013)
Wetlands BioBurn FFuel Agwaste Other

CH4 emissions sources
Sources 2000-2009
Tg CH4 yr-1 Top-down Bottom-up
Ag. & waste 209 [180-241]
200 [187-224]
Wetlands 175 [142-208]
217 [177-284]
Anthro. Fossil fuels
96 [77–123]
96 [85 – 105]
Other natural
43 [37 – 65]
130 [61-200]
Biomass burn.
30 [24–45]
35 [32– 39]
Total Sources
548[526–569]
678 [542-852]
Total Sinks 540[514–560]
632[592-785]
(Kirschke et al., 2013)

Observed CH4 concentration trends
Nisbet et al., 2014
Kirschke et al., 2013:
- Increasing wetland and fossil fuel emissions?
- decrease / stabilization of fossil fuel and stable / increasing microbial activity?
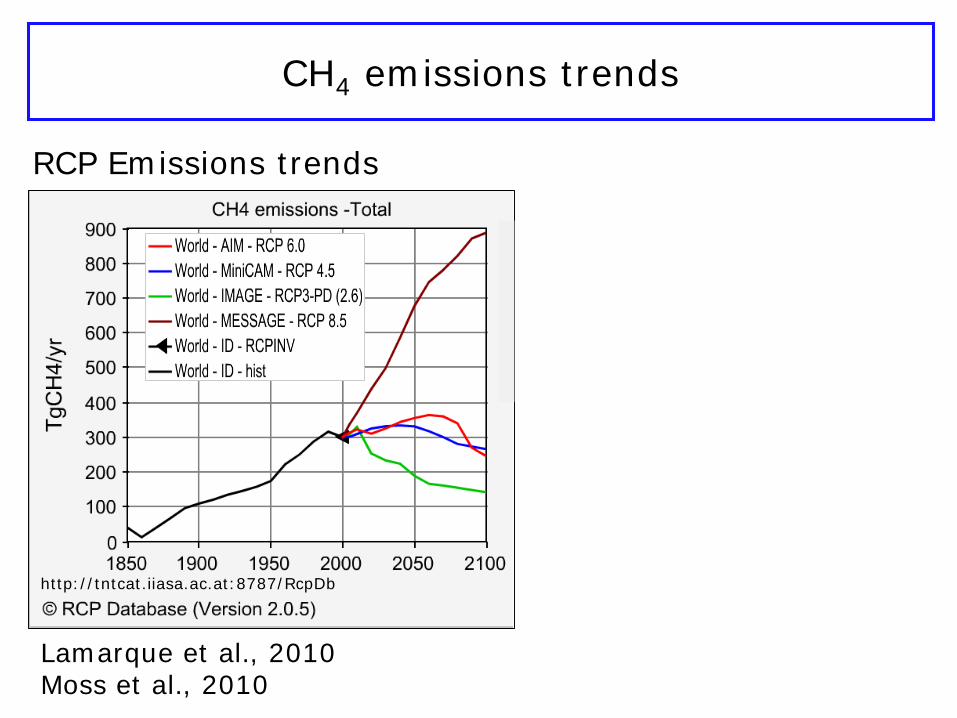
CH4 emissions trends
Lamarque et al., 2010Moss et al., 2010
http://tntcat.iiasa.ac.at:8787/RcpDb
RCP Emissions trends

Modeled CH4 concentration trends
Multi-model (ACCMIP) estimates of global CH4 burden following historical and future RCPs (Young et al., 2013)
~1750 ppb
~800 ppb

Impacts of changes in CH4 concentrations
Climate (radiative forcings from Myhre et al., 2013) - direct RF (0.48 ±0.05 W/m2)- via CH4 (0.14 W/m2)- via O3 (0.2 W/m2)- via other smaller effects
(strat H2O, CO2, …)
Air Quality- via O3- and aerosols?
Ecosystems- via O3
Young et al., 2013

O3 response to uniform –20% ∆[CH4] reduction (Fiore et al., 2008).
When and where does O3 change owing to ∆[CH4]?
3D spatial distribution of O3 response to ∆[CH4] is not uniform(e.g., Fiore et al., 2008; Morgenstern et al., 2013; Fang et al., 2013)
3D spatial distribution important because not all O3 is radiativelyequivalent
Aug 2006, land, daytime
Observed by TES (Worden et al., 2008; 2011)

CH4 and long-term O3 Radiative Forcing: response to CH4 emissions
RF of -20% ∆[CH4] from HTAP (Fry et al., 2012). note: includes long-term impacts of CH4 on O3.
CH4
O3

CH4 and long-term O3 Radiative Forcing: response to CH4 emissions
RF of -20% ∆[CH4] from HTAP (Fry et al., 2012). compare to -20 NOx, NMVOC or CO
Methane buffers the climate benefits of NOx reductionsand amplifies that of NMVOCs, CO.

West et al., 2005
When and where does O3 change owing to ∆[CH4]?
Response of North American daily mean afternoon (1300-1700 local time) summertime surface O3 (Fiore et al., 2002)
BASE-50% CH4 emissions-50% NOx emissions-50% both
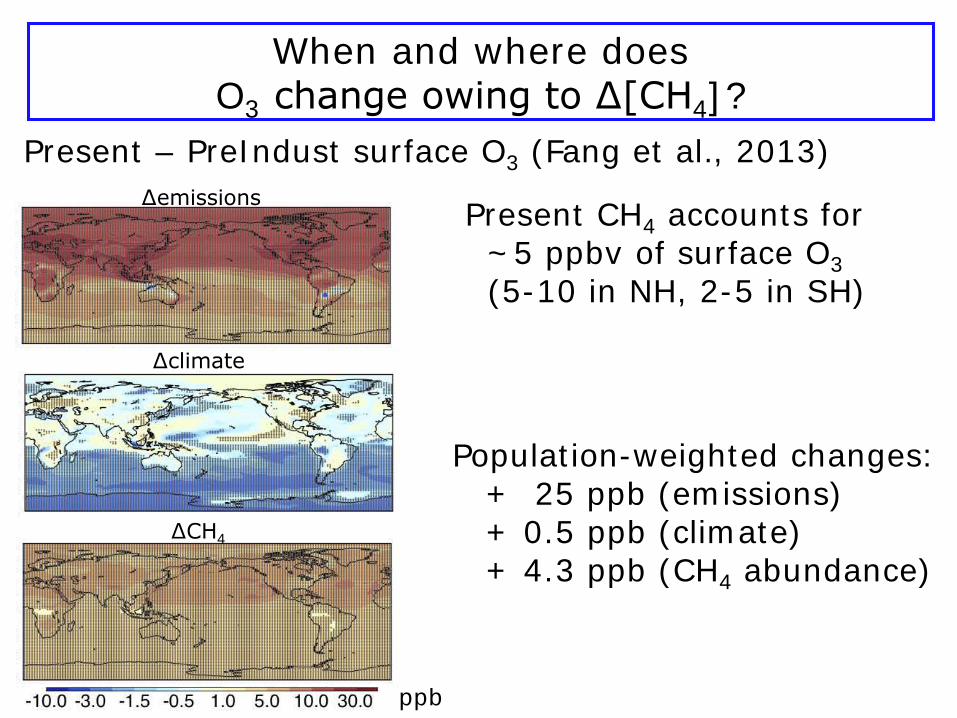
Present CH4 accounts for ~5 ppbv of surface O3(5-10 in NH, 2-5 in SH)
Present – PreIndust surface O3 (Fang et al., 2013)
Population-weighted changes:+ 25 ppb (emissions) + 0.5 ppb (climate) + 4.3 ppb (CH4 abundance)
When and where does O3 change owing to ∆[CH4]?
∆emissions
∆climate
∆CH4
ppb

Health impacts from preindustrial to present ∆[CH4]
- About 50,000 increase in annual respiratory deaths.
- Combined impacts of ∆climate and ∆[CH4] lead to 20% increase in respiratory mortality from O3 in some regions (e.g., Australia)
Deaths / 1000 km2 (Fang et al., 2013):Cardiopulmonary Lung cancer Respiratory

Health impacts from preindustrial to present ∆[CH4]
Deaths / 1000 km2 (Fang et al., 2013):Cardiopulmonary Lung cancer Respiratory
- About 50,000 increase in annual respiratory deaths.
- Regionally significant cardio health impacts of ∆[CH4] via aerosols? Large compared to health impacts via respiratory, but small (<5%) of increase in cardiopulmonary deaths owing to ∆emissions of aerosols and aerosol precursors

Air quality, health, and climate impacts of CH4emissions controls in the next several decades
- 20% CH4 reductions lead to 1 ppb reduction and reduce cardiopulmonary deaths by 17,000 (West et al., 2006; Anenberg et al., 2010).
- CH4 mitigation measures could reduce surface O3 by 3-4 ppb and respiratory deaths by 70,000 (Anenberget al., 2012).
- Cost of CH4 reduction measures are cost effective with air quality and climate benefits (e.g., West et al., 2012; UNEP 2011), although benefits of SLCP-only measures perhaps overestimated (e.g., Smith and Mizrahi, 2013).

Climate and health impacts of Short Lived Climate Pollutants (SLCPs)
SLCPs = CH4, BC, OC, CO, VOCs, NOx, SO2, NH3, (HFCs)
Ramanathan and Xu, PNAS, 2010; Hu et al., Nature CC, 2013Ramanathan and Carmichael, Nature Geo, 2008
UNEP 2011; Shindell et al., Science, 2012Also: Avery et al., 2013

Impacts of global CH4 emissions on vegetative O3 exposure in Western US following RCPs
Lapina et al., in revision for GRL
RCP 2.6 RCP 8.5
W12
6 [p
pm-h
rs]
Fore
ign
/ U
S
RCP 2.6: Global CH4 emissions reductions shifts attainment forward by a decade.
RCP 8.5: Global CH4 emissions increases more than counteract domestic efforts.

Considerations for CH4 abatement strategies (adapted / updated from West et al., 2012)
NOx and NMVOCs CH4
Abatement cost? high (least cost options exhausted)
low
O3 reductions? large several ppbTime scale? hours / weeks decadeSpatial scale? local/regional global (more in NOx
saturated regions)Impact on peak O3? strong not preferentially
Climate impacts? Small (from NOx) large (w/O3)Health impacts of 10% reduction?
22,000 (via PM2.5)+ similar amount via O3
17,000 deaths per year from O3
Co-benefits? reduce PM2.5,reactive nitrogen deposition, toxics
energy security, NMVOC reductions, crop and vegetation

Questions?
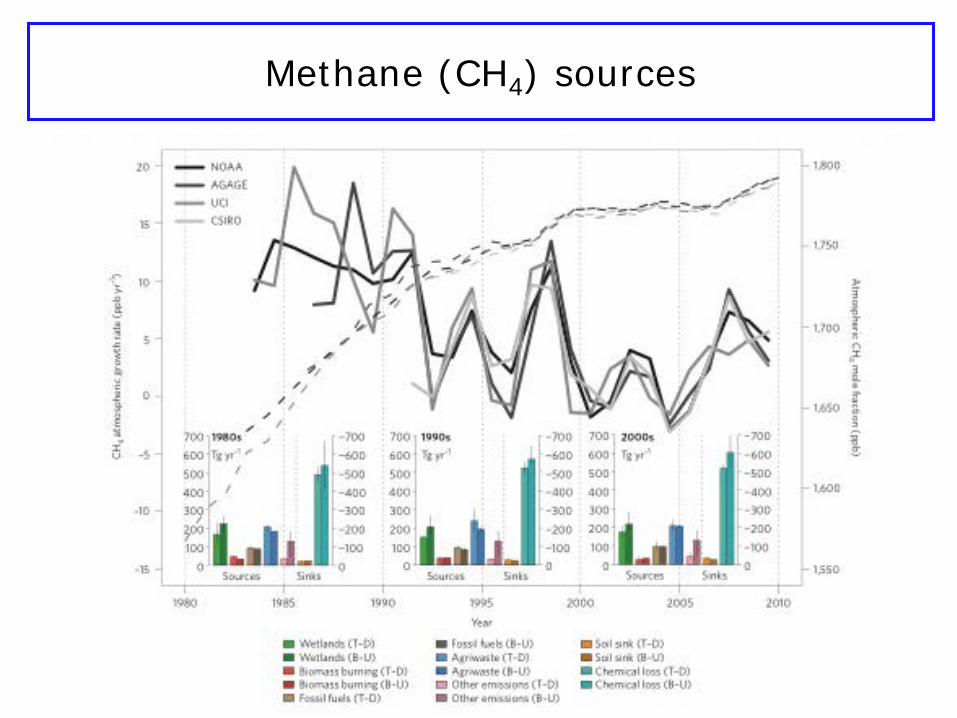
Methane (CH4) sources
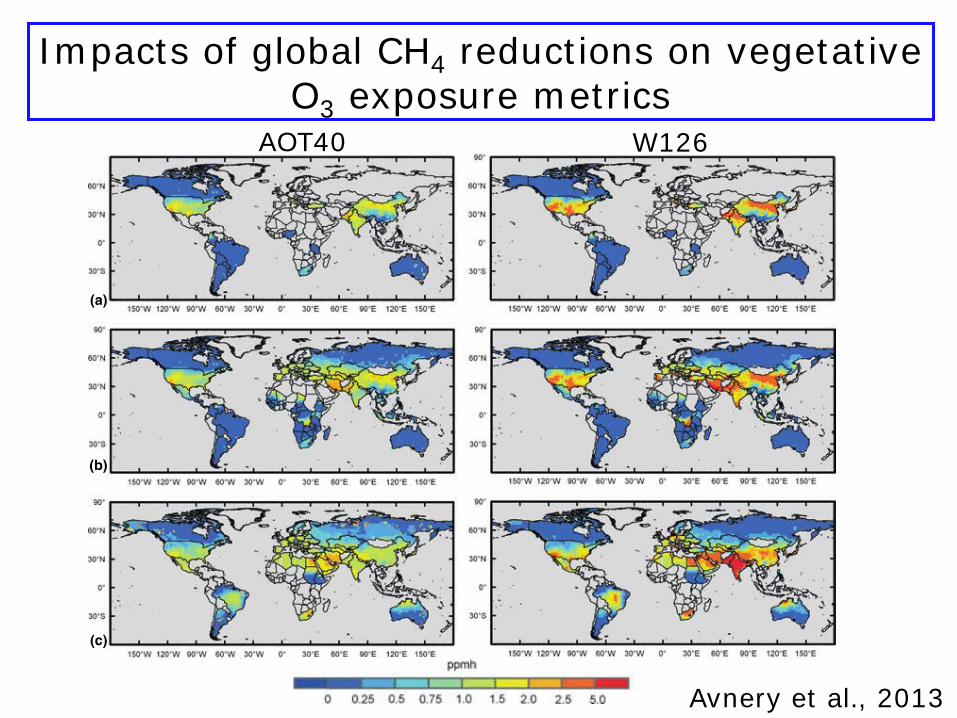
Impacts of global CH4 reductions on vegetative O3 exposure metrics
Avnery et al., 2013
AOT40 W126
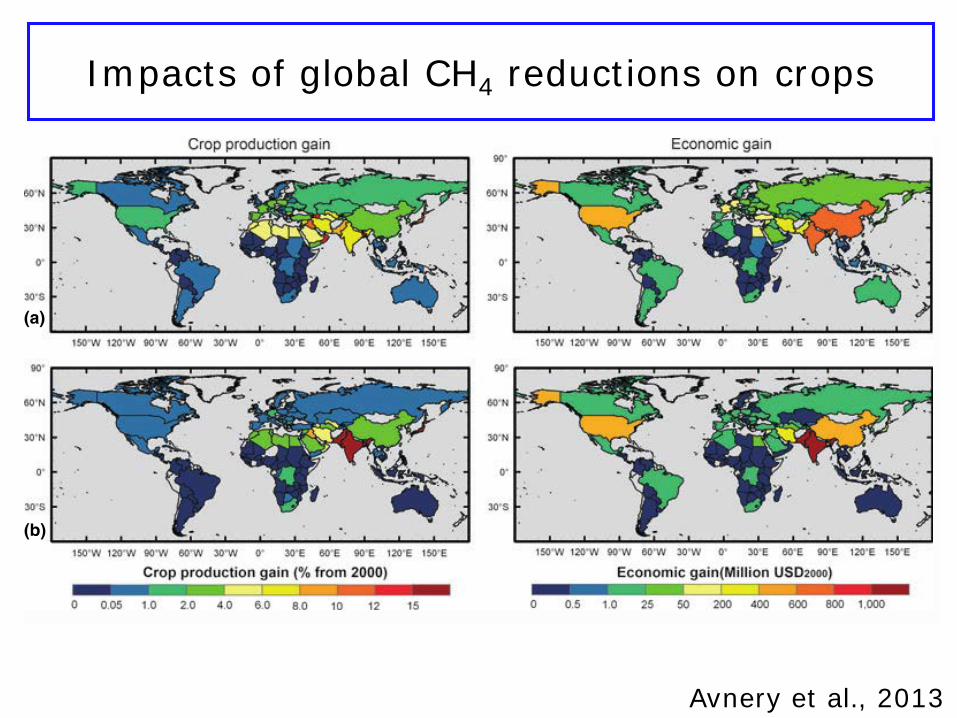
Impacts of global CH4 reductions on crops
Avnery et al., 2013

Change in surface-level daytime O3 (M12) in June [ppb]
Kees Cuvelier, Michael Seltzer
When and where does O3 change owing to ∆[CH4]?
HTAP multi-model mean change from ∆[CH4] of -20%Mean [-0.4 to -2.2] std dev [0.1 to 0.8]