metap climate change adaptation in the water sector in the mena
TRANSCRIPT
1
Climate Change Adaptation in the Water Sector
in the Middle East and North Africa:
A Review of Main Issues1
There is a tide in the affairs of men,
Which, taken at the flood, leads on to fortune;
Omitted, all the voyage of their life
Is bound in shallows and in miseries,
On such a full sea are we now afloat,
And we must take the current when it serves,
Or lose our ventures.
William Shakespeare
Background
Fresh water is a vital, finite2 and vulnerable resource. In many countries of the Middle East and
North Africa (MENA) region3, fresh water stress and shortages are becoming a serious threat to
economic growth, social cohesion and political stability. Fresh water, which is being used in an
uncontrolled and unsustainable fashion, is unfortunately not planned on the basis of its present
1 Technical Note prepared by METAP under the EC-funded SMAP III project “Promoting awareness and
enabling a policy framework for environment and development integration in the Mediterranean with a
focus on Integrated coastal Zone Management”. This note was prepared by Mr. Gael Gregoire. The views
expressed in this report and the results of the analyses are the sole responsibility of the Author, and could
not be attributed in any way, shape or form to the Ministry of Environment of Lebanon, the World Bank
Group, the Government of Finland or the European Commission.
.
Although the technical note draws on the World Bank MENA Making Most of Scarcity and draft
Regional Business Strategy to Address Climate Change as well as on the IPCC 4, the views expressed in
it could not be attributed in any way, shape or form to the World Bank Group.
2 Only when desalination is not considered.
3 The World Bank Middle East and North Africa region consists of Algeria, Bahrain, Djibouti, Egypt, Iran,
Iraq, Israel, Jordan, Kuwait, Lebanon, Libya, Malta, Morocco, Oman, Qatar, Saudi Arabia, Syria, Tunisia,
the United Arab Emirates, West Bank and Gaza, and Yemen. Only underlined countries are client members
and some of the remaining Arab countries seek fee-based technical assistance from the World Bank on an
ad hoc basis. In this note, Israel and Malta are not included in the analysis.

and future availability but rather is based on sectoral and geographical competing consumption
needs. This will increasingly penalize certain economic activities and services, which will in turn
disproportionately affect the poor. Moreover, despite important strides in curbing demographic
growth in the MENA region, the growth rate remains relatively high (2 percent on average per
year during this decade against 2.2 over the 1990-99 decade) in this fresh water-stricken region,
which is translated by a growing urban densification (Map 1) that will put more pressure on water
resources in the future.
Global warming is unequivocal and the change in greenhouse gas (GHG) emissions is due to
human activities according to the latest Intergovernmental Panel on Climate Change (IPCC) 4th
assessment report (Box 1 and Annex I). Also, it is believed that climate change effect will have
profound climatic, environmental and societal impacts worldwide over the 21st century. More
specifically, the MENA region seems to be highly vulnerable to the disruptive climate change
effects due: not only to increasing water stress; but also to the concentration of population and
economic activity in flood-prone urban-rural coastal areas; the significant dependence on climate-
sensitive agriculture; to tropical-like weathers and the increase of natural disaster events with
their associated toll in terms of diseases, injuries, premature death and losses, as well as disease
pattern alteration; and resource scarcity areas that could possibly trigger local and national strife
as well as regional conflicts.
In order to tackle this future challenge, immediate and imperative actions are required as IPCC
scientists still consider the climate change phenomena in its inertia stage but could grow out of
control if not seriously addressed. With 385 parts per million (ppm) by volume in the Earth's
atmosphere in 2007, the world has already shot past a 350 ppm safe eventual atmospheric
concentration of carbon dioxide (CO2) 20 years ago (Annex I).
Box 1: What is Climate Change?
Climate change is any long-term significant change in the average temperature of the Earth's near-surface
air and oceans that a given region experiences. The Intergovernmental Panel on Climate Change (IPCC), an
international and multidisciplinary body set up to notably monitor and model changes in weather,
concluded that "most of the observed increase in globally averaged temperatures since the mid-20th century
is very likely due to the observed increase in greenhouse gas concentrations" via the greenhouse effect.
Climate model projections summarized by the IPCC indicate that average global surface temperature will
likely rise a further 0.6° to 4° Celsius with a likely range between 0.3° and 6.4° Celsius during the 21st
century. The range of values results from the use of differing scenarios of future greenhouse gas emissions as
well as models with differing climate sensitivity (Annex I). Increases in the amount of precipitation are very
likely in high-latitudes, while decreases are likely in most subtropical land regions. Although most studies focus
on the period up to 2100, warming and sea level rise (likely range between 0.18 and 0.59 meter by 2100) are
expected to continue for more than a thousand years even if greenhouse gas levels are stabilized. The delay
in reaching equilibrium is a result of the large heat capacity of the oceans. Catastrophic and unpredicted
events such as ice shelf collapse in the Arctic, Antarctic and/or Greenland could however push the sea level
rise to shoot past likely ranges.
Increasing global temperature will cause sea level to rise, and is expected to increase the intensity of
extreme weather events and to change the amount and pattern of precipitation. Other effects of global
warming include changes in agricultural yields, trade routes, glacier retreat, species extinctions (between 20
to 70 percent depending on the temperature increase), increase in the burden of disease and injury (re-
emergence of certain diseases, increase in water-related, cardio-respiratory and vector-borne diseases.
Remaining scientific uncertainties include the amount of warming expected in the future, and how warming
and related changes will vary from region to region around the globe.
Except for few countries including the United States of America, 175 countries have signed and ratified by
the end of 2007 the 1997 Kyoto protocol aimed at reducing greenhouse gas emissions. Only developed
countries, or Annex I countries, are bound by emission reductions. Efforts to hammering out a successor to

the Kyoto protocol by 2012 are underway with a milestone meeting in Copenhagen in 2009. But there is
ongoing political and public debate worldwide regarding what and how much action should be taken to
reduce or reverse future warming and to adapt to its expected consequences.
Source: adapted from the Intergovernmental Panel on Climate Change 1st to 4
th Assessment Reports and
Kyoto protocol.
Climate change should therefore be mainstreamed in development planning and rule-bound
governance at all scales, levels and sectors in the MENA region, especially with regards to water
resources and GHG emissions. In addition, better water management –in conjunction with other
sectors such as energy, agriculture, industry, tourism, transport, housing and waste– and
adaptation strategies need to be formulated and implemented to reduce the MENA vulnerability
to climate change over the near-long term.
Water Availability, Use and Services in the MENA Region
Water Availability
MENA countries belong to the most water stressed region in the world (Figure 1) with currently
per capita renewable water resources at 1,100 m3 per year, which is far below the water security
threshold of 1,700 m3 (Box 2). The quantity of water available varies considerably among
countries: between 8 m3 per year per capita for Kuwait to 3,077 m
3 for Iraq. More specifically,
countries could be categorized according to three distinct water groups: arid, which requires an
internal distribution management of renewable water resources; hyper arid, which faces very low
levels of renewable resources; and transboundary, which is highly dependent on external
renewable water resources --two thirds of the region annual renewable surface water come from
outside the region. All hyper-arid countries are in a state of water absolute scarcity (Figure 1 and
Map 1) whereas countries belonging to the arid and transboundary groups range from a state of
water security (Iraq and Iran) to a state of water absolute scarcity (Algeria and Tunisia).
Figure 1: Renewable Water Resources by Region and MENA countries, per year per capita
Note: All 2002 FAO-AQUASTAT figures are matched with 2004 population figures throughout the analysis.
Source: FAO-AQUASTAT (2002) compiled in World Bank (2007a).
Box 2: Water Availability Threshold
Water security: ≥ 1,700 m3 per capita per year of renewable water. This threshold is based on estimates
of water requirements in the household, agricultural, industrial, and energy sectors as well
as the needs of the environment. This figure could however fluctuate depending on
geographic, ecologic and socio-economic factors.
Water stress: ≥ 1,000 and < 1,700 m3 per capita per year of renewable water.
Water scarcity: ≥ 500 and < 1,000 m3 per capita per year of renewable water.
Water absolute scarcity: < 500 m3 per capita per year of renewable water.
Source: adapted from World Bank (2007a).

Without discounting the effects of a growing densification of the population along coastal zones
(Figure 3, quadrant 2) on water resources, the MENA region is moreover prone to low
precipitation, high evapotranspiration, and climate-related natural disasters (Figure 2).
Indeed, most MENA countries belong to a critical combination of low rainfall and high spatial
and temporal rainfall variability (internal renewable fresh water) with Lebanon being better off
among the group in term of precipitation and Qatar being worst off in terms of both precipitation
and rainfall variability (Figure 2, quadrant 1). The aridity of the region especially in the
hinterland coupled with the resulting need for increased storage (84 percent of dam
capacity/surface renewable water resources against an average 10 percent worldwide)
dramatically increases evapotranspiration (Map 1). Although extremely underreported, the
frequency of reported natural disasters in terms of droughts, floods and extreme weather has more
than doubled between the 1988-97 period (50 events reported) and the 1998-07 period (116
events reported). Droughts have been associated with more intense rain events resulting in
flooding, erosion, and excessive runoff. Moreover, the severity of the disasters is affecting a
greater number of people mainly in rural areas averaging 225,000 per year over the 1988-07
period. Although it is difficult to observe a clear trend for these events, their occurrence and
intensity are however clearly on the rise (Figure 2, quadrant 2). Unfortunately, direct and indirect
costs of disasters are rarely reported or valued.
Figure 2: Rain Precipitation and Variability, and Natural Disasters, by MENA Region and Countries
People Affected by Floods, Droughts and Extreme Weather
MENA Region 1988-07 (000')
0
10
1,000
19
88
19
89
19
90
19
91
19
92
19
93
19
94
19
95
19
96
19
97
19
98
19
99
20
00
20
01
20
02
20
03
20
04
20
05
20
06
20
07
20
08
Year
Peo
ple
Aff
ecte
d
(log s
cale
)
Flood
Drought
Extreme Weather
Note: In the first quadrant, the x axis depicts the normalized average precipitation and the y axis depicts
the normalized variability index. In the second quadrant, a 1999 drought in Iran affected 37 million
people: it is plotted on the graph without being weighted by the affected population. Natural episodes with
unreported number of people affected are not plotted. Floods usually occur after a period of droughts.
Source: FAO-AQUASTAT (2002) compiled in World Bank (2007a); and Author based on the OFDA/CRED
International Disaster Database.
Map 1: Aridity Zoning and Population Density in the MENA Region

Source: FAO-AQUASTAT (2002) compiled in World Bank (2007a).
Water Use
The MENA region is using more of its renewable water resources than other regions in the world
as more than three quarters of the renewable water resources are withdrawn every year (Figure 3).
Most countries are supplementing their renewable water deficit with virtual water (net import
substitution of water quantity equivalent to growing food and livestock in the country), the
installation of desalination plants (production prices has recently dropped dramatically and range
between US$ 0.5 and more than US$ 1 per liter) and the dangerous tapping into non-renewable
groundwater especially within the hyper-arid group.
Figure 3: Renewable Water Resources Withdrawn and Use Share, by Region and Countries
Source: FAO-AQUASTAT (2002) compiled in World Bank (2007a).
The MENA region has the highest share of total water withdrawal to total renewable water
resources in the world with large variations from 2,200 percent for Kuwait to 31.3 percent for
Lebanon4 with an equilibrium threshold set at 100 percent. The group exceeding the 100 percent
threshold --the Arabian Peninsula, Jordan, and Egypt-- shows a growing and sometimes exclusive
reliance on desalination, non-renewable ground water and net virtual water import (Figure 4).
As for the allocation of water resources among the economic sectors, the MENA region
underscores a significant water-intensive input to average agricultural output ratio: the agriculture
sector uses nearly 85 percent of total water resources, generates only 8 percent of the GDP on
average in 2005 and employs about 29 percent of labor mostly in rural areas. Moreover, the
agricultural value-added GDP per km3 of water used in agriculture varies widely among
4 According to the 2004 World Bank Water Resource Sector Note on Djibouti, the percentage is much
higher than the 6.3 percent recorded by the FAO-AQUASTAT and is closer to 100 percent.
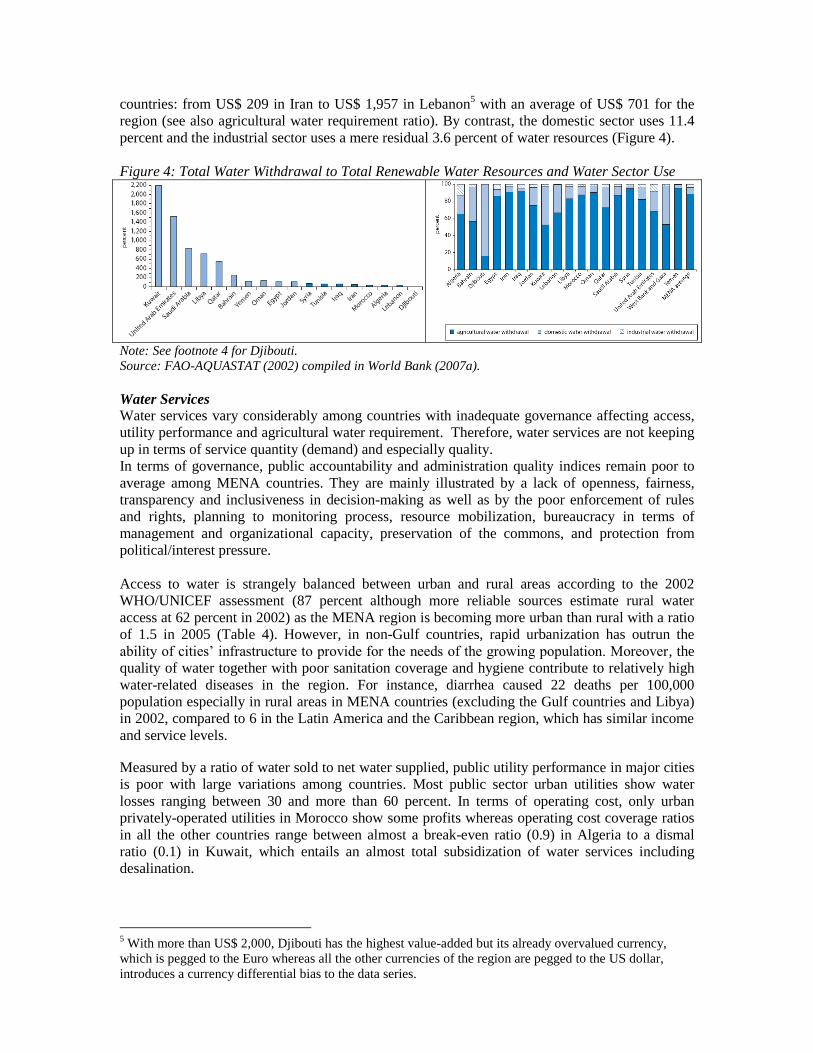
countries: from US$ 209 in Iran to US$ 1,957 in Lebanon5 with an average of US$ 701 for the
region (see also agricultural water requirement ratio). By contrast, the domestic sector uses 11.4
percent and the industrial sector uses a mere residual 3.6 percent of water resources (Figure 4).
Figure 4: Total Water Withdrawal to Total Renewable Water Resources and Water Sector Use
Note: See footnote 4 for Djibouti.
Source: FAO-AQUASTAT (2002) compiled in World Bank (2007a).
Water Services
Water services vary considerably among countries with inadequate governance affecting access,
utility performance and agricultural water requirement. Therefore, water services are not keeping
up in terms of service quantity (demand) and especially quality.
In terms of governance, public accountability and administration quality indices remain poor to
average among MENA countries. They are mainly illustrated by a lack of openness, fairness,
transparency and inclusiveness in decision-making as well as by the poor enforcement of rules
and rights, planning to monitoring process, resource mobilization, bureaucracy in terms of
management and organizational capacity, preservation of the commons, and protection from
political/interest pressure.
Access to water is strangely balanced between urban and rural areas according to the 2002
WHO/UNICEF assessment (87 percent although more reliable sources estimate rural water
access at 62 percent in 2002) as the MENA region is becoming more urban than rural with a ratio
of 1.5 in 2005 (Table 4). However, in non-Gulf countries, rapid urbanization has outrun the
ability of cities‟ infrastructure to provide for the needs of the growing population. Moreover, the
quality of water together with poor sanitation coverage and hygiene contribute to relatively high
water-related diseases in the region. For instance, diarrhea caused 22 deaths per 100,000
population especially in rural areas in MENA countries (excluding the Gulf countries and Libya)
in 2002, compared to 6 in the Latin America and the Caribbean region, which has similar income
and service levels.
Measured by a ratio of water sold to net water supplied, public utility performance in major cities
is poor with large variations among countries. Most public sector urban utilities show water
losses ranging between 30 and more than 60 percent. In terms of operating cost, only urban
privately-operated utilities in Morocco show some profits whereas operating cost coverage ratios
in all the other countries range between almost a break-even ratio (0.9) in Algeria to a dismal
ratio (0.1) in Kuwait, which entails an almost total subsidization of water services including
desalination.
5 With more than US$ 2,000, Djibouti has the highest value-added but its already overvalued currency,
which is pegged to the Euro whereas all the other currencies of the region are pegged to the US dollar,
introduces a currency differential bias to the data series.
The agricultural water requirement ratio measures the efficiency of water use in agriculture based
on the existing cropping pattern, evapotranspiration, and climatic conditions. Its closeness to one
hence implies higher efficiency of irrigation, which is far from being reached among MENA
countries: a minimum of 0.3 in Iran and a maximum of 0.5 in Tunisia. The agriculture sector has
unfortunately little incentive or has rather disincentives (subsidies or cross-subsidies especially on
energy) for water conservation and efficiency.
Climate Change Effects in the MENA Region
The disruptive effects of climate change will be multidimensional and will represent an important
additional stress to the already vulnerable MENA region given the limited water resource
endowment and the increase in demand for natural resources exacerbated by growing carbon-
intensive economies and urban population growth over the next decades. These effects could be
self-reinforcing and have far reaching consequences on the progress of MENA societies as they
will impact to various extents their public and private sectors‟ human, social, capital, natural and
cultural assets.
The global effects of climate change with temperature increase declinations are illustrated in
Figure 5. Various temperature increase scenarios relative to 1980-1999 will affect waters,
ecosystems, food, coasts and health to various levels resulting in profound societal and
environmental impacts worldwide. However, this MENA region analysis will be confined to
water and health issues and possible linkages associated with climate change effects.
Figure 5: Effects of Global Average Annual Temperature Change until 2100, °C

Source: IPCC 4 (2007).
Temperature, Precipitation and Sea Level Projections
A number of global climate models used under IPCC 3 and IPCC 4 as well as a hypothetical
catastrophic impact model are considered to project temperatures, rainfall and/or sea level rise
associated with only 3 Special Report on Emissions Scenarios in (SRES) the MENA region that
were selectively used: the A1B (assumes a world with a globalized economy, high economic
growth, low population growth, and a mix between high fossil fuel and energy efficient
technologies), A1FI (highest future emission trajectory) and the B1 (lowest future emission
trajectory) scenarios are used to predict a range of results (Figure A1 in Annex I). These results
should however be considered with the utmost caution especially those which required dropping
several models in the analysis to obtain more robust figures. All the results were seen to be
critically dependent on future GHG emissions and the response of the Earth‟s atmosphere to such
increases. Surprisingly, some geographical overlapping occurs in the regional IPCC 4 reports,
which obviously results in different predictions on the fringes: West Asia extends to the Eastern
Mediterranean, Europe includes the Mediterranean basin, and both regions predict different
results for overlapping areas.
Nevertheless, the MENA region will most likely face higher temperatures over the coming
decades as a result of increased GHG emissions. However, forecasting precipitation changes was
more problematic with some models under IPCC 3 and all models under IPCC 4 predicting an
increase of precipitation in the Middle East sub-region. The sea level will likely rise over the next
decades and could reach up to 5 meters should a catastrophic ice sheet event occurs over the 21st
century. All results show moderate to wide variations across sub-regions, seasons, baselines, and
emission scenarios. New simulation models are therefore warranted to produce more robust
regional, sub-regional and even country-specific predictions to derive harmonized best estimates.
The IPCC 3 models (17 global climate models) predicted that:
In North Africa sub-region, an increase of the global mean surface air temperature by 2.2°
Celsius (14 models) and a decrease of precipitation by 9 percent (7 models) will occur by
2050 as compared to the 1990 baseline under A1B emission scenario.
In the Middle East sub-region, an increase of the global mean surface air temperature by
2.4° Celsius (4 models), an increase of precipitation by 4 percent when using 14 models
but a decrease of precipitation by 12 percent when using 4 models will occur by 2050 as
compared to 1990 under A1B emission scenario.
In the MENA region, a sea level rise between 0.30 and 0.47 meter will occur by 2050 as
compared to the 1990 baseline (≤ 17 models) under A1FI and B2 emission scenarios res-
pectively. The coast may however be subsiding or rising, which could modulate the
increase in sea level rise caused by climate change. Surprisingly, the 0.39 meter MENA
region mid-point of sea level rise in 2050 coincides with the 2100 IPCC 4 global midpoint.
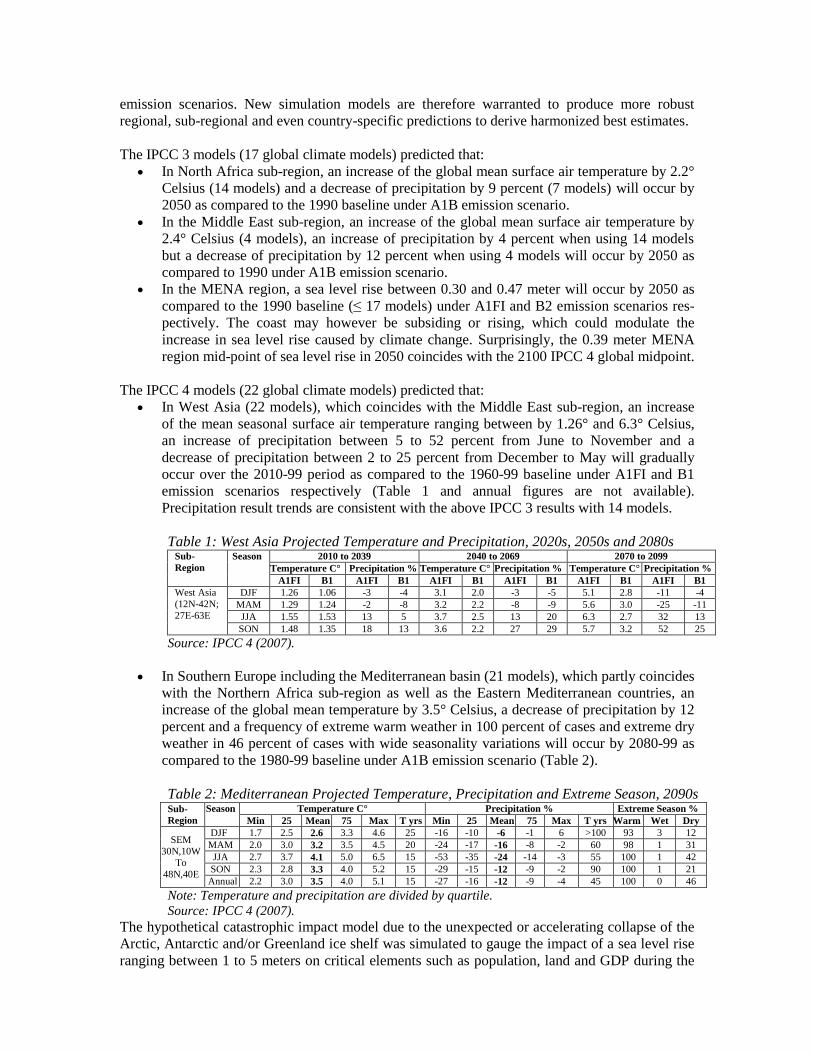
The IPCC 4 models (22 global climate models) predicted that:
In West Asia (22 models), which coincides with the Middle East sub-region, an increase
of the mean seasonal surface air temperature ranging between by 1.26° and 6.3° Celsius,
an increase of precipitation between 5 to 52 percent from June to November and a
decrease of precipitation between 2 to 25 percent from December to May will gradually
occur over the 2010-99 period as compared to the 1960-99 baseline under A1FI and B1
emission scenarios respectively (Table 1 and annual figures are not available).
Precipitation result trends are consistent with the above IPCC 3 results with 14 models.
Table 1: West Asia Projected Temperature and Precipitation, 2020s, 2050s and 2080s Sub-
Region
Season 2010 to 2039 2040 to 2069 2070 to 2099
Temperature C° Precipitation % Temperature C° Precipitation % Temperature C° Precipitation %
A1FI B1 A1FI B1 A1FI B1 A1FI B1 A1FI B1 A1FI B1
West Asia
(12N-42N;
27E-63E
DJF 1.26 1.06 -3 -4 3.1 2.0 -3 -5 5.1 2.8 -11 -4
MAM 1.29 1.24 -2 -8 3.2 2.2 -8 -9 5.6 3.0 -25 -11
JJA 1.55 1.53 13 5 3.7 2.5 13 20 6.3 2.7 32 13
SON 1.48 1.35 18 13 3.6 2.2 27 29 5.7 3.2 52 25
Source: IPCC 4 (2007).
In Southern Europe including the Mediterranean basin (21 models), which partly coincides
with the Northern Africa sub-region as well as the Eastern Mediterranean countries, an
increase of the global mean temperature by 3.5° Celsius, a decrease of precipitation by 12
percent and a frequency of extreme warm weather in 100 percent of cases and extreme dry
weather in 46 percent of cases with wide seasonality variations will occur by 2080-99 as
compared to the 1980-99 baseline under A1B emission scenario (Table 2).
Table 2: Mediterranean Projected Temperature, Precipitation and Extreme Season, 2090s Sub-
Region
Season Temperature C° Precipitation % Extreme Season %
Min 25 Mean 75 Max T yrs Min 25 Mean 75 Max T yrs Warm Wet Dry
SEM
30N,10W
To
48N,40E
DJF 1.7 2.5 2.6 3.3 4.6 25 -16 -10 -6 -1 6 >100 93 3 12
MAM 2.0 3.0 3.2 3.5 4.5 20 -24 -17 -16 -8 -2 60 98 1 31
JJA 2.7 3.7 4.1 5.0 6.5 15 -53 -35 -24 -14 -3 55 100 1 42
SON 2.3 2.8 3.3 4.0 5.2 15 -29 -15 -12 -9 -2 90 100 1 21
Annual 2.2 3.0 3.5 4.0 5.1 15 -27 -16 -12 -9 -4 45 100 0 46
Note: Temperature and precipitation are divided by quartile.
Source: IPCC 4 (2007).
The hypothetical catastrophic impact model due to the unexpected or accelerating collapse of the
Arctic, Antarctic and/or Greenland ice shelf was simulated to gauge the impact of a sea level rise
ranging between 1 to 5 meters on critical elements such as population, land and GDP during the
21st century in 84 countries including 12 MENA countries out of 19.
6 Incidentally, some scientists
already predict one meter sea level rise by the end of the 21st century or more than twice as much
as the 6 SERS IPCC 4 midpoint predictions: 0.39 meter and likely range between 0.18 and 0.59
meter by 2100. The hypothetical catastrophic impact model predicted a range of minimum and
maximum results for a 1 to 5 meter sea level rise:
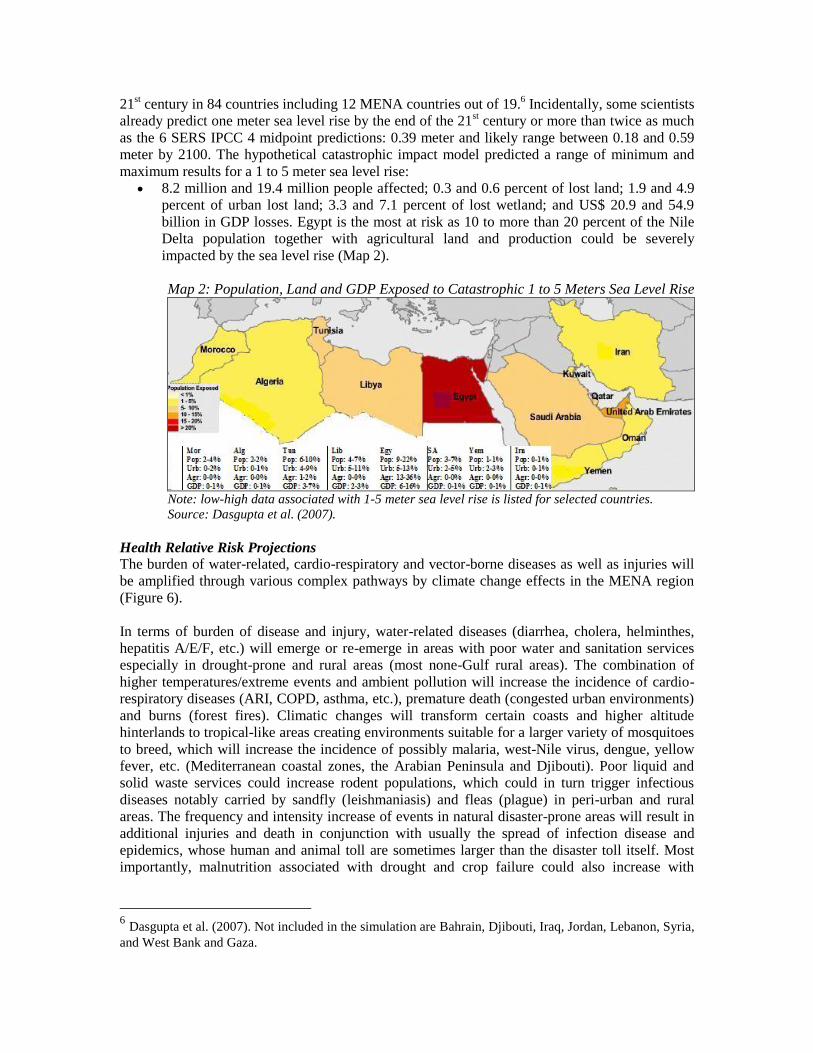
8.2 million and 19.4 million people affected; 0.3 and 0.6 percent of lost land; 1.9 and 4.9
percent of urban lost land; 3.3 and 7.1 percent of lost wetland; and US$ 20.9 and 54.9
billion in GDP losses. Egypt is the most at risk as 10 to more than 20 percent of the Nile
Delta population together with agricultural land and production could be severely
impacted by the sea level rise (Map 2).
Map 2: Population, Land and GDP Exposed to Catastrophic 1 to 5 Meters Sea Level Rise
Note: low-high data associated with 1-5 meter sea level rise is listed for selected countries.
Source: Dasgupta et al. (2007).
Health Relative Risk Projections The burden of water-related, cardio-respiratory and vector-borne diseases as well as injuries will
be amplified through various complex pathways by climate change effects in the MENA region
(Figure 6).
In terms of burden of disease and injury, water-related diseases (diarrhea, cholera, helminthes,
hepatitis A/E/F, etc.) will emerge or re-emerge in areas with poor water and sanitation services
especially in drought-prone and rural areas (most none-Gulf rural areas). The combination of
higher temperatures/extreme events and ambient pollution will increase the incidence of cardio-
respiratory diseases (ARI, COPD, asthma, etc.), premature death (congested urban environments)
and burns (forest fires). Climatic changes will transform certain coasts and higher altitude
hinterlands to tropical-like areas creating environments suitable for a larger variety of mosquitoes
to breed, which will increase the incidence of possibly malaria, west-Nile virus, dengue, yellow
fever, etc. (Mediterranean coastal zones, the Arabian Peninsula and Djibouti). Poor liquid and
solid waste services could increase rodent populations, which could in turn trigger infectious
diseases notably carried by sandfly (leishmaniasis) and fleas (plague) in peri-urban and rural
areas. The frequency and intensity increase of events in natural disaster-prone areas will result in
additional injuries and death in conjunction with usually the spread of infection disease and
epidemics, whose human and animal toll are sometimes larger than the disaster toll itself. Most
importantly, malnutrition associated with drought and crop failure could also increase with
6 Dasgupta et al. (2007). Not included in the simulation are Bahrain, Djibouti, Iraq, Jordan, Lebanon, Syria,
and West Bank and Gaza.

notably compounding effects on the children under five years old health outcome suffering from
water-related, respiratory and/or vector-borne diseases. Furthermore, the prevalence of UV-
related diseases such as skin cancer will increase. Droughts or sea level rise will force migration
and could not only trigger water-related, vector-borne and respiratory diseases but also possibly
HIV/AIDS, tuberculoses, hepatitis C, SARS, etc. As a result, the health curative services could be
strained by the marginal increase of the burden of disease and injury during the next decades.
Figure 6: Pathways through which Climate Change May Affect Health
Source: Patz et al. (2000).
As projected by WHO by using only one model, all major central (mid-point) criteria disease,
condition and injury relative risks will increase until 2030 as compared to 2000 under the old
1995 business as usual or unmitigated emission scenario (IPCC IS92a scenario closer to A1FI –
Annex I). Malaria and most notably natural disaster-led injuries will outpace all other criteria
health outcomes especially in non-Gulf countries (Table 3). These results, which allow giving an
order of magnitude of the relative risk projections, need however to be used with caution and
warrant an update based on models considered under IPCC 4 scenarios.
Table 3: Climate Change-induced MENA Criteria Disease and Condition Relative Risk Projections Disease/Condition 2000 2010 2020 2030
Cardiovascular 1.001 1.002 1.003 1.003
Diarrhea 1.025 1.045 1.040 1.045
Malaria 1.030 1.065 1.095 1.150
Malnutrition 1.010 1.025 1.035 1.040
Injury 1.470 1.950 2.130 3.460
Source: WHO (2005).
Climate Change and Water Availability, Use and Services
Water in the MENA region cannot be viewed in isolation: rapid population growth, urbanization,
economic growth, land-use change, and irrigation water are already placing huge pressures on
water resources and threatening its quality. The incremental effects of climate change scenarios
are expected to exacerbate current pressures on water resources due to higher spatial and temporal
rain variability, lower precipitation, lower runoff, higher evapotranspiration rates, and increased
natural events. As a result, renewable surface and ground fresh water will be reduced with a direct
effect on the allocation of water among sectors and the environment, disruption of water
management and services, and potentially giving rise to tensions over water allocation especially
among riparian transboundary group countries.

Water availability
Given the demographic trend in the MENA region, the population will almost double (+93
percent) between 2000 and 2050 (Table 4). If we factor in the climate change effects (Table 5) in
terms of very conservative runoff reduction (20 percent) coupled with higher rain variability,
higher evapotranspiration rates and more drought events, the projected per capita renewable water
resources for the MENA region will drop from 1,100 m3 per capita per year in 2004 to below the
500 m3 water absolute scarcity mark by 2050. It is projected that all the other MENA countries
will be in a state of water absolute scarcity except for: Iraq that drops to a water stress state; and
Iran, Lebanon and Syria that drop to a water scarcity state.
Table 4: MENA Population Prospects
Population (million) 1995 2000 2005 2025 2050
Total 278.9 308.9 341.6 477.5 594.7
Urban 157.0 179.6 204.5 317.4 454.1
Rural 121.9 129.3 137.1 160.1 140.6
Source: United Nations (2007).
Table 5: MENA 2050 Renewable Fresh Water with and without Climate Change Effects, m3 pc
2050 MENA RFW: M3 Per Capita
-
500
1,000
1,500
2,000
2,500
3,000
Iran
Leba
non
Mor
occo
Tunisia
Alger
ia
Djib
outi
Om
an
WB &
Gaz
a
Yem
en
Jord
an
Bah
rain
Liby
a
Sau
di A
rabia
Qat
ar
UAE
Kuw
aitIra
q
Syr
ia
Egy
pt
Arid Hyper-Arid Transboundary
M3 p
er
ca
pit
a
2050 RW PC
2050 MENA RFW with -20% CC Effects: M3 Per Capita
-
500
1,000
1,500
2,000
2,500
3,000
Iran
Leba
non
Mor
occo
Tunisia
Alger
ia
Djib
outi
Om
an
WB &
Gaz
a
Yem
en
Jord
an
Bah
rain
Liby
a
Sau
di A
rabia
Qat
ar
UAE
Kuw
aitIra
q
Syr
ia
Egy
pt
Arid Hyper-Arid Transboundary
M3 p
er
ca
pit
a
2050 RW PC
Note: Total renewable fresh water is the sum of: Total internal renewable water resources, which is the
long-term average annual flow of rivers and recharge of aquifers generated from endogenous
precipitation. Double counting of surface water and groundwater resources is avoided by deducting the
overlap from the sum of the surface water and groundwater resources; and External renewable water
resources, which is the sum of the total natural external surface water resources and the external
groundwater resources.
Extrapolation based on a conservative -20% reduction among all the countries due to a combination of
lower precipitation and lower runoff with a margin of error of ±12.5%.
Source: World Bank (2007a); and United Nations (2007).
Higher temperatures (between 2.2° and 2.4° Celsius), lower precipitation (between -9 to -12
percent) will increase the spatial and temporal precipitation variability and change runoff patterns
(predicted losses range between -20 and -30 percent and possibly more by 2090-00 as compared
to 1990-00 by 12 models under A1B scenario –Map 3), which will dramatically reduce the flow
of rivers upon which the arid group of MENA countries depends.
As for the transboundary group, the flow of rivers such as the Nile, the Euphrates and the Tigris,
which provide two thirds of the region annual renewable surface water in 2004, will be reduced
by a higher margin due to both, a reduction of supply due to climate change factors and the
demand increase of riparian countries. This will in turn increase regional tensions especially
among Nile riparian countries should actual or future river basin management systems fail to help
arbitrate water allocation among riparian countries.
With regards to the hyper-arid countries, some precipitation relief could fortunately recharge
some of the aquifer in the Arabian Peninsula whereas North African countries will be subject to
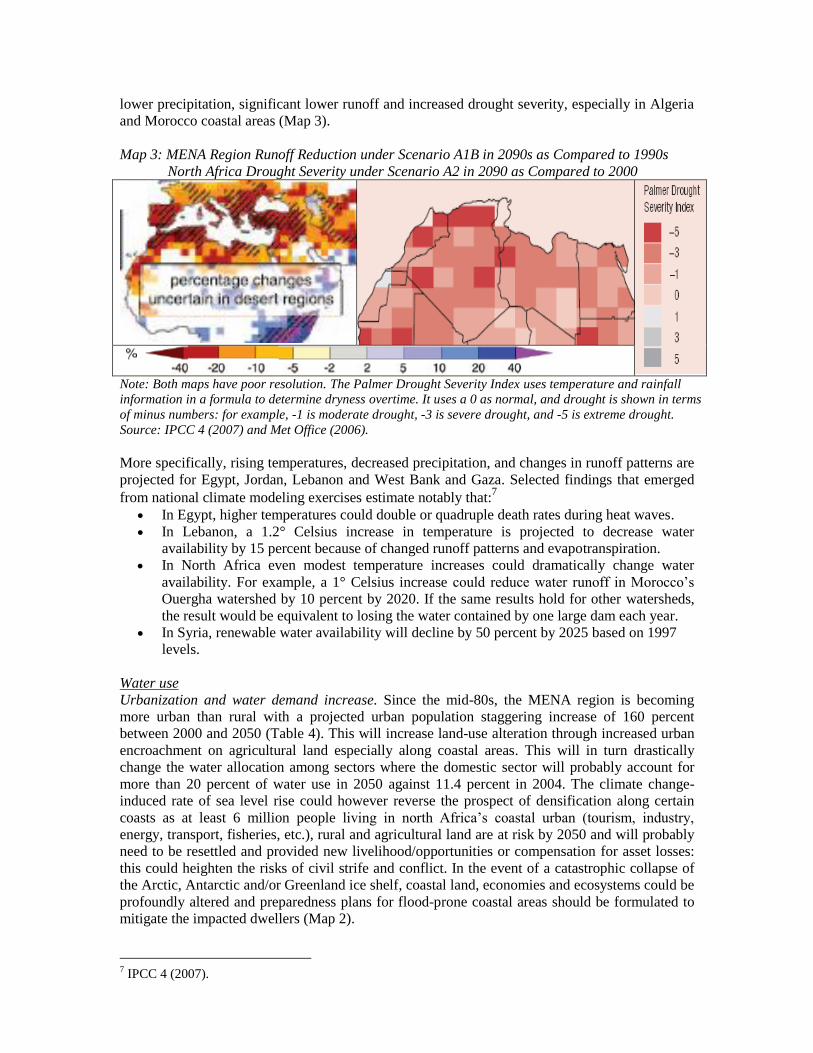
lower precipitation, significant lower runoff and increased drought severity, especially in Algeria
and Morocco coastal areas (Map 3).
Map 3: MENA Region Runoff Reduction under Scenario A1B in 2090s as Compared to 1990s
North Africa Drought Severity under Scenario A2 in 2090 as Compared to 2000
Note: Both maps have poor resolution. The Palmer Drought Severity Index uses temperature and rainfall
information in a formula to determine dryness overtime. It uses a 0 as normal, and drought is shown in terms
of minus numbers: for example, -1 is moderate drought, -3 is severe drought, and -5 is extreme drought.
Source: IPCC 4 (2007) and Met Office (2006).
More specifically, rising temperatures, decreased precipitation, and changes in runoff patterns are
projected for Egypt, Jordan, Lebanon and West Bank and Gaza. Selected findings that emerged
from national climate modeling exercises estimate notably that:7
In Egypt, higher temperatures could double or quadruple death rates during heat waves.
In Lebanon, a 1.2° Celsius increase in temperature is projected to decrease water
availability by 15 percent because of changed runoff patterns and evapotranspiration.
In North Africa even modest temperature increases could dramatically change water
availability. For example, a 1° Celsius increase could reduce water runoff in Morocco‟s
Ouergha watershed by 10 percent by 2020. If the same results hold for other watersheds,
the result would be equivalent to losing the water contained by one large dam each year.
In Syria, renewable water availability will decline by 50 percent by 2025 based on 1997
levels.
Water use
Urbanization and water demand increase. Since the mid-80s, the MENA region is becoming
more urban than rural with a projected urban population staggering increase of 160 percent
between 2000 and 2050 (Table 4). This will increase land-use alteration through increased urban
encroachment on agricultural land especially along coastal areas. This will in turn drastically
change the water allocation among sectors where the domestic sector will probably account for
more than 20 percent of water use in 2050 against 11.4 percent in 2004. The climate change-
induced rate of sea level rise could however reverse the prospect of densification along certain
coasts as at least 6 million people living in north Africa‟s coastal urban (tourism, industry,
energy, transport, fisheries, etc.), rural and agricultural land are at risk by 2050 and will probably
need to be resettled and provided new livelihood/opportunities or compensation for asset losses:
this could heighten the risks of civil strife and conflict. In the event of a catastrophic collapse of
the Arctic, Antarctic and/or Greenland ice shelf, coastal land, economies and ecosystems could be
profoundly altered and preparedness plans for flood-prone coastal areas should be formulated to
mitigate the impacted dwellers (Map 2).
7 IPCC 4 (2007).

Economic growth and water demand. An oil-induced economic growth is occurring in the MENA
region since 2000 with however uneven distributional effects among countries and areas. The
energy, service (tourism) and to a lesser extent the industrial sectors are all contributing to the
economic growth and to various extent, will boost water demand in absolute and relative terms
over 2050 especially in countries notably using or about to use desalination plants to augment the
supply of fresh water. The economic growth trend is however vulnerable to the integrity of
infrastructure and construction assets in case they are not built to withstand an increase in
temperatures and/or natural events. Moreover, renewable energy generated by hydropower plants
will be reduced especially in the Maghreb countries with a costly need to bridge the energy gap.
Most MENA countries are betting on a tourism sector growth in the future, which could increase
freshwater demand and wastewater treatment services. Still, it is difficult to predict the exact
relative (about 20 percent) and absolute water share of the MENA region energy, service and
industrial sectors. As far as the urban/domestic, industrial and tourism sectors are concerned, any
water demand including climate change-induced demand increase over the next decades will be
partly met by redirecting some of the agricultural water resource allocations.
Agriculture sector, environment and water demand. Increases in irrigation water demand in
conjunction with climate change-induced effects will not be met in the future as less water
resource availability coupled with a growing urbanization and other sector-induced water demand
will result in a double whammy for the rural space: water allocation will diminish, and yields and
livestock will suffer from less water and drier/hotter conditions. Far from being exhaustive there
are a number of climate change direct and indirect effects that will exacerbate the rural space,
coastal areas and ecosystems: crop failure (crops currently grown are near thermal tolerance
thresholds) and rangeland contraction due lower precipitation, higher evapotranspiration rates,
frequent droughts, weather extremes (forest and wild fires, insect infestation, winds, etc.),
increase flashfloods, and desertification will affect the rural populations and livestock food
security; the reduction of the hydrological cycle will reduce the regenerative capacity of the
environment and affect water quality; salinisation will increase in irrigation water, estuaries and
fresh water systems; salt intrusion could threaten coastal water tables, which will increasingly
reduce the availability of fresh water especially for coastal agriculture; sea, dam and reservoir
will be at risk of eutrophication (algal blooms) and sedimentation; change in weather patterns
could lead to snow melting prematurely hence increasing the risk of floods; the ability of some
marine ecosystems and land biodiversity to adapt without dramatic changes in their functions and
resilience is highly unlikely with species being threatened especially when thermal tolerance
thresholds are exceeded. Collectively, these problems will extensively disrupt rural economies,
will threaten the livelihood of the rural poor, deepen gender inequalities and trigger possible
social strife.
Water services
As the region‟s economies, land-use and population structures change over the next few decades,
the demand and quality for water and irrigation services will change accordingly. However, water
and irrigation services are stretched to their limit in most MENA countries and the current service
set up with its lack of participatory planning, management and organization, governance,
accountability and preservation of the commons will not withstand the escalating cross-sectoral
water demand, which will be exacerbated by climate change effects.
In terms of coverage, rapid urbanization will prevent utilities in their current set up and
performance to keep up with the escalating demand for drinking water and wastewater services.
Moreover, the projected rural water scarcity accentuated by climate change could reverse the
water and sanitation coverage gains in certain areas as for instance some surface and ground
water originally tapped for rural networks will be drying up: Morocco and Yemen are already

facing this problem. As a result, urban and rural water access could reach a plateau hence failing
to meet the 2015 Millennium Development Goals (MDGs), and poor water quality could increase
water-related diseases over the next decades especially among the peri-urban and rural poor.
Given the current irrigation scheme set up in most MENA countries coupled with the predicted
reduction in temperature, precipitation and increase in evapotraspiration rates and droughts,
agricultural water requirement ratios could but drop drastically hence decreasing both irrigation
efficiency and agricultural yields, which in turn will threaten food security.
Climate Change Adaptation in the Water Sector in the MENA Region
MENA countries, where fresh water availability is projected to decline due to climate change
effects over the next decades, face a serious and vital challenge as to whether they would be able
to keep on providing enough fresh water to sustain their growing population, social cohesion,
accelerating urbanization, evolving economies, changing land-use, and vulnerable environment.
Failing to take on this challenge could have dire consequences on the public and private sectors‟
human, social, capital, natural and cultural assets and future generation well-being and livelihood
in the MENA region during the 21st century.
What are the requisite responses to effectively climate-proof the MENA region to the projected
climate change-induced reduction in fresh water availability in the future? Scoping the problem in
a political economy context could certainly help formulate better responses and therefore a
coherent strategy:
1. Do MENA stakeholders know what is climate change and how is the MENA region going
to be affected? Are stakeholders committed to tackle the problem? Are there any
constraints?
2. Could MENA human systems mitigate their share of the projected effects? What, how,
how much and where should be the response? Are there any constraints?
3. Could MENA human systems be adjusted, take advantage of opportunities, moderate
potential damages and cope with consequences? What, how, how much and where should
be the response? Are there any constraints?
These three-tier responses could simply be labeled better knowledge, raising awareness and
moral commitment; mitigation; and adaptation. The what, how, how much and where questions
cannot be fully addressed in the context of this note but will be discussed in broader terms.
Obviously, all these questions warrant additional analysis for each country and context however,
IPCC 4 suggest that substantial economic potential for the mitigation of global GHG emissions
could cost-effectively reduce GHG emissions through top-bottom or bottom-up approaches. The
latter seem the most promising with a potential of 6 Giga tons of CO2 equivalent per year in 2030
that could effectively be reduced should adequate policies are put in place and barriers removed.
Bottom-up approaches seem also more sustainable over time with the highest and lowest gains
expected from the construction (building isolation) and waste sectors respectively.
Better Knowledge, Raising Awareness and Moral Commitment Are a Prelude Climate change projection models under various scenarios gave in most cases clear trends on the
climatic variables in the MENA region and sub-regions. However, some inconsistencies and
uncertainties were reported in the results, which call for a new set of harmonized (models used,
baselines, timeframe, etc.) projections for the region, sub-region and countries under IPCC 4
scenarios, which could be updated and calibrated on demand, to help formulate better responses
based on more robust results.

The climate change projection models need to be built into a knowledge infrastructure on climate
change effects in conjunction with water resources and vulnerability areas in MENA countries.
The knowledge infrastructure should build on and/or harmonized existing GIS, which will serve
as a national decision support system to improve climate change risk management. The
comprehensive GIS, whose compatible platform should allow for data aggregation at the sub-
regional and regional levels, could be multi-layered to help accommodate notably socio-
economic, geographical, meteorological, hydrological, infrastructure and natural disaster data.
For instance:
A web of meteorological and marine monitoring systems should be upgraded or installed
throughout the countries to establish time-series and help predict natural events. This
could also be useful should the country plan to establish an early warning system.
Country-specific hydrological cycle data could also be added to the GIS to help better
assess water supply and demand while allowing for a better monitoring and adjustment of
the projected marginal water decrease due to climate change. A clearer water picture will
help provide decision-makers with better tools to make trade-offs to augment fresh water
supply through a blend of demand efficiency (irrigation, domestic and industries), water
reuse, desalination, non-renewable aquifer and/or possibly bulk water import.
Given the lack of empirical observation of long-term climate change-borne health effects,
relative risk projection of certain criteria diseases and conditions should be projected and
mapped into the GIS with the WHO assistance to help decision makers offset possible
cluster of diseases and especially injuries affecting health outcomes in the future.
The GIS could also accommodate a number of other data to monitor for instance GHG
emissions, agriculture and fishery yields, desertification, the state of ecosystems and
species, epidemics, etc.
Raising stakeholder awareness through well orchestrated campaigns, school curriculum and
university syllabus should be a prerequisite to any response in MENA countries as presenting the
scientific projections of climate change effects in a transparent way could facilitate a regional,
national and local dialogue and debate among stakeholders. This will also help the participation
of various segments of the population including vulnerable groups, women and the poor, in the
formulation and implementation of responses.
The private media and academia in MENA countries are already playing a proactive role in
analyzing and publicizing the regional effects of climate change. Among the donors, the World
Bank organized in Tunis in November 2007 a regional meeting targeting regional high-level
officials to present the contours of the draft World Bank MENA Regional Business Strategy to
Address Climate Change. Despite a full understanding of the stakes and endorsement of the draft
strategy, most MENA countries still have to rise to the challenge by turning their commitments
into deeds.
A number of constraints could hamper this response such as the lack of governmental
commitment, capacity and financial resources. Peer pressure and moral suasion (academia,
NGOs, CBOs, etc.), building partnerships (academia, international research centers, etc.) and
seeking Gulf countries, donors and foundations‟ assistance and expertise could help overcome
these constraints.
Mitigation
Economic growth, energy, transport and industrialization are only considered in this context in
terms of contributing to global warming and therefore having a marginal climate change effect on
water resources in the MENA region.

The MENA region GHG emissions are relatively small with 1.5 billion tons of CO2 (ranges
between 3.8 and 5.0 percent of global emission in 2004 according to various sources) but MENA
economies are becoming more carbon-intensive with GHG emissions growing at a staggering rate
of 88 percent over the 1990-04 period, more than 3 times faster than the world's average.
Moreover, MENA countries are the third least energy/value added efficient group worldwide with
about 1.3 kg CO2-equivalent emitted per PPP$ GDP generated in 2004 (in 2000 prices).8
Three quarters of the GHG emissions are due to energy combustion mainly in terms of electricity
and heat, and are concentrated in oil producing countries (Algeria, Arabian Peninsula, Egypt, Iran
and Libya). Most MENA countries are hence increasingly contributing to global warming
although all MENA countries have no obligation under the 1997 Kyoto protocol beyond
monitoring and reporting emissions.
MENA countries have however opportunities to evaluate trade-offs to improve energy efficiency,
reduce emissions and increase urban environmental health outcomes by promoting energy sector
reforms (power utility), reducing energy subsidies, improving urban mobility and switching to
natural gas and abundant renewable energy (solar and possibly wind energy). Moreover, they can
increasingly tap into the carbon funding mechanism to curb the carbon-intensive trend (power
plants, industries, wastewater treatment plants, landfill, green construction, reforestation where
possible, etc.) as the forthcoming 2012 protocol could set more stringent emission reductions that
could affect most MENA countries especially the oil-producing ones.
A number of constraints could hamper this response among the most salient ones are: resistance
to sector reform from within public institutions; vested interest; and financial resources.
Governmental commitment and stakeholder inclusion, disclosure and tapping donor funding
could help overcome these constraints. Some of the Better Knowledge… constraints could also
apply --see above.
Adaptation
Given the imbalanced state of water resources in an increasingly urbanizing MENA region,
calibrating water demand with available supply is the most important step to reduce the climate
change effects but warrants sector-wide policy and institutional reforms. The effects of climate
change can but re-affirm the urgency of implementing these new policies and reforms without
delay as to make water resource management more environmentally, socially, economically and
financially sustainable.9 These reforms present opportunities and very cost-effective ways to
mitigating, containing and/or delaying some of the climate change effects in the future.
Improving water demand management and services coupled with associated environmental health
gains will require sector-wide water reforms in most MENA countries to overcome the current
state of scarcities of governance, i.e., accountability and organizational capacity, and physical
resources (Figure 7).10
More specifically, judicious governance reforms will allow for more accountability in terms of:
efficient water allocation to the highest value use (trade-offs valuation); transparent decision-
making that should be shielded from political/interest pressures with water allocations being
8 Purchasing power parity (PPP) conversion factor or international dollar is used for the GDP/capita, which
is the number of units of a country‟s currency required to buy the same amount of goods and services in the
domestic market as a U.S. dollar would buy in the United States. 9 World Bank (2007b).
10 World Bank (2007a).
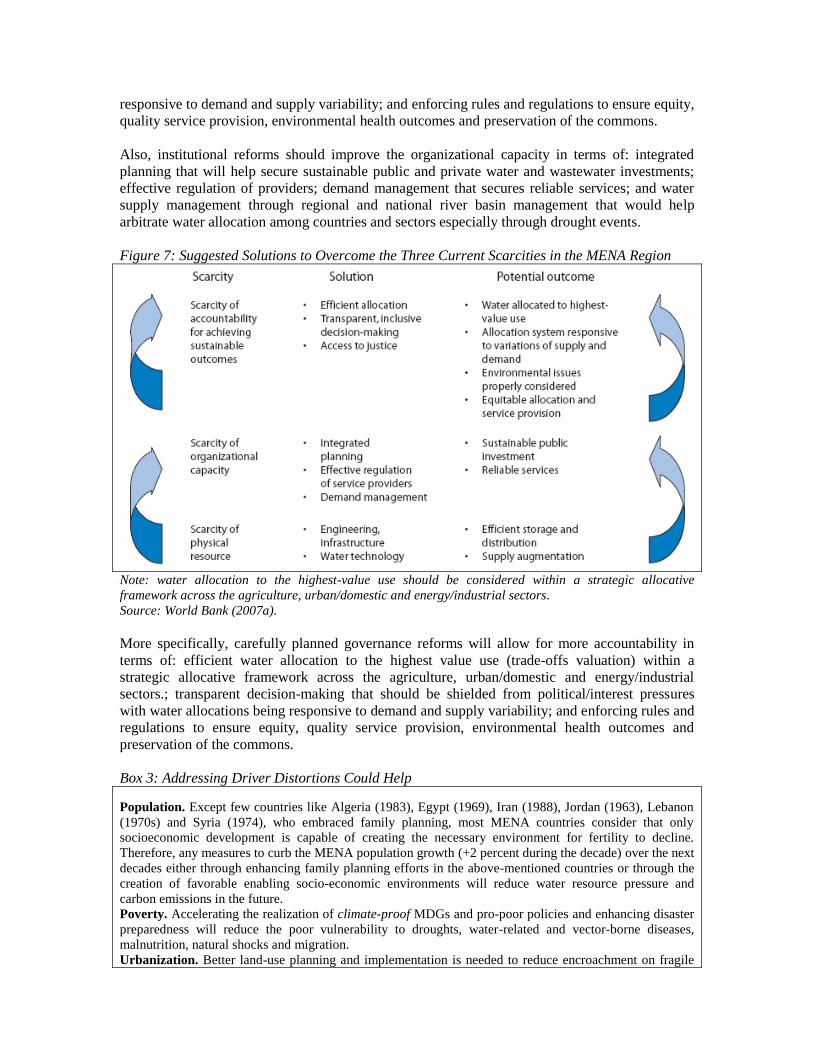
responsive to demand and supply variability; and enforcing rules and regulations to ensure equity,
quality service provision, environmental health outcomes and preservation of the commons.
Also, institutional reforms should improve the organizational capacity in terms of: integrated
planning that will help secure sustainable public and private water and wastewater investments;
effective regulation of providers; demand management that secures reliable services; and water
supply management through regional and national river basin management that would help
arbitrate water allocation among countries and sectors especially through drought events.
Figure 7: Suggested Solutions to Overcome the Three Current Scarcities in the MENA Region
Note: water allocation to the highest-value use should be considered within a strategic allocative
framework across the agriculture, urban/domestic and energy/industrial sectors.
Source: World Bank (2007a).
More specifically, carefully planned governance reforms will allow for more accountability in
terms of: efficient water allocation to the highest value use (trade-offs valuation) within a
strategic allocative framework across the agriculture, urban/domestic and energy/industrial
sectors.; transparent decision-making that should be shielded from political/interest pressures
with water allocations being responsive to demand and supply variability; and enforcing rules and
regulations to ensure equity, quality service provision, environmental health outcomes and
preservation of the commons.
Box 3: Addressing Driver Distortions Could Help
Population. Except few countries like Algeria (1983), Egypt (1969), Iran (1988), Jordan (1963), Lebanon
(1970s) and Syria (1974), who embraced family planning, most MENA countries consider that only
socioeconomic development is capable of creating the necessary environment for fertility to decline.
Therefore, any measures to curb the MENA population growth (+2 percent during the decade) over the next
decades either through enhancing family planning efforts in the above-mentioned countries or through the
creation of favorable enabling socio-economic environments will reduce water resource pressure and
carbon emissions in the future.
Poverty. Accelerating the realization of climate-proof MDGs and pro-poor policies and enhancing disaster
preparedness will reduce the poor vulnerability to droughts, water-related and vector-borne diseases,
malnutrition, natural shocks and migration.
Urbanization. Better land-use planning and implementation is needed to reduce encroachment on fragile
ecosystems, agricultural land and coastal areas, and to accommodate and provide quality services including
water and wastewater treatment to an urban population that will almost double (93 percent urban growth)
by 2050. Land use planning and better services are especially needed to improve the state of peri-urban
areas and the well-being of the dwellers, to help them better cope with droughts and climate change-
induced natural events. Above all, participatory land use planning is imperatively needed to help reduce the
vulnerability of flood-prone areas associated with future sea level rise and draw various levels of
contingency mitigation and resettlement plans in extreme cases.
Economic growth, energy, transport and industrialization are only considered in this context in terms
of contributing to global warming and therefore having a marginal climate change effect on water resources
in the MENA region. (see Mitigation above).
Tourism. Most MENA countries have tourism strategies, which aim to boost yearly tourists and revenues.
Tourist water consumption is usually twice as much as local dwellers‟, which also translate into the
treatment of twice as much wastewater. Trade offs between tourism growth and tourism water consumption
should be carefully valuated and smart water use reduction campaign targeting tourists as well as water
reduction incentives targeting the tourism industries could help curb water consumption.
Agriculture and agro-trade. The MENA region allowed sustaining a rich agricultural heritage over the
centuries in the region (wheat, barley, lentil, pea and vetch) but rural economies are the most vulnerable to
climate change effects, which could lead to higher rural unemployment, crop failure, livestock losses,
droughts, health burden and migration. Drastic rural reforms, which will preserve traditional knowledge,
diversify economic activities (eco-tourism, etc.) and promote community-driven development, are needed
to moderate the climate change shocks: removing public-induced distortions in rural economies from
input/water/energy subsidies while opening up these economies to meteorological, agriculture and
aquaculture new and adapted technologies (meteorological and disaster-prediction support systems in terms
of magnitude, timing and location of possible extreme weathers and disasters; adapted water resource
management –see Physical scarcities above; high value crops; drought and salt proof seeds; agricultural
diversification; small-scale farming fostering ecological methods; lower agricultural carbon footprint;
change in cropping patterns; desert land reclamation; ecopathological approach in intensified farming
systems; organic dairy, meat and agriculture product certification; sea-based and reservoir-based
aquaculture, vector management, etc.), intermediation mechanisms and safety nets (agricultural input
supply systems, credit guaranties, weather insurance schemes, social protection program, etc.), and new
local market as well as regional and international export-markets could revitalize rural economies, reduce
their vulnerability, increase environmental health outcomes and help improve the MENA region virtual
water import balance.
Source: World Bank (2007b); IPCC 4 (2007); and Author.
Also, institutional reforms should improve the organizational capacity in terms of: integrated
planning that will help secure sustainable public and private water and wastewater investments;
effective regulation of providers; demand management that secures reliable services; and water
supply management through regional and national river basin management that would help
arbitrate water allocation among countries and sectors especially through drought events.
As for the physical scarcity reforms, a series of solutions and innovative techniques could be
envisaged such as: better storage systems to reduce evapotranspiration; consider water reuse
through secondary and even tertiary wastewater treatment; flood risk mitigation combining
watershed management and land-use planning (flood-cascading dykes); eutrophication
management; river basin water transfers; protection and conservation of surface water and
groundwater resources; rain harvesting, aquifer recharging; low carbon-intensive desalination
plants; drip irrigation; and supporting irrigation management through evapotranspiration rate
calculation.
Water resources and environmental health outcomes should not however be considered in
isolation as they cut across important drivers notably: population; poverty; urbanization;
economic growth, energy, transport and industrialization; tourism; and agriculture and agro-trade.

Adjusting the drivers‟ distortions could also complement the water resources reform stance that
could help prevent certain climate change effects in the future (Box 3).
Although not exhaustive, adaptive responses, which should factor in risk factors, will also require
to: climate-proof existing construction and infrastructure to withstand extreme weather and
natural disasters, especially in rural areas, and update construction standards and norms; build
contingency plans for population resettlement and livelihood in flood-prone areas; climate-proof
the MDGs; enhance preparedness to mitigate natural events, especially droughts and floods;
improve environmental health outcomes through better health risk management and health sector
preparedness; develop special credit guaranties and insurance premium that discount climate
change risks (Malawi); etc.
A number of constraints could hamper the adaptation responses. Sector-wide reforms are
difficult, costly and lengthy processes. They could face resistance, become highly politicized and
turn unpopular. With regards to the water or other sectors, stakeholder inclusiveness, building
trust and reciprocity, sharing and discussing the pros and cons of good practice reforms, and
promoting a fair, transparent and constructive dialogue among stakeholders could help facilitate
the reform process, which could encourage donors to oversee and support the process, e.g.,
Morocco is piloting a successful water sector-wide reform process with the help of the World
Bank. Other constraints under Better Knowledge… and Mitigation also apply in this context –see
above.
The Way Forward: Partnerships, Governance and Selectivity
The MENA region is facing possibly a vital challenge with regards to the negative effects of
climate change in the 21st century. The tasks at hand in the near to long terms seem critical.
Nevertheless, the acceleration of sustainable management of resources, land-use and economical
processes coupled with an enabling socio-economic environment to curb demographic growth
could already mitigate, preempt, absorb or delay some of the expected effects of climate change
in the MENA region.
Hopefully, climate change models will certainly be refined with time and produce better
knowledge and more accurate projection scenarios. As a result, this will prove invaluable to better
plan, prioritize and sequence mitigation and adaptation interventions to climate change especially
for water resources.
Better risk management will however require building strategic and dynamic partnerships
nationally (public-private-academia-communities), regionally (rich oil countries) and
internationally (donors, foundations, etc.). This will ensure fund leveraging, regional economies
of scale, and the internalization of good practices.
Better risk management calls also for shaping policies that promote innovation and leapfrogging
in certain areas such as: water resources (e.g., drop irrigation coupled with genetically engineered
drought/salt resistance seeds); renewable energies (solar energy is abundant); improved transport
mobility (better urban transit systems); better construction isolation; service sector risk
responsiveness (determine level of risks for lending and insurance); etc.
Rule-bound governance, transparency and coherence with regards to water resources could
temperate climate change effects by increasing efficiency, equity and sustainable outcomes
through: participatory planning; legal (constitution and individual rights) adjustments; cross
sectoral institutional/organizational harmonization and health/disaster preparedness along

government tiers; enhanced preparedness; capacity building; flexible delivery functions; and
close monitoring (e.g., GIS-fed meteorological, hydrological, socioeconomic and other data,
remote sensing, etc.).
Financial resource availability could vary among MENA countries, therefore not all planned
adaptation interventions could be implemented. Intervention options should be based on
quantitative analysis (socio-economic and environment) that will allow decision-makers to
evaluate trade-offs between various policy options to make better and selective choices based on
urgency, value-added, and multiplier effects.

Reference Agoumi, A. 2003. Vulnerability of North African Countries to Climatic Changes: Adaptation and
Implementation Strategies for Climate Change. International Institute for Sustainable Development.
Website: <www.cckn.net/compendium/north_africa.asp>.
Banque mondiale. 2004. Note de Politique Sectorielle, Secteur de l’Eau, République de Djibouti. Rapport
No. 29187-DJ. Bureau Régional Moyen-Orient et Afrique du Nord, Groupe Développement Rural,
Eau, Environnement et Social. Washington, D.C.
Bowen, Mark. 2007. Censoring Science: Inside the Political Attack on Dr. James Hansen and the Truth of
Global Warming. Dutton Adult. New York, N.Y.
Dasgupta, S., B. Laplante, C. Meisner, D. Wheeler and J. Yan. 2007. The Impact of Sea Level Rise on
Developing Countries: A Comparative Analysis. World Bank Policy Research Working Paper 4136.
Washington, D.C.
Doumani, Fadi. 2005. Rural Water Supply, Sanitation and Hygiene Advocacy Note: Background Note on
Health and Economics. Sustainable Development Sector Department of the Middle East and North
Africa Region of the World Bank. Washington, D.C.
FAO AQUASTAT website: <www.fao.org/AG/AGL/aglw/aquastat/main/index.stm>.
Intergovernmental Panel on Climate Change. 2007. Working Group I Report "The Physical Science Basis";
Working Group II Report "Impacts, Adaptation and Vulnerability"; and Working Group III Report
"Mitigation of Climate Change." Geneva. All are available on the IPCC website: <www.ipcc.org>.
Met Office. 2006. Effects of Climate Change in Developing Countries. Met Office Hadley Centre for
Climate Change. Exeter.
OFDA/CRED International Disaster Database website: <www.cred.be/>.
Patz J. A., M.A. McGeehin, and S.M. Bernard. (2000) “The potential health impacts of climate variability
and change for the United States: executive summary of the report of the health sector of the US
National Assessment.” Environmental Health Perspectives, 108:367–376.
Rice, John and Joel Smith. 2005. Climate Change and Adaptation in the Middle East and North Africa.
Prepared by Stratus Consulting for the Sustainable Development Sector Department of the Middle
East and North Africa Region of the World Bank. Boulder, Colorado.
UNICEF-WHO (United Nations Children Fund and World Health Organization) database website:
<www.unicef.org/statistics/index_24304>.
United Nations. 2007. Population Division, World Urbanization Prospects. New York, N.Y.
Wikipedia Encyclopedia website: <www.wikipedia.org>.
WHO. 2005. Comparative Quantification of Health Risks. Geneva. website: <www.who.int>.
World Bank. 2007a. Making the Most about Scarcity: Accountability for Better Water
Management Results in the Middle East and North Africa. Middle East and North Africa Development
Report. Washington, D.C.
World Bank. 2007b (Draft). Regional Business Strategy to Address Climate Change. Middle East and
North Africa. Washington, D.C.
World Bank Indicators website: <www.worldbank.org/data/databytopic/gdp.html>.

ANNEX I
Global Climate Change Effects and IIPC Special Report on Emissions Scenarios
The 2007 Intergovernmental Panel on Climate Change 4th
Assessment Report
“Changes in atmospheric concentrations of GHGs and aerosols, land cover and solar radiation
alter the energy balance of the climate system.” Global warming is therefore unequivocal and the
change in GHG emissions is due to human activities according to the most recent IPCC 4th
Assessment Synthesis Report released in September 2007 (Box A1).
Box A1: Global Warming is Due to Human Activities: IPCC 4 Unequivocal Causality
Warming of the climate system is unequivocal, as is now evident from observations of increases in global
average air and ocean temperatures, widespread melting of snow and ice and rising global average sea
level; and observational evidence from all continents and most oceans shows that many natural systems are
being affected by regional climate changes, particularly temperature increases.
Global atmospheric concentrations of carbon dioxide (CO2), methane (CH4) and nitrous oxide (N2O) have
increased markedly as a result of human activities since 1750 and now far exceed pre-industrial values
determined from ice cores spanning many thousands of years, with a staggering increased by 70 percent
between 1970 and 2004: CO2 emissions with a concentration of 374 ppm in 2005, which are due primarily
to fossil fuel use and marginally to land-use change, are the most indicative and grew by 80 percent over the
period with the long-term trend of declining CO2 emissions per unit of energy supplied reversed after 2000; CH4
emissions with 1,774 ppb in 2005 are due to agriculture and fossil fuel use; and CH4 emissions usually associated
with agriculture have seen a decline in growth rates over the period.
Global anthropogenic GHG emissions (in Giga tons or billion of tons) are illustrated in the figure below by
compound and sector over the 1970-2004 period.
Discernible human influences extend beyond average temperature to other aspects of climate and have:
very likely contributed to sea level rise during the latter half of the 20th
century
likely contributed to changes in wind patterns, affecting extra-tropical storm tracks and temperature
patterns
likely increased temperatures of extreme hot nights, cold nights and cold days
more likely than not increased risk of heat waves, area affected by drought since the 1970s and
frequency of heavy precipitation events.
Source: IPCC 4 (2007).

The GHG emission scenarios predict an increase in temperatures between 0.6˚ and 4˚ Celsius
from 2000 to 2100 –relative to the 1980-99 period. Likely temperature ranges vary however
between 0.3˚ and 6.4˚ Celsius with the most likely A1B scenario projecting temperatures between
1.7˚ and 4.4˚ Celsius with a 2.8˚ Celsius best estimate (Figure A1 includes temperature range bars
at the far right).
Figure A1: GHG Emission Scenarios and Temperatures Projections until 2100, Gigatons of CO2/˚C
Note: 6 illustrative Special Report on Emissions Scenarios (SERS) are shown. See Annex I for scenario
assumptions.
Source: IPCC 4 (2007).
IIPC Special Report on Emissions Scenarios Special Report on Emissions Scenarios is emission scenarios developed and used, among others,
as a basis for some of the climate projections used in IPCC 4. The following terms are relevant
for a better understanding of the structure and use of the set of SRES scenarios:
Scenario Family: Scenarios that have a similar demographic, societal, economic and
technical-change storyline. Four scenario families comprise the SRES scenario set: A1,
A2, B1 and B2 (Box A2).
Illustrative Scenario: A scenario that is illustrative for each of the six scenario groups.
They include four revised „scenario markers‟ for the scenario groups A2 (1,250 ppm), B1
(600 ppm), B2 (800 ppm), and A1B (balanced across energy sources with 850 ppm),
which is a balanced scenario derived from two additional scenarios characterizing high
and low alternative developments of energy technologies: A1FI (fossil intensive with
1,550 ppm) and A1T (predominantly non-fossil with 700 ppm).
Marker Scenario: A scenario that was originally posted in draft form on the SRES website
to represent a given scenario family. The choice of markers was based on which of the
initial quantifications best reflected the storyline, and the features of specific models.
Markers are no more likely than other scenarios, but are considered by the SRES writing
team as illustrative of a particular storyline. These scenarios received the closest scrutiny
of the entire writing team and via the SRES open process. Scenarios were also selected to
illustrate the other two scenario groups.

Storyline: A narrative description of a scenario (or family of scenarios), highlighting the
main scenario characteristics, relationships between key driving forces and the dynamics
of their evolution.
Box A2: Scenario Assumptions
The A1 scenarios are of a more integrated world. The A1 family of scenarios is characterized by:
Rapid economic growth.
A global population that reaches 9 billion in 2050 and then gradually declines.
The quick spread of new and efficient technologies.
A convergent world - income and way of life converge between regions. Extensive social and
cultural interactions worldwide.
There are subsets to the A1 family based on their technological emphasis:
A1FI - An emphasis on fossil-fuels.
A1B - A balanced emphasis on all energy sources.
A1T - Emphasis on non-fossil energy sources.
The A2 scenarios are of a more divided world. The A2 family of scenarios is characterized by:
A world of independently operating, self-reliant nations.
Continuously increasing population.
Regionally oriented economic development.
Slower and more fragmented technological changes and improvements to per capita income.
The B1 scenarios are of a world more integrated, and more ecologically friendly. The B1 scenarios are
characterized by:
Rapid economic growth as in A1, but with rapid changes towards a service and information
economy.
Population rising to 9 billion in 2050 and then declining as in A1.
Reductions in material intensity and the introduction of clean and resource efficient technologies.
An emphasis on global solutions to economic, social and environmental stability.
The B2 scenarios are of a world more divided, but more ecologically friendly. The B2 scenarios are
characterized by:
Continuously increasing population, but at a slower rate than in A2.
Emphasis on local rather than global solutions to economic, social and environmental stability.
Intermediate levels of economic development.
Less rapid and more fragmented technological change than in B1 and A1.
Source: IPCC 4 (2007).