metallic reinforcement of direct squeeze die … · metallic reinforcement of direct squeeze die...
TRANSCRIPT

DE-FC07-01ID13980
METALLIC REINFORCEMENT OF DIRECT SQUEEZE
DIE CASTING ALUMINUM ALLOYS FOR IMPROVED
STRENGTH AND FRACTURE RESISTANCE
Final Report David Schwam John F. Wallace Yulong Zhu Jun-Wan Ki Case Western Reserve University October 2004 Work Performed Under Contract DE-FC07-01ID13980 For U.S Department of Energy Assistant Secretary for Energy Efficiency and Renewable Energy Washington D.C.

TABLE OF CONTENTS
TABLE OF CONTENTS ………..………….….…………………….…………...……i
LIST OF TABLES ……………….…………………………………...…………..……iv
LIST OF FIGURES …..……………...…………………………………………..……. v
ABSTRACT ………………………………………………….…………………….….. x
PART 1: EVALUATION OF REINFORCEMENT MATERIALS AND COATINGS
1.0 INTRODUCTION .……………………..……………………………………...1
1.1 Multimaterial Technology ..…………………..………………………1
1.1.1 The Purpose of This Work ………….………………..….….2
1.2 Interactions and Bonding at the Interface of Dissimilar Materials …...6
1.2.1 Metallurgical Phenomena …………………………………...7
1.2.2 Chemical Bonding .……………..……………...……………8
1.2.2.1 Wetting .…….…………………………………….11
1.2.2.2 Diffusion and Chemical Reactions ...……………..15
1.2.3 Residual Stresses and Mechanical Bonding ...……………..19
1.3 Diffusion and Reaction between Fe and Al-Si Alloy ...……………..21
1.3.1 Effect of Alloying Elements ...……………………………..25
1.4 Toughening Mechanisms of Composites ...……………………...…..28
1.4.1 Toughening Mechanisms of
Continuous Fiber Composites ..……………………………28
i

1.4.2 Toughening Mechanisms of Crack Arrester Type
Laminated Metal Composites (LMC) ..……………………28
1.5 Role of Electroplated Coating ..…………………………….……….31
2.0 EXPERIMENTS ...……………………………………………………………32
2.1 Materials ...…………………………………………………………..32
2.1.1 A354 Aluminum cast Alloy ..……………………………...32
2.1.2 Strengthening Materials and Preparation ..………………...32
2.1.2.1 Surface Treatments and Coatings ...………………36
2.1.2.2 Preparation ..……………………………………...36
2.1.3 Meshes and Preparation ..………………………………….39
2.2 Molds ...……………………………………………………………...42
2.2.1 Molds for Strengthening ..…………………………………42
2.2.2 Molds for Meshes ...………………………………………..45
2.3 Melting and Casting ..……………………………………………….45
3.0 RESULT AND DISCUSSION ..……………………………………………...47
3.1 Analysis of Aluminum Bronze Inserts in the Aluminum Casting ......47
3.1.1 Dissolution of Aluminum Bronze ..………………………..47
3.1.2 Metallurgical Analysis of Interface ...……………………...48
3.2 Analysis of Cast Iron Inserts in the Aluminum Casting ..…………..57
3.2.1 Metallurgical Analysis of Interface ...……………………...57
3.2.1.1 Role of Surface Treatments and Coatings ...……...58
3.2.2 Thermal Expansion Coefficient, Residual Stresses and
ii

iii
Failure of Bonding ..…………………………….………….59
3.2.2.1 Effect of Electroplated Coatings …………………59
3.2.3 Effect of Heat Treatment ……………………..……………60
3.3 Analysis of Ni-Resist Inserts in the Aluminum Casting ..…………..73
3.3.1 Metallurgical Analysis of Interface ...……………………...73
3.3.2 Effect of Heat Treatment on Bonding Strength ...………….73
3.4 Analysis of Mesh Reinforced Aluminum Casting ...………………...77
3.4.1 Metallurgical Analysis of Interface ...……………………...77
3.4.2 Results of Charpy Impact Test ..………………………..….77
4.0 CONCLUSIONS ..……………………………………………………………91
PART 2: REINFORCEMENT OF SQUEEZE CAST ALUMINUM
5.1 PROCEDURE AND EXPERIMENTS………………………………………………92
5.2 RESULTS AND DISCUSSION……………………………………………………..94 5.3 CONCLUSIONS…………………………………………………………………….98
BIBLIOGRAPHY ……………………………………………………………..……….99

LIST OF TABLES
Table 1 – Fe-Al System Phases …………………………………………………….….22
Table 2 – Fe-Al-Si Phases ……………………………………………………...………23
Table 3 – Density ρ and Molar Volume Mv Values of Important Phases in Fe-Si-Al System ……………………………………………………………………….24
Table 4 - Impurity/Alloying Effect on the Interatomic Interaction of Al and Fe Atoms in Fe0.95(Al1-nXn)0.05 Ternary System and the Change in Thickness of the Aluminized Diffusion Layer at T=800� for 1 at.% Concentration of X Element …………………………………………………………………....27
Table 5 – The Dimension of Discs …………………………………………………….34
Table 6 – Thermal Expansion Coefficients of Materials ………………...…………….35
Table 7 – Surface Treatments and Coatings of Discs ………………………………….37
Table 8 – Data of Stainless Steel Wire Meshes ………………………………………..40
Table 9 – Shear Test Results of Ni-resist Insert in the Small Casting …………………76
Table 10 – Data on Meshes and Impact Energy ……………..………………………...84
Table 11 – Impact Test Results ………………………………………………………...88
iv

LIST OF FIGURES
Figure 1 – A squeeze cast piston with Ni-resist insert (a) …………………………..…..4 Figure 1 – The groove area with Ni-resist insert (b) ……………………………….……4
Figure 2 – Pictures of casting with stainless steel wire mesh …………………….……..5
Figure 3 – Phase diagram showing complete miscibility in the solid state (a) ………….9 Figure 3 – Phase diagram showing limited solid solubility (b) …………………………9 Figure 3 – Schematic illustration of a binary alloy system with the formation of
intermetallic compounds (c) ……………………………………………….10
Figure 4 – Interface zone between dissimilar metals showing solid solution and intermetallic compound formation …………………………………………10
Figure 5 – Configuration of a liquid sessile drop on a solid substrate ……………...….14
Figure 6 – Schematic diagrams to illustrate the growth of the ApBq layer between the elements A and B …………………………………………………………..18
Figure 7 – The methods to set discs in the mold ………………………………...……..38
Figure 8 – Sketch of multi-layer meshes (a) ……………………………………….…..41 Figure 8 – Picture of multi-layer meshes (b) ……………………………………..……41
Figure 9 – The schematic feature of mold and position of disc-inserts (a) ………….…43 Figure 9 – The picture of mold with discs (b) ……………………………………...….43
Figure 10 – Mold for small casting (a), (b), (c), (d) ………………………….………..44
Figure 11 – Sketch of mold and dimension of casting (a), (b) ………………….……..46
Figure 12 – Casting with metallic inserts and cutting line …………………………..…50
Figure 13 – Cross section of aluminum bronze insert (a) ……………………………...50 Figure 12 – Cross section of aluminum bronze insert with Cu electroplating (b) …..…51 Figure 12 – Cross section of aluminum bronze insert with heavy Ni
electroplating(c) …………………………………………………………..51 Figure 12 – Cross section of aluminum bronze insert with Cu/Ni electroplating (d) ….52 Figure 12 – Cross section of aluminum bronze insert with Zn electroplating (e) ……..52
Figure 14 – Cross section of cast iron insert ………………………………………...…53
Figure 15 – Phase diagram of Al-Cu binary system (a) ………………………………..54
v

Figure 14 – Phase diagram of Fe-Al binary system (b) ………………………………..54
Figure 16 – Optical microscope picture of interface between Al bronze and aluminum
alloy (a) …………………………………………………………………...55 Figure 15 – Optical microscope picture of interface between intermediate layer and
aluminum alloy (b) ……………………………………………………….56 Figure 15 – Optical microscope picture of interface between Al bronze and intermediate
layer (c) …………………………………………………..……………….56
Figure 17 – Cross section of cast iron insert …………………………………………...61
Figure 18 – Optical microscope picture of the interface between cast iron and Al alloy ……………………………………………………………………61
Figure 19 – Result of micro hardness test across the interface between Al alloy and cast iron insert with Zn coating (a) ……………………………………….62
Figure 21 – Micro hardness across the interface between Al alloy and cast iron insert (b) ………………………………………………………...62
Figure 20 – SEM picture of interface between A354 Al alloy and cast iron with Cu coating (a) ……………………………………………………………...63
Figure 19 – Compositional profile across the interface between A354 Al alloy and cast iron with Cu coating (b) ……………………………………………...64
Figure 21 – Phase diagram of Al-Si binary system ……………………………………65
Figure 22 – Interface of A354 aluminum cast alloy and cast iron with carbon nitriding ……………………………………………………………66
Figure 23 – Interface of A354 Al alloy and cast iron after aluminizing (a) …………...66 Figure 23 – Interface of A354 Al alloy and cast iron with electroplated
Cu coating (b) ……………………………………………………………..67 Figure 23 – Interface of A354 Al alloy and cast iron with electroplated
Cu/Ni coating (c) ………………………………………………………….67 Figure 23 – Interface of A354 Al alloy and cast iron with electroplated
Ni/Cr coating (d) …………………………………………………………..68 Figure 23 – Interface of A354 Al alloy and cast iron with electroplated
Zn coating (e) ……………………………………………………………...68
Figure 24 – The thickness of intermediate layer of aluminum alloy and cast iron interface ………………………………………………………………..69
Figure 25 – Interface between A354 Al alloy and cast iron after Kolene process with Cu coating (a) ……………………………………………………………..70
Figure 25 – Interface between A354 Al alloy and cast iron after Kolene process with
vi

Cu/Ni coating (b) ………………………………………………………….70
Figure 26 – Cast iron insert utilized in the aluminum casting (a) ……………….……..71 Figure 26 – Degrading of the interface by different thermal contraction of A354 Al alloy
and cast iron insert (b) …………………………………………...……..71
Figure 27 – Crack in the intermediate layer (a) ………………………………………..72 Figure 27 – Crack in the Al alloy (b) ………………….……………………………….72
Figure 28 - Interface between A354 and cast iron with Cu/Ni coating after heat treatment (a) ……...……………………………………………….73
Figure 26 – Interface between A354 and cast iron with Zn coating after heat treatment (b) …………………………………………………………73
Figure 29 – The interface between A354 Al alloy and Ni-resist insert ………………..74
Figure 30 – The interface between A354 Al alloy and Ni-resist insert with Al coating ………………………………………………………………….74
Figure 31 – Small casting with Ni-resist insert (a) ……………….……………..……..75 Figure 31 – Shear test specimens (b) …………………………………………………..75
Figure 32 – Optical microscope picture of stainless steel wire (a) …………………….80 Figure 30 – Optical microscope picture of stainless steel wire mesh (b) ……………...80
Figure 33 – SEM micrograph of intermediate layer (a) ………………………………..81 Figure 33 – EDS result of the intermediate layer (b) …………………………………..81
Figure 34 – Stainless steel wire with Zn coating after heat treatment (a) ……………...82 Figure 31 – Stainless steel wire without coating after heat treatment (b) ……………...82
Figure 35 – Impact energy of A354 Aluminum alloy and casting reinforced by galvanized steel wire mesh ……………………………………………….83
Figure 36 – Area fraction with varying mesh count …………………………………...85
Figure 37 – Impact energy with varying mesh count ………………………………….86
Figure 38 – Effect of area fraction of wire on impact energy …………………………87
Figure 39 – Effect of number of layer …………………………………………………89
Figure 40 – Effect of heat treatment …………………………………………………...90
vii

viii
Figure 41a – Ejector insert for metal reinforced aluminum dome casting…………….99
Figure 41b – Cover insert for metal reinforced aluminum dome casting…… ……...100
Figure 43a – AISI 304 Stainless wire mesh and punched sheet ………………….....101
Figure 43b – Unalloyed 1020 steel wire mesh ………………………………..….....101
Figure 44 – Dome performs of 304 stainless, 1020 unalloyed wire mesh and
punched 304 stainless steel sheet……………………………………….102
Figure 45 – Weight of the reinforced material in aluminum dome castings ………103
Figure 46 – Weight of the castings made of aluminum with and w/o reinforcement 103
Figure 47 – X-Ray picture of castings with and w/o reinforcement ……………....104
Figure 48 – Setup for water pressure testing .……………………………………....104
Figure 49 - Failure mode of castings in water pressure testing……………………..105
Figure 50 – Setup for piston pressure testing of the hemispheric casting………….106
Figure 51 – Effect of reinforcement on impact resistance………………………….107
Figure 52 – Effect of SS304 wire reinforcement (casting produced at 7,600 psi)…..108
Figure 53 – Typical load-deformation plot of castings made with 17,000 psi
pressure with and w/o reinforcement (as-cast) ………………………..109
Figure 54 – Effect of SS304 wire reinforcement on failure energy
(Load*Dispacement) at 7,600 psi (as-cast)……………………………..110
Figure 55 – Effect of reinforcement on failure energy (Load*Dispacement)
at 17,000 psi (as-cast)..…………………….…………………………..110
Figure 56 – Failure mode of castings tested with piston pressure…………………..111
Figure 57 – Effect of mesh are afraction in cross-sections of stainless mesh
reinforced A354 on CVN impact strength……………….……………..112

ACKNOWLEDGEMENTS
This research investigation was supported by the Department of Energy, Office of
Industrial Technology through the Cast Metal Coalition program. The Research and
Development Committee of the North American Die Casting Association provided guidance for
this work. The efforts of Mr. Steve Udvardy, Director of Research and Education at NADCA and
the members of the committee are gratefully acknowledged.
This publication was prepared with the support of the U.S. Department of Energy (DOE),
Award No. DE-FC07-01ID13980. However, any opinions, findings, conclusions or
recommendations expressed herein are those of the authors and do not necessarily reflect the
views of the DOE.
ix

ABSTRACT
The utilization of aluminum die casting as enclosures where internal equipment is
rotating inside of the casting and could fracture requires a strong housing to restrain the
fractured parts. A typical example would be a supercharger. In case of a failure, unless
adequately contained, fractured parts could injure people operating the equipment. A
number of potential reinforcement materials were investigated. The initial work was
conducted in sand molds to create experimental conditions that promote prolonged
contact of the reinforcing material with molten aluminum. Bonding of Aluminum bronze,
Cast iron, and Ni-resist inserts with various electroplated coatings and surface treatments
were analyzed. Also toughening of A354 aluminum cast alloy by steel and stainless steel
wire mesh with various conditions was analyzed.
A practical approach to reinforcement of die cast aluminum components is to use
a reinforcing steel preform. Such performs can be fabricated from steel wire mesh or
perforated metal sheet by stamping or deep drawing. A hemispherical, dome shaped
casting was selected in this investigation. A deep drawing die was used to fabricate the
reinforcing performs. The tendency of aluminum cast enclosures to fracture could be
significantly reduced by installing a wire mesh of austenitic stainless steel or a punched
austenitic stainless steel sheet within the casting. The use of reinforcements made of
austenitic stainless steel wire mesh or punched austenitic stainless steel sheet provided
marked improvement in reducing the fragmentation of the casting. The best strengthening
was obtained with austenitic stainless steel wire and with a punched stainless steel sheet
without annealing this material. Somewhat lower results were obtained with the annealed
punched stainless steel sheet. When the annealed 1020 steel wire mesh was used, the
results were only slightly improved because of the lower mechanical properties of this
unalloyed steel. The lowest results were obtained with unreinforced 356 aluminum
casting.
Good strength can be obtained with a sound die casting without any defects
produced by squeeze casting. The use of higher pressure to produce the squeeze casting
x

xi
has been shown to increase the strength of a hemispherical dome casting. This dome
shape casting has been produced both with and without reinforcement and tested to
determine its pressure resistance under internal pressure of water. Only a slight
improvement in strength could be determined because of water leaks at the seal between
hemispherical dome and its flat supporting side. However, when the ability of the casting
was tested under the compressive force of a plunger, the strengthening effect of wire
mesh or sheet was evident. Higher loads to failure were obtained because of the
reinforcement of the stainless steel wire and punched sheet. Rather than a sudden failure
occurring, the reinforcement of the stainless steel wire or the punched hard stainless steel
sheet held the material together and prevented any loss of the fractured casting to the
surroundings. Unalloyed steel did not have the required strength or mechanical properties
to increase the properties of the casting.

PART 1: EVALUATION OF REINFORCEMENT MATERIALS AND COATINGS
1.0 INTRODUCTION
1.1 Multimaterial Technology
Many high performance products and engineering structures are required to
operate under demanding condition without premature failure. Often, such severe
operating condition are localized to a certain part of a component. Local reinforcement
can provide industry with the ability to increase resistance against localized stresses, or
with various functional capabilities. Similarily, efficient combinations of conventional
materials in those places where they are most useful and economic can provide cost
effective solutions to engineering problems. Multimaterial technology is becoming more
widespread and provides promising solutions for the design and fabrication of many high
performance products and engineering structures.
The reasons for using multimaterial combinations for a single product are based
on several considerations [1]. Firstly, the multimaterial combination has to meet the
technical requirements of the product. The combination has to satisfy mechanical
requirements, such as a combinations of strength and rigidity for static and fatigue
loading, reduced weight, local wear and corrosion resistance, and high temperatures
1

2
resistance. Also the multimaterial combination has to satisfy functional requirements,
such as electric or magnetic activity, damping and kinematic behavior. Secondly,
multimaterial assemblies provide designers and manufacturers with more flexibility and
degrees of freedom. In order to take full advantage of the properties of various materials,
it is necessary for designers to use the most suitable materials for each part of a given
structure. The use of multimaterial techniques can combine the various properties of each
component and fully utilize their individual advantages to fulfill the special requirements
of the product. Thirdly, the fabrication of multimaterial products can yield economic
benefits, because the materials properties of each part can be utilized more efficiently.
Multimaterial technology can result in use of less expensive materials and reduces the
cost of products. The use of a novel, high performance material in critical parts of a
structure can extend the life cycle of the product.
1.1.1 The Purpose of This Work
The purpose of this work is to employ multimaterial technology in casting
processes. An example of a particular applications of multimaterial technology in casting
processes is a diesel engine piston with a nickel containing cast iron, called Ni-resist, in
the groove area of the pistons to provide wear resistance (Fig. 1). This piston is produced

3
by squeeze casting process. The present work addresses two related subjects: reinforcing
aluminum castings with dissimilar material inserts with or without coating; and
reinforcing cast aluminum housings with stainless steel wire meshes to improve the
impact strength (Fig 2).

4
Figure 1(a): A squeeze cast piston with Ni-resist insert
Figure 1(b): The groove area with Ni-resist insert

5
Figure 2: Pictures of casting reinforced with stainless steel wire mesh.

6
1.2 Interactions and Bonding at the Interface of Dissimilar Materials
Various materials can be joined to produce multimaterial products. The physical
and mechanical properties of these materials vary significantly. These differences in
properties between various materials provide a broad range of materials available for
special operating conditions and environments. However, these large differences in
material properties also lead to difficulties in joining them together. Physical and
chemical mismatches can result in incompatibility. Physical mismatches such as
differences in melting temperature, thermal expansion coefficients and thermal
conductivity can create joining problems. Chemical mismatches can result in the
formation of brittle compounds. Diffusion of elements can sometimes result in the
degrading of the dissimilar joint properties.
The type of interfacial bonding can be classified as mechanical bonding and/or
chemical bonding. When one material is surrounded by another material, any contraction
of the surrounding material can result in a “gripping” effect. This effect can lead to a
considerable degree of mechanical bonding. Also dissolution, wetting, and reaction can
cause chemical bonding at the interface.
7
1.2.1 Metallurgical Phenomena
Phase diagrams are useful tools for understanding the bonding of dissimilar
metals. It should be noted that casting processes normally produce relatively high heating
and cooling rates, which lead to the formation of structures different from the equilibrium.
Some elementary forms of binary phase diagrams illustrate a simple example [1].
The first example is a binary system (Fig.3 (a)) in which two metals are
mutually soluble in all proportions and in both the liquid and solid states. In this case,
they can normally form a bonding with a tough solid solution with low cracking
sensitivity. The bonding normally exhibits good metallurgical and mechanical properties.
If the heating and cooling rates are not too slow, bonding dissimilar metals of this type
does not present serious problems. In case of slow heating and cooling rate can cause a
dissolution problem. Copper-nickel and gold-platinum alloy systems belong to this
category.
A binary eutectic system is the second category (Fig. 3(b)). In this type of
system, the liquid is completely miscible, but miscibility in the solid state is limited. In
this case, the quality of the joints depends on the properties of the eutectic. Normally the

8
eutectic is harder and more brittle than the primary crystals A and B [2]. Therefore, the
eutectic phase can impair their behavior during service. Thus, it is more difficult to join
materials belonging to this system. Examples of this system include silver-copper, lead-
tin and aluminum-silicon alloys.
The third type of system is one in which the intermediate phase exists in the
form of an intermetallic compound (Fig.3 (c)). Intermediate phases show hard and brittle
behavior. If they form an intermetallic composition, fusion techniques are difficult to
apply in bonding. This difficulty arises from the fact that these brittle components will
result in lower ductility and increased crack-sensitivity. Therefore, the combination of
elements belonging to this type of system should be employed with caaution. Although it
is difficult to bond dissimilar alloy systems forming intermetallic phases, a few solutions
are readily available to minimize the problems. For instance, it is possible to use a filler
material, which does not form intermetallic compounds with either of the two base metals.
1.2.2 Chemical Bonding
Dissimilar materials can be chemically bonded by dissolution, wetting, and
reaction at the interface. The planar interface, which is initially formed at the interface of

9
Figure 3(a): Phase diagram showing complete miscibility in the solid state
Figure 3(b) Phase diagram showing limited solid solubility

10
Figure 3(c): Schematic illustration of a binary alloy system with the formation of intermetallic compounds
Figure 4 Interface zone between dissimilar metals showing solid solution and intermetallic compound formation

11
dissimilar metals, becomes an interfacial zone having multiple interfaces, which include
intermetallic compounds, solid solutions, and so on (Fig. 4). In such a case, not only the
compositional parameter and processing parameters (time and temperature), but also
other parameters (microstructure and mechanical, physical, chemical, and thermal
characteristics of different phases present in the interfacial zone) are needed to
characterize the interfacial zone. Some controlled amount of reaction at the interface may
be desirable for obtaining strong bonding between dissimilar materials. The intermetallic
compound layer forms a metallurgical bond between both materials. However too thick
an interaction zone will adversely affect the bonding properties. Therefore the control of
formation and evolution of an intermediate layers in bonding two different materials is
metallurgically very important. The successful application of dissimilar materials
depends on the physical and mechanical properties of the intermetallic compounds
formed at the interface
1.2.2.1 Wetting
Wetting is one of the most important phenomena in joining process. The
mechanical strength of the bond after solidification can be approximately evaluated from
in liquid state [3]. Wetting phenomena depends on temperature and the chemical aW

12
composition of the phases. Wetting becomes more pronounced with increased
temperature.
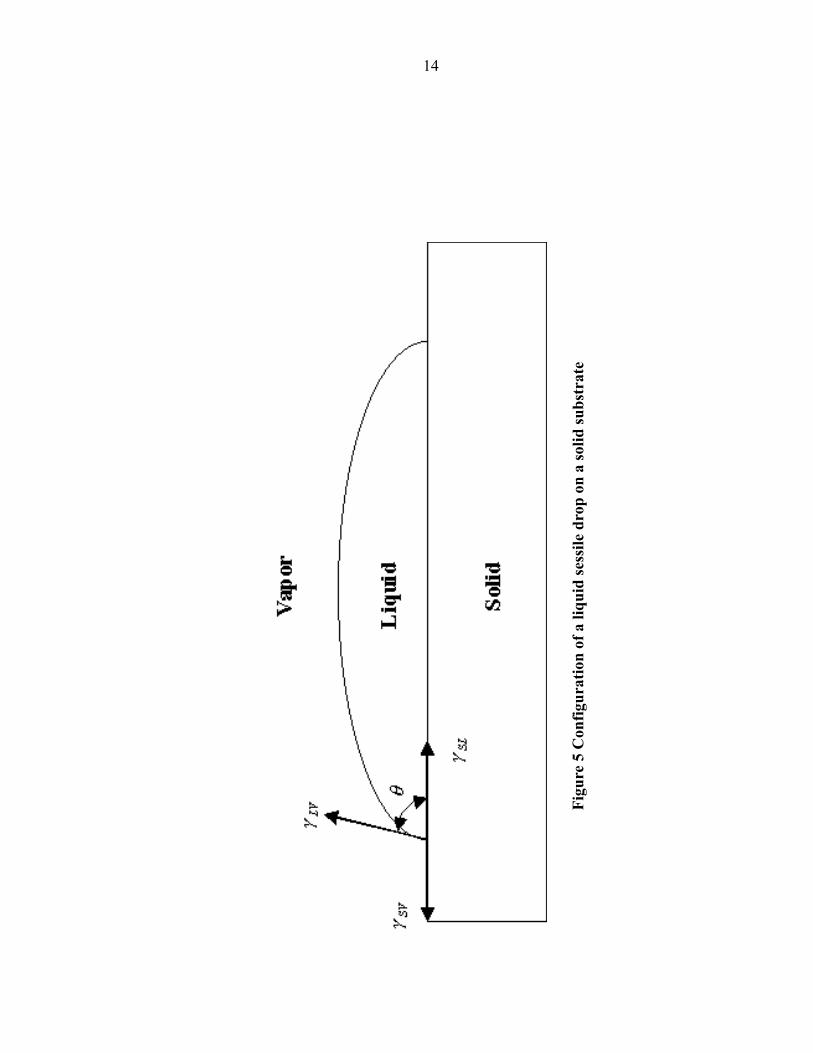
Figure 5 illustrates a drop of liquid placed on the surfaces of a solid. The
relationship between the contact angle and the interfacial energies at interfaces is
expressed by Equation 1.
LVSLSV γγγθ /)(cos −= (1)
Where LVγ , SVγ , and SLγ are the liquid-vapor, solid-vapor, and solid-liquid interfacial
energy, respectively. The interfacial energy LVγ and contact angle θ determine the
energy needed to form a new interface from the two surfaces, known as the work of
adhesion ( ) defined as WaW SLLVSVa γγγ −+= . Their relationship is described by
Equation 2 (Young-Dupre equation):
)cos1( θγ += LVaW (2)
The contact angle influences the magnitude of the interfacial bonding. For example, as
the contact angle decreases the work of adhesion increases resulting in increasing bond
strength. This is often achieved with increasing temperature.

13
Generally the boundary between wetting and non-wetting is .
Theoretically, represents conditions of wetting. In practice, good wetting can be
obtained with a much smaller angle, e.g. .
ο90=θ
ο90<θ
ο15<θ
It should be noted that the Equation 1 and Equation 2 are valid for weakly
reacting systems. However in reactive systems chemical reactions occur at the interfaces,
and may greatly influence wetting. The driving force for wetting is provided by the sum
of the contribution of the reactions between the substrate and liquid and the contribution
of the surface energies. Therefore Equation 2 has to be modified so it takes into account
the reaction as expressed in Equation 3 [4].
οGCW RLVa ∆−++= γθγ )cos1( (3)
Where Rγ is the interfacial energy between the solid and the reacting interfacial layer,
is the Gibbs free energy of the formation of the new interfacial compound, and C is
a constant. The driving force for wetting comes from the contribution of the reaction and
the contribution of the surface energies.
οG∆
14
Figu
re 5
Con
figur
atio
n of
a li
quid
sess
ile d
rop
on a
solid
subs
trat
e

15
1.2.2.2 Diffusion and Chemical Reactions
The formation and growth characteristics of the diffusion layer depend on
several factors such as the crystal structure, the range of solid solubility, the magnitude
and sign of interatomic interaction potentials between the atoms of mutually interacting
elements and also their interdiffusion coefficient. However, the observed kinetics can be
governed either by the rate of diffusion across the product phase(s), diffusion control, or
by the process(es) taking place at the interfaces, interface or reaction control, or more
generally by a combination of both [5].
The characteristics of diffusion with chemical reactions are different from that of
non-reactive diffusion. There are number of discrepancies between conventional
diffusion theory and the experimental data. Therefore “diffusion” theory is not
necessarily valid for reaction diffusion. The main discrepancies are the following [6]:
1. According to the “diffusion” theory, there is no restriction on the number of
compound layers growing simultaneously in a given couple. However no reports
show the simultaneous growth of five or six compound layers between the couples in

16
which up to ten compounds exist in a certain range of temperatures. The usual
number of layers has been reported are one to three and rarely four [7, 8].
2. The layer growth is often non-parabolic, especially in those cases where two or more
compound layers grow simultaneously. In the initial stage the process is always non-
parabolic, the layer thickness time relationship being linear [7,8,9].
3. According to the “diffusion” theory once formed a layer cannot disappear since the
smaller the thickness the greater is the layer growth rate. [7,10, 11]. However
experimental data do not prove this case.
The neglect of a chemical reaction appears to be the main source of discrepancies
between the theory and experiment.
Dybkov[6] proposed the physicochemical theory of heterogeneous kinetics in
binary systems. Evans’equation[12] and Arkharov’s concept of the reaction
diffusion[13,14] reveal the role of diffusion and that of chemical reactions in determining
the compound layer-growth kinetics. The theory is based on the following assumptions:
1. The concentrations of components A and B in the layer at boundaries 1 and 2 are equal
to the limits of the ApBq homogeneity range;

17
2. A change in concentration with distance within the ApBq layer is linear;
3. During growth, both boundary concentrations behave as a linear concentration
distribution that remains almost unchanged.
In case of a single layer of the chemical compound ApBq, p and q being positive integers,
grows between the elements A and B as illustrated in Fig. 6. A general equation
describing the ApBq layer growth between the A and B phases is expressed by Equation 4.
)/(1)/(1 2120
20
1110
10
AA
A
BB
B
kxkk
kxkk
dtdx
++
+= (4)
where x is the thickness of the ApBq layer; t the time; k0B1, k1B1, k0A2, and k1A2 the rate
constants of the layer growth under conditions of reaction control. The three digits in the
subscript indicates regime of the layer growth, 0 and 1 indicate reaction and diffusional
regime of the layer growth, atoms which diffuse towards the reaction site, and the
interface where chemical reactions take place. If the contributions of both components to
the layer growth are equal (k0B1=k0A2 and k1B1=k1A2) then
)/(12
1110
10
BB
B
kxkk
dtdx
+= (5)
and
1011
2
24 BB kx
kxt += (6)

18
CB1
CB2 CB2
CB1
t=t1+dt
ApBq
CB(A)
CB(B)
BA
21 x dxB1 dxB2t=t1
ApBq
21 x
CB(A)
CB(B)
BA
t=0
Distance0
CB(A)
CB(B)
BA
T1
T2
A ApBq B
T
Distance Distance0 0
Figure 6: Schematic diagrams to illustrate the growth of the ApBq layer between the
elements A and B

19
For small x,
tkx B102= , (7)
whereas for large x
tkx 2 4= B11 . (8)
1.2.3 Residual Stresses and Mechanical Bonding
Normally, dissimilar materials have different thermal expansion coefficients.
When joined, cooling dissimilar materials from high temperature can result in increased
residual stress at the interface. These residual stresses affect the quality and integrity of
the bonding. In particular, tensile residual stresses have an adverse effect on bonding.
Controlling residual stress is therefore very important. Generally, the use of suitable filler
materials can be expected to produce a joint area with a thermal expansion coefficient
between the two base materials that is sufficient to provide plastic deformation
capabilities [1].
Residual stresses do not always effect the bonding adversely. An example is the
mechanical gripping that occurs when one material is surrounded by another material
with higher thermal expansion coefficient at the high temperature. After cooling, the

20
different thermal contraction results in gripping of the inside material by the surrounding
material. Residual stresses can therefore provide a strong mechanical bonding.

21
1.3 Diffusion and Reactions between Fe and Al-Si Alloy
The reaction between aluminum and iron is extremely rapid and accompanied by
a diffusion process leading to formation of a continuous layer of Fe-Al intermetallic
compounds, which are hard and brittle [15-19]. The growth of the intermetallic layers
would be diffusion controlled and diffusion is the rate-limiting step for the growth of the
interfacial reaction products [20, 21].
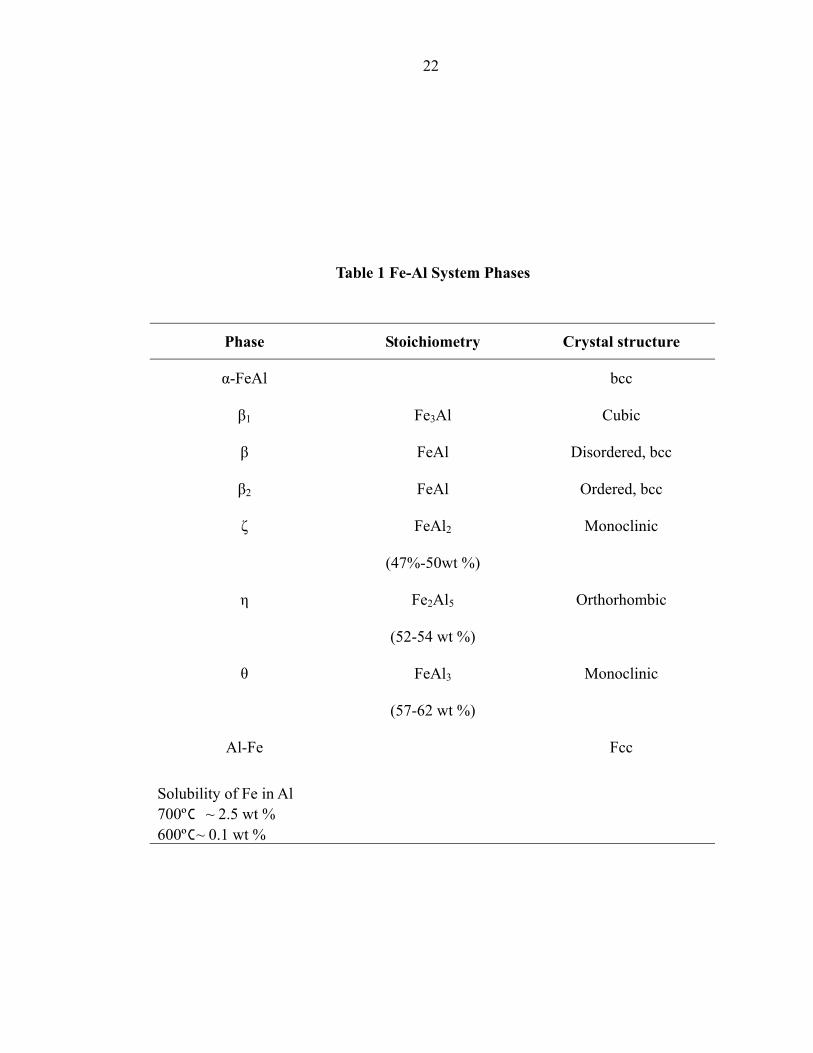
Table 1[22] and Table 2[23] show phases in Fe-Al and Fe-Al-Si system,
respectively. Also Table 3 shows density and molar volume of Al, Fe, Si and some Fe-Al
and Fe-Al-Si intermetallic compounds. Base on this data, the formation of intermetallic
compounds leads to negative volume change. Not only do these volume change but also
the brittle characteristics of intermetallic compounds make it harder to have a good
bonding at the Fe-Al interface.
Fe + 3Al = FeAl3 ∆V = -1.98 cm3/mol
2Fe + 5Al = Fe2Al5 ∆V = -4.19 cm3/mol
2Fe + Si + 8Al = Fe2SiAl8 ∆V = -8.01 cm3/mol
22
Table 1 Fe-Al System Phases
Phase Stoichiometry Crystal structure
α-FeAl bcc
β1 Fe3Al Cubic
β FeAl Disordered, bcc
β2 FeAl Ordered, bcc
ζ FeAl2 Monoclinic
(47%-50wt %)
η Fe2Al5 Orthorhombic
(52-54 wt %)
θ FeAl3 Monoclinic
(57-62 wt %)
Al-Fe Fcc
Solubility of Fe in Al 700ºC ~ 2.5 wt % 600ºC~ 0.1 wt %

23
Si
6-12
12-1
5
49.1
16.9
57-6
7
Al
55-6
5
55-6
8
25.5
49.2
6-8
Com
posi
tion,
wt %
Fe
30-3
3
20-3
0
25.4
33.9
27-3
5
Cry
stal
stru
ctur
e
Hex
agon
al
Mon
oclin
ic
Tetra
gona
l
c-fa
ce c
ente
red
Mon
oclin
ic
Stoi
chio
met
ry
Fe2S
iAl 8
FeSi
Al 5
FeSi
2Al 4
FeSi
Al 3
Fe2S
iAl 9 Ta
ble
2 Fe
-Al-S
i Pha
ses
Nom
encl
atur
e
α β δ γ
Unn
amed

24
Mv,
cm3 m
ol-1
35.1
1
59.9
9
98.2
3
10.0
0
7.09
12.0
6
ρ, g
cm-3
3.90
4.11
3.62
2.70
7.87
2.33
Tabl
e 3
Den
sity
ρ a
nd M
olar
Vol
ume
Mv Va
lues
of
Impo
rtan
t Pha
ses i
n Fe
-Si-A
l Sys
tem
Phas
e
θ-Fe
Al 3
η-Fe
2Al 5
α-Fe
2SiA
l 8
Al
Fe
Si

25
1.3.1.1 Effect of Alloying Elements
Time and temperature are the two main parameters of reaction diffusion.
However, alloying element additions may affect the rate of diffusion and the
characteristics of the chemical reaction. An alloying element reduces the diffusion rate of
iron or that of aluminum by formation of solid solutions or new phases. The thickness of
the alloy layer can be reduced [21,24-26]. For example, addition of silicon results in the
formation of a layer of FexSiyAlz, which acts as a diffusion barrier and restricts the Fe-Al
compounds formation. Oxygen and nitrogen may reduce the thickness of the alloying
layer by the formation of a ceramic oxy-nitride phase, which acts as a diffusion barrier
[27]. A copper addition reduces the thickness by reducing the rate of nucleation of the
intermetallic compounds [28]. On the other hand, Mg addition, which has high
diffusional mobility, results in the rapid growth of intermetallic phases [29].
Akdaniz et al. [30] proposed that alloying elements affect the activity
coefficients of the diffusing species in the intermetallic layers, which can be determined
from the Eq. 9 and Eq. 10 [31].

26
iexcessi RT γµ ln= (9)
jjiii c)(lnln εγγ Σ+= ο (10)
Where is a constant which is independent of concentration of constituent elements
in the intermetallic layers,
οiγln
iγ is the activity coefficient of element i , is the
interatomic interaction parameters of the element i due to the element
)( jiε
j , and c is the
concentration of the element
j
j in the intermetallic layers. Table 4[30] shows
impurity/alloying effect on the interatomic interaction of Al and Fe atoms in Fe0.95(Al1-
nXn)0.05 ternary system and the change in thickness of the aluminized diffusion layer at
T=800oC for 1 at.% concentration of X element. Based upon these data, alloying
elements can be classified into two groups [30]:
(1) I-group : XI=Si, Ti, Ge, Sb, Mg, Cu, Ca, Ag, Cd or Cr, these impurites decrease the
activity coefficient of Al atoms in α-Fe so as to reduce the thickness of intermetallic
layer at the interface.
(2) II-group : XII=Co, Zn, Mn, Ni, Pb or Bi. The addition of these impurities tends to
increase the activity coefficient, which leads to thickening of the aluminized diffusion
layer at the Fe-Al interface.

27
Table 4 Impurity/Alloying Effect on the Interatomic Interaction of Al and Fe Atoms in Fe0.95(Al1-nXn)0.05 Ternary System and the Change in Thickness of the Aluminized Diffusion Layer at T=800� for 1 at.% Concentration of X Element.
Impurities γ Al/γ˚Al Thickness change
(Experiment)
Si ↓ ↓
Ti ↓ ↓
Ge ↓ ↓
Sb ↓ ↓
Mg ↓ ↓
Cu ↓ ↓
Ca ↓ ↓
Ag ↓ ↓
Cd ↓ ↓
Cr ↓ ↓
Co ↑ ↑
Zn ↑ ↑
Mn ↑ ↑
Ni ↑ ↑
Bi ↑ ↑
Pb ↑ ↑

28
1.4 Toughening Mechanisms of Composites
1.4.1 Toughening Mechanisms of Continuous Fiber Composites
In ductile metal matrix composites cracks initiate in the fiber/matrix interface,
which is a brittle reaction layer. In brittle matrix composites, the critical flaw size is
usually smaller than the fiber spacing, and cracks initiate in the matrix. Toughening of
these composites involves increasing the energy absorbed in crack growth.
Composite toughening mechanisms are based on microcrack branching in the
matrix and on debonding at the fiber/matrix interface [32]. The interface strength,
frictional load transfer, and fiber pull-out stresses should not be too high. Fibers provide
crack bridging behind the crack front either by pull-out or by ductile deformation [33,34].
Ductile fibers are used to toughen a brittle matrix. It has been suggested that for ceramic
matrix composites, a dual fiber coating is required with an inner coating controlling the
fiber/matrix debonding and an outer coating controlling the matrix interactions.

29
1.4.2 Toughening Mechanisms of Crack Arrester Type Laminated Metal
Composites (LMC)
• Crack deflection
In many laminate systems, layer delamination can occur ahead of an advancing
crack or as the result of a crack encountering an interface. These local delaminations can
result in crack deflection, which can significantly reduce the mode � component of the
local stress intensity because of the large deviations in crack path.
• Crack blunting
When the advancing crack encounters the ductile layer, the crack is deflected
and blunted. It is important that the crack deflection and blunting mechanisms are
independent of volume fraction, which implies that the fracture toughness should be
independent of volume fraction.
• Crack bridging
Unbroken individual layers span the wake of a crack. Growth of the crack
requires stretching of these bridging ligaments. It is important to recognize that for crack
bridging to occur, the bridging ligaments must have sufficient ductility to avoid fracture

30
at or ahead of the advancing crack tip. Thus crack bridging occurs when ductility or
toughness differences exist between the component layers.
• Stress redistribution
Delamination can provide toughening by reducing the stresses in the layers
ahead of the advancing crack. delamination was found to be more effective than slip in
reducing the stress ahead of the crack.

31
1.5 Role of Electroplated Coating
Electroplated coatings play an important role in metal joining processes such as
soldering, brazing and welding. Yardy[35] classifies coating for brazing and welding
applications into three main types:
1) Active coatings melt and then wet surfaces prior to joining components together
on solidification.
2) Passive coatings are pressed out of the joint on melting, expose and clean the
surface, thus allowing solid state bonding reactions to occur.
3) Barrier coatings neither melt nor are pressed out of the joint clearance. These
coatings form a physical barrier, which protects the substrate from combining
with molten solder or brazing alloy.
Electroplated coatings can be justified in the present investigation with two
different arguments: first, electroplated coatings can improve wetting characteristics at
the interface between metal insert and molten metal. Also, electroplated coatings can
protect inserts or act as a barrier to restrict the reaction between\n insert and molten metal.

32
2.0 EXPERIMENTS 2.1 Materials 2.1.1 A354 Aluminum Alloy
The initial work on potential strengthening materials for aluminum casting used
A354 aluminum alloy. A354 aluminum alloy contains 1.6 to 2% Cu, 0.4 to 0.6 % Mg,
less than 0.10% Mn, 8.6 to 9.5% Si, less than 2% Fe, less than 0.1% Zn and 0.l05% other
elements with balanced Al. A354 was originally used for permanent mold castings that
required high strengths and heat treatability. The coefficient of linear thermal expansion
is 11.6×10⁻⁶ in./in.·° F
2.1.2 Strengthening Materials and Preparation
Aluminum bronze, cast iron and Ni-Resist were evaluated as strengthening
material to reinforce aluminum.
Aluminum bronzes contain 9~14% Al, 0.75~4% Fe to refine grain structure and
increase strength, and lesser amount of manganese or nickel. Aluminum bronzes have
higher yield strength (450~900 MPa) and good corrosion and wear resistance.
Cast irons are multi-component ferrous alloy which solidifies with an eutectic.

33
They contain major (iron, carbon, silicon), minor (< 0.1%) and often alloying (>0.1%)
elements. Cast iron has higher carbon and silicon contents than steel. Because of the
higher carbon content, the structure of cast iron exhibits a rich carbon phase. The
coefficient of thermal expansion range 4~10.7×10⁻⁶ in./in.·°F
Ni-Resist is an austenitic cast iron containing 18~36% Ni, up to 7% Cu and
1.75~4% Cr. Ni-resist is used for heat-resistant and corrosion resistant applications.
Austenitic irons have the advantage of high toughness and thermal shock resistance.
Mechanical properties of Ni-resist are tensile strength of 400 ~ 470 MPa (58~68ksi),
yield strengths of 205~275MPa(30~40ksi), and elongations of 10~40%.
The strengthening materials use in this part of the investigation were disc-shape. The
dimensions of each discs are listed on the Table 5 and the thermal expansion coefficients
of A354 aluminum alloy, cast iron and Ni resist are listed on the Table 6.

34
Table 5: The Dimension of Discs
Material Diameter, in Thickness, in
Al Bronze 1.9 0.25
Cast Iron 2.3 0.25
Ni-Resist 2.0 0.27

35
Table 6: Thermal Expansion Coefficients of Materials
Material Temperature range ºF
Thermal expansion coefficient µin./in.·ºF
A354 Al Alloy 68~212 11.6
68~212 5.6
68~392 5.9
68~932 7.2 Cast Iron
68~1112 7.4
Ni-resist 70~400 10.7

36
2.1.2.1 Surface Treatments and Coatings
Most discs were used without any surface treatment or coating . Some cast iron
discs were used after either Dynablue(carbon nitriding) or the Kolene (surface) process.
Most discs were electroplated. The types of electroplated coatings were Zn, Cu,
and Ni and multi-plated coatings such as Cu / Ni or Ni / Cr. Some discs were used after
aluminizing treatment [36] by dipping into molten 380 aluminum alloys. The surface
treatments and coatings are listed on the Table 7.
2.1.2.2 Preparation
To set these discs in the mold, a hole was made at the center of disc; then these
discs were mounted on a ¼ inch threaded rod or set at the bottom of the mold. Figure 7
illustrates how the discs were set in the mold.

37
Table 7: Surface Treatments and Coatings of Discs
Disc Surface Treatment Coating
None Cu
Cu / Ni Ni / Cr Ni / Ni
Al Bronze None
Zn DynaBlue None
Cu Kolene
Cu / Ni None Cu
Cu / Ni Ni / Cr
Zn
Cast Iron
None
Aluminizing None Cu
Cu / Ni Ni-Resist None
Aluminizing

38
(a)
Mold
Disc
(b)
Mold
Disc
(c)
Figure 7: The methods to set discs in the mold

39
2.1.3 Meshes and Preparation
Galvanized carbon steel wire mesh and 304 type stainless steel wire mesh were
used as reinforcement to improve toughness of the compressor housing. The mesh count,
diameter of wire and wire spacing are on the Table 8. Stainless steel wire meshes were
used as either with electroplated Zn coating or without coating. To introduce multi-layer
meshes, meshes were stacked by nuts and bolts (Figure 8).

40
Table 8: Data of Stainless Steel wire meshes
Mesh Count [No of sq./in2]
Diameter of wire [in]
Wire Spacing [in]
4X4 0.047 0.25
5X5 0.041 0.2
6X6 0.035 0.166667
10X10 0.025 0.1
12X12 0.023 0.083333
14X14 0.02 0.071429
16X16 0.018 0.0625
18X18 0.017 0.055556
20X20 0.016 0.05
24X24 0.014 0.041667
30X30 0.01 0.033333

41
Figure 8(a) Sketch of mutilayer meshes
Figure 8(b) Picture of mutilayer meshes

42
2.2 Molds
No-bake sand molds were used for this part of the project. No bake sand molds
were made of silica sand with organic binders, LINO CURE AA-50 and LINO CURE C.
The mixing ratio of silica send and binders, LINO CURE AA-50 and LINO CURE C, is
50:0.75:0.15.
2.2.1 Molds for Strengthening
There are nine possible positions for discs in the mold. Six discs are along the
wall closest to the gate and furthest from the gate. Three discs are at the bottom of the
mold. The schematic of the mold, the position of the disc-inserts and the picture of the
mold are shown Figure 9(a) and 9(b). The discs along the walls are mounted on the 1/4”
threaded rod and held in place and separated from the wall by nuts (Fig. 7(a)). To set the
discs at the bottom, two kinds of method were used. One is making a sink by wood discs
when the mold was made (Fig. 7(b)). The other is using threaded rods and nuts after
making holes at the bottom of mold (Fig. 7(c)).
Molds with a smaller cavity were made with cores (Fig. 10). The volume of the
cavity is about 40% of that of normal mold. The dimension of gating system and raiser is
the same as that of normal mold.

43
Figure 9(a): The schematic feature of mold and position of disc-inserts
Figure 9(b) The picture of mold with discs

44
(b
)
(d
)
(a
)
(c
)
Figu
re 1
0 M
old
for
smal
l cas
ting
45
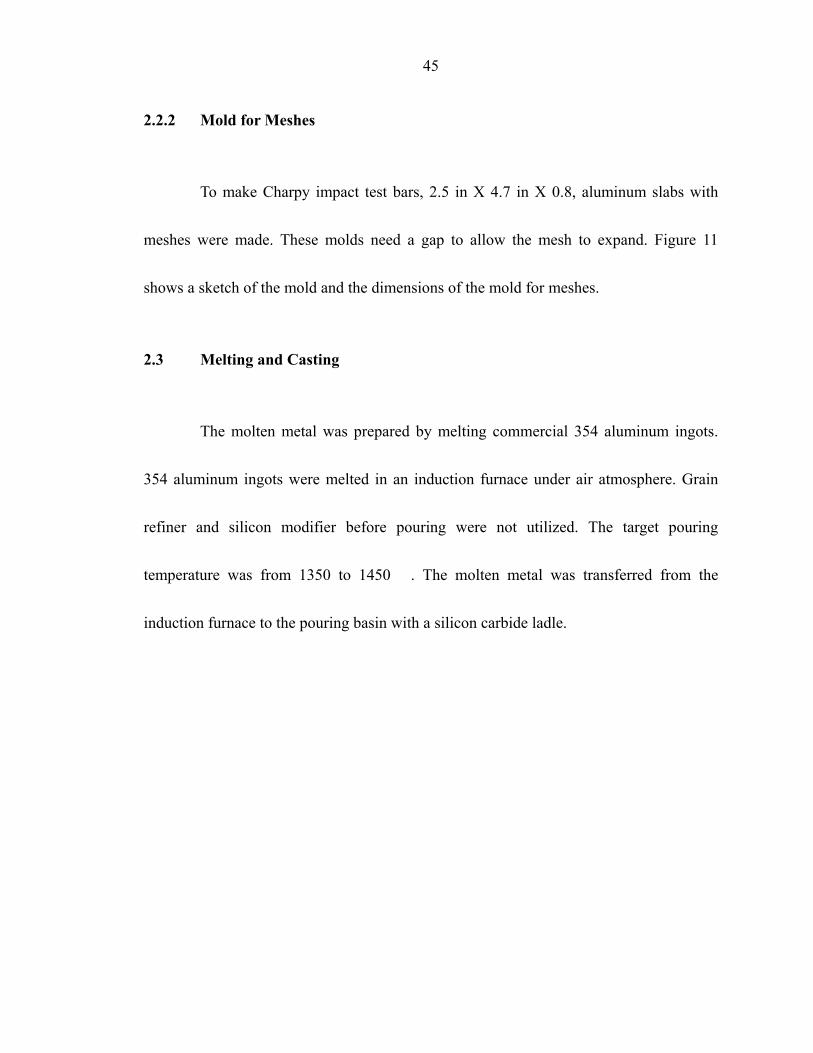
2.2.2 Mold for Meshes
To make Charpy impact test bars, 2.5 in X 4.7 in X 0.8, aluminum slabs with
meshes were made. These molds need a gap to allow the mesh to expand. Figure 11
shows a sketch of the mold and the dimensions of the mold for meshes.
2.3 Melting and Casting
The molten metal was prepared by melting commercial 354 aluminum ingots.
354 aluminum ingots were melted in an induction furnace under air atmosphere. Grain
refiner and silicon modifier before pouring were not utilized. The target pouring
temperature was from 1350 to 1450 �. The molten metal was transferred from the
induction furnace to the pouring basin with a silicon carbide ladle.

46
Riser
(a)
(b)
Figure 11: Sketch of mold and dimension of casting

3.0 RESULT AND DISCUSSION
3.1 Analysis of Aluminum Bronze Reinforced Aluminum Casting
Figure 12 is the part of a casting with metallic inserts and shows how the casting
was cut. The disc-shape inserts were cut horizontally through the center. Figure 13(a)
shows the cross section of the aluminum bronze insert in the casting. The aluminum
bronze insert is dissolved and has poor bonding. Figure 13(b) to Figure 13(e) show the
pictures of the cross section of aluminum bronze inserts with Cu, Ni, Cu/Ni, and Zn
electroplated coatings. None of electroplated coatings can protect the insert from
dissolving.
3.1.1 Dissolution of Aluminum Bronze
Dissolution plays one of the important roles in bonding of dissimilar metals.
However severe dissolution of inserts could be a problem in cast-in-place reinforcement.
Figure 14 shows the cross section of a cast iron insert. The aluminum bronze disc was
dissolved more severely than the cast iron disc. Temperature, time, volume of the liquid,
and solubility of solid phases in the liquid phase can affect the dissolution of inserts. As
the temperature is increased, generally the solubility of solute elements is also increased.
47

48
Time is related to the dissolution kinetics. As the time is longer, the quantity of dissolved
elements is increased. Higher Cu solubility in liquid Al can explain severe dissolution of
aluminum bronze in the aluminum alloy. Figure 14(a) and (b) are phase diagrams of Al-
Cu and Fe-Al binary system, respectively. If the temperature of molten aluminum is
660°C (1220°F), the maximum solubility of Cu and Fe in aluminum liquid is about 60
and 2-wt%, respectively.
Figure 13(b) to Figure 13(e) show cross-sections of aluminum bronze inserts
with Cu, Ni, Cu/Ni, and Zn electroplated coatings. Even though nickel and copper have
higher melting temperature than aluminum, electroplated coatings could not protect the
aluminum bronze inserts. During the casting process the electroplated coatings may be
dissolved into the molten aluminum. Because the thickness of electroplated coatings is
not enough to remain on the surface and protect the inserts, none of coatings could
protect the aluminum bronze inserts from dissolving.
3.1.2 Metallurgical Analysis of Interface
Figure 16 shows optical micrographs of the interface between aluminum bronze
and the A354 aluminum cast alloy. There is an intermediate layer, which may be formed
by dissolution of the aluminum bronze insert, between the aluminum bronze and the

49
aluminum alloy. A good metallurgical bonding exists between these layers. Faster cooling
rates and lower temperatures may reduce the dissolution of aluminum bronze, and may
result in establishing a good bonding between aluminum bronze and A354 alloy.

50
Cutting Line
Figure 12: Casting with metallic inserts and cutting line
Figure 13(a:) Cross section of aluminum bronze insert

51
Figure 13(b): Cross section of an aluminum bronze insert with Cu Electroplating
Figure 13(c): Cross section of an aluminum bronze insert with heavy Ni

52
Electroplating
Figure 13(d): Cross section of an aluminum bronze insert with Cu/Ni Electroplating
Figure 13(e): Cross section of an aluminum bronze insert with Zn Electroplating

53
Figure 14: Cross section of a cast iron insert

54
Figure 15(a) Phase diagram of Al-Cu binary system
Figure 15(b) Phase diagram of Fe-Al binary system

55
Aluminum Alloy
IntermediateLayer
Al Bronze
Figure 16(a): Optical microscope picture of the interface between Al bronze and aluminum alloy

56
Aluminum
Alloy Intermediate
Layer
Figure 16(b): Optical microscope picture of the interface between the intermediate
layer and the aluminum alloy
Intermediate Layer
Aluminum Bronze
Figure 16(c): Optical microscope picture of the interface between the Al bronze and
the intermediate layer
57
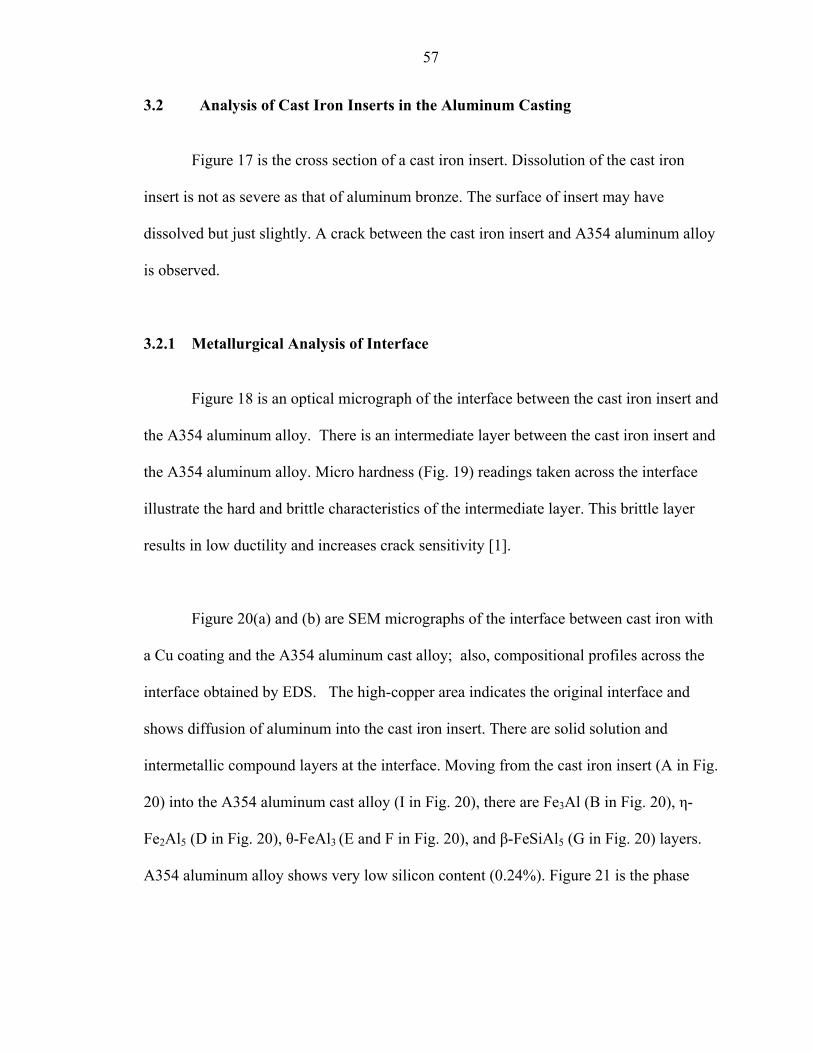
3.2 Analysis of Cast Iron Inserts in the Aluminum Casting
Figure 17 is the cross section of a cast iron insert. Dissolution of the cast iron
insert is not as severe as that of aluminum bronze. The surface of insert may have
dissolved but just slightly. A crack between the cast iron insert and A354 aluminum alloy
is observed.
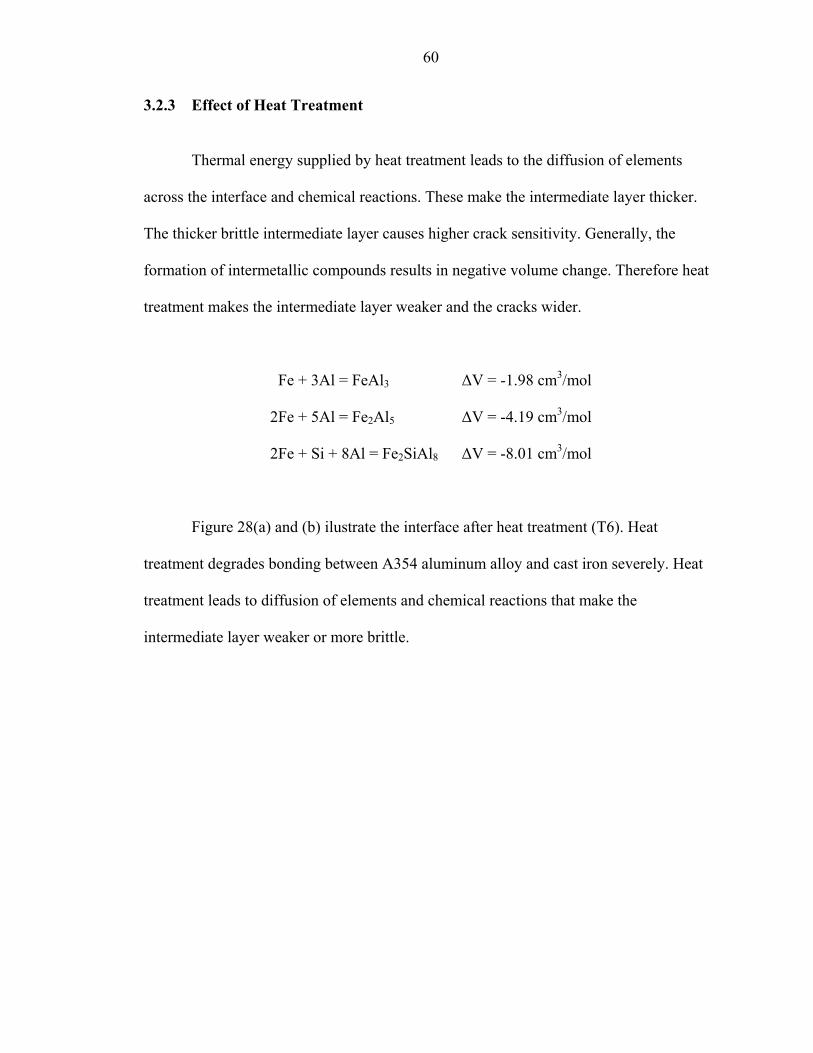
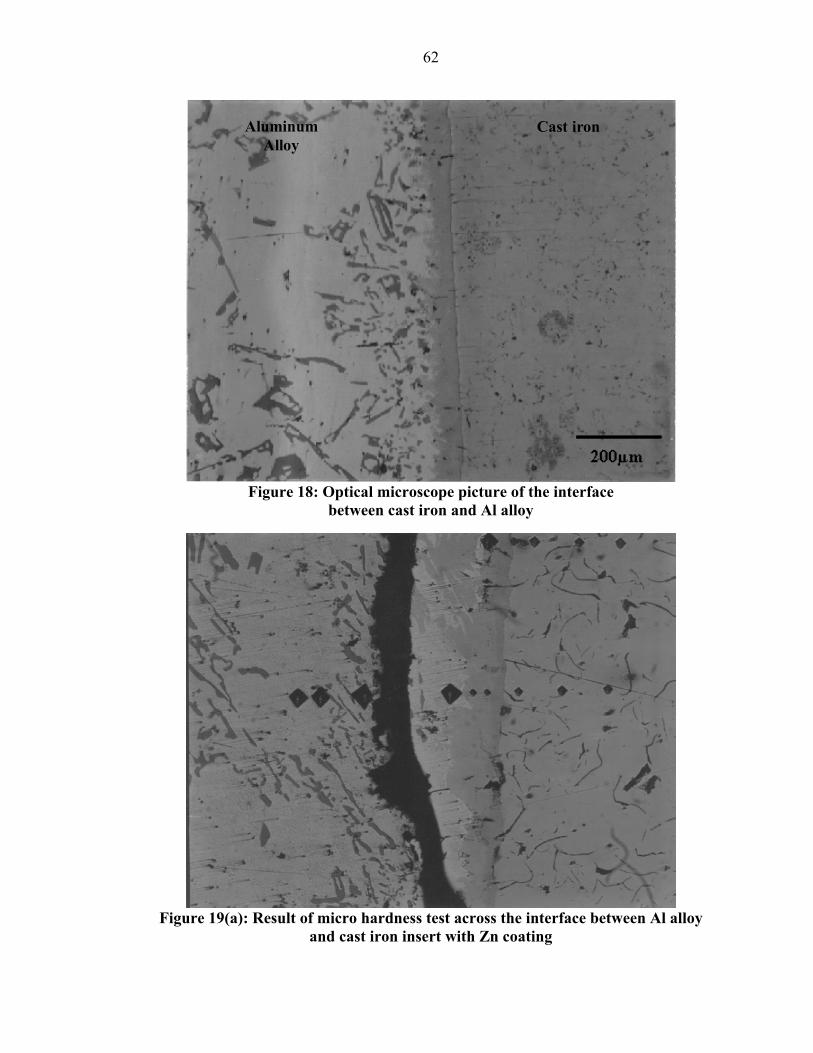
3.2.1 Metallurgical Analysis of Interface
Figure 18 is an optical micrograph of the interface between the cast iron insert and
the A354 aluminum alloy. There is an intermediate layer between the cast iron insert and
the A354 aluminum alloy. Micro hardness (Fig. 19) readings taken across the interface
illustrate the hard and brittle characteristics of the intermediate layer. This brittle layer
results in low ductility and increases crack sensitivity [1].
Figure 20(a) and (b) are SEM micrographs of the interface between cast iron with
a Cu coating and the A354 aluminum cast alloy; also, compositional profiles across the
interface obtained by EDS. The high-copper area indicates the original interface and
shows diffusion of aluminum into the cast iron insert. There are solid solution and
intermetallic compound layers at the interface. Moving from the cast iron insert (A in Fig.
20) into the A354 aluminum cast alloy (I in Fig. 20), there are Fe3Al (B in Fig. 20), η-
Fe2Al5 (D in Fig. 20), θ-FeAl3 (E and F in Fig. 20), and β-FeSiAl5 (G in Fig. 20) layers.
A354 aluminum alloy shows very low silicon content (0.24%). Figure 21 is the phase

58
diagram of Al-Si binary system. Because silicon precipitates as silicon particles, the Si
content in the aluminum solution is very low.
3.2.1.1 The Role of Surface Treatments and Coatings
The interface of the A354 aluminum alloy and a cast iron insert after a carbo-
nitriding process is shown Figure 22. No bonding occurred between the cast iron and the
Al alloy. The following facts may cause this poor bonding. First, the cast iron insert does
not dissolve. No intermediate layer formed between the two metals. It is difficult to
establish a good bond between an insert and aluminum alloy without some dissolution or
reaction between them.
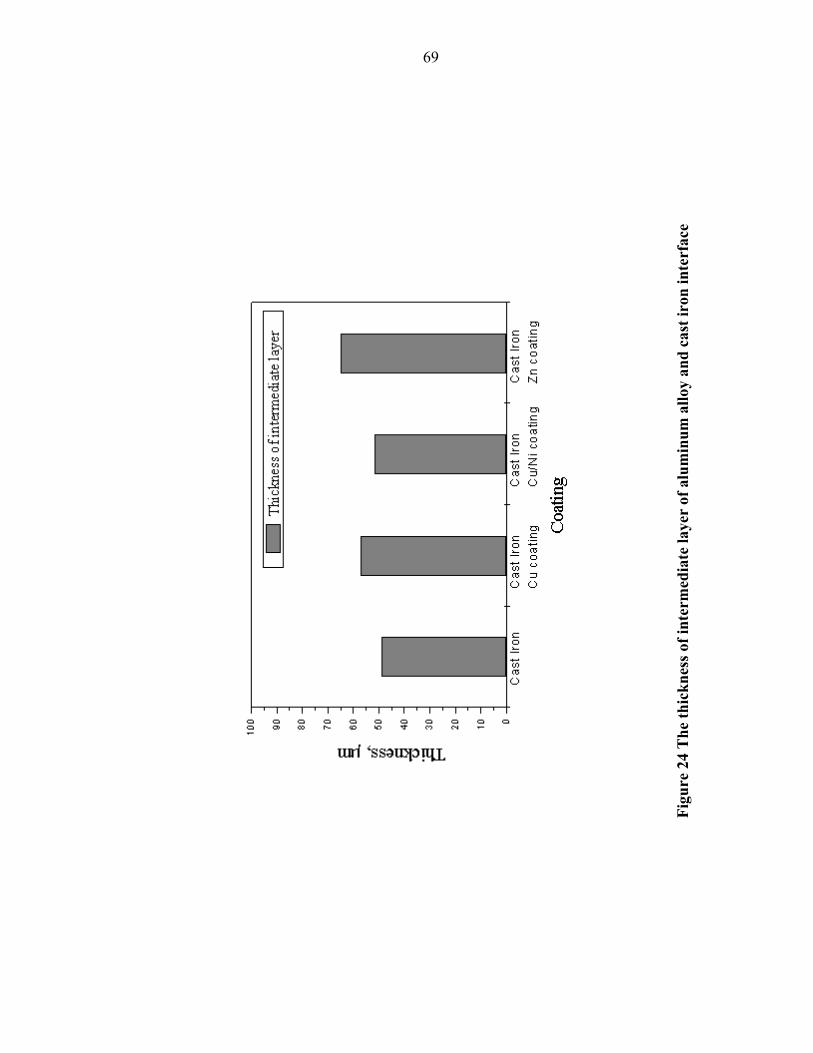
Figure 23(a) to (e) exhibit interfaces between A354 aluminum alloy and cast iron
with Al, Cu, Cu/Ni, Ni/Cr and Zn coatings. Various kinds of electroplated coatings were
employed. However the interface features are similar to each other. Figure 24 shows a
thickness of the intermediate layer between 50 to 60 µm. The effect of electroplated
coatings on the thickness of intermediate layer is not significant in this case.
Figure 25(a) and (b) are optical micrographs of the interface between A354
aluminum alloy and cast iron insert after a Kolene process with Cu and Cu/Ni coatings.
Removing graphite from the surface of the cast iron inserts did not exert any significant
differences from interface of cast iron.

59
3.2.2 Thermal Expansion Coefficient, Residual Stresses and Failure of Bonding
The thermal expansion coefficients of the alloys used are different from each
other. The thermal expansion coefficient of A354 aluminum cast alloy is higher than that
of cast iron. During the casting process, both cast iron and A354 aluminum cast alloy
were cooled from high temperature. Because of differences in the thermal expansion of
the cast iron insert and A354 aluminum cast alloy residual stresses form around the
insert. When cast iron inserts are utilized in the aluminum casting, the residual stress does
not degrade the interface seriously. Because of the higher thermal expansion coefficient
of A354 aluminum cast alloy, there are compressive stresses around the cast iron insert
(Fig. 26(a)). However, when the interface is opened, the residual stresses can degrade the
bonding (Fig. 26(b)).
3.2.2.1 Effect of Electroplated Coatings
Failure of the bonding should occur at the weakest site across the interface. The
failures of the interface between the cast iron inserts and the A354 aluminum cast alloy
can be classified into two groups. The first group is failure at the intermetallic compound
layer. In most cases, such as interfaces between A354 alloy and cast iron inserts with Ni,
Cu/Ni, and Al coatings, these interfaces fail at the intermetallic compound layer (Fig.
27(a)). Another type of failure occurs in the A354 aluminum alloy, near the interface.
Zinc and Copper coated inserts belong to this group (Fig. 27(b)).
60
3.2.3 Effect of Heat Treatment
Thermal energy supplied by heat treatment leads to the diffusion of elements
across the interface and chemical reactions. These make the intermediate layer thicker.
The thicker brittle intermediate layer causes higher crack sensitivity. Generally, the
formation of intermetallic compounds results in negative volume change. Therefore heat
treatment makes the intermediate layer weaker and the cracks wider.
Fe + 3Al = FeAl3 ∆V = -1.98 cm3/mol
2Fe + 5Al = Fe2Al5 ∆V = -4.19 cm3/mol
2Fe + Si + 8Al = Fe2SiAl8 ∆V = -8.01 cm3/mol
Figure 28(a) and (b) ilustrate the interface after heat treatment (T6). Heat
treatment degrades bonding between A354 aluminum alloy and cast iron severely. Heat
treatment leads to diffusion of elements and chemical reactions that make the
intermediate layer weaker or more brittle.

61
Figure 17: Cross section of cast iron insert
62
Aluminum
Alloy Cast iron
Figure 18: Optical microscope picture of the interface
between cast iron and Al alloy
Figure 19(a): Result of micro hardness test across the interface between Al alloy
and cast iron insert with Zn coating

63
-200 -100 0 100 2000
200
400
600
800
1000
Intermediate layer
Cast iron Disc
Al
Har
dnes
s,VH
Distance, µm
Hardness
Figure 19(b): Micro hardness across the interface between Al alloy
and cast iron insert
Cast Iron
Al Alloy
Figure 20(a): SEM picture of interface between A354 Al alloy and cast iron with Cu coating

64
0
10
20
30
40
50
60
70
80
90
100
A B C D E F G H I
Location of the Interface (See Letters in Figure 19(a))
Ato
mic
Per
cent
, %AlFeSiCu
Figure 20(b): Compositional profile across the interface between A354 Al alloy
and cast iron with Cu coating

65
Figure 21: Phase diagram of Al-Si binary system

66
Al Alloy Cast iron
Figure 22: Interface of A354 aluminum cast alloy
and cast iron with carbo nitriding
Al Alloy Intermediate
Layer Cast Iron
Figure 23(a) Interface of A354 Al alloy and cast iron after aluminizing

67
Al Alloy
Intermediate Layer
Cast Iron
Figure 23(b) Interface of A354 Al alloy and cast iron
with electroplated Cu Coating
Al Alloy
Intermediate Layer
Cast Iron
Figure 23(c): Interface of A354 Al alloy and cast iron
with electroplated Cu/Ni Coating

68
Cast Iron Al Alloy
Figure 23(d): Interface of A354 Al alloy and cast iron
with electroplated Ni/Cr Coating
Intermediate Layer
Cast Iron Al Alloy
Figure 23(e) Interface of A354 Al alloy and cast iron
with electroplated Zn Coating
69
Figu
re 2
4 T
he th
ickn
ess o
f int
erm
edia
te la
yer
of a
lum
inum
allo
y an
d ca
st ir
on in
terf
ace

70
Intermediate Layer
Cast Iron
Al Alloy
Figure 25(a): Interface between A354 Al alloy and cast iron
after Kolene process with Cu coating
Intermediate Layer
Cast Iron
Al Alloy
Figure 25(b): Interface between A354 Al alloy and cast iron
after Kolene process with Cu/Ni coating

71
Figure 26(a): Cast iron insert utilized in the aluminum casting
Figure 26(b): Degrading of the interface by different thermal contraction of A354 Al alloy and cast iron insert
Low Temperature
A354
Cast Iron
High Temperature
A354
Cast Iron
Low Temperature
High Temperature
A354 Al Alloy
Crack
Cast Iron

72
Al Alloy
Cast Iron
Intermediate Layer
Figure 27(a): Crack in the intermediate layer
Al Alloy
Cast Iron
Intermediate Layer
Figure 27(b): Crack in the Al alloy

73
Intermediate Layer
Cast Iron
Al Alloy
Figure 28(a): Interface between A354 and cast iron with Cu/Ni coating
after heat treatment
Intermediate LayerCast Iron Al Alloy
Figure 28(b): Interface between A354 and cast iron with Zn coating
after heat treatment

73
3.3 Analysis of Ni-Resist Inserts in the Aluminum Casting
3.3.1 Metallurgical Analysis of Interface
Figures 29 and 30 show the interface between the A354 aluminum cast alloy and
a Ni-resist insert. The structure of this interface is similar to that observed for cast iron
inserts. However the graphite of the Ni-resist remains at the interface with the aluminum
alloy after casting. The thermal expansion coefficient of the Ni-resist is close to the A354
aluminum alloy.
3.3.2 Effect of Heat Treatment on Bonding Strength
The bonding strength of A354 alloy to Ni-Resist is affected by heat treatment.
Figure 31(a) is the small casting with Ni-resist insert and Figure 31(b) shows some shear
test specimens and how the shear test specimens were made. The shear test results are
listed in Table 9. The average shear strength of the bond in the as cast and T5 heat-treated
specimens shows better results than the T6 heat-treated specimens. The scatter in these
results is wide, indicating the variation in the properties of the bond. These results
suggest the diffusion of elements and subsequent chemical reactions occurring during the
T6 heat treatment degrades the strength of the bond between A354 and Ni-Resist. The
T5 heat treatment somewhat improves bonding and reduces residual stresses.

74
Figure 29: The interface between A354 Al alloy
and Ni-Resist insert
Figure 30: The interface between A354 Al alloy
and Ni-Resist insert with Al coating

75
Figure 31(a): Small casting with Ni-resist insert
Figure 31(b) Shear test specimens

76
Peak
Stre
ss
ksi
2.5
1.5
2.4
3.2
2.4
1.1
0.4
3.6
1.8
2.7
1.92
3.
8 0.
7 2.
3 0.
9 4.
0 1.
6 2.
6 2.
27
Peak
Loa
d Lb
f
643.
787
378.
573
613.
554
814.
242
612.
539
272.
633
92.3
66
911.
865
446.
757
676.
715
480.
067
953.
447
167.
968
584.
375
221.
615
997.
958
411.
995
657.
661
570.
717
Are
a In
2
0.25
0.25
0.25
Wid
th
In
0.5
0.5
0.5
Thic
knes
s In
0.5
0.5
0.5
Spec
imen
N
o.
1 2 3 4 A
vera
ge
1 2 3 4 5 A
vera
ge
1 2 3 4 5 6 7 A
vera
ge
Tab
le 9
She
ar T
est R
esul
ts o
f Ni-R
esis
t Ins
ert i
n th
e Sm
all C
astin
g [N
ote
the
larg
e sc
atte
r]
Hea
t Tr
eatm
ent.
As c
ast
T6
T5

77
3.4 Analysis of Mesh Reinforced Aluminum Castings
3.4.1 Metallurgical Analysis of Interface
Figure 32 (a) and (b) show optical micrographs of the cross section of zinc-coated
stainless steel wire. The intermediate layer between the stainless steel wire and aluminum
alloy has a thickness of 20µm. Some cold-shut defects are present near the wire. Bonding
between the stainless steel wire and intermediate layer is good but poor bonding occurs
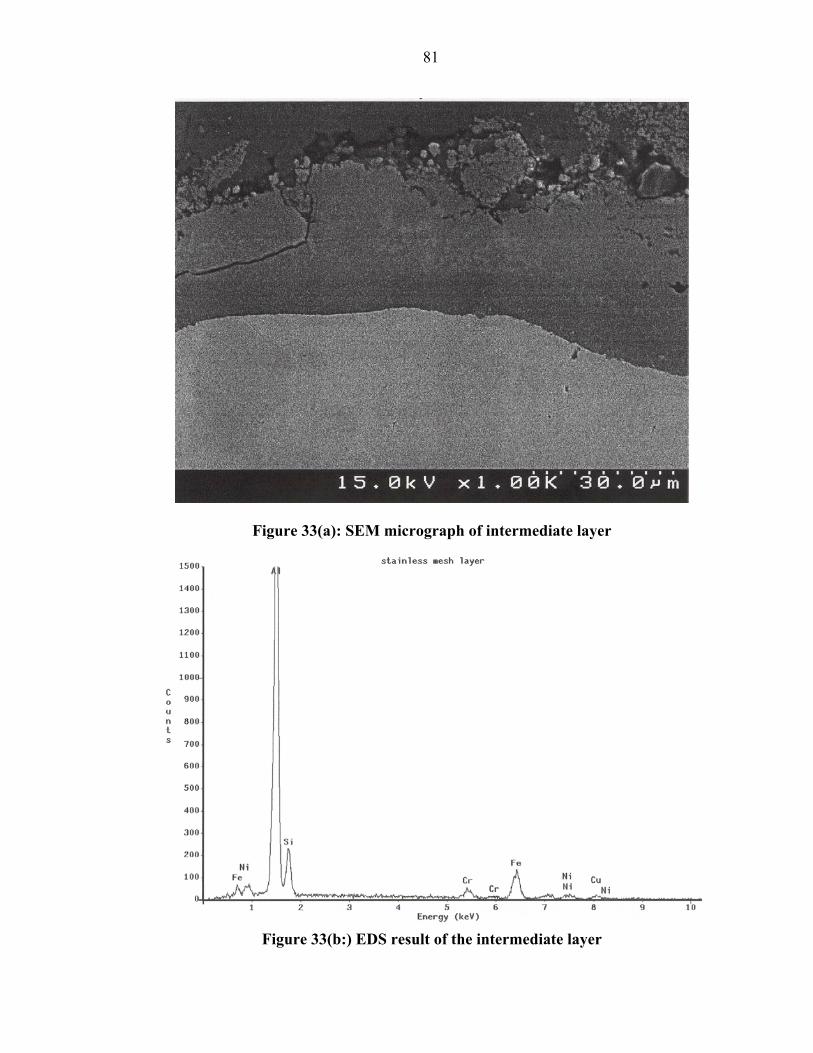
between the aluminum alloy and intermediate layer. Figure 33(a) and (b) are SEM
micrographs of the intermediate layer between the stainless steel wire and A354
aluminum cast alloy and EDS result of the intermediate layer. The intermediate layer is
an Fe-Si-Al intermetallic compound with Cr and Ni from the stainless steel wire. Figures
34(a) and (b) illustrate the structure of the stainless steel wire with and without a Zn
coating after heat treatment. Heat treatment degrades the interfacial bonding between
stainless steel and A354 alloy because of the diffusion and subsequent chemical reactions.
3.4.2 Results of Charpy Impact Test
Figure 35 shows the Charpy V-notch impact energy of A354 aluminum cast alloy
and a galvanized steel wire mesh reinforced aluminum alloy. These results indicate that
the lower fracture strength galvanized steel wire mesh do not improve the toughness of
aluminum casting. Because the ductile-brittle transition temperature of steel occurs at
higher than room temperature, the steel wire fails in a brittle manner.

78
Data on stainless steel meshes with Zn coating and the impact test results are
listed in Table 10. The mesh count is the number of squares per square inch. As mesh
count is increased, the wire diameter of mesh is decreased and the number of wires in the
cross section of the impact specimen is increased. Generally, as the mesh count is
increased, the area fraction of wire is decreased (Fig. 36). Figure 37 shows impact test
results with varying mesh count. A354 aluminum alloy reinforced by 14X14 mesh
exhibits the best results. Figure
38 demonstrates how the impact
test results vary with the area
fraction of the wire. Generally, as
area fraction of wire is increased,
the impact strength also is
increased. Consequently, the
14x14 mesh wire has the highest
fracture energy in Figure 38.
0.4 in
0.4 in
Wire
Cross section of specimen
D
Area Fraction Af = 4.04.0)2/()( 2
×× DwireofNumber π
Impact test results with multiple mesh layers, coatings and heat treatment are
listed in Table 11. Figure 39 shows improvement in toughness of casting reinforced by
two mesh layers. As the number of mesh layer increases the toughness of the casting
should increase. The lower toughness of the casting reinforced with a Zn coated stainless
steel wire mesh can be explained by poor aluminum casting quality.
Since the interface properties affect the toughness of reinforced materials,
toughness of reinforced aluminum casting should vary with heat treatment. Figure 40

79
illustrates the effect of heat treatment on impact test result. These results are the average
of five tests with minimum scatter. Overall, heat treatment improves the toughness of
mesh-reinforced aluminum castings. Toughening can be achieved by improving the
toughness of the aluminum alloy and the bonding strength of the interface. Optimized
interface bonding strength improves the toughness of reinforced materials. However,
since the interface between aluminum and stainless steel is degraded by heat treatment
(Fig.34), the improvement of toughness is mainly due to that of aluminum casting itself.

80
Figure 32(a): Optical microscope picture of stainless steel wire
Figure 32(b): Optical microscope picture of stainless steel wire mesh
81
Figure 33(a): SEM micrograph of intermediate layer
Figure 33(b:) EDS result of the intermediate layer

82
Figure 34(a:) Stainless wire with Zn coating after heat treatment
Figure 34(b:) Stainless steel wire without coating after heat treatment

83
0.0
0.5
1.0
1.5
2.0
2.5
3.0
3.5
4.0
Galvanized Steel Wire Mesh (4x4)
A354Baseline
Impact Strength
Impa
ct S
treng
th, f
t-lb
Figure 35: Impact Energy of A354 Aluminum alloy and casting reinforced by galvanized steel wire mesh

84
Im
pact
Ene
rgy
[ft-l
b]
3.08
4.83
5 5.4
4.6
4.67
4 4.17
3.4
Are
a Fr
actio
n of
Wire
0
0.01
7349
0.01
6503
0.01
4432
0.01
2272
0.01
2464
0.01
0996
0.01
0179
0.01
0214
0.01
0053
0.00
9236
0.00
589
No
of W
ire p
er
0.16
in2
0 1.6 2 2.4 4 4.8
5.6
6.4
7.2 8 9.6 12
Wire
Dia
met
er
[in] 0
0.04
7
0.04
1
0.03
5
0.02
5
0.02
3
0.02
0.01
8
0.01
7
0.01
6
0.01
4
0.01
Tab
le 1
0 D
ata
on M
eshe
s and
Impa
ct E
nerg
y
Mes
h C
ount
[N
o. o
f Sq.
/in2 ]
0x0
4x4
5x5
6x6
10x1
0
12x1
2
14x1
4
16x1
6
18x1
8
20x2
0
24x2
4
30x3
0

85
Figu
re 3
6 A
rea
frac
tion
with
var
ying
mes
h co
unt

86
0 2 4 6 8
0.0
0.5
1.0
1.5
2.0
2.5
3.0
3.5
4.0
4.5
5.0
5.5
6.0
6.5
7.0
30x3024x2420x2018x1816x1614x1412x1210x10BaseLine
Impact Strength, ft-lb
Impa
ct E
nerg
y, ft
-lb
Mesh Count, No. of Sq./in.2
Figure 37: Impact energy with varying mesh count

87
Figu
re 3
8 E
ffec
t of a
rea
frac
tion
of w
ire
on Im
pact
Ene
rgy

88
Stan
dard
D
evia
tion
0.68
0.35
0.61
0.54
0.62
1.10
0.63
0.40
Impa
ct S
treng
th
Ft-lb
3.25
2.73
3.62
3.91
4.14
5.70
3.25
5.50
Hea
t Tre
atm
ent
As-
cast
T6
As-
cast
T6
As-
cast
T6
As-
cast
T6
Coa
ting
No
No
Zn
Zn
No
No
Zn
Zn
Tab
le 1
1 Im
pact
Tes
t Res
ults
Num
ber o
f Lay
er
1 1 1 1 2 2 2 2

89
0 1 2 3 4 5 6 7 8 90
1
2
3
4
5
6
7
1Layer
0 1 2 3 4 5 6 7 8 90.0
0.5
1.0
1.5
2.0
2.5
3.0
3.5
4.0
4.5
5.0
5.5
6.0
6.5
7.0
T6As-castT6As-castZn coatingNo coating
2 Layer
Impa
ct S
treng
th, f
t-lb
Figure 39: Effect of number of layer

90
0 1 2 3 4 5 6 7 8 9
0.0
0.5
1.0
1.5
2.0
2.5
3.0
3.5
4.0
4.5
5.0
5.5
6.0
6.5
7.0
Zn coatingZn coating No coatingNo coating2 Layer1 Layer
T6
Impa
ct S
treng
th, f
t-lb
0 1 2 3 4 5 6 7 8 9
0
1
2
3
4
5
6
7
As-cast
Figure 40: Effect of Heat Treatment

91
4.0 CONCLUSIONS
• Aluminum bronze inserts
o Aluminum bronze inserts dissolved severely in A354 aluminum cast alloy.
o None of electroplated coating could protect aluminum bronze inserts from
dissolving.
• Ferrous metal inserts
o A Fe-Si-Al intermetallic compound layer forms between ferrous inserts
and the Al-Si alloy. This intermetallic compound layer decreases ductility
and increases crack-sensitivity of the bond.
o None of electroplated coating could avoid the formation and growth of the
intermetallic compound layer.
o Because the thermal expansion coefficient of Ni-resist is similar to that of
A354 Al alloy, the interface of Ni-resist and A354 shows better bonding
than the interface of cast iron and A354.
o The difference in the thermal expansion coefficients between the
reinforcements and the aluminum alloy matrix cause degradation of the
bond during heat treatment .
• Wire mesh reinforced castings
o The toughness of mesh- reinforced casting can be improved by optimizing
the interfacial bonding strength.
o A higher area fraction of stainless steel wire improves toughness.

92
PART 2: REINFORCEMENT OF SQUEEZE CAST ALUMINUM
5. 1 PROCEDURE AND EXPERIMENTS
A practical approach to reinforcement of die cast aluminum components is to use a
reinforcing steel preform. Such performs can be fabricated from steel wire mesh or
perforated metal sheet by stamping or deep drawing. A hemispherical, dome shaped
casting was selected in this investigation. A deep drawing die was used to fabricate the
reinforcing performs. The dimensions of the dies that were used to produce the 6 inches
diameter hemispherical casting are shown in Figures 41 A and B. This shape was cast in
356 aluminum that was injected into the die as shown in Figure 42. These castings were
all tested in the as cast condition without heat treatment. The squeeze casting was
performed under two pressures at 7,600 psi and 17,000 psi, both with and without
reinforcement. The appearances of the three types of reinforcement used in this
investigation are shown in Figures 43 A and B. These steel meshes were formed into a
dome shape to fit within the aluminum casting. Figure 44 illustrates the shape of these
steels performs as they were prepared. The stainless steel wire mesh could be formed to
the dome shape without any annealing process whereas some of the punched stainless
steel sheets had to be annealed before deformed to the final shape or else the wires would
break. The 1020 low carbon steel had to be annealed in all cases to avoid fracture during
its deformation.

93
The reinforcement of the castings was accomplished by using either a 304 stainless
steel wire mesh with a 0.075 inch diameter, a 1020 ferritic steel wire mesh with a 0.094
inch diameter or a 304 stainless steel punched sheet. Both the stainless steel and the 1020
ferritic steel wire mesh were made with 4 wires by 4 wires per inch square. The punched
stainless steel sheet has a thickness of 0.055inch and 0.15inch diameter of punched holes
with a connection space of 0.032 inch. The relative weights of the punched 304 stainless
steel sheet, wire mesh of 304 stainless steel and 1020 unalloyed steels are shown in Figure
45. The different weights of materials influenced the weight of the casting as shown in
Figure 46. The parts were radiographically examined before testing as shown in Figure
47. This method was used to determine the soundness of the casting both with and
without the reinforcing steel.
The dome castings were then tested with internal water pressure in a special device
shown in Figure 48 to determine their internal pressure tightness. The pressure testing rig
includes an "O" ring, clamps and bolts that clamp the flange of the hemispherical casting
to a steel plate during application of the internal water pressure. As shown in Figure 8,
five of the reinforcing bolts around the outside diameter are missing. These bolts are
installed when the actual tests are taken. The sketch at the left shows the 12 holes used for
holding the rim of the hemisphere in place. A significant load was needed to fracture
these castings through this area as shown in Figure 49 for non-reinforced and reinforced
castings. This type of testing was not employed for the parts made with annealed
unalloyed steel mesh and punched stainless steel sheet.

94
Numerous castings of each type were tested by holding these castings in a large
Instron testing machine with a matching hemispherical rim and head that fitted inside of
the hemisphere. Figure 50 shows the equipment, and parts used in this testing. These tests
were conducted by mechanical loading of the hemisphere so that the testing and fracture
of the material could be monitored and recorded with a computerized data acquisition
system. This set-up is shown in Figure 50, with the actual machine shown on the right
side. The left hand top figure shows the set up in the machine and the die and hemispheric
head are shown at the bottom left.
Some work was also conducted to test the impact resistance of 354 aluminum casting.
This work involved various meshes of stainless steel from small to large including a 0.25"
diameter stainless steel bar inside of the bar with the dimension shown in Figure 51.
5.2 RESULTS AND DISCUSSION
The results of the internal pressure testing indicated that sound castings fractured
under a internal pressure of about 700-800psi whether they were reinforced or un-
reinforced. Once this fracture started, the water leaked out and the test was terminated.
Hemispheres of 356 aluminum with internal ferritic wire and punched stainless steel sheet
were not used in this internal pressure testing. This test measures the strength of the

95
material in its ability to withstand internal liquid pressure rather than testing the ability of
the castings to absorb impact and contain flying objects inside the casting as required
from an enclosure.
Applying a load with a hemispherical plunger head inside of the casting provided a
more realistic test of the ability of the casting to resist applied forces without completely
fracturing. This behavior is more significant for utilization in service. It became apparent
that the fracture of the part with the wire mesh and with a punched stainless steel material
required either a higher fracture energy or a higher fracture load. The relative load
maxima shown in Figures 52 and 53 show the effect of the reinforcement. Figure 52
shows the load at lower pressure of 7,600 psi. It is noted that the area under the load-
displacement curve of the reinforced castings is significantly higher than that the area
under the nonreinforced casting. A similar behavior is noted in Figure 53 where the
material has been produced with a higher pressure at 17,000 psi. In this case, a higher
pressure was employed during squeeze casting. The best results were obtained with the
reinforced stainless steel punched sheet The areas under the load-dispacement curve are
shown in Figure 54 for the lower pressure (7,600 psi) and in Figure 55 for the average
results at the higher pressure at 17,000 psi. It is noted that the higher strength and energy
obtained with the increased pressure is apparent in these results.
The reason reinforced castings could withstand higher loads is illustrated in Figure 56. In
the case of the reinforced castings even after a crack is initiated, significant deformation of

96
the reinforcement takes place before separation of the broken casting. The unreinforced
castings usually break at the radius of the hemispherical edge. The broken parts of the
casting could be readily separated. However, the stainless steel wire reinforced castings
held together better and the parts remained attached. Some reinforcement effect was also
provided by the austenitic stainless steel mesh. However, he relative strength of these
parts before fracture was less than shown for the punched sheet. This behavior is
illustrated in Figures 53 and 56 where the wire maintains the casting in one piece.
Utilizing meshes to reinforce the hemispherical dome provided the maximum area
under the load-displacement curve as shown in Figures 54 and 55. In the case of Figure
55, the maximum fracture energy was higher for the stainless steel wire mesh
reinforcement, followed by the hard punched stainless sheet. The non-reinforced materials
and the soft punched stainless sheet were definitely inferior. The difference between the
soft and hard punched stainless sheet arose from the processing of this material. Some of
the punched stainless steel sheets fractured during forming into the dome shape. For this
reason, some of these had to be annealed to obtain the final shape. It is apparent that the
residual compressive stress in the stainless steel sheet tested before annealing increased
the strength of these parts, as shown in Figures 53 and 55.
The stainless steel wire mesh reinforcement maintained the casting in one piece even
after cracking was initiated, and the wire mesh stretched over a considerable period. This
behavior was demonstrated in several tests. It is also apparent that the slope of the load

97
application is much steeper with the wire reinforcement. Even when the reinforced casting
breaks, the wire reinforcement maintains the casting in one piece, making it an effective
enclosure for confining parts that are moving inside. This arrangement will prevent
internal components from escaping.
The greater fracture strength and impact resistance of the stainless steel reinforced
material is also shown by means of the regular Charpy impact test which has been
prepared with and without the use of wires for reinforcement. The test without the
reinforcement in 354 alloy fractures at about 3-foot pounds, whereas the presence of a
large diameter wire of 0.250 inch diameter greatly increases the impact strength to 120
foot pounds for each unit as shown by the attached Figure 57.

98
5.3 CONLUSIONS
1. Aluminum castings were reinforced with hard stainless steel punched sheet or wire
mesh of 0.075 inch 304 stainless steel with a high hardness and a 4 x 4 mesh per
square inch. The mesh wire reinforced castings are superior in maintaining the
integrity of the casting after fracture initiation relative to un-reinforced castings.
2. The reinforcement with soft stainless steel punched sheet produced a smaller
increase in strength.
3. When casting with an austenitic stainless steel mesh reinforcement fracture, the
broken parts of the casting still remain together. The reinforcement provides a
definite resistance to the escape of any parts that are loose or flying apart inside of
the casting.

99
Figure 41a: Ejector insert for metal reinforced aluminum dome casting
Figure 41b: Cover insert for metal reinforced aluminum dome casting

100
Figure 42: Design of 6” diameter hemispheric casting
(a) Top View with the Ejection Pin (b) Bottom View
Ejection Pins

101
Figure 43a: AISI 304 Stainless wire mesh and punched sheet
The wires are a 4 X 4 Mesh Per Square InchWith a 0.075 in. Diameter of the Wire
The diameter of the punched hole is 0.15 in. with aThickness of 0.055 in. and 0.032 in. between holes
Figure 43b: Unalloyed 1020 steel wire mesh
The wires are a 4 X 4 Mesh Per Square Inchwith a 0.094 in. Diameter of the Wire

102
Figure 44: Dome preforms of 304 stainless, 1020 unalloyed wire mesh
and punched 304 stainless steel sheet
Step 1 Step 3Step 2
304 stainless steel punched Sheet Dome 0.20Lb
304 stainless steel wire mesh Dome 0.43Lb and 1020 unalloyed wire mesh Dome 0.49Lb

103
Fi
g.45: Weight of the reinforcement material in aluminum dome casting
0
0.1
0.2
0.3
0.4
0.5
0.6
304 Stainless Steel PunchedSheet Reinforcement
Material
304 Stainless Steelreinforcement Wire Mesh
1020 Unalloyed SteelReinforcement Wire Mesh
Wei
ght o
f Rei
nfor
cem
ent M
ater
ial(L
b)
0.20Lb
0.43Lb
0.49Lb
Fig.46: Weight of castings made of aluminum with/without reinforcement
0
5
1
5
2
5
3
Aluminum DomeCasting withoutReinforcement
Aluminum DomeCasting with 304
Stainless Steel PunchedSheet
Aluminum DomeCasting with 304
Stainless Steel WireMesh
Aluminum DomeCasting with 1020
Unalloyed Steel WireMesh
Wei
ght o
f Cas
ting(
Lb)
2.
2.0Lb
2.28Lb2.15Lb
2.32Lb
1.
0.

104
Figure 47: X-Ray Picture of castings with & w/o reinforcing wire
(a) Without wire (b) With wire
Fig.48: Setup for water pressure testing
Hoa
b c- Casting d e f
le for High Pressure Water Inlet
Bolts Installed Around Circumference

105
Fig.49: Failure mode of castings in water pressure testing
(a) Without Wire
(b) With Wire
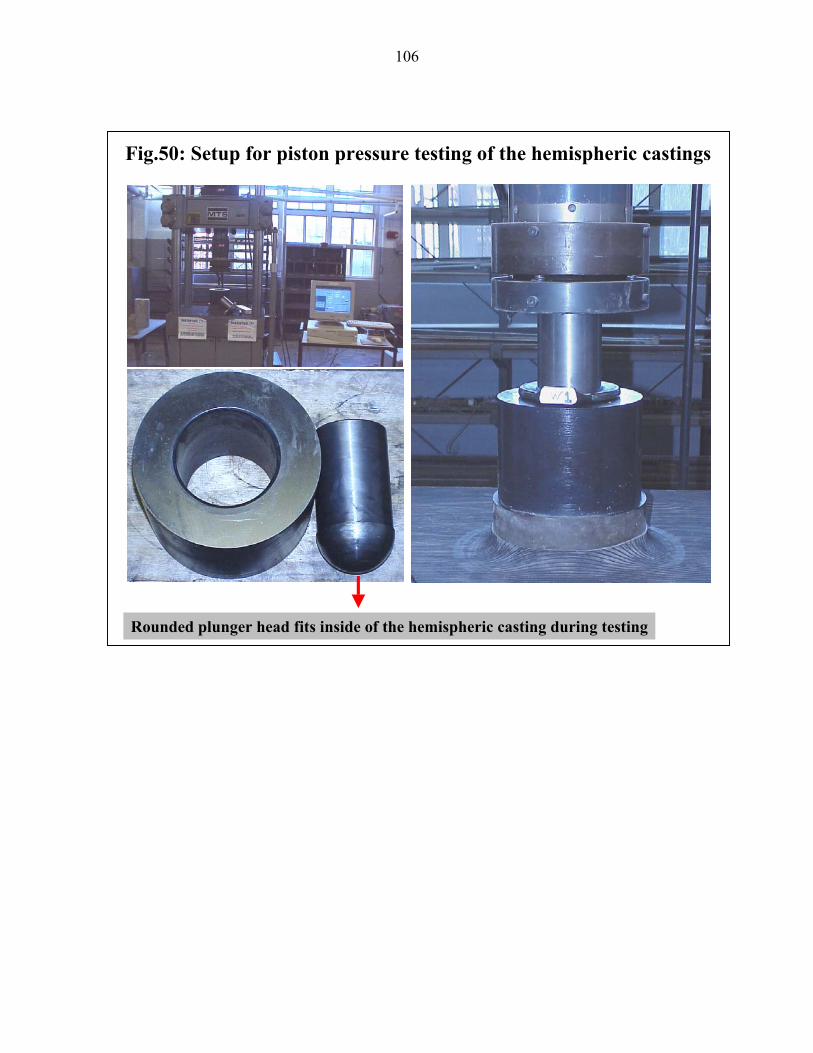
106
Fig.50: Setup for piston pressure testing of the hemispheric castings
Rounded plunger head fits inside of the hemispheric casting during testing

107
Fig.51: Effect of reinforcement on impact resistance
A354-BaseA354 + 0.25 in. Dia. SS304
120 ft *lb
rease in Charpy V-notch was obtained by selective reinforcement of cast A354 with SS304 Bar
10 mm
10 mm
SS304 Wire
3 ft *lb
A very large inc

108
Figure 52: Effect of SS304 wire reinforcement (casting produced at 7,600psi
0
10
20
30
40
50
60
70
80
90
100
0.00 0.05 0.10 0.15 0.20 0.25 0.30Displacement (in)
Loa
d (1
000
Lbs
)
Dome Not Reinforced Dome-Reinforced
Reinforced: Average Load=73.167(1000 Lbs) Average for 5 Samples
Not Reinforced: Average Load=61.912(1000 Lbs) Average for 4 Samples

109
0.010.020.030.040.050.060.070.080.090.00.00.00.0
0.00 0.02 0.04 0.06 0.08 0.10 0.12 0.14 0.16 0.18 0.20
Displacment(Inch)
Load
(KiP
)
1211 Reinforced with Hard Punched
Stainless Steel SheetNot Reinforced10
Reinforced with Soft Punched Stainless Steel Sheet
Reinforced with Stainless Steel Wire Mesh
Fig.53: Typical load-deformation plot of castings made with 17,000 psi pressurewith/without Reinforcement (As Cast)
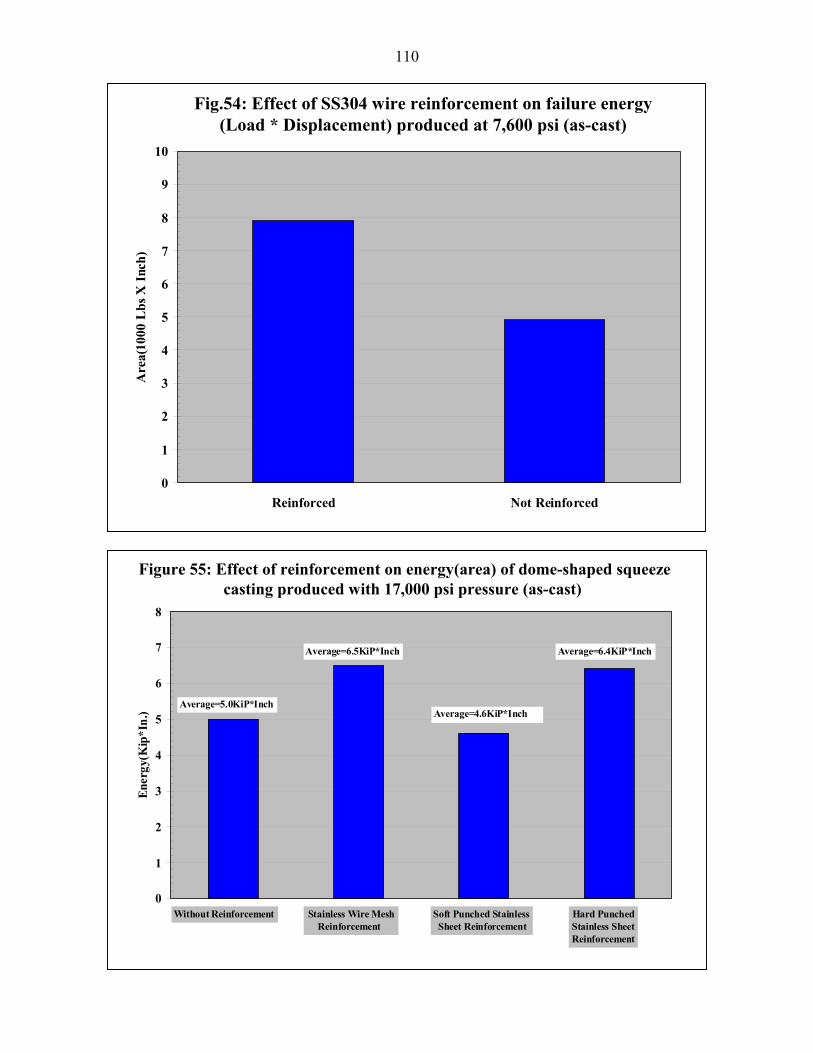
110
Fig.54: Effect of SS304 wire reinforcement on failure energy
(Load * Displacement) produced at 7,600 psi (as-cast)
0
1
2
3
4
5
6
7
8
9
10
Reinforced Not Reinforced
Are
a(10
00 L
bs X
Inc
h)
Figure 55: Effect of reinforcement on energy(area) of dome-shaped squeeze casting produced with 17,000 psi pressure (as-cast)
0
1
2
3
4
5
6
7
8
1 2 3 4
Ener
gy(K
ip*I
n.)
Without Reinforcement Stainless Wire Mesh Reinforcement
Soft Punched Stainless Sheet Reinforcement
Hard PunchedStainless Sheet Reinforcement
Average=5.0KiP*Inch
Average=6.5KiP*Inch Average=6.4KiP*Inch
Average=4.6KiP*Inch

111
Fig.56: Failure mode of casting produced with 7600 psi pressuretested with piston pressure

112
Fig.57: Effect of mesh area fraction in cross sections of stainless mesh
0
20
40
60
80
100
120
140
0 5 10 15 20 25 30 35
Total Mesh Wire Area Fraction in Cross Section(%)
0.25 in. Diameter Stainless Bar Reinforced
Stainless Mesh Reinforced
reinforced A354 on CVN impact strengthIm
pact
Str
engt
h of
C-V
-N(f
t-lb
)

113
BIBLIOGRAPHY
Akdeniz, M.V.; Mekhrabov, A.O. “The effect of substitutional impurities on the evolution of Fe-Al diffusion layer,” Acta mater., 46 [4] (1998) 1185-1192. 30 Akdeniz, M.V.; Mekhrabov, A.O., in The 4th European Conference on Advanced Materials and Processes: EUROMAT 95, Padua/Venice, Conf, Proc., Vol. 4. Associatione Italiana Di Metallurgica, Italy, 1995, p. 487 20 Akdeniz, M.V.; Mekhrabov, A.O.; Yilmaz, T. “Interfacial interaction in Fe-Al diffusion layer,” Scripta Metallurgica et Materialia, 31 [12] (1994) 1723-1728. 21 Almond, E.A.; Embury, J.D.; Wright, E.S. “Fracture in Laminated Materials,” Interfaces in Composites, ASTM STP 452, American Society for Testing and Materials, 1969, 107-129. Anik, S.; Dorn, L. “Metallo-Physical Processes Involved in Welding Different Materials--Materials Fundamentals and Joints Between Heterogeneous Steels,” Schweissen und Schneiden, 44 [3] (1992) 148-152. 2 Arkharov, V.I., Okisleniye Metallov pri Visokikh Temperaturakh, Sverdlivsk, Metallurgizdat, 1945. 13 Arkharov, V.I.; Balaneeva, N.A.; Bogoslovskii, V.N.; Stafeva, N.M. “Mechanism of chemical diffusion in solids and its application to oxidation,” Oxid. Metals, 3 (1971) 251. 14 Bahadur, A. “Aluminum coatings for steel,” Materials and Manufacturing Processes, 11 [2] (1996) 225-232. 36 Bedford, G.M.; Boustead, J. “The Influence of Oxygen and Nitrogen on the Growth of Intermediate Phases During the Bonding of Iron to Aluminum,” Journal of Materials Science, 13 (1978) 253-260. 27 Chawla, K.K. Composite materials: science and engineering, Springer-Verlag, New York,

114
1987. Cooper, G.A.; Kelly, A. “Role of the Interface in the Fracture of Fiber-Composite Materials,” Interfaces in Composites, ASTM STP 452, American Society for Testing and Materials, 1969, 90-106. Dini, J.W. “The role of electroplated coatings in metal joining,” Welding Journal, 75 [5] (1996) 47-49. Dini, J.W. “Use of Electrodeposition to Provide Coatings for Solid-State Bonding,” Welding Journal, 61 [11] (1982) 33-39. Dunkerton, S.B. “Diffusion Bonding--Process and Applications,” Welding and Metal Fabrication, 59 [3] (1991) 100-104. Dybkov, V.I. “Reaction diffusion in heterogeneous binary systems-Part 1 Growth of the chemical compound layers at the interface between two elementary substances: one compound layer,” Journal of Materials Science, 21 (1986) 3078-3084 6 Evans, U.R., The corrosion and Oxidation of Metals, Edward Arnold, London, 1960. 12 Gopal, S.; Lakare, A.; Shivpuri, R. “Soldering in die casting: aluminum alloy and die steel interactions,” Die Casting Engineer, 44 [3] (2000) 70-81. Guo, H.; Steinhauer, E.; Chene, J.J. “Solid state diffusion bonding for structural joining with similar and dissimilar materials,” Welding in the World, 37 [3] (1996) 107-113. Gupta, V.; Argon, A.S.; Counie, J.A. “Interfaces With Controlled Toughness as Mechanical Fuses to Isolate Fibers From Damage,” J. Mater. Sci., 24 [6] (1989) 2031-2040. 32 Hauffe, K., Reactionen in und an festen Stoffen, Springer, Berlin, 1955. 7 Hayhurst, D.R.; Lechie, F.A.; Evans, A. G. “Component Design-Based Model for Deformation and Rupture of Tough Fibre-Reinforced Ceramic Matrix Composites,” Proc. R. Soc., 434 [1891] (1991) 369-381. 33

115
Hillert, M. “Diffusion and Interface Control of Reactions in Alloys,” Metal. Trans. A, 6A [1] (1975) 5. 5 Ip, S.W.; Sridhar, R.; Toguri, J.M.; Stephenson, T. F.; Warner, A. E. M. “Wettability of nickel coated graphite by aluminum,” Materials Science and Engineering A (Switzerland), 244 [1] (1998) 31-38. Jost, W., Diffusion in Solids Liquids, Gases, Academic Press, New York, 1960. 11 Karlsson, L. “Welding of dissimilar metals,” Welding in the World, 36 (1995) 125-132. Knibloe, R.; Wright, R. N.; Trybus, C. L.; Sikka, V. K. “Microstructure and Mechanical Properties of Fe sub 3 Al Alloys With Chromium,” J. Mater. Sci., 28 [8] (1993) 2040 18 Kofstad, P., High-Temperature Oxidation of Metals, Wiley, New York, 1968. 8 Kopylov, N.; Lantsmar., P. “Electron-Microscope Investigation of Cold-Welded Steel/Al Joints,” Russian J. Svar. Proiz, 20 [2] (1973) 15. 29 Kotani, K.; Ikeuchi, K.; Matsuda, F. “Behavior of interfacial oxide during diffusion bonding of aluminum alloys and its influence on joint strength,” Transactions of JWRI, 26 [2] (1997) 13-22. Kotani, K.; Jung, J.; Ikeuchi, K.; Matsuda, F. “Interfacial oxide in diffusion-bonded joints of Al-binary alloys by transmission electron microscopy,” Transactions of JWRI, 28 [2] (1999) 27-37. Layner, K.I.; Kurakin, A.K., Fiz. Metal. Metaloved., 1964, 18(1), 145 25 Lesuer, D.R.; Syn, C.K.; Sherby, O.D.; Wadsworth, J.; Lewandowski, J.J.; Hunt, Jr., W.H. “Mechanical behavior of laminated metal composites,” International Materials Reviews (USA), 41 [5] (1996) 169-197. Loehman, R.E. Joining engineering ceramics, Technical Report SAND-90-0966C, CA. USA. 1990. 4

116
Mekhrabov, A.O.; Akdeniz, M. V.; Aktürk, I., in Stability of Material, ed. A Gonis, P. E. A. Turchi and J. Kudrnovsky. Plenum Press, New York, 1996, p. 681 24 Mekhrabov, A.O.; Akdeniz, M.V. “Effect of ternary alloying elements addition on atomic ordering characteristics of Fe-Al intermetallics,” Acta mater., 47 [7] (1999) 2067-2075. Mondolfo, L.F., Aluninum alloys, structure and properties, London, Butterworths, 1976. 23 Noone, M.J.; Feingold, E.; Sutton, W. H. “The Importance of Coatings in the Preparation of Al2O3 Filament/Metal-Matrix Composites,” Interfaces in composites, ASTM STP 452, American Society for testing and Materials, 1969, 59-89. Omar, A.A. “Effects of welding parameters on hard zone formation at dissimilar metal welds,” Welding Journal, 77 [2] (1998) 86s-93s. Parker, R.H., An Introduction to Chemical Metallurgy, 2nd Edn, Pergamon Press, Oxford, 1978. 10 Partridge, P.G.; Ward-Close, C.M. “Processing of Advanced Continuous Fibre Composites: Current Practice and Potential Developments,” International Materials Reviews (USA), 38 [1] (1993) 1-24. Richards, R.W.; Jones, R.D.; Clements, P.D.; Clarke, H. “Metallurgy of continuous hot dip aluminizing,” International Materials Reviews (UK), 39 [5] (1994) 191-212. Rivlin, V.G.; Raynor, G. V. “Phase Equilibria in Iron Ternary Alloys. Pt. 4. Critical Evaluation of Constitution of Aluminum -- Iron -- Silicon System,” Int. Met. Rev., 26 [3] (1981) 133-152. 22 Ryabov, R., Protective Coating on Metals, Vol. 3, Consultant Bureau, New York, 1971, 96. 15 Ryabov, R.; Yumatova, V.I.; Grabin, V.F.; Butnik, A.P., Protective Coating on Metals, Vol. 4, Consultant Bureau, New York, 1971, 98. 17

117
Savov, L.; Heller, H.P.; Janke, D. “Wettability of solids by molten metals and alloys,” Metallwissenschaft und Technik, 51 [9] (1997) 475-485. 3 Shankar, S.; Apelian, D. “Effect of variation of aluminum-alloy chemistry (titanium and strontium additions) on die/molten metal interface interactions,” 5th International AFS Conference on Molten Aluminium Processing Proceedings (USA), Nov. 1998, 211-230. Shankar, S.; Apelian, D. “Role of aluminum alloy chemistry and die material on die soldering,” World of Die Casting: 1999 Transactions (USA) 285-293. Sibata, K.; Morodzani, S.; Koda, S., J. Japan Inst. Metals, 30 (1966) 382. 16 Sun, Z.; Karppi, R., Joining of Dissimilar Materials. A Review, Technical Research Centre of Finland. Research Notes, 1994. 1 Thouless, M.D.; Evans, A.G. “Effects of Pull-Out on the Mechanical Properties of Ceramic-Matrix Composites,” Acta Metall., 36 [3] (1988) 517-522. 34 Tretyakov, U.D., Tverdofazniye Reactsii, Khimiya, Moscow, 1978. 9 Trutnev, V.; Sharsharov, M.K. “Diffusion welding of austenitic steel to aluminum and aluminum alloys,” Weld Produc., 14 [10] (1967) 18. 28 Wagner C., Thermodynamics of Alloys, Reading, Mass., Addison-Wesley, 1952. 31 Wright, J.K.; Wright, R.N.; Moore, G. A. “Combustion Synthesized Iron Aluminide Coatings and Joints,” Scripta Metallurgica et Materialia, 28 (1993) 501 19 Yang, L.; Hosoda, N.; Suga, T. “Investigations on the interface microstructure of stainless steel /aluminum joints created by the surface activated bonding method,” Interface Science, 5 [4] (1997) 279-286. Yardy, J.W. The Role of Protective Coatings in Metal Joining, ASM International (United States), 1992, 607-615. 35 Yilmaz, T.; Akdeniz, M. V., in EUROMAT 94: 15th Conference on Materials Testing in

118
Metallrugy, Conf. Proc., Vol. 4, ed. B. Vorsatz and E. Szöke). Federation of European Materials Societies (FEMS), Balantonszeplak, Jungary, 1994, p. 1192 26