metadata management for clinical data integration
TRANSCRIPT
University of Kentucky University of Kentucky
UKnowledge UKnowledge
Theses and Dissertations--Computer Science Computer Science
2020
METADATA MANAGEMENT FOR CLINICAL DATA INTEGRATION METADATA MANAGEMENT FOR CLINICAL DATA INTEGRATION
Ningzhou Zeng University of Kentucky, [email protected] Author ORCID Identifier:
https://orcid.org/0000-0001-9807-0004 Digital Object Identifier: https://doi.org/10.13023/etd.2020.133
Right click to open a feedback form in a new tab to let us know how this document benefits you. Right click to open a feedback form in a new tab to let us know how this document benefits you.
Recommended Citation Recommended Citation Zeng, Ningzhou, "METADATA MANAGEMENT FOR CLINICAL DATA INTEGRATION" (2020). Theses and Dissertations--Computer Science. 96. https://uknowledge.uky.edu/cs_etds/96
This Doctoral Dissertation is brought to you for free and open access by the Computer Science at UKnowledge. It has been accepted for inclusion in Theses and Dissertations--Computer Science by an authorized administrator of UKnowledge. For more information, please contact [email protected].

STUDENT AGREEMENT: STUDENT AGREEMENT:
I represent that my thesis or dissertation and abstract are my original work. Proper attribution
has been given to all outside sources. I understand that I am solely responsible for obtaining
any needed copyright permissions. I have obtained needed written permission statement(s)
from the owner(s) of each third-party copyrighted matter to be included in my work, allowing
electronic distribution (if such use is not permitted by the fair use doctrine) which will be
submitted to UKnowledge as Additional File.
I hereby grant to The University of Kentucky and its agents the irrevocable, non-exclusive, and
royalty-free license to archive and make accessible my work in whole or in part in all forms of
media, now or hereafter known. I agree that the document mentioned above may be made
available immediately for worldwide access unless an embargo applies.
I retain all other ownership rights to the copyright of my work. I also retain the right to use in
future works (such as articles or books) all or part of my work. I understand that I am free to
register the copyright to my work.
REVIEW, APPROVAL AND ACCEPTANCE REVIEW, APPROVAL AND ACCEPTANCE
The document mentioned above has been reviewed and accepted by the student’s advisor, on
behalf of the advisory committee, and by the Director of Graduate Studies (DGS), on behalf of
the program; we verify that this is the final, approved version of the student’s thesis including all
changes required by the advisory committee. The undersigned agree to abide by the statements
above.
Ningzhou Zeng, Student
Dr. Guo-Qiang Zhang, Major Professor
Dr. Miroslaw Truszczynski, Director of Graduate Studies

METADATA MANAGEMENT FOR CLINICAL DATA INTEGRATION
DISSERTATION
A dissertation submitted in partial fulfillment of therequirements for the degree of Doctor of Philosophy in the
College of Engineeringat the University of Kentucky
By
Ningzhou Zeng
Lexington, Kentucky
Co-Directors: Dr. Guo-Qiang Zhang, Professorof Computer Scienceand Dr. Jin Chen, Associate Professorof Computer Science
Lexington, KentuckyCopyright © Ningzhou Zeng 2020
https://orcid.org/0000-0001-9807-0004
ABSTRACT OF DISSERTATION
METADATA MANAGEMENT FOR CLINICAL DATA INTEGRATION
Clinical data have been continuously collected and growing with the wide adoptionof electronic health records (EHR). Clinical data have provided the foundation tofacilitate state-of-art researches such as artificial intelligence in medicine. At thesame time, it has become a challenge to integrate, access, and explore study-levelpatient data from large volumes of data from heterogeneous databases. Effective,fine-grained, cross-cohort data exploration, and semantically enabled approaches andsystems are needed. To build semantically enabled systems, we need to leverageexisting terminology systems and ontologies. Numerous ontologies have been devel-oped recently and they play an important role in semantically enabled applications.Because they contain valuable codified knowledge, the management of these ontolo-gies, as metadata, also requires systematic approaches. Moreover, in most clinicalsettings, patient data are collected with the help of a data dictionary. Knowledgeof the relationships between an ontology and a related data dictionary is importantfor semantic interoperability. Such relationships are represented and maintained bymappings. Mappings store how data source elements and domain ontology conceptsare linked, as well as how domain ontology concepts are linked between different on-tologies. While mappings are crucial to the maintenance of relationships between anontology and a related data dictionary, they are commonly captured by CSV fileswith limits capabilities for sharing, tracking, and visualization. The management ofmappings requires an innovative, interactive, and collaborative approach.
Metadata management servers to organize data that describes other data. Incomputer science and information science, ontology is the metadata consisting ofthe representation, naming, and definition of the hierarchies, properties, and rela-tions between concepts. A structural, scalable, and computer understandable wayfor metadata management is critical to developing systems with the fine-grained dataexploration capabilities.
This dissertation presents a systematic approach called MetaSphere using meta-data and ontologies to support the management and integration of clinical researchdata through our ontology-based metadata management system for multiple domains.MetaSphere is a general framework that aims to manage specific domain metadata,

provide fine-grained data exploration interface, and store patient data in data ware-houses. Moreover, MetaSphere provides a dedicated mapping interface called Inter-active Mapping Interface (IMI) to map the data dictionary to well-recognized andstandardized ontologies. MetaSphere has been applied to three domains successfully,sleep domain (X-search), pressure ulcer injuries and deep tissue pressure (SCIPUD-Sphere), and cancer. Specifically, MetaSphere stores domain ontology structurally indatabases. Patient data in the corresponding domains are also stored in databasesas data warehouses. MetaSphere provides a powerful query interface to enable in-teraction between human and actual patient data. Query interface is a mechanismallowing researchers to compose complex queries to pinpoint specific cohort over alarge amount of patient data.
The MetaSphere framework has been instantiated into three domains successfullyand the detailed results are as below. X-search is publicly available at https://www.x-search.net with nine sleep domain datasets consisting of over 26,000 unique subjects.The canonical data dictionary contains over 900 common data elements across thedatasets. X-search has received over 1800 cross-cohort queries by users from 16 coun-tries. SCIPUDSphere has integrated a total number of 268,562 records containing 282ICD9 codes related to pressure ulcer injuries among 36,626 individuals with spinalcord injuries. IMI is publicly available at http://epi-tome.com/. Using IMI, we havesuccessfully mapped the North American Association of Central Cancer Registries(NAACCR) data dictionary to the National Cancer Institute Thesaurus (NCIt) con-cepts.
KEYWORDS: Metadata, Fine-grained, Query Interface, Ontology, Data Dictio-nary, Mapping
NINGZHOU ZENGStudent’s Signature
APRIL 20, 2020Date

METADATA MANAGEMENT FOR CLINICAL DATA INTEGRATION
By
Ningzhou Zeng
GUO-QIANG ZHANG
Co-Director of Dissertation
JIN CHENCo-Director of Dissertation
MIROSLAW TRUSZCZYNSKIDirector of Graduate Studies
APRIL 20, 2020Date

ACKNOWLEDGEMENTS
The journey to Ph.D. has been a truly challenging but life-changing experience
for me. This journey requires intelligence, courage, curiosity, and most importantly
persistence. It would not have been possible without the guidance and support of sev-
eral individuals who in one way or the other contributed and extended their valuable
suggestions in the preparation and completion of this study.
First and foremost, I would like to express my sincere gratitude to my supervisor,
Professor Guo-Qiang Zhang, for the continuous support and guidance of my Ph.D.
study and related researches. From Cleveland to Houston, we have been through a
lot. His excellent intellectual inputs, scientific rigor, leadership, organizational skills,
enthusiasm, patience and care for the work are the most important in helping me
complete this dissertation.
Besides my advisor, I would like to thank the rest of my thesis committee: Dr. Jin
Chen, Dr. Jinze Liu, Dr. Tingting Yu, and Dr. Jeffery Talbert, for their time, interest,
and insightful and valuable comments that have helped improve my dissertation work.
I gratefully acknowledge to Dr. Jin Chen, my academic advisor, for his great help on
my Ph.D. program related affairs. And I would like to acknowledge Dr. Lei Chen for
being my outside examiner.
Our group members are the most adorable people in the world. I would like to
thank them for being a constant support and their friendship: Dr. Shiqiang Tao, Dr.
Licong Cui, Dr. Wei Zhu, Dr. Xiaojin Li, Xi Wu, Yan Huang, Steven Roggenkamp,
Connie Vaughn, and Jill Cioci.
Finally, I would like to thank my parents, my brother, my sister, for their support
and encouragement throughout this study. Last but not least, I would like to ac-
knowledge my significant other, Yebing Zhao, for her support. Without her patience
and encouragement, this journey would have been difficult to accomplish.
iii
Table of Contents
Acknowledgements iii
List of Tables viii
List of Figures ix
1 Introduction 11.1 Motivation and Challenges in Metadata Management for Clinical Data
Integration . . . . . . . . . . . . . . . . . . . . . . . . . . . . . . . . . 11.1.1 From Raw Data to Metadata . . . . . . . . . . . . . . . . . . 31.1.2 Fine-grained Data Exploration of Heterogeneous Datasets . . 51.1.3 Ontology-focused Metadata Discovery . . . . . . . . . . . . . . 61.1.4 Mappings among Data Dictionaries and Ontologies . . . . . . 7
1.2 Contributions . . . . . . . . . . . . . . . . . . . . . . . . . . . . . . . 81.3 Organization of the Dissertation . . . . . . . . . . . . . . . . . . . . . 9
2 Background 102.1 FAIR Data Principles . . . . . . . . . . . . . . . . . . . . . . . . . . . 102.2 The Role of Metadata . . . . . . . . . . . . . . . . . . . . . . . . . . 112.3 A Review of Ontology Mapping . . . . . . . . . . . . . . . . . . . . . 12
2.3.1 Ontology mapping tool functional requirements . . . . . . . . 122.3.2 Ontology mapping algorithms . . . . . . . . . . . . . . . . . . 13
2.4 National Sleep Resource Research (NSRR) . . . . . . . . . . . . . . . 142.5 VA Informatics and Computing Infrastructure (VINCI) . . . . . . . . 152.6 Cancer Registry . . . . . . . . . . . . . . . . . . . . . . . . . . . . . . 16
2.6.1 National Cancer Institute Thesaurus (NCIt) . . . . . . . . . . 162.6.2 North American Association of Central Cancer Registries . . . 172.6.3 Kentucky Cancer Registry (KCR) . . . . . . . . . . . . . . . . 18
3 MetaSphere - A Systematic Approach For Metadata Managementfor Clinical Data Integration 193.1 System Architecture . . . . . . . . . . . . . . . . . . . . . . . . . . . 193.2 Frontend Query Interface . . . . . . . . . . . . . . . . . . . . . . . . . 20
3.2.1 ReactJS - A JavaScript Library . . . . . . . . . . . . . . . . . 203.2.2 From QueryWidget to Query Statement . . . . . . . . . . . . 23
3.3 Backend Application Server . . . . . . . . . . . . . . . . . . . . . . . 243.3.1 Models, Views, and Controllers . . . . . . . . . . . . . . . . . 243.3.2 Query Translation and Query Execution . . . . . . . . . . . . 26
3.4 Metadata storage and Data repository . . . . . . . . . . . . . . . . . 27
iv

4 National Sleep Resource Research (NSRR) 294.1 Motivation and Challenges . . . . . . . . . . . . . . . . . . . . . . . . 294.2 Related work . . . . . . . . . . . . . . . . . . . . . . . . . . . . . . . 304.3 Overview of NSRR . . . . . . . . . . . . . . . . . . . . . . . . . . . . 314.4 Method . . . . . . . . . . . . . . . . . . . . . . . . . . . . . . . . . . 33
4.4.1 Data repository . . . . . . . . . . . . . . . . . . . . . . . . . . 344.4.1.1 Data sources and data dictionaries . . . . . . . . . . 344.4.1.2 Canonical data dictionary and mappings . . . . . . . 354.4.1.3 Coding inconsistency harmonization . . . . . . . . . 364.4.1.4 Data loading . . . . . . . . . . . . . . . . . . . . . . 36
4.4.2 The X-search cross-cohort exploration engine . . . . . . . . . . 384.4.2.1 Query builder . . . . . . . . . . . . . . . . . . . . . . 384.4.2.2 Graphical exploration . . . . . . . . . . . . . . . . . 394.4.2.3 Case-control exploration . . . . . . . . . . . . . . . . 394.4.2.4 Query translation and execution . . . . . . . . . . . 40
4.5 Result . . . . . . . . . . . . . . . . . . . . . . . . . . . . . . . . . . . 414.5.1 Data repository . . . . . . . . . . . . . . . . . . . . . . . . . . 414.5.2 Cross-cohort exploration engine . . . . . . . . . . . . . . . . . 414.5.3 Usage . . . . . . . . . . . . . . . . . . . . . . . . . . . . . . . 444.5.4 Limitations . . . . . . . . . . . . . . . . . . . . . . . . . . . . 45
4.6 Evaluation: A Comparison of Query Performance between SQL-basedand NoSQL-based Query Interface . . . . . . . . . . . . . . . . . . . . 464.6.1 Specific Challenges for Identifying Patient Cohorts from Het-
erogeneous Sources . . . . . . . . . . . . . . . . . . . . . . . . 464.6.1.1 High-dimensional Data . . . . . . . . . . . . . . . . . 464.6.1.2 Heterogeneous Data . . . . . . . . . . . . . . . . . . 46
4.6.2 NoSQL Databases . . . . . . . . . . . . . . . . . . . . . . . . 474.6.2.1 MongoDB Database System . . . . . . . . . . . . . . 484.6.2.2 Cassandra Database System . . . . . . . . . . . . . . 49
4.6.3 Materials and Methods . . . . . . . . . . . . . . . . . . . . . . 494.6.3.1 Web-based Query Interface . . . . . . . . . . . . . . 514.6.3.2 Query Translation - Dynamic Generation of Database
Query Statement . . . . . . . . . . . . . . . . . . . . 514.6.3.3 Ruby Driver for the Database Management System . 534.6.3.4 Data Modeling in NoSQL Databases . . . . . . . . . 53
4.6.4 Data Integration - Loading and Harmonization . . . . . . . . . 544.6.4.1 Data Loading Procedure . . . . . . . . . . . . . . . . 544.6.4.2 Data Harmonization Procedure . . . . . . . . . . . . 54
4.6.5 Results . . . . . . . . . . . . . . . . . . . . . . . . . . . . . . . 554.6.5.1 Data Loading and Harmonization . . . . . . . . . . . 554.6.5.2 Comparison of Relational and NoSQL Databases . . 564.6.5.3 Statistical Evaluation of Average Query Time . . . . 614.6.5.4 Scalability . . . . . . . . . . . . . . . . . . . . . . . . 614.6.5.5 Distinction with Related Work . . . . . . . . . . . . 634.6.5.6 Limitations . . . . . . . . . . . . . . . . . . . . . . . 65
v

4.7 Conclusion . . . . . . . . . . . . . . . . . . . . . . . . . . . . . . . . . 66
5 An Integrative Data Repository for Studying Risk Factors Associ-ated with Pressure Injuries Resulting from Spinal Cord Injury 675.1 Motivation and Challenges . . . . . . . . . . . . . . . . . . . . . . . . 675.2 Pressure Injuries (PrI) and Deep Tissue Pressure Injury (DTPrI) . . 685.3 VA Informatics and Computing Infrastructure (VINCI) . . . . . . . . 695.4 Related work . . . . . . . . . . . . . . . . . . . . . . . . . . . . . . . 705.5 Method . . . . . . . . . . . . . . . . . . . . . . . . . . . . . . . . . . 70
5.5.1 Ontology Support . . . . . . . . . . . . . . . . . . . . . . . . . 725.5.2 SCIPUDSphere Environmental, Social and Clinical Domain Database 72
5.5.2.1 Data Extraction . . . . . . . . . . . . . . . . . . . . 725.5.2.2 Data Processing . . . . . . . . . . . . . . . . . . . . 74
5.5.3 SCIPUDSphere Query Interface . . . . . . . . . . . . . . . . . 745.5.3.1 MongoDB as Data Warehouse . . . . . . . . . . . . . 755.5.3.2 Dynamic Database Query Statement Generation . . 75
5.6 Result . . . . . . . . . . . . . . . . . . . . . . . . . . . . . . . . . . . 775.6.1 Creation of the SCIPUDSphere environmental, social and clin-
ical domain database . . . . . . . . . . . . . . . . . . . . . . . 775.6.1.1 Data Extraction . . . . . . . . . . . . . . . . . . . . 77
5.6.2 SCIPUDSphere User Interface . . . . . . . . . . . . . . . . . . 785.6.2.1 Query Builder . . . . . . . . . . . . . . . . . . . . . . 795.6.2.2 Query Results Statistical Visualization and Download-
ing . . . . . . . . . . . . . . . . . . . . . . . . . . . . 805.7 Evaluation . . . . . . . . . . . . . . . . . . . . . . . . . . . . . . . . . 81
5.7.1 Usability . . . . . . . . . . . . . . . . . . . . . . . . . . . . . . 815.7.2 Query Performance . . . . . . . . . . . . . . . . . . . . . . . . 825.7.3 Evidence of Usage . . . . . . . . . . . . . . . . . . . . . . . . 83
5.8 Discussion . . . . . . . . . . . . . . . . . . . . . . . . . . . . . . . . . 835.8.1 Features . . . . . . . . . . . . . . . . . . . . . . . . . . . . . . 835.8.2 Limitations . . . . . . . . . . . . . . . . . . . . . . . . . . . . 845.8.3 Conclusions . . . . . . . . . . . . . . . . . . . . . . . . . . . . 84
6 Interactive and Collaborative Mapping Interface from Data Dictio-naries to Ontologies 866.1 Motivation and Challenges . . . . . . . . . . . . . . . . . . . . . . . . 866.2 Method . . . . . . . . . . . . . . . . . . . . . . . . . . . . . . . . . . 88
6.2.1 Ontology Library . . . . . . . . . . . . . . . . . . . . . . . . . 896.2.2 Interactive Mapping Interface . . . . . . . . . . . . . . . . . . 90
6.2.2.1 Project Management Module . . . . . . . . . . . . . 906.2.2.2 Interactive Mapping Interface . . . . . . . . . . . . . 90
6.2.3 Recommendation System . . . . . . . . . . . . . . . . . . . . . 926.3 Result . . . . . . . . . . . . . . . . . . . . . . . . . . . . . . . . . . . 93
6.3.1 Ontology Library . . . . . . . . . . . . . . . . . . . . . . . . . 936.3.2 Interactive Mapping Interface . . . . . . . . . . . . . . . . . . 93
vi

6.3.2.1 Project Management Module . . . . . . . . . . . . . 946.3.2.2 Mapping Dashboard . . . . . . . . . . . . . . . . . . 956.3.2.3 Interactive Tool for Ontology Hierarchy Curation and
Rectification . . . . . . . . . . . . . . . . . . . . . . 976.4 Evaluation . . . . . . . . . . . . . . . . . . . . . . . . . . . . . . . . . 100
6.4.1 Usability . . . . . . . . . . . . . . . . . . . . . . . . . . . . . . 1006.4.2 The Evaluation of the Recommendation System . . . . . . . . 101
6.5 Discussion . . . . . . . . . . . . . . . . . . . . . . . . . . . . . . . . . 1016.5.1 Usability . . . . . . . . . . . . . . . . . . . . . . . . . . . . . . 1016.5.2 Generalization . . . . . . . . . . . . . . . . . . . . . . . . . . . 1026.5.3 Limitation and future work . . . . . . . . . . . . . . . . . . . 102
6.6 Concluding remarks . . . . . . . . . . . . . . . . . . . . . . . . . . . . 102
7 Conclusion 1047.1 Contributions . . . . . . . . . . . . . . . . . . . . . . . . . . . . . . . 1077.2 Future Work . . . . . . . . . . . . . . . . . . . . . . . . . . . . . . . . 108
REFERENCES 109
Vita 117
vii

List of Tables
4.1 Summary information for each of the eight datasets. . . . . . . . . . . 324.2 Harmonizing coding inconsistencies among different datasets for the
”gender” variable. . . . . . . . . . . . . . . . . . . . . . . . . . . . . . 374.3 Summary information for each of the nine datasets. . . . . . . . . . . 424.4 Summary information for each of the eight datasets. . . . . . . . . . . 504.5 Numbers of tables needed for each database system to load the eight
datasets. . . . . . . . . . . . . . . . . . . . . . . . . . . . . . . . . . . 554.6 Time to load eight datasets into MySQL, MongoDB, and Cassandra,
respectively. . . . . . . . . . . . . . . . . . . . . . . . . . . . . . . . . 574.7 Harmonization time for three systems. . . . . . . . . . . . . . . . . . 574.8 Cohort query time for the MySQL-based system. . . . . . . . . . . . 594.9 Cohort query time for the MongoDB-based system. . . . . . . . . . . 594.10 Cohort query time for the Cassandra-based system. . . . . . . . . . . 594.11 T-test result for two independent means using average query time. . . 614.12 Cohort query time for the MySQL-based system. . . . . . . . . . . . 624.13 Cohort query time for the MongoDB-based system. . . . . . . . . . . 634.14 Cohort query time for the Cassandra-based system. . . . . . . . . . . 64
5.1 SCIPUDO Ontological Main Dimensions. . . . . . . . . . . . . . . . . 725.2 Summary of Extracted Risk Data from VINCI. . . . . . . . . . . . . 795.3 Statistics for query building in usability evaluation. . . . . . . . . . . 825.4 Cohort Query Time for SCIPUDSphere. . . . . . . . . . . . . . . . . 82
6.1 Summary of five branches. . . . . . . . . . . . . . . . . . . . . . . . . 986.2 Average mapping time for ten selected data dictionary elements. . . . 101
viii
List of Figures
1.1 The pyramid of multi-level metadata abstractions. (Diagram takenfrom GQ Zhang’s presentation at Rice University Fall 2019 Data Sci-ence Symposium) . . . . . . . . . . . . . . . . . . . . . . . . . . . . . 4
2.1 Metadata Repository and the Tools using it. . . . . . . . . . . . . . . 122.2 Summary of ontology mapping algorithms. Extracted from the book
”Ontology Matching” [28] . . . . . . . . . . . . . . . . . . . . . . . . 13
3.1 System Architecture Overview . . . . . . . . . . . . . . . . . . . . . . 193.2 Virtual DOM. . . . . . . . . . . . . . . . . . . . . . . . . . . . . . . . 213.3 One direction data flow. . . . . . . . . . . . . . . . . . . . . . . . . . 213.4 UML diagram of the frontend query interface . . . . . . . . . . . . . 233.5 The Model-View-Controller Architecture . . . . . . . . . . . . . . . . 243.6 Core data model and their relationships in MetaSphere . . . . . . . . 263.7 Abstract class for multiple databases . . . . . . . . . . . . . . . . . . 27
4.1 The architecture for query system. Left: Open data repository withheterogeneous data sources. Right: The cross-cohort exploration system. 33
4.2 Screenshot of the query builder interface. Four areas: (1) Select Datasets;(2) Add Query Terms; (3) Construct Query; (4) Query Results. Thisexample queries the numbers of female patient subjects aged between20 and 50. . . . . . . . . . . . . . . . . . . . . . . . . . . . . . . . . . 43
4.3 Screenshot of the graphical exploration interface. This example showsone of the box plots generated for body mass index (BMI) againstdiabetes. . . . . . . . . . . . . . . . . . . . . . . . . . . . . . . . . . . 44
4.4 Screenshot of the case-control exploration interface. This example isto explore: In elderly, obese people without cardiovascular disease,whether the presence of self-reported diabetes is related to sleep apnea(apnea-hypopnea ¿=15 events/hour). . . . . . . . . . . . . . . . . . . 44
4.5 Numbers of times each dataset got queried. . . . . . . . . . . . . . . . 454.6 An example of splitting a table with a large number of columns into
multiple tables in MySQL due to the restriction on the table columncount. . . . . . . . . . . . . . . . . . . . . . . . . . . . . . . . . . . . 47
4.7 System Architecture. . . . . . . . . . . . . . . . . . . . . . . . . . . . 514.8 Data loading time comparison. . . . . . . . . . . . . . . . . . . . . . . 574.9 Average query time for each query using MySQL, MongoDB, and Cas-
sandra. . . . . . . . . . . . . . . . . . . . . . . . . . . . . . . . . . . . 604.10 Query time of MySQL for SHHS Dataset with Different Scales. . . . . 644.11 Query time of MongoDB for SHHS Dataset with Different Scales. . . 644.12 Query time of Cassandra for SHHS Dataset with Different Scales. . . 64
5.1 SCIPUDSphere System Architecture. . . . . . . . . . . . . . . . . . . 715.2 SCIPUDSphere Query Interface. . . . . . . . . . . . . . . . . . . . . . 80
ix
5.3 Query Results Statistical Visualization. . . . . . . . . . . . . . . . . . 80
6.1 Functional Architecture of IMI. . . . . . . . . . . . . . . . . . . . . . 886.2 Mapping pipeline. . . . . . . . . . . . . . . . . . . . . . . . . . . . . . 906.3 Ontology library. . . . . . . . . . . . . . . . . . . . . . . . . . . . . . 946.4 Interface for uploading ontology. . . . . . . . . . . . . . . . . . . . . . 946.5 Mapping dashboard. . . . . . . . . . . . . . . . . . . . . . . . . . . . 956.6 Access control. . . . . . . . . . . . . . . . . . . . . . . . . . . . . . . 966.7 Logs and comments module. . . . . . . . . . . . . . . . . . . . . . . . 976.8 Mapping result review and exportation. . . . . . . . . . . . . . . . . . 976.9 Hierarchy tree of the first branch. . . . . . . . . . . . . . . . . . . . . 986.10 Hierarchy tree of the second branch. . . . . . . . . . . . . . . . . . . . 986.11 Hierarchy tree of the third branch. . . . . . . . . . . . . . . . . . . . 996.12 Hierarchy tree of the fourth branch. . . . . . . . . . . . . . . . . . . . 996.13 Hierarchy tree of the fifth branch. . . . . . . . . . . . . . . . . . . . . 100
x

CHAPTER 1. Introduction
1.1 Motivation and Challenges in Metadata Management for Clinical
Data Integration
Patient data are growing at an explosive rate in the medical field with the wide adop-
tion of electronic health records (EHR) [1]. Patient data cover patient demographics,
diagnosis, laboratory tests, medications, images, and genome sequences. With a large
amount of clinical data integrated, efficient data retrieval and exploration have be-
come a challenging issue. Specific challenges include:
Barriers between data exploration and research hypotheses. In a traditional
clinical research workflow, research hypotheses come before patient data acqui-
sition. If the research hypotheses and acquired patient data do not support the
hypotheses, then the study design needs to be adjusted. A new and efficient
data exploration tool is needed to accelerate the process. With such a tool, re-
searchers can explore the data to provide preliminary evidence to their research
hypotheses before the start of a clinical trial.
The lack of fine-grained, cross-cohort query, and exploration interfaces and sys-
tems. Although many data repositories allow users to browse their content,
few of them support fine-grained, cross-cohort query, and exploration at the
study-subject level. To understand the challenge, we provide a review of the
key concepts.
– Fine-grained. A fine-grained query is a highly-customizable query with low
granularity and high details.
– Cross-cohort. A cohort study is a particular form of a longitudinal study
that samples a cohort through time. A cross-cohort query means to query
and fetch data from multiple cohort studies at the same time.
1

– Study-subject. The United States Department of Health and Human Ser-
vices (HHS) defines a human study subject as a living individual about
whom a research investigator obtains data through 1) intervention or in-
teraction with the individual, or 2) identifiable private information [2].
Exploration at the study-subject level is the result of a fine-grained query.
To find a male patient with asthma under 50 years old, a typical SQL statement
is SELECT * FROM patients WHERE gender = 0 AND asthma = 0 AND age
¡= 50. From the perspective of end-users, an interface with SQL like query
capability can help their data exploration capability.
Tools for building mappings between data dictionaries and ontologies are miss-
ing. In some clinical settings, patient data are collected with the help of a data
dictionary. To integrate these patient data and build ontology enabled data
query interfaces, mappings between multiple data dictionaries and ontology are
critical. Traditionally, these mappings are built and maintained using the CSV
files. CSV file is the abbreviation of the comma-separated values (CSV) file.
CSV file is a delimited text file that uses a comma to separate values. Each line
of the file is a data record. Each record consists of one or more fields, separated
by commas. The use of the comma as a field separator is the source of the name
for this file format. A CSV file typically stores tabular data (numbers and text)
in plain text. Management and maintenance of these mappings become cumber-
some and time-consuming when the mapping size increases. More importantly,
it cannot be reused by other researchers. Such mappings are usually built and
maintained by a group of researchers and domain experts, therefore an efficient
tool for collaboration and result visualization is required.
There are other challenges such as storage challenges which will not be addressed
in this dissertation. In some research areas, collected data are stored or archived
2
locally or externally using hard drives. Such data would suffer from hardware failure,
data corruption with limited data sharing capability, and scalability.
This dissertation focuses on addressing these challenges to help facilitate hypothe-
sis generation, data exploration, and provide a tool to build a mapping between data
dictionary and ontologies.
The approach proposed in the dissertation has been applied to three different
domains 1) sleep domain; 2) spinal cord injury; 3) cancer. We highlight the specific
challenges and requirements in these three domain specifically.
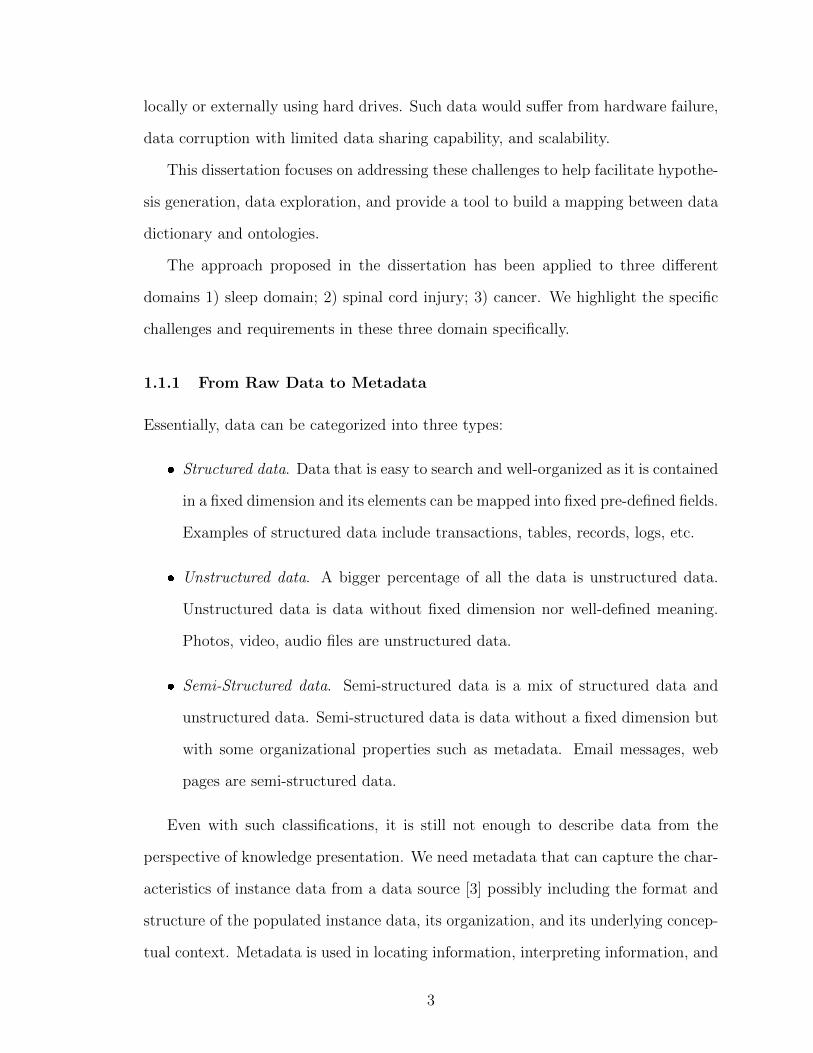
1.1.1 From Raw Data to Metadata
Essentially, data can be categorized into three types:
Structured data. Data that is easy to search and well-organized as it is contained
in a fixed dimension and its elements can be mapped into fixed pre-defined fields.
Examples of structured data include transactions, tables, records, logs, etc.
Unstructured data. A bigger percentage of all the data is unstructured data.
Unstructured data is data without fixed dimension nor well-defined meaning.
Photos, video, audio files are unstructured data.
Semi-Structured data. Semi-structured data is a mix of structured data and
unstructured data. Semi-structured data is data without a fixed dimension but
with some organizational properties such as metadata. Email messages, web
pages are semi-structured data.
Even with such classifications, it is still not enough to describe data from the
perspective of knowledge presentation. We need metadata that can capture the char-
acteristics of instance data from a data source [3] possibly including the format and
structure of the populated instance data, its organization, and its underlying concep-
tual context. Metadata is used in locating information, interpreting information, and
3

integrating/transforming data. Metadata can be characterized as the abstraction of
other data and the abstraction is multi-level. Figure 1.1 shows a pyramid of multi-
level metadata abstraction in biomedical fields. There are five levels of abstraction.
From raw data to knowledge, there are four levels of abstraction. Each level of data
describes its next level data. The expressivity of knowledge decreases from top to
bottom.
Figure 1.1: The pyramid of multi-level metadata abstractions. (Diagram taken fromGQ Zhang’s presentation at Rice University Fall 2019 Data Science Symposium)
Raw data. Raw data, also known as primary data, is data collected from a
source.
Data dictionaries. A data dictionary is an extract of structured data elements
and their metadata, taken from a given data model or data architecture scope.
Common data elements. Common data elements (CDE) is a combination of
a precisely defined question (variable) paired with a specified set of responses
to the question that is common to multiple datasets or used across different
studies. It can be common across a multi-site study or scientific research area.
4

Controlled vocabularies. The controlled vocabularies is an alphabetical list of
terms in a particular domain of knowledge with the definitions for those terms.
Ontologies. An ontology is a formal naming and definitions of the types, proper-
ties, and interrelationships of the entities that fundamentally exist for a partic-
ular domain of discourse. An ontology compartmentalizes the variables needed
for some set of computations and establishes the relationships between them.
An ontology represents a set of knowledge for a particular domain.
1.1.2 Fine-grained Data Exploration of Heterogeneous Datasets
In clinical research, investigators tend to work independently or in clusters of research
teams. Raw data collected from experiments or clinical trials are usually stored elec-
tronically on a computer. However, to perform independent analysis or verify ex-
perimental results, sharing data between different researchers or teams is necessary.
Furthermore, sharing and reuse of data is important for facilitating scientific discovery
and enhancing research reproducibility [4–7]. Multiple data repositories have been
built and are accessible to researchers, such as GDC - the National Cancer Institute’s
Genomic Data Commons [8], BioPortal - a repository of biomedical ontologies [9],
OpenfMRI - a repository for sharing task-based fMRI data [10], and NSRR - the
National Sleep Research Resource [11, 12]. These data repositories allow an investi-
gator to browse and download data under certain restrictions. However, not many
of them can enable users to conduct fine-grained, cross-dataset query, and explore
of the study-subject level before users decide which dataset to gain further access.
Study-subject level exploration can help researchers to quickly assess the feasibility of
studies or verify the research hypothesis without requesting further access and avoid
unnecessary data analysis. Researchers will be able to have a sense of the dataset
without downloading the whole dataset.
5
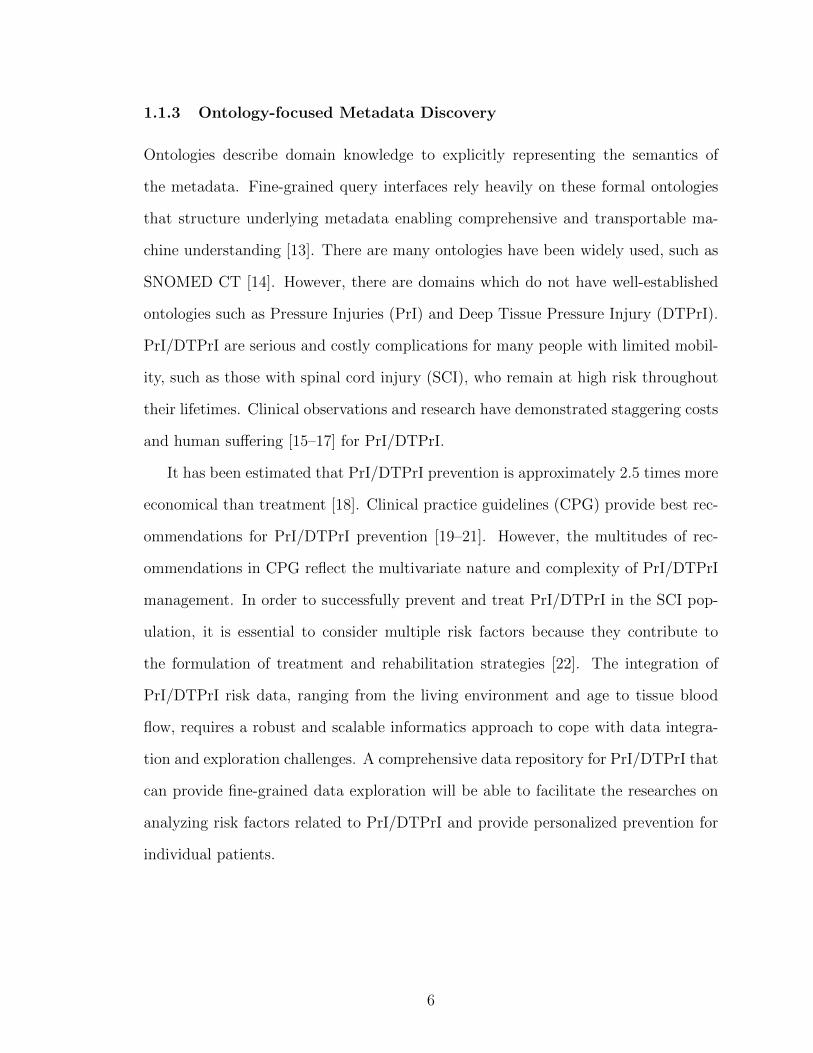
1.1.3 Ontology-focused Metadata Discovery
Ontologies describe domain knowledge to explicitly representing the semantics of
the metadata. Fine-grained query interfaces rely heavily on these formal ontologies
that structure underlying metadata enabling comprehensive and transportable ma-
chine understanding [13]. There are many ontologies have been widely used, such as
SNOMED CT [14]. However, there are domains which do not have well-established
ontologies such as Pressure Injuries (PrI) and Deep Tissue Pressure Injury (DTPrI).
PrI/DTPrI are serious and costly complications for many people with limited mobil-
ity, such as those with spinal cord injury (SCI), who remain at high risk throughout
their lifetimes. Clinical observations and research have demonstrated staggering costs
and human suffering [15–17] for PrI/DTPrI.
It has been estimated that PrI/DTPrI prevention is approximately 2.5 times more
economical than treatment [18]. Clinical practice guidelines (CPG) provide best rec-
ommendations for PrI/DTPrI prevention [19–21]. However, the multitudes of rec-
ommendations in CPG reflect the multivariate nature and complexity of PrI/DTPrI
management. In order to successfully prevent and treat PrI/DTPrI in the SCI pop-
ulation, it is essential to consider multiple risk factors because they contribute to
the formulation of treatment and rehabilitation strategies [22]. The integration of
PrI/DTPrI risk data, ranging from the living environment and age to tissue blood
flow, requires a robust and scalable informatics approach to cope with data integra-
tion and exploration challenges. A comprehensive data repository for PrI/DTPrI that
can provide fine-grained data exploration will be able to facilitate the researches on
analyzing risk factors related to PrI/DTPrI and provide personalized prevention for
individual patients.
6

1.1.4 Mappings among Data Dictionaries and Ontologies
Biomedical ontologies have gained a certain degree of intention in the past few years.
As more and more domains mature, ontologies have been developed for these domains
but part of these ontologies contain overlapping information. Knowledge of the re-
lationships between ontologies is important in terms of interoperability among these
ontologies and to promote ontology usage. Interoperability can be described as the ca-
pability to communicate, transfer information among several various systems. Other-
wise, newly or individually created ontologies are within limited usage. The situation
is also true for data dictionaries. Data dictionaries are created by different research
groups and institutes. These data dictionaries are used for data collections. For in-
stance, the Kentucky Cancer Registry (KCR) receives data about new cancer cases
from all healthcare facilities and physicians in Kentucky within 4 months of diagnosis.
These patient data are collected under the guidance of the North American Associa-
tion of Central Cancer Registries (NAACCR) [23] data dictionaries. NAACCR is a
collaborative umbrella organization for cancer registries. The NAACCR data stan-
dards and data dictionary provide detailed specifications and codes for each data item
in the NAACCR data. Such a data dictionary is not hierarchical or standardized.
To enable an ontology powered system, we need a mapping from a data dictionary
to an ontology. The National Cancer Institute Thesaurus [24] is a public domain
description logic-based terminology produced by the National Cancer Institute. It is
hierarchical and complex compared to most broad clinical vocabularies, with rich se-
mantic interrelationships between the nodes of its taxonomies. The mapping between
the NAACCR data dictionaries to NCIt is needed in such a case.
7

1.2 Contributions
To overcome these gaps and challenges, we propose a general framework called Meta-
Sphere. MetaSphere provides three major functionalities in terms of metadata man-
agement for clinical data integration. The first functionality is the structural, scalable,
and computer understandable way of metadata storage. MetaSphere stores the on-
tology and its associated concepts, variables, and domains in a scalable database.
Additionally, utilizing the database’s associations between tables, MetaSphere can
represent the relationships between concepts, the relationships between concepts and
variables, the relationships between variables and domains properly.
The second functionality is the fine-grained, cross-cohort query interface. MetaS-
phere hierarchically organizes ontology and its concepts and reflects such hierarchies
in the interface. With direct interaction, users will be able to browse the ontology’s
structures easily. Utilizing the query interface, users can compose complex queries to
query and explore data at the study-subject level.
Finally, MetaSphere provides an interactive, intuitive, and collaborative mapping
interface for building mapping between data dictionary to ontology, so as to facilitate
data analytics through interoperability and integration and provide semantic access
across aggregated data used in knowledge-based applications and services.
Our contributions are:
We created a general framework which can apply to different domains to facili-
tate the data exploration and remove the barriers standing between researches
hypothesis and data access.
We created an informatics platform, that enables data extraction, integration,
storage, and analysis to provide clinical decision support and user interfaces
direct access to well-annotated and deidentified wide range PrI risk factors of
data.
8

We created a dedicated Spinal Cord Injury Pressure Ulcer and Deep tissue injury
ontology (SCIPUDO) as the knowledge resource for processing specialized terms
related to spinal cord injury and pressure ulcer; 4) we created an interactive
and collaborative mapping interface aiming at connecting data dictionaries to
ontologies.
1.3 Organization of the Dissertation
This dissertation is organized as follows:
1. Chapter 2 reviews the background knowledge and information about this dis-
sertation;
2. Chapter 3 focuses on the design, methodology, and implementation of MetaS-
phere;
3. In Chapter 4 we go over the usage of MetaSphere for sleep domain, which is
the National Sleep Research Resource (NSRR) and discusses the limitation of
the traditional relational database in a high dimensional dataset. Besides, we
compare the query performance of traditional relational database and NoSQL
database;
4. Chapter 5 we present a NoSQL based MetaSphere applying in pressure ulcer
domain with detail statistical result of query result;
5. Chapter 6 discusses the feature-rich web-based interactive mapping interface
and the detailed mapping pipeline for building mappings from a data dictionary
to an ontology. Moreover, we will present an algorithm for constructing the
hierarchical structure from the source ontology.
6. Chapter 7 we conclude the work of this dissertation and discuss the future work
we can do to improve MetaSphere.
9

CHAPTER 2. Background
2.1 FAIR Data Principles
The FAIR Data Principles propose that making data Findable, Accessible, Interoper-
able, and Reusable [7] is a widely recognized set of guiding principles for biomedical
data management. The FAIR principles are essential for researchers to find the data
of interest, which may be further reused for generating or testing hypotheses. We
follow the FAIR Data Principles as our management guidelines while building our
data repositories and systems.
Findable. Finding data is the first step to use data. Data and supplementary
materials should be described with adequate metadata and making sure the
metadata and data are easy to find both humans and computers through a
unique and persistent identifier. It is a critical component of the FAIR verifica-
tion process to have both human and machine-understandable metadata.
Accessible. Accessing the data is the second step. Data should be deposited
in a trusted, reliable, and stable repository, and metadata are retrieval by their
identifier using a standardized communication protocol. Even when the data
are no longer available, the metadata should be accessible.
Interoperable. Usually, the data need to be integrated with other things, which
can provide a complete understanding of data and help users to apply the
data with products or systems. Additionally, the data need to interoperate
with applications or workflows for storage, processing, and analysis. To be
interoperable, both the data and metadata will need to use a standard language
for knowledge representation, which includes formal, accessible, shared, and
broadly applicable formats and vocabularies [25].
10

Reusable. The overall goal of FAIR is to enhance and optimize the reuse of data.
Metadata and data can be replicated or combined in different settings, and
reusable data should maintain its initial richness and provenance information
on how the data was formed. Besides, reusable data and metadata should meet
domainrelevant community standards to provide rich contextual information
that will allow for reuse [26].
2.2 The Role of Metadata
Metadata is information that describes instance data from a data source. Whenever
data is created, modified, acquired, and deleted, metadata is generated. For instance,
when you created a text file in the computer, metadata including the size of the
file, date of creation, the owner of the file are also generated. Metadata provides
an overview of the actual data. The goal of metadata is to make locating a specific
digital asset easier and quicker. Metadata is common in the usage of the biomedical
field, referred to as ontology in many cases.
Metadata is stored and maintained in a repository. Such a repository is usually a
structured storage and retrieval system and implemented on top of a database man-
agement system. For a specific domain, Metadata that needed to be stored consists
of the metadata schema and the semantics of metadata. The typical requirements for
metadata repositories are presented in Figure 4.1
The main purpose of a metadata repository is to provide necessary information
for users to achieve their goals. Therefore, a metadata repository should offer the
functionalities for querying, navigating, filtering, and browsing the metadata. Besides
the query of fixed attributes, filtering refers to the selection of related information
when search criteria are not necessarily provided by the schema of the repository. To
browse a metadata repository, a user-friendly graphical interface is required. Browsing
the content of a metadata repository is more than the metadata itself. Metadata is
11

Figure 2.1: Metadata Repository and the Tools using it.
the abstraction of the underlying actual data and it is extremely useful to fetch desired
data from a large amount of data.
2.3 A Review of Ontology Mapping
In this section, we provide a brief review of ontology mapping. Even though this
dissertation focuses on mapping from a data dictionary to an ontology, it is still useful
to review the ontology mapping tools evaluation and algorithms. Ontology mapping
is essential for providing access across data used in knowledge-based applications and
products. Different ontologies are used to annotate the same or similar domains.
For example, disease ontology (DO) is widely used by the research community, and
SNOMED CT is commonly used in healthcare researchers and clinicians. In such
cases, ontology mapping can find exact or similar matching in the hierarchy between
these two ontologies.
2.3.1 Ontology mapping tool functional requirements
Some basic requirements can be used to compare the exiting ontology mapping
tools [27]. These functional requirements consist of three aspects: 1) user inter-
12

face to visualize the source ontology and mapping alignment editor 2) framework to
include mapping workflow and mapping algorithm 3) import ontologies and export
mappings. These functional requirements can also be applied to a mapping between
a data dictionary and an ontology.
2.3.2 Ontology mapping algorithms
Ontology mapping algorithms are computational tools used to map between different
ontologies. Ontology mapping algorithms are widely used beyond the healthcare
domain [28]. It is useful to categorize the ontology mapping algorithms based on
different features and techniques. These mapping algorithms can be borrowed to map
from a data dictionary to an ontology. Figure 2.2 shows the detailed categorization.
Figure 2.2: Summary of ontology mapping algorithms. Extracted from the book”Ontology Matching” [28]
The categorization is not strictly enforced as some algorithms may implement
several techniques at the same time.
13

String based : these techniques are based on the similarity of string that repre-
sents the entities of ontologies such as names, descriptions (Cohen, Ravikumar,
and Fienberg, 2003 [29]).
Language based : these techniques based Natural Language Processing which
considers names as words, not just simple string (He, Yang, and Huang, 2011 [30]).
Constraint based : Consider the internal constraints applied to definitions of
entities, such as the domain and range of the properties.
Informal resource based : exploit external informal resources.
Formal resource based : use a formal resource, such as upper ontologies, domain-
specific ontology, and linked data.
Graph based : these techniques consider source ontology as nodes on labeled
graph (Joslyn, Paulson, and White, 2009 [31]).
Taxonomy based : similar to graph-based techniques but only consider special-
ization relation (Warin and Volk, 2004 [32]).
Model based : map source ontology based on semantic interpretation.
Instance based : explore a set of instances of the class to check if they match
(Loia, Fenza, De Maio, and Salerno, 2013 [33]).
All these aforementioned techniques could potentially be applied to building map-
ping from a data dictionary to an ontology.
2.4 National Sleep Resource Research (NSRR)
NSRR was funded by the National Heart, Lung, and Blood Institute and it was
designed to share de-identified sleep data obtained from NIH-funded cohort studies
14

and clinical trials from the sleep research community [11, 34]. NSRR provides a
web-based data portal that aggregates and organizes signal and clinical data from
over 26,000 patient subjects. NSRR has over 2,000 registered users since its launch
in 2014. Up to date, over 80 terabytes of data have been downloaded by the sleep
research community.
NSRR contains more than 14 sleep studies. These studies include Sleep Heart
Health Stud (SHHS), Childhood Adenotonsillectomy Trial (Chat), Heart Biomarker
Evaluation in Apnea Treatment (HeartBEAT), Cleveland Family Study (CFS), Study
of Osteoporotic Fractures (SOF), MrOS Sleep Study (MrOS), Cleveland Children’s
Sleep and Health Study (CCSHS), Hispanic Community Health Study/Study of Lati-
nos (HCHS/SOL), Honolulu-Asia Aging Study of Sleep Apnea (HAASSA), Multi-
Ethnic Study of Atherosclerosis (MESA), Home Positive Airway Pressure (Home-
PAP), Best Apnea Interventions for Research (BestAIR), and Apnea, Bariatric surgery
and CPAP study (ABC).
2.5 VA Informatics and Computing Infrastructure (VINCI)
The Veterans Affairs (VA) provides care for a large number of individuals with spinal
cord injuries. A large number of individuals combined with the extensive records for
each patient provides us with an unprecedented opportunity to analyze the impacts
of a wide range of PrI/DTPrI risk factors.
The VA has been developing electronic medical record systems since 1982 and its
latest system, Vista, since 1996[35]. It provides a comprehensive record of all aspects
of the VA healthcare system including each encounter a patient has with a provider.
Data from the Vista system is extracted and loaded into the VINCI system daily,
providing a rich pool of raw data for researchers.
The VA Informatics and Computing Infrastructure (VINCI) [36] is an initiative
to improve researchers’ access to VA data and to facilitate the analysis of those data
15

while ensuring Veterans’ privacy and data security. VINCI welcomes all researchers
in the VA community to explore the environment and tools available.
VINCI provides a rich data resource and a detailed personal characteristic database
of tissue health. Some of the sample data set are:
Corporate Data Warehouse (CDW) extractions from The Veterans Health In-
formation Systems and Technology Architecture (VistA)
MedSAS in SAS and SQL
Decision Support System (DSS) in SAS and SQL
Text Integration Utilities (TIU)
Radiology notes
2.6 Cancer Registry
2.6.1 National Cancer Institute Thesaurus (NCIt)
Cancer is a genetic disease, in which a series of molecular events lead to the runaway
reproduction of cancer cells. Over the past few years, the National Cancer Insti-
tute (NCI) has been putting efforts to integrate molecular and clinical cancer-related
information within a unified biomedical informatics framework. NCI Thesaurus is
designed to represent and integrate information from diverse areas, providing a struc-
tured and principled representation of key cancer-related concepts in areas such as
cancers, findings, drugs, therapies, anatomy, genes, pathways, cellular and subcellular
processes, proteins, and experimental organisms. NCIt [37] is the standard clinical
and medical terminologies specifically for cancer. It can be accessed by the web.
16

2.6.2 North American Association of Central Cancer Registries
In the late 1980s, problems originated from insufficient data standardization had
drawn attention from researchers. The lack of standardization had a substantial
cost and limited the more widespread use of valuable data. It is more impactful on
these three groups especially: state registries receiving data from hospital registries,
the NAACCR Data Evaluation and Publication committee, and the Commission on
Cancer’s (CoC) National Cancer Data Base (NCDB).
The lack of standardization occurred in many places. Data items that had the
same name and were used to represent the same information varied in their definition
and codes when used by different registries or software systems. Unknown data were
annotated by blanks, dashes, and defined codes. Other substantial discrepancies were
less easy to detect and correct. When hospitals and software providers were reporting
to a central registry and maintaining database consistent with CoC standards, they
faced conflicting standards and requirements.
The NAACCR’s (North American Association of Central Cancer Registries) was
established in 1987. It is a collaborative umbrella organization for groups and orga-
nizations interested in enhancing the quality and use of cancer registry data such as
cancer registries, governmental agencies, professional associations, and private groups
in North America [23, 38–40]. Currently, there are five NAACCR standards volumes.
In order to facilitate compilation and comparison of information across different
registries, one of the main goals for NAACCR was to standardize cancer registration
among the many standard-setting organizations in the United States and Canada.
Today, nearly all registries in North America have adopted the NAACCR consensus
standards. NAACCR updates these standards annually to meet the changing needs
of the registry community.
17

2.6.3 Kentucky Cancer Registry (KCR)
The Kentucky Cancer Registry (KCR) [41] is a central cancer registry that receives
data about new cancer cases from all healthcare facilities and physicians in Kentucky
within 4 months of diagnosis. KCR is part of the NCI’s Surveillance Epidemiology
and End Results (SEER) program.
18
CHAPTER 3. MetaSphere - A Systematic Approach For Metadata
Management for Clinical Data Integration
Agile methods of software development have been widely leveraged in recent years [42,
43]. Iterative and incremental development, evolving since the 1950s, has taken the
place of the waterfall model as the main-stream style of software development [42].
In this chapter, we will discuss the detailed design and methodology for developing
MetaSphere using agile development.
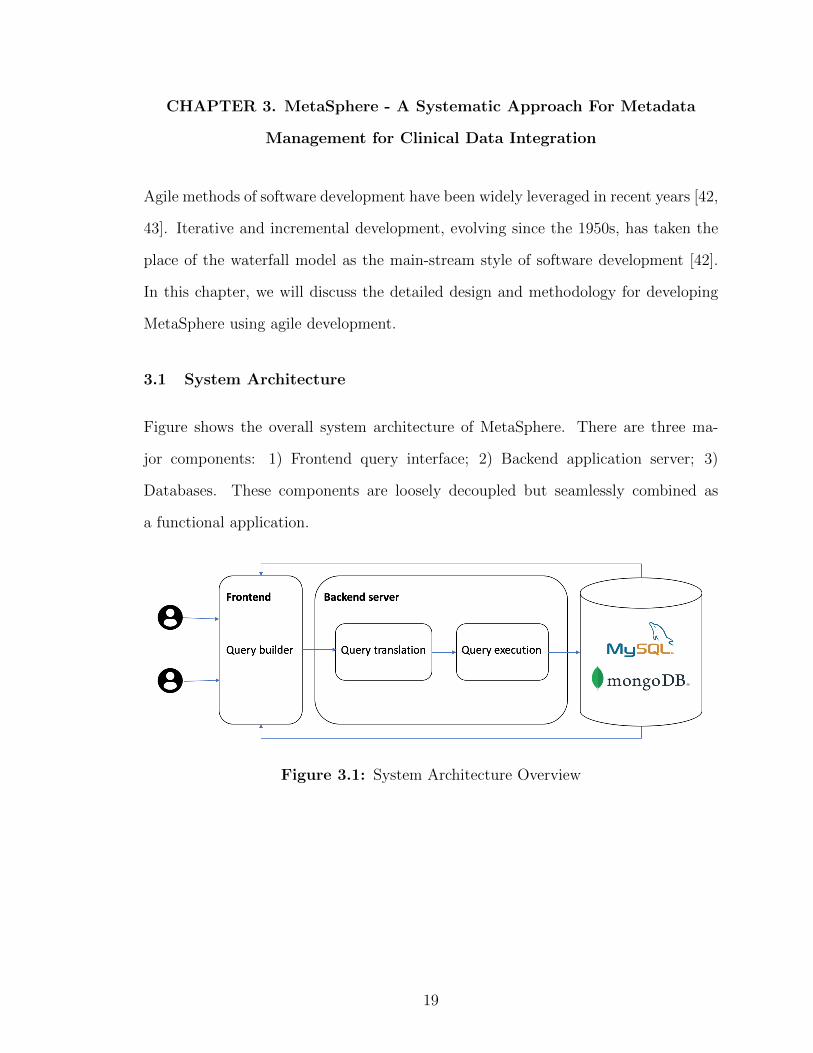
3.1 System Architecture
Figure shows the overall system architecture of MetaSphere. There are three ma-
jor components: 1) Frontend query interface; 2) Backend application server; 3)
Databases. These components are loosely decoupled but seamlessly combined as
a functional application.
Figure 3.1: System Architecture Overview
19

3.2 Frontend Query Interface
3.2.1 ReactJS - A JavaScript Library
ReactJS is a JavaScript library for building user interfaces [44]. It is created and
maintained by Facebook. It is used as a base in developing high-performance single-
page applications. ReactJS has become one of the widely used frameworks for building
frontend interfaces. There are several features which make it extremely successful and
these features perfectly match our development requirements.
Components based. The design philosophy of ReactJS is to separate a web
interface into different components. A root component is the entry point of the
interface. Each component has its own children’s components. In such a way,
an interface becomes a tree. Moreover, every component can be reusable since
its a placeholder to render different data. A typical interface will have many
repeated elements, such as many rows in one table. We then can make a row
as an individual component and pass in different data. ReactJS enhances the
reusability of codes even for frontend interface coding.
Virtual dom. Another notable feature is the use of a virtual Document Object
Model or virtual DOM. React creates an in-memory data structure cache, com-
putes the resulting differences, and then updates the browser’s displayed DOM
efficiently [45]. As shown in Figure 3.2, this allows the programmer to write
code as if the entire page is rendered on each change, while the React libraries
only render subcomponents that actually change. The virtual DOM feature
makes ReactJS updates efficient.
Single direction data flow. The data flows from the components itself to its
children components. With such setting, developers will be able to catch unex-
pected bugs quickly and easily. Figure 3.3 demonstrate the data flow in ReactJS.
20

Figure 3.2: Virtual DOM.
Figure 3.3: One direction data flow.
The aforementioned features make ReactJS a decent choice to build our MetaS-
phere frontend interface. Especially, we would like to represent the ontology hierarchi-
cal tree structure. In another way, we could view the component as a typical class in
a programming language and we are turning the interface design into object-oriented
programming. Figure 3.4 shows the detail of the core design. There are also other
21
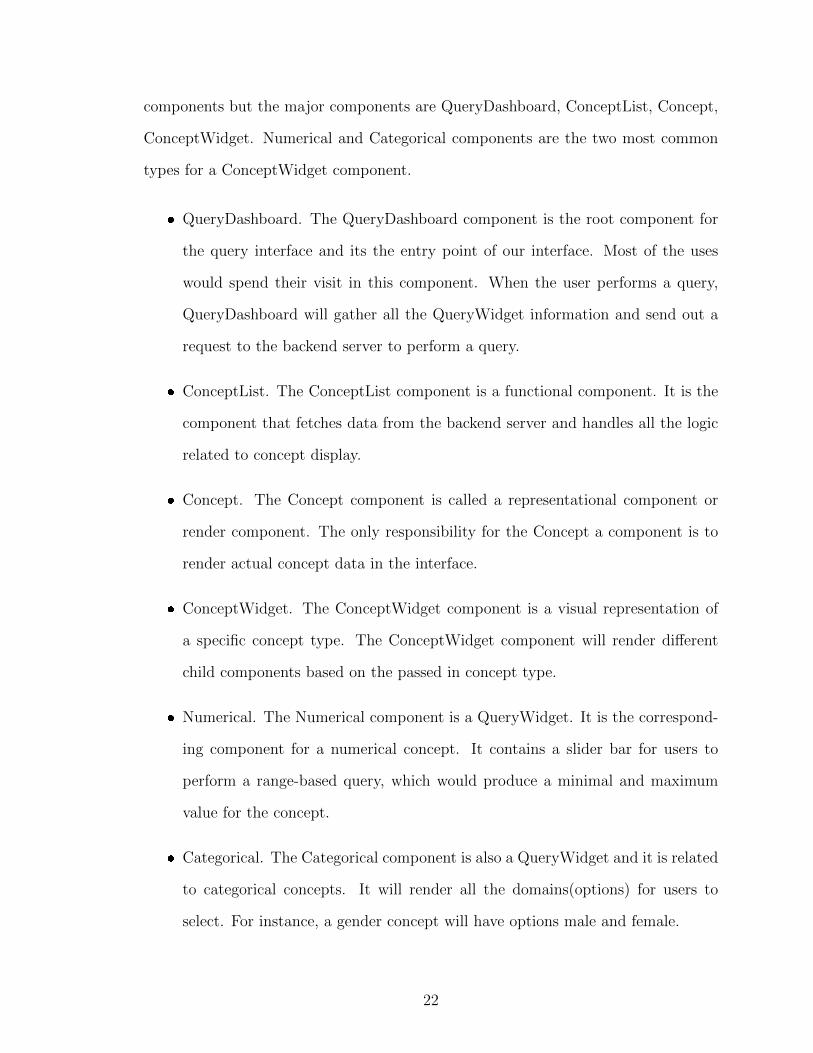
components but the major components are QueryDashboard, ConceptList, Concept,
ConceptWidget. Numerical and Categorical components are the two most common
types for a ConceptWidget component.
QueryDashboard. The QueryDashboard component is the root component for
the query interface and its the entry point of our interface. Most of the uses
would spend their visit in this component. When the user performs a query,
QueryDashboard will gather all the QueryWidget information and send out a
request to the backend server to perform a query.
ConceptList. The ConceptList component is a functional component. It is the
component that fetches data from the backend server and handles all the logic
related to concept display.
Concept. The Concept component is called a representational component or
render component. The only responsibility for the Concept a component is to
render actual concept data in the interface.
ConceptWidget. The ConceptWidget component is a visual representation of
a specific concept type. The ConceptWidget component will render different
child components based on the passed in concept type.
Numerical. The Numerical component is a QueryWidget. It is the correspond-
ing component for a numerical concept. It contains a slider bar for users to
perform a range-based query, which would produce a minimal and maximum
value for the concept.
Categorical. The Categorical component is also a QueryWidget and it is related
to categorical concepts. It will render all the domains(options) for users to
select. For instance, a gender concept will have options male and female.
22

Figure 3.4: UML diagram of the frontend query interface
3.2.2 From QueryWidget to Query Statement
From Figure 3.4, we notice that the Concept component has a function called ad-
dQueryWidget. When a user clicks on a Concept component, a QueryWidget will be
added to the interface. Suppose the concept added by the user is a numerical concept.
The Numerical component will be rendered. When the user specifies the minimal
value and maximum value he/she would like to query, the function addToStatement
is triggered. The addToStatement function will pass the concept identifier, mini-
mal and maximum value to the QueryDashboard. Then the QueryDashboard will
modify its attribute queryStatement. If a user clicks the close icon in the QueryWid-
get, function removeQueryWidget is triggered and the corresponding statement from
queryStatement will be removed. For a categorical concept, a similar process but the
23

passed data is a little bit different. Instead of passing minimal and maximum values,
a set of options selected by users will be passed into the QueryDashboard. Here,
we demonstrate the process from QueryWidget to actual queryStatement. There are
more types of concepts in actual usages. But, our design is scalable. A new type of
concept can be added by adding a corresponding component without touching existing
concept components. After constructing the query using our QueryDashboard, users
submit the queryStatement and it is our backend server responsibilities to handle the
incoming request.
3.3 Backend Application Server
In the previous section, we talked about the transformation from query widgets to
actual query statements. In this section, we will describe how the backend server
handles such requests.
The backend server is built using Ruby on Rails [46]. Ruby on Rails is a framework
that makes it easier to develop, deploy, and maintain web applications.
3.3.1 Models, Views, and Controllers
Ruby on Rails follows the architecture known as MVC. Figure 3.5 shows MVC in
abstract terms.
Figure 3.5: The Model-View-Controller Architecture
The model maintains the state of the application. The state of an application
24

could be temporary or permanent. Temporary state lasts a few interactions with the
users, while the permanent state will be stored outside the application, typically a
database. model is more than data. It enforces and handles rules applied to the data.
model also represents the abstracted entities from the real world.
The view is responsible for generating a user interface, normally based view on
data in the model. The aforementioned ReactJS falls in the view component. For
example, a clinical discharge summary application will have a list of patients to be
displayed on a dashboard screen. This list will be accessible via the model, but it
will be a view that accesses the list from the model and formats it for the end-user.
Although the view may present the user with various ways of inputting data, the
view itself never handles incoming data. The view ’s work is done once the data is
displayed. There may well be many views that access the same model data, often
for different purposes. In the clinical discharge summary application, there will be a
view that displays patient information on a dashboard page and another set of views
used by administrators to add and edit patient.
Controllers orchestrate the application. Controllers receive events from the Con-
trollers outside world (normally user input), interact with the model, and display an
appropriate view to the user.
There are three core data models in MetaSphere: 1) Concept; 2) Variable; 3)
Domain as shown in Figure 3.6.
Concept. The Concept model contains information about the ontology concept.
Some common and required attributes are concept name, concept type, and
description. Besides, ontology is with a hierarchical structure. To represent
such a hierarchical structure, we have a special attribute called parent id, which
points to the parent concept of the current one. If a concept does not have a
parent concept, it is a root concept.
Variable. The Variable model represents the instance of a concept from a differ-
25

Figure 3.6: Core data model and their relationships in MetaSphere
ent data source. The variable is essential for a cross-cohort exploration interface.
Imaging we have two data source and each of them contains information about
patient gender. In data source one, gender is annotated as gender, but in data
source two gender is annotated as sex. They denote the same concept, but
with a different instance. To maintain the relationships between concepts and
variables, we used dedicated mapping. A mapping will show the one-to-one
relationship from a variable to a concept.
Domain. The Domain model is critical for categorical concepts. The Domain
model consists of possible options for a categorical concept. In reality, many
options are commonly shared by multiple variables. Therefore, the domain
model is a dedicated model to reduce the duplication of our data.
3.3.2 Query Translation and Query Execution
The frontend interface translates the QueryWidget into an actual query statement
and sends these statements to our backend server. Once the backend server receives
these statements, it will translate these statements into corresponding actual database
query statements using predefined templates. The detail of these templates will be
26
discussed in the following chapters. Basically, we have two translations that occurred
before acquiring the query results. Once all the translations are done, the backend
server will be able to execute the query and return the result to the frontend interface.
3.4 Metadata storage and Data repository
There are two types of data we need to store in the database. One is the metadata,
and the other one is the actual data. Metadata includes data aforementioned, like
ontology concepts, data dictionaries from a different data source, and user-related
data. The actual data is the data that users can query and explore. To store these
data, we can use different types of databases. One option is the traditional relational
database and the other one is the NoSQL databases. However, even for relational
databases, there are databases like SQLite, MySQL, and PostgreSQL. We need to
make MetaSphere scalable in terms of adding support for new databases. To achieve
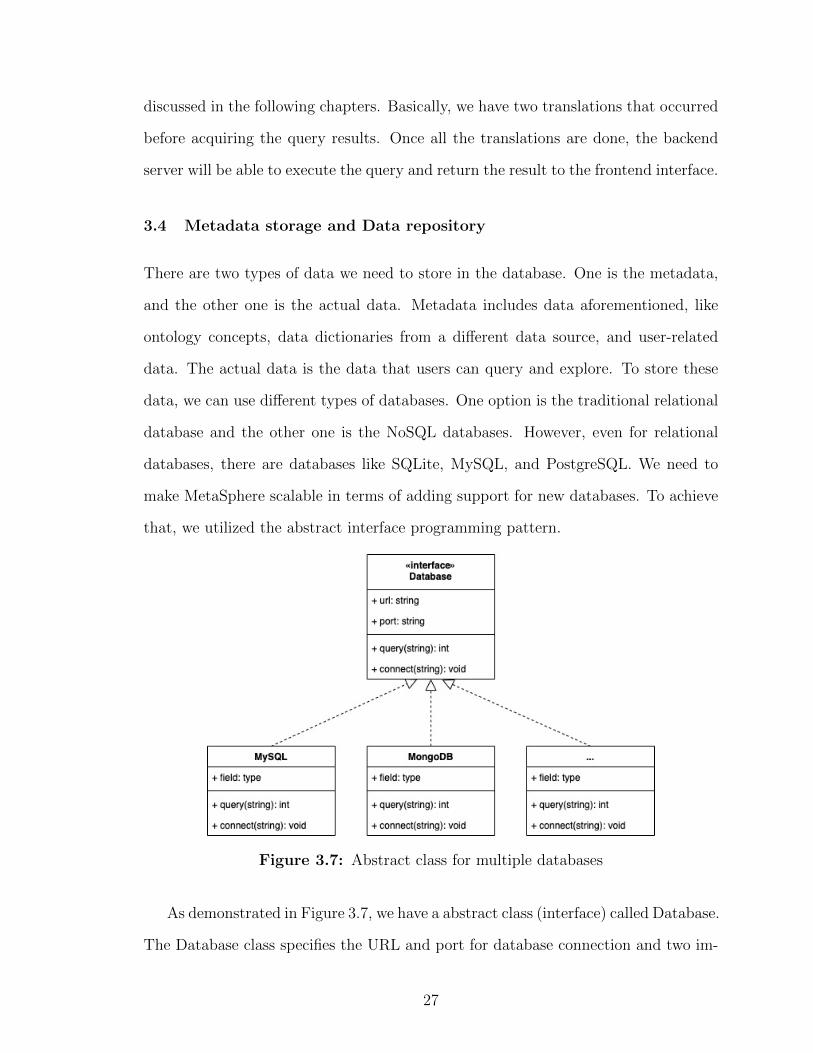
that, we utilized the abstract interface programming pattern.
Figure 3.7: Abstract class for multiple databases
As demonstrated in Figure 3.7, we have a abstract class (interface) called Database.
The Database class specifies the URL and port for database connection and two im-
27

portant functions: connect and query. Once such interface is defined, then adding a
new database will be implementing the interface for the corresponding database. In
such a way, we leave the existing databases untouched and make adding new databases
scalable.
In this chapter, we introduce a general framework called Metadata aiming to
address the challenges mentioned in Chapter 2. In the next few chapters, we will talk
about how we apply the framework to different domains.
28

CHAPTER 4. National Sleep Resource Research (NSRR)
In Chapter 3, we introduce a general framework called Metadata aiming to address
the challenges mentioned in chapter two. In this chapter, we will talk about how
we apply such a framework to sleep domains, specifically NSRR. Moreover, we will
discuss the limitations of SQL-based MetaSphere and carry on a comparison study
over SQL-based MetaSphere and NoSQL-based MetaSphere.
4.1 Motivation and Challenges
Sharing and reusing biomedical digital data have gained increasing attention to ac-
celerate scientific discovery and enhance research reproducibility [4–7]. Various data
repositories have been developed and made available for biomedical researchers, such
as UniProt - a comprehensive resource for protein sequence and annotation data [47],
GDC - the National Cancer Institute’s Genomic Data Commons [48], BioPortal - a
repository of biomedical ontologies [9], OpenfMRI - a repository for sharing task-based
fMRI data [10], and NSRR - the National Sleep Research Resource [11, 12, 34].
A widely endorsed set of guiding principles for biomedical data management
in data repositories is FAIR: making data Findable, Accessible, Interoperable, and
Reusable [7]. The FAIR principles are essential for researchers to find the data of in-
terest, which may be further reused for generating or testing hypotheses. While most
existing data repositories enable researchers to browse and download data - sometimes
under data use or regulatory constraints, very few allow users to freely and openly
perform fine-grained, cross-dataset query and exploration of the study-subject level
before deciding which specific datasets to gain further access. Such fine-grained data
exploration capabilities allow users to compose complex queries over a large number
of cohorts, quickly assess the feasibility of research studies or generate/test potential
hypotheses, and then make appropriate full data access requests.
29

4.2 Related work
To support the fast generation of hypotheses and assessment of the feasibility of
research studies, various cohort discovery tools have been developed to facilitate the
identification of potential research subjects satisfying certain characteristics.
Murphy et al. [49] had developed a cohort selection (or counting) system for
the Informatics for Integrating Biology and the Bedside (i2b2) project, which has
been widely adopted for querying the count of eligible patients in a single clinical
data repository. To support patient cohort identification from multiple data sources,
Weber et al. [50] have developed the Shared Health Research Information Network
(SHRINE) based on i2b2. SHRINE requires the underlying data sources to have
the same data structure based on i2b2. Distinct from SHRINE, our X-search was
designed to query multiple data sources with heterogeneous data structures.
Zhang et al. [51] have designed and implemented a query interface VISAGE (VI-
Sual AGgregator and Explorer) for query patient cohorts. Our X-search shares a
similar visual interface design with VISAGE (e.g., checkboxes for categorical vari-
ables, and slider bar for numerical variables), but differs from VISAGE in that it
adopts a data warehouse approach to harmonize data sources before querying rather
than a federated approach to directly query the data sources.
Bache et al. [52] defined and validated an adaptable architecture (we refer to it as
Bache’s architecture) for identifying patient cohorts from multiple heterogeneous data
sources. Bache’s architecture supports multiple data sources with heterogeneous data
structures and handles the heterogeneity in the query translation step. Our X-search
differs in that it handles the data heterogeneity in the data loading step, which saves
users’ waiting time for query translation.
Another related work is the Observational Medical Outcomes Partnership (OMOP)
Common Data Model (CDM) [53] for representing healthcare data from diverse
30

sources in a standardized way, which is open-source and maintained by an inter-
national collaborative, Observational Health Data Sciences and Informatics (OHDSI)
program [54]. OMOP CDM standardizes data structure and common vocabularies
(e.g., SNOMED CT, ICD9CM, RxNorm) across disparate sources, such as electronic
health records, administrative claims, and clinical data. A natural question would
be whether the OMOP CDM could be directly used for modeling NSRR datasets.
However, significant effort needs to be made to transform NSRR datasets into the
utilization of standardized vocabularies, and there may not be direct transformation
due to the fine-grained, sleep-related data elements. It would be interesting to explore
the generalizability of OMOP CDM using the NSRR datasets.
There are existing tools on standardizing and harmonizing data elements for clin-
ical research studies such as eleMAP [55] and D2Refine [56], which enable researchers
to harmonize local data elements to existing metadata and terminology standards
such as the caDSR (Cancer Data Standards Registry and Repository) [57] and NCI
Thesaurus [58]. Such tools may be useful for us to map NSRR data elements to
existing standards.
4.3 Overview of NSRR
Funded by the National Heart, Lung, and Blood Institute, NSRR was designed to
share de-identified sleep data obtained from NIH-funded cohort studies and clinical
trials with the sleep research community [11]. NSRR provides a web-based data
portal [34] that aggregates and organizes signal and clinical data from over 26,000
patient subjects. NSRR has over 2,000 registered users since its launch in 2014.
Up to date, over 80 terabytes of data have been downloaded by the sleep research
community.
Clinical data from eight datasets in NSRR [34] are used as data sources in this re-
search, including Sleep Heart Health Study (SHHS) [59–61], Childhood Adenotonsillec-
31
tomy Trial (CHAT) [62–64], Cleveland Family Study (CFS) [65–67], Heart Biomarker
Evaluation in Apnea Treatment (HEARTBEAT) [68], Study of Osteoporotic Fractures
(SOF) [69], MrOS Sleep Study (MrOS) [70], Hispanic Community Health Study /
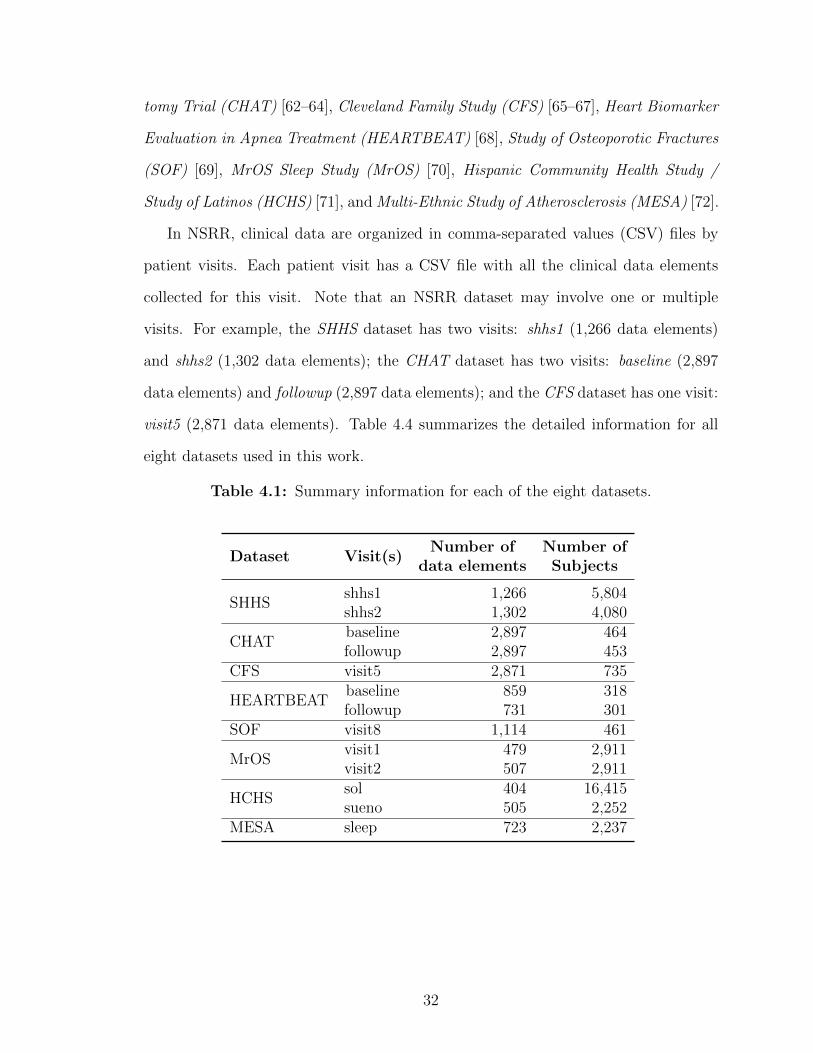
Study of Latinos (HCHS) [71], and Multi-Ethnic Study of Atherosclerosis (MESA) [72].
In NSRR, clinical data are organized in comma-separated values (CSV) files by
patient visits. Each patient visit has a CSV file with all the clinical data elements
collected for this visit. Note that an NSRR dataset may involve one or multiple
visits. For example, the SHHS dataset has two visits: shhs1 (1,266 data elements)
and shhs2 (1,302 data elements); the CHAT dataset has two visits: baseline (2,897
data elements) and followup (2,897 data elements); and the CFS dataset has one visit:
visit5 (2,871 data elements). Table 4.4 summarizes the detailed information for all
eight datasets used in this work.
Table 4.1: Summary information for each of the eight datasets.
Dataset Visit(s)Number of
data elementsNumber ofSubjects
SHHSshhs1shhs2
1,2661,302
5,8044,080
CHATbaselinefollowup
2,8972,897
464453
CFS visit5 2,871 735
HEARTBEATbaselinefollowup
859731
318301
SOF visit8 1,114 461
MrOSvisit1visit2
479507
2,9112,911
HCHSsolsueno
404505
16,4152,252
MESA sleep 723 2,237
32

4.4 Method
Our overall objective is to create an open-access query interface that allows a user
to perform an aggregated search on NSRR content before requesting full access to
specific datasets. To do so, we designed the system architecture to be comprised of
two major components: a semantically annotated data repository with heterogeneous
datasets (Figure. 4.1, left) and the cross-cohort exploration engine (Figure. 4.1, right).
Figure 4.1: The architecture for query system. Left: Open data repository withheterogeneous data sources. Right: The cross-cohort exploration system.
We assume that the datasets (or data sources) are in the structured format which
can be loaded to relational databases such as MySQL. Each data source has a ded-
icated data dictionary that originated from the source study and available for open
access through NSRR. The data dictionary describes the data elements in the dataset,
including names, definitions, data types, units, and value domains (or allowable val-
ues). The canonical data dictionary consists of core query terms (or common data
elements) across different datasets. Here a common data element is a data element
that is common to multiple NSRR data sets. Each mapping involves the data element
mappings between the source data dictionary and the canonical data dictionary.
33

The cross-cohort exploration engine consists of five components: query builder,
graphical exploration, case-control exploration, query translation, and query execu-
tion. The query builder, graphical exploration, and case-control exploration compo-
nents involve visual interfaces and use the canonical data dictionary as the query and
exploration terms. The query translation module translates a user query composed in
the query builder to the actual query statement in SQL. The query execution module
connects to each database (or data source) and executes the query statement.
4.4.1 Data repository
4.4.1.1 Data sources and data dictionaries
We used nine datasets in the NSRR data repository: Sleep Heart Health Study
(SHHS), Childhood Adenotonsillectomy Trial (CHAT), Heart Biomarker Evaluation
in Apnea Treatment (HeartBEAT), Cleveland Family Study (CFS), Study of Osteo-
porotic Fractures (SOF), Osteoporotic Fractures in Men Study (MrOS), Cleveland
Children’s Sleep and Health Study (CCSHS), Hispanic Community Health Study/Study
of Latinos (HCHS/SOL), and Multi-Ethnic Study of Atherosclerosis (MESA). Each
dataset may involve multiple patient visits, where the actual data records for each
visit is stored in a comma-separated values (CSV) file.
Each data source has a data dictionary semantically defining the scope and char-
acteristics of data elements (or variables) in the dataset, including the short name,
display name, description, type, unit, domain, and synonyms. The short name of
a variable is the actual column name used in the database storing the dataset and
serves as the unique identifier for a variable (note that one dataset may have the same
variable in different patient visits). The display name is the variable name shown to
users in the visual interface, and it is more informative than the short name. The
description provides more detailed information about the variable such as meta in-
formation. The type defines the data type of a variable, such as identifier, numeric,
34

and categorical. The unit is applicable to numeric variables describing a measurable
quantity. The domain specifies the allowable values for a categorical variable. The
label stores the synonyms or indexed terms that can be used to retrieve the variable.
The data dictionary containing the above-mentioned information can be structurally
specified in CSV files.
4.4.1.2 Canonical data dictionary and mappings
The canonical data dictionary specifies the common data elements across different
data sources. These common data elements serve as the core query terms in the
visual interface for users to browse or search. The core terms capture demographic
information (e.g., age, gender, race), anthropometric parameters (e.g., body mass
index, height, weight), physiological measurements (e.g., heart rate, diastolic blood
pressure, systolic blood pressure), medical history (e.g., asthma, atrial fibrillation,
insomnia, sleep apnea), medications (e.g., benzodiazepine, estrogen, progestin), sleep
study data (e.g., sleep duration, quality of sleep, obstructive sleep apnea events, apnea
hypopnea index, average oxygen saturation during sleep), and laboratory data (e.g.,
HDL cholesterol, creatinine). In addition, these data elements are mapped and linked
to the NIH Common Data Element (CDE) repository [73] if applicable.
Since a data element in the canonical data dictionary may have different variable
names in disparate data sources, there is a need for a mapping from each individual
data source to the canonical data dictionary. Therefore, for each data source, a
uniform mapping template is utilized to map the source data elements to the common
data elements (m to 1 mapping). Take the common data element ”body mass index”
as an example, there are two data elements in the SHHS dataset mapping to it
(”bmi s1” in the baseline visit, and ”bmi s2” in the followup visit); and there are two
data elements in the HeartBEAT dataset mapping to it (”bmi scrn” and ”calc bmi”
in the baseline visit).
35

4.4.1.3 Coding inconsistency harmonization
A unique challenge in exploring data in multiple heterogeneous data sources is
to address the coding inconsistency issue, which involves the detection and harmo-
nization of inconsistencies among the disparate value domains for the same data
element. Such inconsistencies occur frequently for categorical variables. For instance,
the ”gender” variable has inconsistent codings across the nine datasets in NSRR (see
Table 4.2), where 1 represents ”Male” and 2 represents ”Female” in SHHS, whereas
1 represents ”Male” and 0 represents ”Female” in HeartBEAT, and 1 represents ”Fe-
male” and 2 represents ”Male” in MrOS. Such heterogeneity must be harmonized to
ensure that data exploration activities obtain accurate results. In order to achieve
this, an automated program has been developed to detect the inconsistent codings
among different datasets by leveraging the canonical data dictionary, each source data
dictionary, and the mappings between source data dictionaries and the canonical data
dictionary.
To harmonize the detected inconsistencies, a manual review has been involved
to define the uniform codings and create appropriate mappings from heterogeneous
codings to the uniform coding. Take the ”gender” codings in Table 4.2 as an example,
a uniform coding with 1 representing ”Male” and 2 representing ”Female” can be
defined, and heterogeneous codings in the original data sources can be mapped to
the uniform coding (each row is a mapping). This harmonization step is essential to
ensure data interoperability across disparate data sources.
4.4.1.4 Data loading
To support the cross-cohort exploration activities, we need to import the actual
data in each dataset, load common data elements in the canonical data dictionary
and mappings, and harmonize coding inconsistencies. This process is described in
the following three steps.
36
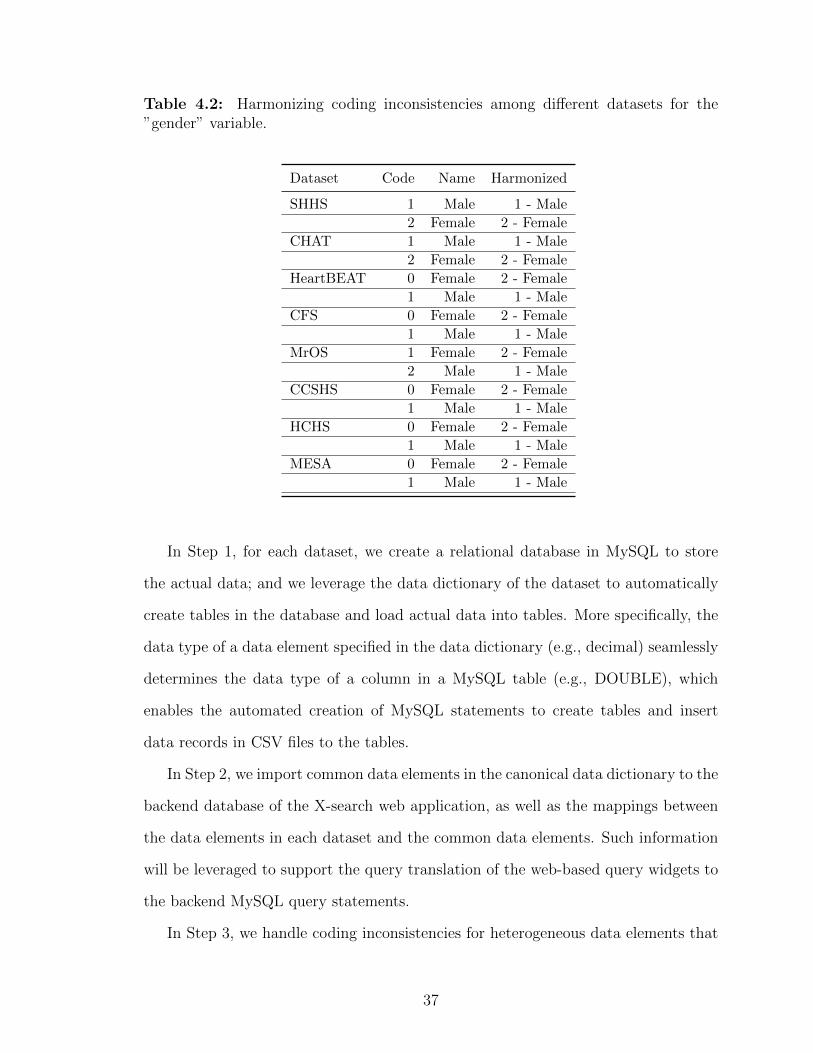
Table 4.2: Harmonizing coding inconsistencies among different datasets for the”gender” variable.
Dataset Code Name Harmonized
SHHS 1 Male 1 - Male
2 Female 2 - Female
CHAT 1 Male 1 - Male
2 Female 2 - Female
HeartBEAT 0 Female 2 - Female
1 Male 1 - Male
CFS 0 Female 2 - Female
1 Male 1 - Male
MrOS 1 Female 2 - Female
2 Male 1 - Male
CCSHS 0 Female 2 - Female
1 Male 1 - Male
HCHS 0 Female 2 - Female
1 Male 1 - Male
MESA 0 Female 2 - Female
1 Male 1 - Male
In Step 1, for each dataset, we create a relational database in MySQL to store
the actual data; and we leverage the data dictionary of the dataset to automatically
create tables in the database and load actual data into tables. More specifically, the
data type of a data element specified in the data dictionary (e.g., decimal) seamlessly
determines the data type of a column in a MySQL table (e.g., DOUBLE), which
enables the automated creation of MySQL statements to create tables and insert
data records in CSV files to the tables.
In Step 2, we import common data elements in the canonical data dictionary to the
backend database of the X-search web application, as well as the mappings between
the data elements in each dataset and the common data elements. Such information
will be leveraged to support the query translation of the web-based query widgets to
the backend MySQL query statements.
In Step 3, we handle coding inconsistencies for heterogeneous data elements that
37

are mapped to the same common data element. There are two options: (1) harmonize
the actual data in each dataset according to the uniform codings, so that the query
translation step can directly use the uniform codings to create common SQL query
statements for disparate datasets; (2) keep the actual data in each dataset as is, and
rely on the query translation step to utilize the mappings to the uniform codings to
generate different SQL query statements for disparate datasets. Although the latter
option saves time and effort to update the loaded data, the former option saves the
query time due to less hassle on the query translation step. In this work, we have
adopted the first option to speed up the query translation process and reduce users’
waiting time when performing data exploration activities.
4.4.2 The X-search cross-cohort exploration engine
4.4.2.1 Query builder
A powerful and intuitive interface, called query builder, has been designed and
developed to enable researchers to quickly find the right common data elements and
perform an exploratory cross-cohort query. The query builder consists of the four
areas which are corresponding to four steps to perform cross-cohort queries as follows.
(1) Area to select datasets, where users can choose a collection of datasets to focus
on; (2) Area to add query terms, where users can look for query terms (or common
data elements) of interest; (3) Area to construct queries, where query criteria can
be specified for each query term; (4) Area for query results, where retrieved subject
counts satisfying query criteria are returned to users.
In the area to add query terms, there are two modes to look for common data
elements of interest: browsing and search. The browsing mode provides a hierarchical
view of query terms so that novice users can explore all the available common data
elements level by level. The search mode enables expert users to directly search for
query terms of interest. The query builder uses a dynamic mechanism to generate
38
visual query widgets corresponding to selected query terms. For instance, selecting
a categorical term generates a widget with checkboxes for specifying possible values;
and selecting a numerical term generates a widget with a slider bar for specifying a
range of values.
The query builder interface is a general design such that each area serves as a
placeholder where the content of each area can be filled automatically with research
data in different domains. In this work, the area to select datasets is filled with the
names of the nine datasets from NSRR, the area to add query terms consists of the
canonical data dictionary terms, the area to construct queries contains dynamic query
widgets corresponding to the selected query terms, and the area for query results is
driven by the query criteria specified in the area to construct queries.
4.4.2.2 Graphical exploration
The graphical exploration interface has been designed to support the visual ex-
ploration of two common data elements (say x and y corresponding to x-axis and
y-axis). The graphical views include bar plots and box plots. Bar plots are shown
when the y-axis is a categorical common data element, and box plots are displayed
when the y-axis is a numeric common data element. Such plots enable users to have
a better understanding of the data distribution of y against x. Since there may be
multiple variables in each individual dataset that are mapped to x or y, multiple plots
are generated for each pair of variables.
4.4.2.3 Case-control exploration
The case-control exploration interface allows registered users to perform cross-
cohort case-control analyses. It provides a general template for users to build a
case-control exploration step by step. Step 1 is to set base query terms, where users
can specify the criteria for the base population (e.g., age between 45 and 85 years,
body mass index between 30 and 85 kilograms per square meter, and no history of
39

cardiovascular disease). Step 2 is to set the condition for cases (e.g., had diabetes).
Step 3 is to set the condition for controls (e.g. no history of diabetes). Step 4 is to
set the match terms (e.g., gender and ethnicity). Step 5 is to set outcome terms (e.g.,
obstructive sleep apnea). The result of the case-control exploration is displayed as a
table with case and control counts for the match and outcome terms.
4.4.2.4 Query translation and execution
The query translation module automatically translates the user’s specifications
captured by the visual interface into actual MySQL statements to query backend
databases. The translation relies on the query terms and values specified in the
visual interface, as well as the mappings between each individual data dictionary
and the canonical data dictionary. The query statements for multiple data sources
are distinct since these data sources have different tables and column information
mapping to a common data element.
For each type of common data elements, a general template is predefined and used
for dynamically generating the actual MySQL statement for query translation. For
example, the general template for querying a numeric common data element with a
specified range (min, max) is predefined as:
SELECT COUNT (DISTINCT<mapping.table. identifier>)
FROM <mapping.table>
WHERE <mapping.column>
BETWEEN <min> AND <max>;
Here ¡mapping.table¿ and ¡mapping.column¿ represent the data source table and
column to which the common data element is mapped to in a dataset. All the variables
in the angle brackets can be replaced by real values to generate the actual MySQL
statements for different datasets.
40

The translated MySQL statements are sent to the corresponding data sources to
perform the query execution. For the query builder interface, the query execution
returns numeric counts of potentially eligible subjects satisfying the query criteria.
For the graphical exploration interface, the query execution returns the actual values
of data elements for eligible subjects, which are further plotted visually. For the
case-control interface, the query execution returns the actual values of data elements
for both cases and controls, which are further processed to generate the table-format
view with case- and control-counts displayed for the match and outcome terms.
4.5 Result
4.5.1 Data repository
We used MySQL databases to store the nine datasets. Table 4.3 lists the names of
the datasets, the names of the visits, the numbers of data elements (or variables),
the numbers of subjects, and the numbers of mapped variables to the canonical data
dictionary. Note that the mapped variables in each visit of a dataset are a subset of
all the variables in the visit. The canonical data dictionary contained a total of 919
common data elements (554 of them are specific to the sleep research domain and 365
of them are common across study domains). Among them, 42 were detected to have
inconsistent codings across different datasets, including ”gender,” ”race,” ”history of
asthma,” and ”history of sleep apnea.” A total of 830 mappings from heterogeneous
codings to the uniform codings were created to harmonize the data with inconsistent
codings. In addition, 57 elements in the canonical data dictionary were linked to the
NIH Common Data Element (CDE).
4.5.2 Cross-cohort exploration engine
We implemented the X-search cross-cohort exploration engine using Ruby on Rails, an
agile web development framework. It has been deployed at https://www.x-search.net/
41
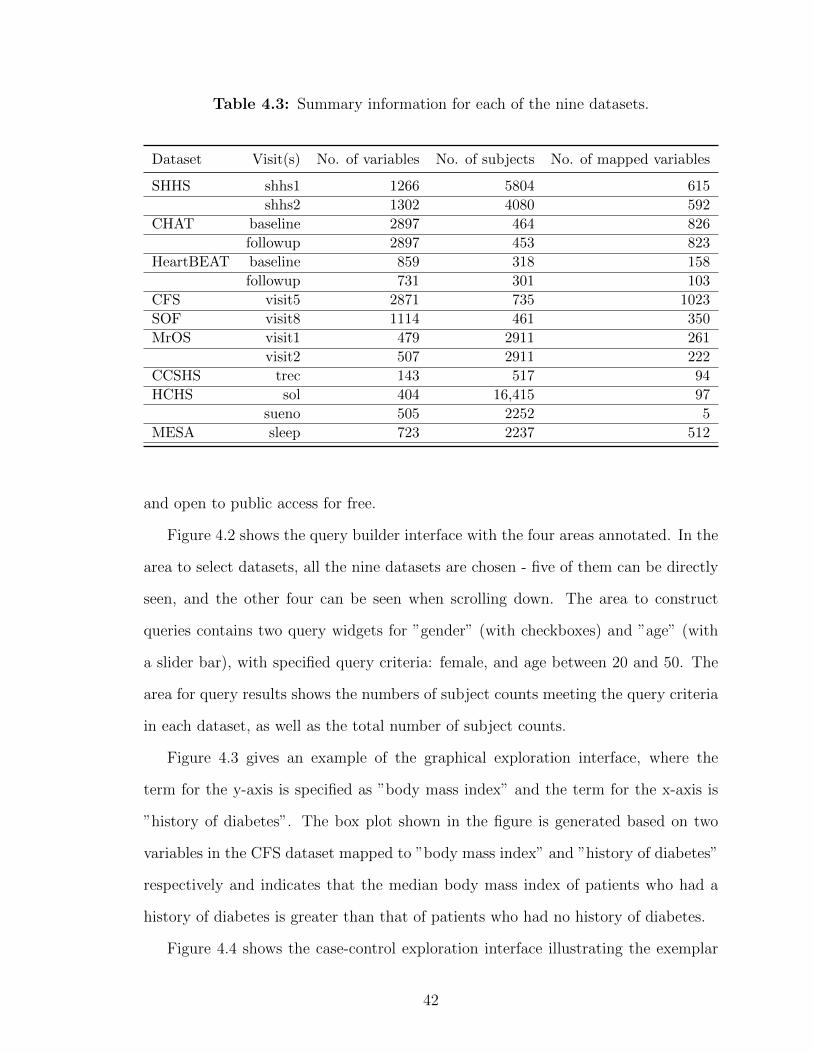
Table 4.3: Summary information for each of the nine datasets.
Dataset Visit(s) No. of variables No. of subjects No. of mapped variables
SHHS shhs1 1266 5804 615
shhs2 1302 4080 592
CHAT baseline 2897 464 826
followup 2897 453 823
HeartBEAT baseline 859 318 158
followup 731 301 103
CFS visit5 2871 735 1023
SOF visit8 1114 461 350
MrOS visit1 479 2911 261
visit2 507 2911 222
CCSHS trec 143 517 94
HCHS sol 404 16,415 97
sueno 505 2252 5
MESA sleep 723 2237 512
and open to public access for free.
Figure 4.2 shows the query builder interface with the four areas annotated. In the
area to select datasets, all the nine datasets are chosen - five of them can be directly
seen, and the other four can be seen when scrolling down. The area to construct
queries contains two query widgets for ”gender” (with checkboxes) and ”age” (with
a slider bar), with specified query criteria: female, and age between 20 and 50. The
area for query results shows the numbers of subject counts meeting the query criteria
in each dataset, as well as the total number of subject counts.
Figure 4.3 gives an example of the graphical exploration interface, where the
term for the y-axis is specified as ”body mass index” and the term for the x-axis is
”history of diabetes”. The box plot shown in the figure is generated based on two
variables in the CFS dataset mapped to ”body mass index” and ”history of diabetes”
respectively and indicates that the median body mass index of patients who had a
history of diabetes is greater than that of patients who had no history of diabetes.
Figure 4.4 shows the case-control exploration interface illustrating the exemplar
42

Figure 4.2: Screenshot of the query builder interface. Four areas: (1) SelectDatasets; (2) Add Query Terms; (3) Construct Query; (4) Query Results. Thisexample queries the numbers of female patient subjects aged between 20 and 50.
steps mentioned in the Methods section. This example is to explore: In elderly
(base query: age between 45 and 85 years), obese people (base query: body mass
index between 30 and 85) without cardiovascular disease (base query: no history of
cardiovascular disease), whether the presence of self-reported diabetes (case condition:
had a history of diabetes, control condition: no history of diabetes) is related to sleep
apnea (outcome term: obstructive sleep apneas/hours).
The cross-cohort exploration system supports additional functionalities, including
the query manager, case-control manager, and International Classification of Sleep
Disorders (ICSD) query builder. Query and case-control managers allow users to save
queries and case-control explorations for reuse. ICSD query builder is a dedicated
query builder for more complicated ICSD terms.
43

Figure 4.3: Screenshot of the graphical exploration interface. This example showsone of the box plots generated for body mass index (BMI) against diabetes.
Figure 4.4: Screenshot of the case-control exploration interface. This example is toexplore: In elderly, obese people without cardiovascular disease, whether the presenceof self-reported diabetes is related to sleep apnea (apnea-hypopnea ¿=15 events/hour).
4.5.3 Usage
the cross-cohort exploration system has received 1,835 queries from users in a wide
range of geographical regions (16 countries), including Australia, Canada, China,
44

France, India, South Africa, the United Kingdom, and the United States.
Figure 4.5 shows the number of times each of the nine datasets got queried (note
that each user query may involve multiple datasets). And the top ten query terms
are: ”age,” ”obstructive sleep apneas/hour,” ”central sleep apneas/hour,” ”gender,”
”body mass index,” ”diabetes mellitus - history,” ”cardiovascular disease - history,”
”apnea hypopnea index greater than or equal to 15,” ”apnea hypopnea index,” and
”race.”
Figure 4.5: Numbers of times each dataset got queried.
4.5.4 Limitations
X-search uses MySQL databases to load and store the actual datasets. However, a lim-
itation of the MySQL database is the restriction on the maximum number of columns
in a table. For clinical data with a large number of data elements (e.g., SHHS), split
is needed to store all the data which may cause overhead on querying across multiple
tables. It would be interesting to use NoSQL (Not Only SQL) databases to store and
query NSRR datasets, and compare the performance of the NoSQL- and SQL-based
approaches. In addition, we plan to explore how to expand our X-search cross-cohort
exploration tool to support the OMOP Common Data Model.
45

4.6 Evaluation: A Comparison of Query Performance between SQL-
based and NoSQL-based Query Interface
With the limitations introduced by the relational databases, we can explore other
databases as alternative storage engines. In this section, we highlights the specific
challenges and perform a comparative study of data modeling, data importing time,
and query performance between the SQL-based and NoSQL-based query interface.
4.6.1 Specific Challenges for Identifying Patient Cohorts from Heteroge-
neous Sources
4.6.1.1 High-dimensional Data
Dealing with high-dimensional is one of the challenges for patient cohort iden-
tification using relational databases due to the limitation of the maximum number
of columns in a table. For example, MySQL has a hard limit of 4,096 columns per
table, but the actual maximum number for a given table may be even less considering
the maximum row size and the storage requirements of the individual columns [74].
High-dimensional data (or column-intensive data), if exceeding a single table’s ca-
pacity, need to be split into multiple tables. For instance, in the CFS dataset, the
“visit5” table needs to be split into 3 tables with the de-identified patient identifiers
to connect the separated tables (see Figure. 4.6). The consequence of such splitting
is that it would be more computationally expensive to query data elements located
in different tables since it involves costly join operation of tables and matching of the
unique identifiers. Therefore, the query performance may be significantly affected
due to the split.
4.6.1.2 Heterogeneous Data
Querying heterogeneous data to find patient cohorts is also a challenging task, as
disparate data sources may use different representations to express the same meaning.
46

Figure 4.6: An example of splitting a table with a large number of columns intomultiple tables in MySQL due to the restriction on the table column count.
For example, in NSRR, different codings for patient gender are used in disparate
datasets: 1 means male, and 2 means female in the SHHS dataset, while 0 represents
female, and 1 represents male in the CHAT dataset. Such coding inconsistencies
happen frequently as the number of disparate datasets increases, thus need to be
harmonized to guarantee accurate queries.
There are two ways to handle coding inconsistencies. One way is to harmonize
the inconsistencies in the data loading step, where the source data of each dataset
need to be updated to share uniform codings across all the datasets. The other way
is to address the inconsistency issue in the data query step, where the mapping of the
heterogeneous codings in each dataset to the uniform codings needs to be incorporated
when the patient cohort identification system performs the query translation. In this
work, we adapt the first way to perform harmonization in the data loading step so
that we can evaluate both data harmonization and query performance of the SQL-
and NoSQL-based systems.
4.6.2 NoSQL Databases
NoSQL [75] databases have been rapidly emerged, becoming a popular alternative
to the existing relational databases that can better store, process, and analyze large-
volume data. Without a fixed data schema, NoSQL databases are more flexible in
47

dealing with various data sources and formats. NoSQL databases have shown the
potential in managing big biomedical data [76–78]. For example, Tao et al. [78]
had developed a prototype query engine for large clinical data repositories utilizing
MongoDB as the backend database. There are two main components in MongoDB:
1) MongoDB Query Language; 2) MongoDB Data Model.
4.6.2.1 MongoDB Database System
MongoDB [79] is a free, open-source and cross-platform NoSQL database. It
is a mature document-oriented NoSQL database with well-written documentation
and large-scale commercial use. MongoDB also provides rich drivers for multiple
programming languages.
MongoDB Query Language. As a NoSQL database, MongoDB provides an ex-
pressive query language that is completely different from SQL. There are many
ways to query documents: simple lookups, creating sophisticated processing
pipelines for data analytics and transformation, or using faceted search, JOINs,
and graph traversals.
MongoDB Data Model - Data As Document. The major feature of MongoDB is
that it stores data in a binary representation called BSON (Binary JSON). The
encoding of BSON extends the widely used JSON (JavaScript Object Nota-
tion) representation to include additional types such as int, long, date, floating
point, and decimal 128. BSON documents contain one or more fields, and each
field contains a value of a specific data type, including arrays, binary data,
and sub-documents. Documents that share a similar structure are organized as
collections. One can think of collections as being analogous to tables in a rela-
tional database: documents are similar to rows, and fields are the equivalence
of columns.
48

4.6.2.2 Cassandra Database System
Apache Cassandra [80] is another free and open-source distributed NoSQL database
management system, which is designed to store large amounts of data from multiple
servers. Cassandra can be considered as a hybrid of key-value- and column-based
NoSQL database.
Cassandra Query Language (CQL). CQL is a query language for Cassandra
database. It enables users to query Cassandra using a language similar to SQL.
Language drivers are available for Java (JDBC), Python (DBAPI2), Node.JS
(Helenus), Go (gocql) and C++ [81].
Cassandra Data Model. Cassandra consists of nodes, clusters, and data centers.
A group of nodes or even a single node is a cluster and a group of clusters
is a data center. It provides support for clusters across multiple data centers.
Cassandra is a combination of key-value and column-oriented database man-
agement system. The main components of Cassandra data model are keyspace,
tables, columns, and rows. A keyspace in Cassandra is a namespace that defines
data replication on nodes. A cluster contains one keyspace per node. A table is
a set of key-value pairs containing a column with its unique row keys. Rows are
organized into tables. The first part of the primary key of a table is partition
key, which clusters the rows by the remaining columns of the key.
4.6.3 Materials and Methods
Clinical data from eight datasets in NSRR [34] are used as data sources in this work,
including Sleep Heart Health Study (SHHS) [59–61], Childhood Adenotonsillectomy
Trial (CHAT) [62–64], Cleveland Family Study (CFS) [65–67], Heart Biomarker Eval-
uation in Apnea Treatment (HEARTBEAT) [68], Study of Osteoporotic Fractures
(SOF) [69], MrOS Sleep Study (MrOS) [70], Hispanic Community Health Study /
49

Study of Latinos (HCHS) [71], and Multi-Ethnic Study of Atherosclerosis (MESA) [72].
Table 4.4 summarizes the eight datasets in terms of the patient visit, number of data
elements, and number of patient subjects.
Table 4.4: Summary information for each of the eight datasets.
Dataset Visit(s)Number of
data elementsNumber ofSubjects
SHHSshhs1shhs2
1,2661,302
5,8044,080
CHATbaselinefollowup
2,8972,897
464453
CFS visit5 2,871 735
HEARTBEATbaselinefollowup
859731
318301
SOF visit8 1,114 461
MrOSvisit1visit2
479507
2,9112,911
HCHSsolsueno
404505
16,4152,252
MESA sleep 723 2,237
To evaluate SQL- and NoSQL-based approaches for patient cohort identification,
we adapt the existing NSRR Cross Dataset Query Interface (CDQI) [82] based on
MySQL, and develop two NoSQL-based query systems using MongoDB and Cas-
sandra, respectively. Figure. 4.7 shows the general system architecture of the three
systems. It consists of four major components: (i) database management system; (ii)
Ruby driver for the database management system; (iii) query translation; and (iv)
web-based cross dataset query interface. The database component serves as the data
warehouse to store the actual datasets. The web-based query interface receives queries
composed by users, which are then translated into the statements in the correspond-
ing query language. The Ruby driver then executes the translated query statements
to retrieve data from the database. After receiving the query results, the interface
50

presents them to the end-users.
Figure 4.7: System Architecture.
4.6.3.1 Web-based Query Interface
We adapted the code base of the SQL-based NSRR CDQI in Ruby on Rails
(RoR) to develop the two NoSQL-based query interface. RoR follows the model-
view-controller architectural pattern, providing rich interaction with different types
of databases and supporting HTML, CSS, and JavaScript for developing interactive
user interfaces. The query translation, Ruby driver, and backend databases were
newly implemented for MongoDB and Cassandra, respectively.
4.6.3.2 Query Translation - Dynamic Generation of Database Query State-
ment
Each time a user initiates a query through the web-based interface, the automated
translation of this query (so-called query translation) into specified database query
statement is needed. We illustrate the MongoDB-based query translation in the fol-
lowings (MySQL- and Cassandra-based are similar). The dynamic query translation
51

relies on predefined general templates of MongoDB statement according to the types
of queries. For example, the general template for querying a range of values for a
numeric data element (or field) is predefined as:
find("dataset" => <dataset.name>,
<field_1> => ’$gte’ => <field_1_lower_value>,
’$lte’ => <field_2_upper_value>, ...,
<field_n> => ’$gte’ => <field_n_lower_value>,
’$lte’ => <field_n_upper_value>);
where the variables <dataset.name> and <field_n> represent the specific dataset and
the field that the user intend to query; and <field_n_lower_value>, <field_n_upper_value>
represent the user-specified minimum value and maximum value of the field, respec-
tively. All the variables in the angle brackets can be replaced by real values to generate
the actual MongoDB statement. For instance, “finding patients in the SHHS dataset
aged (field 1) from 20 to 80 with height in centimeters (field 2) between 145 and 188”
will have the following values for the variables in the template:
<dataset.name>: SHHS
<field_1>: age
<field_1_lower_value>: 20
<field_1_upper_value>: 80
<field_2>: height
<field_2_lower_value>: 145
<field_2_upper_value>: 188
Substituting the variables in the template with actual values obtains the following
MongoDB statement:
find("dataset" => "SHHS",
"age" => ’$gte’ => 20, ’$lte’ => 80,
"height" => ’$gte’ => 145, ’$lte’ => 188);
52

4.6.3.3 Ruby Driver for the Database Management System
As illustrated in Figure 4.7, we utilize certain types of databases (MySQL, Mon-
goDB, Cassandra) as the data warehouse to store disparate datasets. All three
database management systems used in this study support a Ruby driver, which can
seamlessly work with RoR to interact with the database management systems. Take
MongoDB as an example, we use MongoDB Ruby driver [83] (version 2.4.1), which en-
ables the connection to the MongoDB data warehouse and executes query statements
to retrieve patient cohorts satisfying the query criteria.
4.6.3.4 Data Modeling in NoSQL Databases
Utilizing NoSQL databases require different data model compared to SQL rela-
tional databases.
MongoDB. The data schema for MongoDB in this study consists of one database,
called nsrr, and one collection, called nsrrdata. All the eight datasets were in-
tegrated into the collection of nsrrdata. To differentiate records from different
datasets, a key-value pair with a key as “source” was inserted into each record
to indicate the source dataset of this record during the importing process. For
those datasets which have more than one visit, another key-value pair with a
key as “visitType” was inserted.
Cassandra. The Cassandra database schema consists of a single cluster, called
nsrrcluster, a single keyspace, called nsrrdata, and eight tables corresponding to
the eight datasets. Similar to MongoDB, one extra column named “visitType”
was added for those datasets with more than one visit. A keyspace in Cassandra
is a namespace that defines data replication on nodes. The replication strategy
for replicas and the replication factors are properties from the keyspace. By
selecting the replication strategy for replicas, one can determine whether data
is distributed through different networks. In this work, we chose the Simple
53

Strategy [84] since it was performed in a single cluster. Furthermore, the main
purpose of this study is to compare performance rather than fault recovery, so
we set the replication factor as one. Another reason we used a single cluster is
that a larger number of replicas would also interfere with the data loading time.
4.6.4 Data Integration - Loading and Harmonization
The integration of disparate datasets into a data warehouse usually involves data
loading and data harmonization.
4.6.4.1 Data Loading Procedure
In MySQL-based NSRR CDQI, to load the NSRR datasets into databases, we
need to perform data preprocessing. A dedicated program is needed to split the data
“horizontally” into separate data files and store them in different tables. The detailed
procedures for a given dataset are as follows. First, the program reads the CSV file of
a patient visit in the dataset, calculates the required number of tables, and splits the
CSV file into multiple smaller CSV files. Then, the program reads the smaller files
individually and imports them into corresponding tables. Apparently, the limitation
of the maximum table column count in MySQL does increase the complexity from
the data loading point of view. Even though each of the eight datasets contains
thousands of data elements or columns, importing data into NoSQL databases is
fairly straightforward, since (1) following the data model mentioned above, we can
easily import all eight datasets into the NoSQL databases; and (2) no data split is
needed.
4.6.4.2 Data Harmonization Procedure
We take three important steps to harmonize coding inconsistencies before the data
can be used for query: (i) we run the inconsistency detection program to detect and
extract all the inconsistent codings among different datasets; (ii) we manually har-
54

monize these inconsistency codings into uniform codings, and maintain the mappings
between them in a CSV file; (iii) we run another program to update the harmonized
codings in corresponding tables stored in different databases. All three query systems
take similar steps to perform data harmonization.
4.6.5 Results
In this section, we first present the results for data loading and harmonization of
the eight NSRR datasets, then we present the comparative evaluation of the three
patient cohort query systems using MySQL, MongoDB, and Cassandra, respectively.
All these evaluations were conducted on a computer with Intel Core i5/2.9 GHz
processor and 8 GB RAM.
4.6.5.1 Data Loading and Harmonization
We integrated a total of 39,342 patient records from eight NSRR sleep datasets
into MySQL, MongoDB, and Cassandra, respectively. Table 4.5 shows the numbers
of tables needed for all three systems. MySQL required twenty tables due to the lim-
itation on the table column count, while MongoDB only required one, and Cassandra
required eight.
Table 4.5: Numbers of tables needed for each database system to load the eightdatasets.
Database System Number of Tables
MySQL 20MongoDB 1Cassandra 8
We detected coding inconsistencies for 43 query concepts within eight datasets.
These coding inconsistencies were harmonized into uniform codings. Take the het-
erogeneous codings for gender as an example, the harmonized coding is: 1 - male
55
and 2 - female. For those datasets which are not consistent with this coding, the
harmonization was performed to update the source data with the harmonized coding.
4.6.5.2 Comparison of Relational and NoSQL Databases
We performed a comparison between SQL and NoSQL databases in terms of the
data loading, data harmonization, and query performance. For data loading, we
compared the time spent on importing data into MySQL, MongoDB, and Cassandra,
respectively. For data harmonization, we compared the detected number of concepts
with coding inconsistency, detection time, and harmonization time. For query per-
formance, we designed several sets of patient cohort queries that are composed of a
single query concept or multiple query concepts to compare the query time. In the fol-
lowing, each reported time was obtained by performing the corresponding operation
five times and taking the average time.
Data Loading
Table 4.6 shows the time taken for importing each dataset into the three database
systems. It took MongoDB a total of 419.2 seconds, MySQL 337.0 seconds, and
Cassandra 330.9 seconds, to load 39,342 records in the eight datasets. MongoDB
took more time than MySQL and Cassandra for data loading.
Figure. 4.8 visually demonstrates the loading time of eight datasets using MySQL,
MongoDB, and Cassandra, respectively.
Data Harmonization Although utilizing different databases, the first two steps
for data harmonization were identical in three systems. We were able to detect
coding inconsistency for the same number (43) of concepts within eight datasets in
five seconds. Table 4.7 shows the time taken to perform data harmonization in each
system. It took all the three systems over 6 hours to complete the harmonization. The
runtime complexities were similar since all these databases need to traverse all the
records and update the corresponding column names, values (MySQL, Cassandra),
56

Table 4.6: Time to load eight datasets into MySQL, MongoDB, and Cassandra,respectively.
Datasets MySQL MongoDB Cassandra
SHHS 165.2s 207.7s 159.8sCHAT 22.2s 29.3s 25.6sCFS 22.2s 35.7s 29.8sHEARTBEAT 1.9s 2.5s 2.2sSOF 4.2s 4.5s 3.7sMrOS 35.4s 39.1s 28.1sHCHS 45.1s 56.9s 45.2sMESA 40.8s 43.5s 36.5sTotal 337.0s 419.2s 330.9s
Figure 4.8: Data loading time comparison.
or key-values (MongoDB). Cassandra required the least time to harmonize the data
as it provides the best performance on the write operation.
Table 4.7: Harmonization time for three systems.
System Harmonization Time
MySQL-based 6h 53m 53sMongoDB-based 7h 9m 47sCassandra-based 6h 25m 15s
57

Query Performance To evaluate the query performance of the SQL- and NoSQL-
based systems, we conducted experiments on performing patient cohort queries across
the eight datasets. Each cohort query consists of one or more query concepts. Three
sets of cohort queries were used. The first set of queries involved only one concept,
while the second set and the third set involved two and four concepts, respectively.
Note that due to the limit of the table column count in MySQL, data elements
exceeding the limit need to be split into multiple tables. In addition, there might
be multiple data elements corresponding to the same query concept. For instance,
in the SHHS dataset, there are three data elements mapped to the query concept
Hypertension as follows.
htnderv s1: Hypertension Status based on 2nd and 3rd blood pressure readings
or being treated with HTN meds;
srhype: Self-Reported Hypertension; and
htnderv s2: Derived Hypertension classification (based on blood pressure mea-
surements, history of HTN dx, and medication use).
Such related data elements may be stored within the same table or across multiple
tables. Therefore, a query concept may involve data elements within the same table or
across multiple tables in the MySQL-based query system. We refer to query concepts
involving data elements across multiple tables as cross-table query concepts.
Table 4.8 presents the time taken for each query using MySQL-based system. The
highlighted time indicates that the corresponding query involves cross-table query
concepts in the corresponding dataset. For example, in the SHHS dataset, Age,
Asthma, Hypertension, and Time Awake after Sleep Onset are the cross-table query
concepts.
As can be seen from Table 4.8, when querying Age in the CFS dataset, the query
time was relatively short, since Age was a within-table query concept. Even when
58

Table 4.8: Cohort query time for the MySQL-based system.
Query Concept MySQL
SHHS CHAT CFS HEARTBEAT SOF MrOS HCHS MESA Average
Age 3.10s 1.53s 0.019s 0.56s NA NA 0.04s NA 1.04s
Gender 0.03s 0.06s 0.006s 0.02s 0.04s 0.21s 5.21s 0.18s 0.72s
Asthma 3.63s 0.06s 0.013s 0.009s NA 1.23s 0.039s NA 0.83s
Hypertension 3.33s 0.04s 0.011s 0.006s NA 1.64s 0.04s NA 0.84s
Time Awake after Sleep Onset 3.59s 0.19s 0.12s NA NA NA NA 0.009s 0.97s
Weight 0.10s 0.05s 0.009s 0.02s NA 1.14s NA NA 0.26s
Gender & Weight 0.05s 0.06s 0.007s 0.03s NA 1.29s NA NA 0.29s
Asthma & Gender 6.51s 0.05s 0.01s 0.013s NA 1.46s 5.50s NA 2.25s
Asthma & Hypertension 6.18s 0.12s 0.028s 0.007s NA 2.15s 0.07s NA 1.43s
Hypertension & Time Awake after Sleep Onset 5.27s 0.12s 0.052s NA NA NA NA NA 1.81s
Asthma & Gender & Hypertension & Time Awake after Sleep Onset 12.90s 0.31s 0.04s NA NA NA NA NA 4.42s
Asthma & Weight & Hypertension & Time Awake after Sleep Onset 10.21s 0.21s 0.029s NA NA NA NA NA 3.48s
NA means unavailable information & Bold numbers indicate that corresponding query concept(s) involve data elements from multiple tables
Table 4.9: Cohort query time for the MongoDB-based system.
Query Concept MongoDB
SHHS CHAT CFS HEARTBEAT SOF MrOS HCHS MESA Average
Age 0.15s 0.06s 0.05s 0.05s NA NA 0.15s NA 0.092s
Gender 0.06s 0.06s 0.05s 0.05s 0.04s 0.06s 0.11s 0.05s 0.06s
Asthma 0.45s 0.05s 0.06s 0.06s NA 0.08s 0.14s NA 0.14s
Hypertension 0.31s 0.05s 0.07s 0.07s NA 0.08s 0.14s NA 0.12s
Time Awake after Sleep Onset 0.36s 0.11s 0.13s NA NA NA NA 0.12s 0.18s
Weight 0.10s 0.13s 0.04s 0.05s NA 0.05s NA NA 0.074s
Gender & Weight 0.15s 0.04s 0.06s 0.05s NA 0.06s NA NA 0.07s
Asthma & Gender 0.31s 0.08s 0.07s 0.05s NA 0.08s 0.12s NA 0.118s
Asthma & Hypertension 0.50s 0.05s 0.06s 0.07s NA 0.08s 0.11s NA 0.145s
Hypertension & Time Awake after Sleep Onset 0.60s 0.60s 0.11s NA NA NA NA NA 0.44s
Asthma & Gender & Hypertension & Time Awake after Sleep Onset 0.61s 0.68s 0.12s NA NA NA NA NA 0.47s
Asthma & Weight & Hypertension & Time Awake after Sleep Onset 0.51s 0.63s 0.11s NA NA NA NA NA 0.42s
NA means unavailable information
Table 4.10: Cohort query time for the Cassandra-based system.
Query Concept Cassandra
SHHS CHAT CFS HEARTBEAT SOF MrOS HCHS MESA Average
Age 0.92s 0.11s 0.05s 0.11s NA NA 0.82s NA 0.402s
Gender 0.16s 0.06 0.04s 0.10s 0.06s 0.11s 0.92s 0.06s 0.19s
Asthma 0.95s 0.07s 0.08s 0.13s NA 0.05s 0.89s NA 0.36s
Hypertension 0.82s 0.19s 0.09s 0.15s NA 0.07s 0.81s NA 0.355s
Time Awake after Sleep Onset 0.89s 0.22s 0.07s NA NA NA NA 0.26s 0.36s
Weight 0.39s 0.19s 0.09s 0.12s NA 0.11s NA NA 0.18s
Gender & Weight 0.55s 0.10s 0.11s 0.09s NA 0.13s 1.11s NA 0.35s
Asthma & Gender 0.83s 0.15s 0.14s 0.12s NA 0.14s 1.21s NA 0.43s
Asthma & Hypertension 1.01s 0.12s 0.13s 0.16s NA 0.11s 0.12s NA 0.275s
Hypertension & Time Awake after Sleep Onset 1.32s 0.11s 0.19s NA NA NA NA NA 0.54s
Asthma & Gender & Hypertension & Time Awake after Sleep Onset 1.22s 1.11s 0.22s NA NA NA NA NA 0.85s
Asthma & Weight & Hypertension & Time Awake after Sleep Onset 1.04s 1.21s 0.25s NA NA NA NA NA 0.83s
NA means unavailable information
querying two or more concepts at the same time, as long as they were from the same
table, the query times were almost less than 0.1 seconds.
For the SHHS dataset, querying within-table concept Gender only took 0.03 sec-
onds. However, when executing “AND” logic queries that contain two concepts in-
volving different tables in MySQL, the query took more than 3 seconds. The situation
could get even worse if the query consisted of multiple cross-table concepts. For in-
59

Figure 4.9: Average query time for each query using MySQL, MongoDB, and Cas-sandra.
stance, four query concepts Asthma, Gender, Hypertension, and Time Awake after
Sleep Onset took about 12 seconds to complete. These illustrate that the MySQL-
based system encountered a dramatic query time increase when querying cross-table
concepts. The major reason for such increment is that when performing such queries,
the traditional relational database needs to perform costly JOIN operations.
Tables 4.9 and 4.10 show the query time taken for the MongoDB-based and
Cassandra-based systems, respectively. There is no highlighted time in these two
tables since no data split operations were needed for these two NoSQL databases.
For the SHHS dataset, both MongoDB and Cassandra achieved better performance
when querying MySQL cross-table concepts (see the highlighted times in Table 4.8);
however, for single-table concepts, the performance varied. For the CHAT dataset,
all the queries were the cross-table concepts in MySQL, the performance of Mon-
goDB and Cassandra were sometimes better than that of MySQL, while sometimes
worse. This may be because the CHAT dataset contains a small number of patient
records (917, see Table 4.4), in which case MySQL was efficient in performing the
JOIN operation on data across tables.
60

Figure. 4.9 shows the average time taken for each query using three different
database systems. We can see that both MongoDB and Cassandra achieved consis-
tently faster query performance compared to MySQL. MongoDB demonstrated the
best query performance. MySQL performance was highly dependent on the query
concepts.
4.6.5.3 Statistical Evaluation of Average Query Time
To evaluate the statistical significance of the differences in the average query times.
We conducted t-test using two independent means with 0.05 significance level and
two-tailed hypothesis. If the p-value is less than 0.05, then query performances are
considered significantly different. As shown in Table 4.11, we can see the p-values are
less than 0.05 for MySQL vs. MongoDB and MySQL vs. Cassandra. This indicates
that the two NoSQL-based systems achieved a significantly better query performance
than the MySQL-based system did.
Table 4.11: T-test result for two independent means using average query time.
Comparative Pair t-value p-value
MySQL & MongoDB 3.5785 0.001676MySQL & Cassandra 2.93414 0.007678
4.6.5.4 Scalability
To evaluate the scalability of the SQL and NoSQL-based system, we conducted
experiments on performing patient cohort queries across SHHS datasets with different
scales. The rationale to use the SHHS dataset for scalability evaluation were in two
folds: (i) it contained the largest number of data records among these eight datasets;
(ii) it contained data elements mapping to both within-table and cross-table query
concepts.
61

We scaled up the SHHS dataset by duplicating the original data records by three,
five, and ten times, which are denoted as SHHSx3, SHHSx5, and SHHSx10 respec-
tively. Note that these duplicated data also had unique identifiers starting from the
last identifier of the original data record. The cohort queries were identical to those
that were previously used for evaluating the query performance.
Table 4.12 shows the time taken for each query in different scales using the
MySQL-based system. Each highlighted time indicates that the corresponding query
involved cross-table query concepts.
Table 4.12: Cohort query time for the MySQL-based system.
Query Concept MySQL
SHHS SHHSx3 SHHSx5 SHHSx10
Age 3.10s 31.76s 87.16s 318.56s
Gender 0.03s 0.08s 0.56s 1.44s
Asthma 3.63s 33.17s 84.23s 312.09s
Hypertension 3.33s 32.14s 86.11s 306.06s
Time Awake after Sleep Onset 3.59s 30.92s 81.42s 312.8s
Weight 0.10s 0.21s 0.49s 1.02s
Gender & Weight 0.05s 0.56s 1.47s 0.03s
Asthma & Gender 6.51s 57.05s 154.01s 585.13s
Asthma & Hypertension 6.18s 50.12s 140.02s 581.43s
Hypertension & Time Awake after Sleep Onset 5.27s 50.71s 135.52s 580.53s
Asthma & Gender & Hypertension & Time Awake after Sleep Onset 12.90s 95.31s 258.04s 917.92
Asthma & Weight & Hypertension & Time Awake after Sleep Onset 10.21s 96.21s 252.79s 924.91s
As we can see from Table 4.12, when querying Gender for these scaled datasets,
the query times were short, since Gender was a within-table query concept. Even for
a query with two or more concepts, the query time remained short if these concepts
were within-table (e.g., concepts Gender and Weight). However, when performing
cross-table queries, the query times increased dramatically along with the scales. For
instance, when querying Age, the query times were 3.10s, 31.76s, 87.1s, and 318.56s
for SHHS, SHHSx3, SHHSx5, and SHHSx10, respectively. The query time for concept
Age was over 5 minutes when the number of data records was ten times larger. The
situation could get even worse for queries consisting of multiple cross-table concepts.
For instance, it would take 917 seconds to query four concepts Asthma, Gender,
62

Hypertension, and Time Awake after Sleep Onset. These illustrate that the MySQL-
based system did not provide decent scalability for high-dimensional data in our case.
Tables 4.13 and 4.14 present the query times taken for the MongoDB-based and
Cassandra-based systems. For these NoSQL-based systems, there was no need to split
tables for a single dataset. We can see from the tables, both MongoDB-based and
Cassandra-based system achieved tremendously better performance when querying
MySQL cross-table concepts.
To better demonstrate the scalability of these three systems, Figure. 4.10, 4.11,
and 4.12 show the query times of different scaled SHHS datasets for each query. In
these figures, Q1 to Q12 are corresponding to the queries in Table 4.12 from top
to bottom. We can see that the increment of query time along with the size of
datasets for both MongoDB-based and Cassandra-based system was small. These
NoSQL-based systems demonstrated better scalability in terms of query performance
compared to the MySQL-based system.
Table 4.13: Cohort query time for the MongoDB-based system.
Query Concept MongoDB
SHHS SHHSx3 SHHSx5 SHHSx10
Age 0.15s 0.12s 0.15s 0.25s
Gender 0.06s 0.06s 0.08s 0.10s
Asthma 0.45s 0.45s 0.56s 0.66s
Hypertension 0.31s 0.35s 0.47s 0.67s
Time Awake after Sleep Onset 0.36s 0.29s 0.46s 0.56s
Weight 0.10s 0.13s 0.14s 0.21s
Gender & Weight 0.15s 0.14s 0.16s 0.25s
Asthma & Gender 0.31s 0.38s 0.47s 0.65s
Asthma & Hypertension 0.50s 0.55s 0.56s 0.67s
Hypertension & Time Awake after Sleep Onset 0.60s 0.62s 0.66s 0.77s
Asthma & Gender & Hypertension & Time Awake after Sleep Onset 0.61s 0.68s 0.76s 0.86s
Asthma & Weight & Hypertension & Time Awake after Sleep Onset 0.51s 0.63s 0.65s 0.91s
4.6.5.5 Distinction with Related Work
Weber et al. [50] have developed a prototype Shared Health Research Information
Network (SHRINE) based on i2b2 for the federated query of clinical data repositories.
63

Table 4.14: Cohort query time for the Cassandra-based system.
Query Concept Cassandra
SHHS SHHSx3 SHHSx5 SHHSx10
Age 0.92s 1.11s 1.35s 1.51s
Gender 0.16s 0.17 0.24s 0.30s
Asthma 0.95s 0.97s 1.08s 1.23s
Hypertension 0.82s 0.81s 1.09s 1.25s
Time Awake after Sleep Onset 0.89s 1.02s 1.27s 1.45s
Weight 0.39s 0.49s 0.54s 0.82s
Gender & Weight 0.55s 0.61s 0.71s 0.96s
Asthma & Gender 0.83s 0.95s 1.04s 1.12s
Asthma & Hypertension 1.01s 1.12s 1.13s 1.36s
Hypertension & Time Awake after Sleep Onset 1.32s 1.34s 1.37s 1.51s
Asthma & Gender & Hypertension & Time Awake after Sleep Onset 1.22s 1.25s 1.34s 1.66s
Asthma & Weight & Hypertension & Time Awake after Sleep Onset 1.04s 1.21s 1.25s 1.65s
Figure 4.10: Query time of MySQL forSHHS Dataset with Different Scales.
Figure 4.11: Query time of MongoDBfor SHHS Dataset with Different Scales.
Figure 4.12: Query time of Cassandrafor SHHS Dataset with Different Scales.
64
However, the i2b2/SHRINE system deals with uniform data across different i2b2 in-
stances, where these instances share the same data structure. In this work, we mainly
focused on the heterogeneous and high-dimensional data across disparate datasets,
where these datasets have different data structures.
Another related work is the MongoDB-based cohort query tool for clinical repos-
itories [78], where the tool can be used to query a single data source. In this work,
we deal with multiple data sources and explored another NoSQL-based approach.
4.6.5.6 Limitations
A limitation of this work is that the sizes of the NSRR datasets are limited in
the number of patient records (39,342 records). Although it was shown that the
NoSQL-based systems outperformed the SQL-based system on the NSRR datasets, it
would be interesting to see how they perform when the number of patient records gets
extremely large and to compare the actual storage required by different databases.
Another limitation is that we only explored two NoSQL database systems to facilitate
the patient cohort queries across disparate sources. Compared with these two, how
other NoSQL databases perform still needs further investigation.
We developed two NoSQL-based patient cohort identification systems, in com-
parison to a SQL-based system, to evaluate their performance on supporting high-
dimensional and heterogeneous data sources in NSRR. Utilizing NoSQL databases,
we overcame the limitation of maximum table column count in traditional relational
databases. We successfully integrated eight NSRR cross-cohort datasets into NoSQL
databases, which largely enhanced the query performance compared to the MySQL-
based system, while maintained similar performance for data loading and harmoniza-
tion. This study indicates that NoSQL-based systems offer a promising approach for
developing patient cohort query systems across heterogeneous data sources.
65

4.7 Conclusion
In this chapter, we presented X-search, NSRR’s cross-cohort exploration system to
query patient cohort counts across heterogeneous datasets in the National Sleep Re-
search Resource. X-search follows the FAIR principles and enforces the findable,
accessible principles. X-search allows users to query and explore datasets in the
NSRR data repository, making the data from NSRR findable. After finding the data,
users can use the identifiers acquired from the x-search and request data access from
NSRR.
X-search has received queries from 16 countries and enabled researchers to perform
cross-cohort queries and exploration to evaluate the feasibility of potential research
studies using shared data in the NSRR repository. Additionally, we compare the
performance between SQL-based and NoSQL-bases backend storage engines. From
the comparison, the NoSQL-based query engine works better in our case. Therefore,
in the next chapter, we will present a NoSQL-based query interface.
66

CHAPTER 5. An Integrative Data Repository for Studying Risk Factors
Associated with Pressure Injuries Resulting from Spinal Cord Injury
In the previous chapter, we compared the performance between SQL-based and
NoSQL-bases MetaSphere and found out that the NoSQL-based MetaSphere per-
formed better. In this chapter, we will discuss the application of NoSQL-based Meta-
Sphere to spinal cord injuries domain.
5.1 Motivation and Challenges
Pressure Injuries (PrI) and Deep Tissue Injury (DTI) are serious conditions among
those individuals with spinal cord injury (SCI), resulting in tremendous personal
and societal costs. Primary PU/DTI prevention plays a critical role in the first line
of defense, while it is also challenging as there are many risk factors to consider
ranging from the individual’s environment to local tissue health. The integration of
PU/DTI risk data, ranging from the living environment and age to tissue blood flow,
requires a robust and scalable informatics approach to cope with big-data challenges
in volume and complexity. This chapter presents SCIPUDSphere - a data reposi-
tory, that extracts, integrates, stores a wide range of PU/DTI risk factors of data
and provides a user query interface for identifying subgroups hypothesis generation.
We extracted a total of 268,562 records containing 282 ICD9 codes related to SCI
among 105,599 individuals from the Veterans Administration’s VA Informatics and
Computing Infrastructure (VINCI) electronic health records. These records consist
of demographics, comorbidities, medications, and patient SCI diagnosis, and they are
integrated into SCIPUDSphere. SCIPUDSphere is being utilized as the data source
to develop a model aiming to identify major risk factors based on individual cases.
67
5.2 Pressure Injuries (PrI) and Deep Tissue Pressure Injury (DTPrI)
Pressure Ulcer (PU) and Deep Tissue Injury (DTI) are serious and costly complica-
tions for some populations, such as those with spinal cord injury (SCI), who remain at
high risk throughout their lifetimes. Clinical observations and research have demon-
strated staggering costs and human suffering [15–17] for PU/DTI. In addition to the
psychological distress and detrimental effects on quality of life (QoL) for the indi-
vidual, chronic wounds place a significant burden on health care systems. US costs
estimated to be up to $15 billion per year, with an individual PU costing as much
as $37,800 - $70,000 to treat [85–87]. It has been estimated that PU prevention is
approximately 2.5 times more economical than treatment [18]. Clinical practice guide-
lines (CPG) provide best practice recommendations for PU/DTI prevention [19–21],
however, the many recommendations in a CPG reflect the multivariate nature of
PU/DTI management. In order to successfully prevent and treat PU/DTI in the SCI
population, it is essential to consider multiple risk factors because they contribute
to the formulation of treatment and rehabilitation strategies [22]. These factors in-
volve multiple domains, from the environmental factors related to the location of
the patient (inpatient/nursing home/community dwelling) to the individual’s tissue
health profile. These domains can interact, working in opposition, or in concert. This
complexity highlights the challenge of PU/DTI prevention and is indicative of the
need for a holistic and systematic approach. However, the integration of PU/DTI
risk data, ranging from the living environment and age to tissue blood flow, requires
a robust and scalable informatics approach to cope with big-data challenges in vol-
ume and complexity. PU/DTI risk data is collected using systems with a variety of
different sampling rates and resolutions, with non-standard (often proprietary) data
formats. For example, the clinical and demographic data of interest in PU/DTI is
collected in the electronic medical record (EMR) at annual evaluations or when the
68

Veteran attends the outpatient clinic for wound care with clinical information coded
and in free form clinical text notes. Conversely, tissue oxygenation data is collected
during tissue health assessments at a rate of 5Hz in a standardized format. Thus data
extraction, data integration, and data sharing are complex and challenging problems
in PU/DTI risk data. To overcome these challenges, we developed an integrating
repository called SCIPUDSphere following the FAIR [7] principles. SCIPUDSphere
is a web-based system provides researchers with access to a large, curated dataset of
de-identified patients with SCI and the tools to explore those data. It uses a novel
Spinal Cord Injury Pressure Ulcer and Deep tissue injury ontology (SCIPUDO) as the
knowledge resource for processing specialized terms related to SCI, PU, and DTI. Its
data originates from SCI patients who are provided care by the Veterans Administra-
tion (VA) medical system through its VA Informatics and Computing Infrastructure
(VINCI).
5.3 VA Informatics and Computing Infrastructure (VINCI)
The VA provides care for a large number of individuals with spinal cord injuries.
The large number of individuals combined with the extensive records for each patient
provides us with an unprecedented opportunity to integrate and analyze the impacts
of a wide range of PU/DTI risk factors of data, we need a rich data resource which
can be provided by the VA Informatics and Computing Infrastructure (VINCI).
The VA has been developing electronic medical record systems since 1982 and its
latest system, Vista, since 1996. It provides a comprehensive record of all aspects
of the VA healthcare system including each encounter a patient has with a provider.
Data from the Vista system is extracted and loaded into the VINCI system on a daily
basis, providing a rich pool of raw data for researchers.
VINCI is an initiative to improve researchers’ access to VA data and to facilitate
the analysis of those data while ensuring Veterans’ privacy and data security. VINCI
69

hosts many datasets and provides many types of analytical applications. Researchers
can access the VA data and tools for reporting and analysis in a secure Workspace
called VINCI Workspace.
5.4 Related work
Zhang et al. developed the National Sleep Research Resource (NSRR) [11], a data-
sharing system for integrating clinical data and physiological signals from NIH-funded
epidemiological cohort studies in sleep research. NSRR fully supports the FAIR prin-
ciples. We adapted some of the methodologies from NSRR for building the SCIPUD-
Sphere system and followed FAIR [7] principles. X-search [82] is a tool developed
by the NSRR team. It is an open-access interface for cross-cohort exploration of
the National Sleep Research Resource, provides a flexible framework featuring an
ontology-driven query module. In the front-end, X-search provides query widgets
that allow users to build queries for cohort searching and exploring. The X-search
query interface consists of two major components. In the left part of the interface,
there is a list of concepts along with concept construction widget and query results
on the right side. Our SCIPUDSphere shares a similar interface layout with X-search
but supported by our new SCIPUDO ontology.
5.5 Method
The design of SCIPUDSphere involves three seamlessly integrated modules: 1): On-
tology Support, 2): environmental, social, and clinical domain database and 3):
SCIPUDSphere User Interface. Agile development and agile project management
methodologies were used to achieve a flexible, modern, and user-friendly web-based
data management tool using the Ruby on Rails framework [46]. Figure 5.1 illustrates
the architecture of SCIPUDSphere system.
As shown in Figure 5.1, risk data is first extracted from the VINCI system. After
70

data processing, these risk data are transformed into mapped risk data which is then
be imported into the domain database using MongoDB18. MongoDB is a document-
based NoSQL database that does not require a data schema and provides fast query
performance. Finally, Researchers and clinicians are able to query the risk data using
our query interface enhanced through our SCIPUDO by helping users formulate their
queries via graphical construction of their queries in a step by step fashion. The query
results are rendered immediately after the query executions are done. The results
consist of a unique patient identifier and patient data related to queried concepts.
Unique patient identifiers are extremely useful for complete patient data retrieval if
more information is needed for these patients. Researchers and clinicians are able to
download the results to facilitate their researches.
We followed the agile development process where developers work closely with the
end-users to identify desired changes to the application. As users make use of the
application, the provide suggestions for desired functionalities and describe problems
with the current system. Developers implement desired functionality changes and
resolve issues with each update cycle. This process allowed us to implement the most
valuable features as quickly as possible. This development process provided many
small changes applied to the servers rather than a few large updates.
Figure 5.1: SCIPUDSphere System Architecture.
71

5.5.1 Ontology Support
The dedicated domain ontology Spinal Cord Injury Pressure Ulcer and Deep tissue
injury ontology was created by reusing terminology from existing systems ranging
from anatomy (SNOMED CT), disease classification (ICD-9 and 10), medication
(RxNorm), and National Institute of Neurological Disorders and Stroke (NINDS)
Common Data Elements. The SCIPUDO consists of a set of concepts (terms) in the
PrI/DTPrI domain and the relationships between the concepts. Table 5.1 shows the
main ontological dimensions of SCIPUDO. By employing the SCIPUDO, a standard
set of terminologies can be employed by the application while allowing individual
data contributors to maintain data according to their desired schema. SCIPUDO
was then plugged into our MEDCIS system to power the operation of SCIPUDSphere
User Interface.
Table 5.1: SCIPUDO Ontological Main Dimensions.
Dimension Elements
Personal Demographics, Smoking, BMI, Nutritional status
Environmental Access to specialized care, Access to transportation, Rural or urban location, Air quality
Clinical AIS level, Duration of injury, Comorbidities, Medications
Social Equipment use, Domestic living status
Tissue health Tissue oxygenation under load, Skin and muscle blood flow under load, Muscle composition
5.5.2 SCIPUDSphere Environmental, Social and Clinical Domain Database
5.5.2.1 Data Extraction
The development of the enhanced Spinal Cord Injury Pressure Ulcer and Deep tis-
sue injury (SCIPUD) Resource was created at the Louis Stokes Cleveland VA Medical
Center (LSCDVAMC) by a multidisciplinary team led by biomedical engineer and a
physician and included, staff nurses, physical and occupational therapists, a dietician,
biostatisticians and a public health specialist. Multiple factors known to be associated
72
with PrI development were assessed at the admission timepoint. An initial study was
carried out to investigate the significance of risk factors for rehospitalization (RHA)
for severe (Stage III or IV) PrI20. Using SCIPUD, researchers found that factors
previously found to be predictive of initial PrI development may not be predictive of
RHA. Specifically, demographic factors showed no significant association with RHA,
while clinical factors such as duration of injury and sub-optimally managed spastic-
ity (SMS) were significantly associated with higher RHA. These preliminary findings
provide indications of the ongoing need to develop and review adaptive PrI prevention
care plans.
The development of SCIPUD provided us with a foundation and direction for
extracting risk factors data from VINCI. We leverage the rich data resource provided
by the VINCI, which provides access to the world’s largest EMR data source and
the many veterans with SCI served by the VHA. The VA has built a Corporate Data
Warehouse (CDW) within VINCI to support this and other efforts to improve veteran
care. The CDW contains detailed data about each patient and each encounter of these
patients has a VA medical service. We extracted, de-identified, and exported patient
data from the CDW to use for our system. Hosting SCIPUDSphere in VINCI’s secure
infrastructure would allow us to use identified data and provide quick updates to its
data. However, it would restrict access to the application and its data due to the
strict security measures imposed by the VA for access to VINCI. We also expected to
encounter challenges with implementing and maintaining the application within the
security disciplines imposed by the VINCI environment. We observed that our study
data were restricted to a five-year time span before the VA transitioned to ICD10,
thus we expected few, if any, updates needed once we developed and completed our
data extraction process. We also had no requirements for the identified data. Thus
we could de-identified records and export them. We decided to host our application
external to VINCI based on these considerations and make our system available to a
73
wider range of researchers.
5.5.2.2 Data Processing
Once we extract and de-identify data, we convert the data to the CSV format for
export. Prior to importing data into the SCIPUDSphere database, we need to process
the data in order to identify the comprehensive and hierarchical concept structures of
the risk factors and handle the potential missing values. Therefore, we extracted the
hierarchical concept structures of the risk factors from the extracted data by a Ruby
program. After acquiring the hierarchical concept structures of the risk factors, we
mapped the data into corresponding concepts value and saved these data into new
CSV files. Finally, we imported the mapped data into the SCIPUDSphere database.
Prior to importing data into SCIPUDSphere, we need to associate each datum
with a concept in the SCIPUDO (described in subsection 5.5.1). Each concept in
SCIPUDO has an associated domain consisting of the values that it may have and
we analyzed the data from our cohort to derive acceptable values for each domain.
Once completed, we load the data into the SCIPUDSphere database.
5.5.3 SCIPUDSphere Query Interface
Validated extracted data were collected using our established standard data collec-
tion forms and imported to the PrI risk assessment SCIPUDSphere platform. The
adapted X-search engine provides extensible, scalable, and high-performance data
management for storing and rapidly accessing large volumes of data. A visual query
interface was also adapted from X-search to allow researchers and clinicians to di-
rectly query the PrI risk data via a set of easily usable visual widgets. These are
directly populated with the SCIPUDO concepts to allow clinicians to flexibly con-
struct queries, specific to the patient. The Query Builder provides the user interface
to formulate the patterns necessary to construct a logical query. The logical query
74
is translated dynamically into a local database query based on the mapping between
the ontology model and the database-specific data model.
5.5.3.1 MongoDB as Data Warehouse
While developing SCIPUDSphere, we decide to use MongoDB [79] as our backend
database. MongoDB is a free, open-source and cross-platform NoSQL database. It
is a mature document-oriented NoSQL database with large-scale commercial usage.
The reasons we use MongoDB are as follow:
MongoDB provides a comprehensive API for Ruby on Rails developer. There is
a mature Object-Relational Mapping (ORM) that lets our query and manipulate
data from a database using an object-oriented paradigm.
From chapter 4, we find out that MongoDB performs better than traditional
relational databases e.g. MySQL in terms of querying high dimensional pa-
tient data. Traditional relational databases have restrictions on the number of
columns in one single table. Therefore, high dimensional patient data will need
to be split into multiple tables, which will affect queries performance if such
queries require costly join operations. The situation for MongoDB is different.
As MongoDB is a document-based NoSQL, there will be no columns restrictions
for one single collection (analog to a table in MySQL). Therefore, MongoDB
can guarantee fast query performance.
MongoDB supports flexible and dynamic schema design. No predefined data
schema is required compared to MySQL.
5.5.3.2 Dynamic Database Query Statement Generation
Queries are constructed using our SCIPUDSphere query interface. Once a user
clicks the query button, the backend database query statements are generated auto-
matically. Here we utilize similar techniques in our previous work [82] where we de-
75

veloped a dynamic query translation engine for query interface with multiple datasets
as data sources. The query statement generation for SCIPUDSphere is a simplified
version since we only have one dataset to query. We illustrate the statement gen-
eration processing as follows. The dynamic query statement generation is based on
predefined statement templates according to specific concept types. For instances,
the general query template for querying a range of value for a numerical data element
is defined as:
db.getCollection("scipud").find(
<field_1> => ’$gte’ => <field_1_lower_value>,
’$lte’ => <field_2_upper_value>, ...,
<field_n> => ’$gte’ => <field_n_lower_value>,
’$lte’ => <field_n_upper_value>);
where the variables <field_n> represent the field that the user intend to query; and
<field_n_lower_value>, <field_n_upper_value> represent the user-specified mini-
mum value and maximum value of the field, respectively. All the variables in the
angle brackets can be replaced by real values to generate the actual MongoDB state-
ment.
The general template for query options for categorical data elements is defined as:
db.getCollection("scipud").find(
<field_1> => ’$in’ => [<value1>, <value2>, ...<valueN>], ...,
<field_n> => ’$in’ => [<value1>, <value2>, ...<valueN>]);
where the variables <field_n> represent the field that the users intend to query,
and <value1>, ... <valueN> represent the queried options of the field, respectively.
All the variables in the angle brackets can be replaced by real values to generate the
actual MongoDB statement.
Based on these two templates, composite queries can be constructed this way:
76

db.getCollection("scipud").find(
<field_1> => ’$gte’ => <field_1_lower_value>, ’$lte’ => <field_2_upper_value>, ...,
<field_n> => ’$in’ => [<value1>, <value2>, ...<valueN>]);
A concrete example is ”finding male patients aged from 20 to 80”. After substi-
tuting the variables, the corresponding query statement becomes:
db.getCollection("scipud").find(
’age’ => ’$gte’ => 20, ’$lte’ => 80, ...,
<field_n> => ’$in’ => [male]);
5.6 Result
In this section, we first present the results for data extraction, integration in our do-
main database, then show the query interface. We utilize MongoDB as our SCIPUD-
Sphere domain database and input data for the database are provided by synthesizing
available EMR clinical data from VINCI, using a protocol based on our preliminary
work.
5.6.1 Creation of the SCIPUDSphere environmental, social and clinical
domain database
5.6.1.1 Data Extraction
VINCI provided a cohort of 36,628 VA patients having ICD9 codes associated with
SCI. Our study is limited to interactions with patients over a five year time period
prior to the VA conversion to using ICD10 coding. We extracted data from twelve
tables containing identified patient data and resulted in 18,808,408 records containing
ICD9 codes for 36,581 individuals. We filtered this data to produce a table with 76,553
de-identified records containing 66 ICD9 codes related to SCI for 36,580 individuals
and another de-identified table containing 153,930 records of 32,396 individuals with
a total of 216 ICD9 codes for comorbidities included in our study.
77

We de-identified the data to comply with HIPAA and VA requirements by substi-
tuting a unique, randomized identifier for each patient and using only years to denote
dates for patients 89 years old and younger and a single value for patients 90 years of
age and older. We computed the number of times a particular ICD9 code was asso-
ciated with a given patient. The unique, randomized identifier allows us to associate
data from multiple sources with a given patient without compromising their privacy.
We also extracted demographic data for the patients in our cohort. This data
contains the age, sex, and marital status of each patient. The age is computed at
the time of the patient’s first encounter within the study period of this project and
recorded as years. All ages 90 and over are assigned a single value to comply with
the HIPAA safe harbor standard.
We found 283 individuals age 90 and above in our data. The resulting table
contains 38,068 records with the extra records compared to the number of patients
resulting from multiple values being recorded for the race or marital status. We
investigated the discrepancy between the number of patients contained in the original
cohort provided by VINCI and the number of patients for which we have data. We
discovered 3 test patients in the original cohort, that is, ”patients” who have records
in the system that do not exist but provide data quality checks. We have removed
these from our data. That leaves 43 patients in the original cohort for whom we
do not have data. We are investigating whether we should include additional CDW
tables in our search or if their dates of encounters fall outside of the dates of our
study or some other reason. Table 5.2 shows the detailed number of data records and
the number of patients of the extracted data.
5.6.2 SCIPUDSphere User Interface
SCIPUDSphere system provides an integrated environment for investigators to iden-
tify risk factors for PrI/DTPrI and its user interface helps guide researchers in this
78

Table 5.2: Summary of Extracted Risk Data from VINCI.
Dataset Number of Data Records Number of Patient
Demographics 38,068 36,623Comorbidities 153,930 32,396Medications 368,997 36,610Patient SCI Diagnosis 76,553 36,580
task by employing the SCIPUDO as an integral part of the system.
5.6.2.1 Query Builder
Figure 5.2 shows the query builder interface which consists of a set of drop-down
menus populated with SCIPUDO classes. The menus guide users to construct their
queries. The Query Manager saves queries for future reuse, which can be searched
by keywords in title, description, or the query itself. We omit to describe the Query
Manager since its functionality is similar to that of an email management application.
SCIPUDO is displayed in the form of a set of drop-down menus. Users can
construct queries in two ways. The browse mode lets users expand drop-down
menus and select desired risk factors. Users can also search for specific risk
factors by typing their names in a search box.
Query Widgets provide the mechanism for users to express their criteria which
will be dynamically translated into the server database query language and ex-
ecuted on the server. Users can interactively select concepts they are interested
in and specify numeric ranges by selecting the minimum and maximum values
for the range. For example, the query in Figure 5.2 will be translated into
selecting male or female patients with PrI history.
Query Result will show the distinct number of patients who satisfy the criteria
built in the query widget. In Figure 5.2 2, the query returns the result of 8,774.
79

Figure 5.2: SCIPUDSphere Query Interface.
5.6.2.2 Query Results Statistical Visualization and Downloading
Figure 5.3: Query Results Statistical Visualization.
In addition to query cohort counts, SCIPUDSphere can provide statistical visual-
ization based on each query as shown in Figure 5.3. For those categorical concepts
80

such as gender, SCIPUDSphere will draw a distribution graph. For continuous con-
cepts, the interface will display a box plot. And for comorbidities, which will have
a corresponding code, SCIPUDSphere will show the detailed counts for each code as
shown in Figure 5.3.
Researchers can use the download link shown in Figure 5.2 to download the query
results. These query results consist of de-identified data and researches can use the
data in their studies. Before downloading data, researchers must complete our Data
Access and Use Agreement online and get approved. SCIPUDSphere provide query
access to a large, well-document cohort of spinal cord patients, both with and without
pressure ulcer and deep tissue injuries coupled with a modern web-based user interface
making it easy for researchers find data of interest to their studies or medical providers
to find patients with conditions similar to theirs. We have a process for users to gain
access to actual data through a Data Access and Use Agreement.
5.7 Evaluation
5.7.1 Usability
The evaluation is to assess SCIPUDSphere’s usability. To perform the evaluation, we
chose some queries. These queries consist of a single concept and multiple concepts.
The usability measurement was the time cost to compose queries. We invited four
non-technical users to complete the query building task and counted the time cost.
Table 5.3 shows the average time cost in seconds to build the 9 selected queries using
browse mode and search mode. We can see from the result. For a user, it could take
about 40 seconds to build a query using browse mode while using search mode will
be a little bit faster.
81

Table 5.3: Statistics for query building in usability evaluation.
Query concept Browse Search
Age 40s 30s
Gender 32s 26s
Race 43s 25s
MaritalStatus 45s 30s
Smoking 30s 32s
PUHistory 42s 33s
Neurogenic Bowel 35s 30s
Age, Neurogenic Bowel 62s 50s
PU History, Neurogenic Bowel 65s 55s
Average 43s 34s
5.7.2 Query Performance
To illustrate the query performance of SCIPUDSphere, we conduct experiments on
performing patient cohort queries. Each cohort query consists of one or more query
concepts. For each query, we perform 10 times and calculated their average values. All
these experiments are conducted on a computer with Intel Core i5/2.9 GHz processor
and 8 GB RAM.
Table 5.4: Cohort Query Time for SCIPUDSphere.
Query concept No. 1 No. 2 No. 3 No. 4 No. 5 Average
Age 0.15s 0.12s 0.15s 0.25s 0.2s 0.17sGender 0.14s 0.13s 0.17s 0.12s 0.15s 0.14sRace 0.13s 0.11s 0.12s 0.15s 0.14s 0.13sMaritalStatus 0.14s 0.13s 0.14s 0.11s 0.15s 0.13sSmoking 0.11s 0.12s 0.12s 0.13s 0.12s 0.12sPUHistory 0.14s 0.14s 0.13s 0.15s 0.12s 0.14sNeurogenic Bowel 0.12s 0.11s 0.15s 0.14s 0.15s 0.13sAge, Neurogenic Bowel 0.22s 0.19s 0.15s 0.2s 0.21s 0.19sPU History, Neurogenic Bowel 0.21s 0.17s 0.16s 0.19s 0.2s 0.18s
Age is a numerical concept and other concepts are categorical concepts. From
Table 5.4, we can see that the query times for all these queries are around 200ms
82
without indexes. SCIPUDSphere query performance is consistent and fast for both
single concept query and combined concepts query.
5.7.3 Evidence of Usage
Evidence of SCIPUDSphere usage for scientific and clinical research includes research
proposals submitted and publications. One recent publication characterizing individ-
ualized clinical practice guidelines for pressure injury management. In this publica-
tion, the authors aim to develop the Spinal Cord Injury Pressure Ulcer and Deep Tis-
sue Injury Resource to support personalized care planning for primary and secondary
PU/DTI prevention by utilizing our SCIPUDSphere as a single point of web-based
access to well-annotated and de-identified data generated from multiple domains.
5.8 Discussion
5.8.1 Features
SCIPUDSphere is a web-based system provides researchers with access to a compre-
hensive, curated dataset of de-identified patients with SCI and the tool to explore
those data.
Guide a user to find data of interest to them.
Support dedicated domain ontology, in this case about pressure ulcers and their
treatment.
Extract and integrate large-scale PrI risk data for a large cohort of patients.
provides a single point of web-based access to de-identified and analysis-ready
PrI risk data.
SCIPUDSphere is serving as a data source for researches aiming to build a model
that can identify major risk factors for individual patients. The facts that SCIPUD-
83

Sphere supports dedicated domain ontology and provides web-based access to dei-
dentified risk data was acknowledged by the researchers. However, they also pointed
out that the query statistical results visualization is superficial and provides limited
insights into the data. Building a more sophisticated data visualization widget is
challenging and requires more inputs from a larger group of researchers.
5.8.2 Limitations
Extracting all the designed PrI risk data is in progress. We have currently extracted
four main categories data, specifically demographics, comorbidities, medications, and
patient SCI diagnosis data respectively. The second limitation is that our system is
under inner testing and usage without conducting any scalability evaluations in terms
of large-scale user usage. Our ultimate goal is to extract all PrI risk data from VINCI
and import those data into our SCIPUDSphere system. At that time, SCIPUDSphere
will enable researchers to query patients cohort counts and explore these risk data to
use in their research studies.
SCIPUDSphere has been used by individuals for testing and usage. We have
not conducted any scalability evaluations in terms of large-scale user usage. Once
SCIPUDSphere is fully populated, we can perform more comprehensive and system-
atic evaluations, including usability and scalability evaluations.
5.8.3 Conclusions
In this chapter, we introduce SCIPUDSphere, an informatics platform followed our
MetaSphere diagram, that enables data extraction, integration, storage, and analysis
to provide clinical decision support and user interfaces direct access to well-annotated
and de-identified wide range PrI risk factors of data. We created a dedicated Spinal
Cord Injury Pressure Ulcer and Deep tissue injury ontology (SCIPUDO) as the knowl-
edge resource for processing specialized terms related to SCI, PrI, and DTPrI. We
84

extracted the demographics, comorbidities, medications, and patient SCI diagnosis
data from VINCI. By adapting existing tools: NSRR and MEDCIS, we successfully
implemented a powerful and intuitive user interface that empowers researchers to
quickly pinpoint possible risk factors and perform exploratory queries. We believe
that SCIPUDSphere can help researchers to find a comprehensive range of PrI risk
factor data and promotes clinical researches for preventing PrI and DTPrI.
SCIPUDSphere follows the FAIR principles and enforces the findable, accessible,
and reusable principles. Similar to X-search, SCIPUDSphere allows users to query and
explore PrI/DTPrI related risk factor data, making the extracted risk data findable
and accessible. The risk factor data are persisted in our data repository and can be
reused by researchers.
85

CHAPTER 6. Interactive and Collaborative Mapping Interface from
Data Dictionaries to Ontologies
In Chapter 2, we introduced the challenges a cross-cohort query interface which use
CSV files to manage mappings between different data source to a domain ontology.
In this chapter, we will discuss an innovative, interactive, and collaborative mapping
management system for managing and building mappings from a data dictionary to
an ontology.
6.1 Motivation and Challenges
Ontologies are critical in semantically enabled applications, such as MEDCIS [88], X-
search [89], and DataSphere [78]. In recent years, ontologies have been widely used in
biomedicine. Knowledge captured through mappings allows the integration, search,
and analysis of data in a clinical setting where different data sources in the same
domain have been annotated with different but similar ontologies. The misalignment
has become a major issue and a large number of researches have been conducted
on ontology mapping in order to find mappings between concepts and relations in
different ontologies [28]. Abundant ontology mapping systems and tools have been
built [90–94] and overviews can be found at the matching web site [95]. The majority
of these studies mainly focus on the mapping algorithm between ontologies. In most
cases, patient data are collected with the help of the data dictionary. Therefore,
mappings between unified metadata and data dictionaries are critical in such cases,
especially when data are from different sources. For example X-search, a dedicated
sleep ontology is used to power up the interface for querying and exploring hetero-
geneous datasets in the NSRR (National Sleep Research Resource) [11, 12, 34] data
repository. To facilitate the dynamic query translation, a set of mappings between
the canonical data dictionary and different datasets are built and maintained by a
86

group of domain experts using CSV files. The file-based approach is straightfor-
ward but with limitations in terms of cooperativeness and traceability. Besides, it is
label-intensive and error-prone to integrate and synchronize contents from different
sources. Management and maintenance of these mappings become cumbersome and
time-consuming when the mapping size increases. More importantly, it cannot be
reused by other researchers. An interactive, collaborative, and web-based mapping
system would be beneficial to utilize the power of crowdsourcing.
The Kentucky Cancer Registry was founded at the University of Kentucky (UK)
Markey Cancer Center (MCC) in 1991. KCR is a central cancer registry that receives
data about new cancer cases from all healthcare facilities and physicians in Kentucky
within 4 months of diagnosis. In 2000, KCR became a part of the NCI’s Surveillance
Epidemiology and End Results (SEER) program. The North American Association
of Central Cancer Registries (NAACCR) was established in 1987 to meet the needs
of central cancer registries. NAACCR provides a standardized data dictionary which
is utilized by KCR when it is collecting patient data.
To reduce the data access barriers and facilitate query and exploration tools for
accessing data resources, we need to transform and implement terminology systems
such as National Cancer Institute Thesaurus (NCIt) into a faceted system [96]. A
mapping between the KCR data dictionary and NCIt is needed.
In this chapter, we introduce a deployed, web-based mapping interface, called
IMI, enabling researchers to carry an interactive and collaborative mapping process
and crowdsourcing. IMI was successfully used to construct a mapping between KCR
data dictionary and NCIt. At the current stage, IMI supports two ontologies as an
ontology library with over 150,000 concepts and the ontology library can be expanded
easily when more ontologies are required. Moreover, IMI has a decoupled recommen-
dation system that is open to researchers so that they can override the current default
recommendation algorithm to perform and test their mapping algorithms.
87

IMI has been designed as a general framework with three decoupled components:
1) ontology library; 2) mapping interface; 3) recommendation system. The ontology
library provides a list of ontologies as a target ontology for constructing mappings.
The mapping interface consists of six modules: project management system, interac-
tive mapping interface, access control, logs and comments, ontology hierarchy visual-
ization, and mapping exportation. The recommendation system serves as primitive
auto mapping and provides a list of potential matching concepts from target ontology.
IMI is publicly accessible at http://epi-tome.com with two supported ontologies
over 150,000 concepts. IMI has been applied to KCR successfully and 47 out of 301
frequently used concepts have been mapped to NCI Thesaurus (NCIt), where the rest
do not have matching concepts from NCIt.
6.2 Method
The goal is to create an interactive, collaborative, and web-based mapping interface
which leverages the power of crowdsourcing. To achieve this objective, the system
architecture of IMI consists of three major components: ontology library, mapping
interface, and recommendation system. Figure 6.1 shows the overall architecture of
our system.
Figure 6.1: Functional Architecture of IMI.
As illustrated in Figure 6.1, there are three functional components, which are
Data Import, IMI application, and Result Export. The Data Import component
88

is for importing data dictionaries. IMI application component provides a mapping
interface for building mappings. Then all the mappings can be exported using the
Result Export component.
The mapping interface consists of six modules: project manage system, interactive
mapping interface, access control, logs and comments, mapping exportation, and
ontology hierarchy visualization. The source ontology uploader is used to upload
source ontology by users. The mapping interface provides an interactive and highly
configurable interface to perform mapping. The access control module is implemented
to grant or remove access from particular users. Logs and comments can keep track of
mapping activities and enable information sharing during the mapping process. The
logs and comments module is critical for crowdsourcing. Mapping can be exported
using the mapping exportation module. The ontology hierarchy visualization module
visualizes the mapped ontology hierarchy based on the target ontology hierarchy.
6.2.1 Ontology Library
Ontology library serves as the foundation of mapping. It is managed and maintained
by the system admin. We assume the ontologies are in a structured format that can be
populated into NoSQL database like MongoDB [79]. A rich source of well-structured
ontologies can be found via bioportal [9]. The reason we choose MongoDB as our
backend storage engine is that for clinical data with a large number of data elements,
split is needed to store all the data which may cause overhead on querying across
multiple tables [97]. The ontology library can be expanded easily as IMI provides
a dedicated management interface. All the importing is done via the interface and
import fields are configurable by simple clicks on the interface. A well-structured
and widely recognized ontology may contain a large amount of information, some of
this information is not needed and it is not feasible to import all the fields into our
database. Therefore, making import fields configurable can be beneficial to reduce
89

the storage requirement and make our ontology library more compact.
6.2.2 Interactive Mapping Interface
The mapping pipeline of IMI is demonstrated by Figure 6.2. There are five main steps
showed in the figure, which are project creation, source ontology upload, mapping,
visualization, and exportation.
Figure 6.2: Mapping pipeline.
6.2.2.1 Project Management Module
To start the mapping process, a user starts from creating a project. There are
several non-trivial things to specify when creating a new project. First of all, the
project owner needs to specify the target ontology from the ontology library. Secondly,
the project owner needs to decide whether the project will be public or not. If the
project is public, then it can be accessed by all users in IMI. Otherwise, the project
can only be accessible by users with permission granted by the project owner. Users
assigned to a project can access the project from their own project management
system. Several display fields of the target ontology will be picked by the project
owner since it could be overwhelming if all fields in the ontology are displayed in
the interface. After the creation of the project, users would proceed to the mapping
interface to perform the actual mapping.
6.2.2.2 Interactive Mapping Interface
Recalling when we are creating a mapping project, we only specify the target
ontology. We also need a source data dictionary in order to perform the mapping. IMI
makes the data dictionary uploading process easy by providing an upload interface
90

with a similar configurable function enabled. Users can specify fields to import,
default field to display in the mapping interface, and fields to show when a concept
is selected.
The mapping interface consists of three major areas:
Area to list all the upload concepts of source ontology.
Area to show detailed content of the display fields specified in the above steps
of the source ontology.
Area to show the top 5 recommended concepts and detailed content of the
display fields from target ontology.
There are two modes to look up concepts from the source ontology: browsing and
search. The browsing mode provides a list of all concepts from source ontology so that
users can explore all concepts one by one. The search mode enables expert users to
directly search for concepts of interest. Along with the concept default display field,
a small rectangle box with a number will indicate the mapping status of the concept
and the comments for the concept. Green color with a character ”M” represents that
the concept is mapped while red color with a character ”U” means the concept is not
mapped. The number inside the rectangle box simply shows the number of comments
for the current concept.
When a concept from area one is selected, area two will show the content of
specified fields from a data dictionary. The message icon on the top right in area two
is used to open the logs and comments module where users can view the mapping
activities and comments for the current concept. In the meanwhile, if the current
concept is not mapped, a list of recommended concepts from target ontology will be
fetched and showed in area three. Below the recommendation list, there is a search
widget that can be used by users to search concepts from target ontology. Once users
find a matching concept, they can click the match button to make a match. If the
91

concept is mapped, the list of recommendations will not show but the detailed content
of the mapped concept from target ontology will show instead. In such a case, users
will be able to remove the match for the current pair of concepts.
Algorithm 1 describes the steps involved in using depth first search to trace back
from the leaf node to the root node. Then finally, mapping can be exported using
the exportation module.
Algorithm 1: Depth first search from leaf node to root node
Data: DFS(current node, all nodes, roots)
if current node is root node then
add current node into roots list;
else
parent node←− current node.parent;
if parent node not in all nodes then
create new node as parent node;
end
add parent node to current node.parent node;
add current node to parent node.children node;
current node←− parent node;
DFS(current node, all nodes, roots)
end
6.2.3 Recommendation System
IMI comes with a built-in recommendation system. As mentioned above, when an
unmapped concept is selected from the source concept list, a list of recommendation
concepts from target ontology is fetched. They are generated by the IMI default
recommendation system. By default, the IMI implemented fuzzy matching algorithm
[98]. The fuzzy matching algorithm can calculate the similarity between two sequences
and return a score to represent the similarity. We use a priority queue to keep track
92

of the top five concepts from target ontology with the highest scores. The list of
recommended concepts can be generated on-the-fly but the time is highly dependent
on the size of the target ontology.
6.3 Result
In this section, we demonstrate the result by making a mapping between KCR data
dictionary and NCIt using our IMI. Here, we extracted 301 used KCR terms from
the actual data and verified with domain experts. 47 out of 301 are mapped, leaving
the rest unmapped. Five branches of the hierarchical tree are constructed from the
target ontology.
6.3.1 Ontology Library
Figure 6.3 presents the ontology library system of IMI. We can see that all uploaded
ontologies are listed in a table. Currently, we have two ontologies. To add a new
ontology, the admin user can simply click the ”Add a New Ontology” button and use
the interface shown at the right of Figure 6.3.
When an ontology file is selected from the local disk, IMI will scan through and
retrieve the header of the CSV file. Here, we assume that the uploaded ontology file
format is CSV file which can found on the web like bioportal. Shown in Figure 6.4
The admin user will be able to select fields to import into the database. Currently,
IMI has uploaded two ontologies with over 150,000 concepts. More ontologies can be
incorporated into the ontology library when these ontologies are requested by users.
6.3.2 Interactive Mapping Interface
We implemented the IMI using Ruby on Rails, an agile web development framework.
IMI has been deployed and is publicly available at http://epi-tome.com for free.
93

Figure 6.3: Ontology library.
Figure 6.4: Interface for uploading ontology.
6.3.2.1 Project Management Module
The mapping pipeline is initiated by creating a project using our project manage-
ment module. The project management is a standard CRUD (create, read, update,
delete) interface where uses can specify the project name, project description, and
more importantly select the target ontology and one default search field. The default
search field for the target ontology will become the default search field when users
94

try to search matching concepts from target ontology. Besides, users can determine
if the project is public. All users from IMI will be able to contribute to the mapping
for public projects. Once a project is created, the pipeline proceeds to the data dic-
tionary uploading. The uploading is done using the data dictionary upload interface.
IMI reuse a similar mechanism from the ontology library uploader but apply that in
the data dictionary.
6.3.2.2 Mapping Dashboard
The mapping dashboard is the core module for the IMI system. From the mapping
dashboard, users can navigate to other modules:
access control
logs and comments
visualization
mapping result review and exportation
Figure 6.5: Mapping dashboard.
Figure 6.5 shows the mapping dashboard consists of two major columns. The left
column lists all the uploaded data dictionary. The default mode is browsing mode and
95

users can switch to search mode using the switch widget. Those mapped concepts are
denoted by a green box with ”M” while unmapped concepts are denoted by a red box
with ”U”. The right column shows the selected variable from the data dictionary. The
display fields are set when users uploading the data dictionary. Below the selected
variable is the target ontology area. If the concept is mapped, the mapped concept
from the target ontology will be shown in this area. Moreover, users can delete the
existing match and utilize the search widget down below to search other candidates
and redo the matching again. In this example, we can see ”Race 1” from KCR data
dictionary is mapped to concept the ”Race” in NCIt. If the concept is unmapped, a
list of recommendations will show up the ranking by their scores.
Figure 6.6: Access control.
Figure 6.6 demonstrates the access control module and the logs and comments
module. If the current project is not public, the project owner can use the access
control module to grant privilege to certain users. The access control module provides
two privileges: 1) Can edit; 2) Can map. The first privilege is the admin level privilege
and the second one will only allow users to perform mapping. The logs and comments
module keeps track of each map and remove mapping activities as logs. Besides, users
can leave comments about current mapping.
96

Figure 6.7: Logs and comments module.
Figure 6.8: Mapping result review and exportation.
6.3.2.3 Interactive Tool for Ontology Hierarchy Curation and Rectifica-
tion
We identified five branches from the NCIt for our extracted KCR terms. Figure 6.9
shows all these branches. The green nodes in the figure denote concepts that are
mapped from KCR data dictionary. Red nodes represent intermediate nodes from
target ontology. The edge between two nodes represents the hierarchical relations.
The upper node is the parent node of the lower node. Table 6.1 summarize the root
concept, number of nodes, and maximum levels for these five branches. In IMI, we
have two modes for visualization. The first one is a typical tree-based visualization.
The second one is the interactive mode powered by D3 library force layout. In the
second mode, the root concepts are positioned in the center of the graph, and users
97
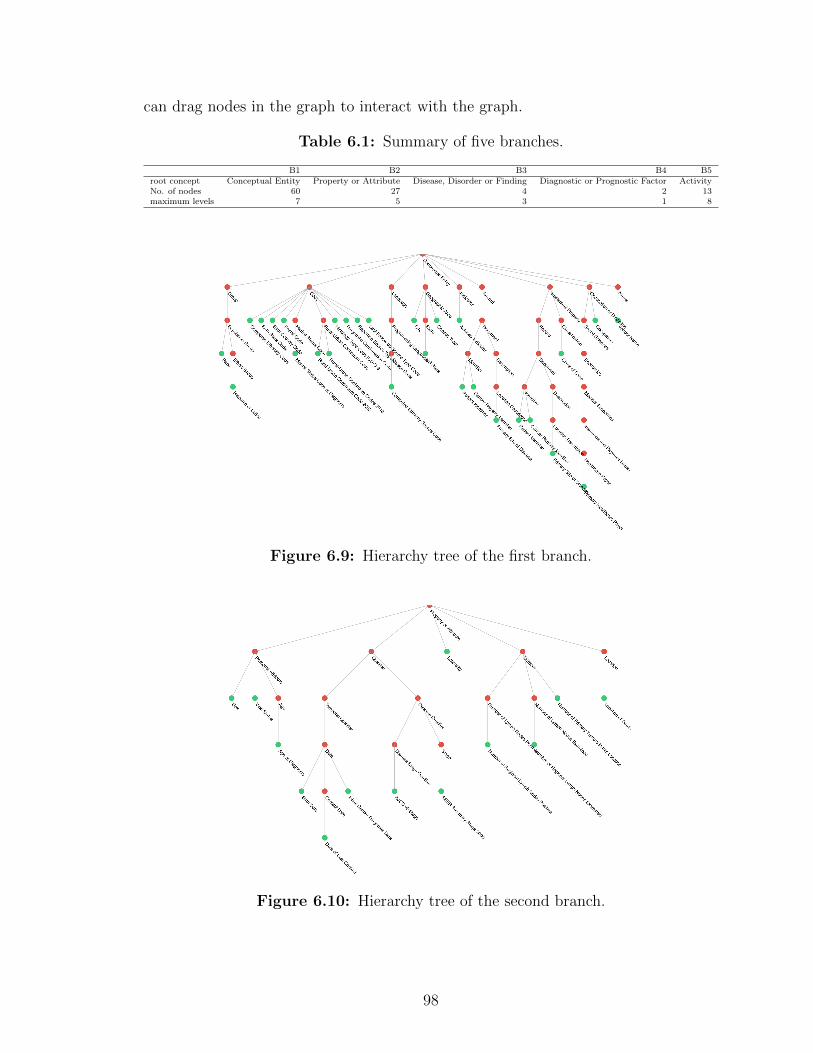
can drag nodes in the graph to interact with the graph.
Table 6.1: Summary of five branches.
B1 B2 B3 B4 B5root concept Conceptual Entity Property or Attribute Disease, Disorder or Finding Diagnostic or Prognostic Factor ActivityNo. of nodes 60 27 4 2 13maximum levels 7 5 3 1 8
Figure 6.9: Hierarchy tree of the first branch.
Figure 6.10: Hierarchy tree of the second branch.
98

Figure 6.11: Hierarchy tree of the third branch.
Figure 6.12: Hierarchy tree of the fourth branch.
The mapping result view and exportation module summarize the number of mapped
and unmapped concepts. To export the mapping file, users simply click the ”Export
To CSV File” button, and a one to one mapping file will be downloaded automatically.
99

Figure 6.13: Hierarchy tree of the fifth branch.
6.4 Evaluation
The evaluation was designed to assess IMI’s performance and usability by comparing
it with the CSV based mapping.
6.4.1 Usability
To perform usability evaluation, we choose ten most commonly used data dictionaries
from NAACCR and map them to NCIt using two approaches. The first approach is
to use our mapping interface IMI, the second approach is to use the CSV file. We
choose to compare with the CSV file based method as it is the most common and pop-
ular approach when researchers are doing small scale mapping. Ten data dictionary
elements are selected out of 301 data dictionary elements, shown in Table 6.2. The
approach we do mapping in IMI is to select the data element one by one and search
on our built-in searching function shown in the figure. CSV file does not provide
searchable ontology. But the NCIt official website provides a similar search function.
Therefore, we utilize the search function on the NCIt website. All the mapping will
100

be conducted 3 times and we calculated the average time for each mapping pair.
Table 6.2: Average mapping time for ten selected data dictionary elements.
Data dictionary element IMI CSV
Race 1 12.3s 30.6s
Race Coding Sys–Current 30.1s 55.3s
Race Coding Sys–Original 33.2s 64.1s
Spanish/Hispanic 15.4s 37.5s
Computed Ethnicity 17.1s 29.7s
Computed Ethnicity Source 18.1s 40.3s
Sex 15.1s 36.2s
Date of Birth 17.6s 28.1s
Nhia Derived Hisp Origin 32.5s 55.1s
Birthplace–State 20.6s 43.2s
6.4.2 The Evaluation of the Recommendation System
The 47 mapped concepts are mapped by the domain experts, which can be viewed
as ground truth. If we treated the first concept from the recommendations as to the
matched concept and calculated our recommendation system accuracy. 25 of these
recommended concepts are correct. So the accuracy is 53%. For some terms, many
of the recommended concepts are actually with same scores. If one from the five
recommended concepts is correct, we consider that mapping is correct. For such a
case, the accuracy would increase to 66%.
6.5 Discussion
6.5.1 Usability
For the efficiency or mapping time of IMI, we observed improvements compared to
the CSV-based approach. Since NCIt also provides a nice searching function on its
official website, time for searching matching concepts did not make a huge difference.
The difference is mainly from building mapping contents. The CSV-based approach
requires additional time to copy contents from the NCIt website and paste them
101

back to the CSV file while IMI requires a single click. Besides, some concepts are
more time consuming as these concepts do not have the corresponding mapping from
the NCIt, building mapping for such concepts required additional validations. For
ontologies without similar searching functions like NCIt, we can assure IMI would
perform better. What’s more, IMI can provide richer features than the CSV-based
method.
6.5.2 Generalization
Although our IMI was developed for the KCR, its framework has been designed and
implemented to be generally applicable to other data dictionary for building mapping
other ontologies.
6.5.3 Limitation and future work
Currently, IMI only supports two ontologies as target ontology. More widely used
ontologies should be incorporated. In the meanwhile, with more ontologies uploaded,
the performance for searching concepts among millions of concepts should be evalu-
ated. Besides, only the data dictionary and ontologies in CSV format are supported
in the current stage. If the ontology file is in OWL format, it will need to be converted
to CSV format. In addition, our recommendation system is native. More sophisti-
cated mapping algorithms are needed. Last but not least, we plan to enable add, edit
and remove node operations for the visualization graph.
6.6 Concluding remarks
In this work, we presented IMI. IMI provides an interactive, intuitive, and collabo-
rative mapping interface for building mapping between data dictionary to ontology,
so as to facilitate data analytics through interoperability and integration and provide
semantic access across aggregated data used in knowledge-based applications and ser-
102

vices. IMI enforces the accessible and reusable principle from the FAIR principles,
as IMI acts as a central mapping hub making mappings available to the public and
therefore existing mappings can be reused by other researchers.
103

CHAPTER 7. Conclusion
In this dissertation, we develop a FAIR principles guided general framework for build-
ing the fine-grained, cross-cohort query, and exploration systems and propose an in-
teractive, collaborative mapping for building mapping from a data dictionary to an
ontology. To address the common challenges existing in various biomedical research
regarding data access and heterogeneous data integration such as:
Barriers between data exploration and research hypothesis. In a traditional
workflow, the research hypothesis comes before patient data exploration. A
new and efficient data exploration tool is needed to accelerate such a process.
The lack of fine-grained, cross-cohort query and exploration interfaces, and
systems. Although many data repositories allow users to browse their content,
few of them support fine-grained, cross-cohort query, and exploration at the
study-subject level.
Tools for building mappings between data dictionary and ontologies are missing.
In some researches, patient data are collected with the help of a data dictionary.
To integrate these patient data and build ontology enabled data query interfaces,
a mapping between multiple data dictionaries and ontology are critical. Such
mappings usually are built by a group of researchers and domain experts, an
efficient tool for collaboration and result visualization is required.
First of all, to break the traditional data access barriers between data exploration
and research Hypotheses. We proposed a general framework that can apply to differ-
ent domains.
We firstly applied MetaSphere on National Sleep Research Resource (NSRR) [11]
and developed X-search [89]. X-search has been designed as a general framework with
104

two loosely-coupled components: semantically annotated data repository and cross-
cohort exploration engine. The semantically annotated data repository is comprised
of a canonical data dictionary, data sources with a data dictionary, and mappings
between each individual data dictionary and the canonical data dictionary. The
cross-cohort exploration engine consists of five modules: query builder, graphical
exploration, case-control exploration, query translation, and query execution. The
canonical data dictionary serves as the unified metadata to drive the visual exploration
interfaces and facilitate query translation through the mappings.
While developing X-search, we found out that some query performance issues are
introduced by the traditional relational databases. Such query performance issues
can be improved but not solved completely. To address that, we tried out the NoSQL
databases and conduct a comparison experiment. We developed two NoSQL-based
patient cohort identification systems, in comparison to a SQL-based system, to evalu-
ate their performance on supporting high-dimensional and heterogeneous data sources
in NSRR. Utilizing NoSQL databases, we overcame the limitation of maximum ta-
ble column count in traditional relational databases. We successfully integrated eight
NSRR cross-cohort datasets into NoSQL databases, which largely enhanced the query
performance compared to the MySQL-based system, while maintained similar perfor-
mance for data loading and harmonization. This study indicates that NoSQL-based
systems offer a promising approach for developing patient cohort query systems across
heterogeneous data sources in our case.
From the NoSQL-based MetaSphere, we introduce SCIPUDSphere in Chapter
5, an informatics platform, that enables data extraction, integration, storage, and
analysis to provide clinical decision support and user interfaces direct access to well-
annotated and deidentified wide range PrI risk factors of data. We created a dedicated
Spinal Cord Injury Pressure Ulcer and Deep tissue injury ontology (SCIPUDO) as the
knowledge resource for processing specialized terms related to SCI, PrI, and DTPrI.
105
We extracted the demographics, comorbidities, medications, and patient SCI diag-
nosis data from VINCI [36]. By adapting existing tools: NSRR and MEDCIS [88],
we successfully implemented a powerful and intuitive user interface that empowers
researchers to quickly pinpoint possible risk factors and perform exploratory queries.
We believe that SCIPUDSphere can help researchers to find a comprehensive range
of PrI risk factor data and promotes clinical researches for preventing PrI and DTPrI.
While we are trying to introduce MetaSphere to a domain like cancer, we encounter
a similar problem when we are working on NSRR. Mapping from data dictionaries to
ontology are needed. However, the building of such mappings is mostly done using the
excel program which is not easy to share and work collaboratively. Besides, there is
no way to visualize the hierarchical structure from the mapping. To address that, we
presented the Interactive Mapping Interface (IMI). IMI has been designed as a general
framework with three decoupled components: 1) ontology library; 2) mapping inter-
face; 3) recommendation system. The ontology library provides a list of ontologies
as the target ontology for constructing mappings. The mapping interface consists of
six modules: project management system, interactive mapping interface, access con-
trol, logs and comments, ontology hierarchy visualization, and mapping exportation.
The recommendation system serves as primitive auto mapping and provides a list
of potential matching concepts from target ontology. IMI is publicly accessible at
http://epi-tome.com with two supported ontologies over 150,000 concepts. IMI has
been applied to KCR successfully and 47 out of 301 frequently used concepts have
been mapped to NCI Thesaurus (NCIt), where the rest do not have matching con-
cepts from NCIt. IMI provides an interactive, intuitive, and collaborative mapping
interface for building mapping between data dictionary and ontologies, so as to fa-
cilitate data analytics through interoperability and integration and provide semantic
access across aggregated data used in knowledge-based applications and services.
106

7.1 Contributions
We propose a general framework called MetaSphere. MetaSphere provides three ma-
jor functionalities in terms of metadata management for clinical data integration.
The first functionality is the structural, scalable, and computer understandable way
of metadata storage. MetaSphere stores the ontology and its associated concepts,
variables, and domains in a scalable database. Additionally, utilizing the database’s
associations between tables, MetaSphere can represent the relationships between con-
cepts, the relationships between concepts and variables, the relationships between
variables and domains properly.
The second functionality is the fine-grained, cross-cohort query interface. Meta-
Sphere hierarchically organizes an ontology’s concepts and reflects such hierarchies
in the interface. With direct interaction, users will be able to browse the ontology’s
structures easily. Utilizing the query interface, users can compose complex queries to
query and explore data at the study-subject level.
Finally, MetaSphere provides an interactive, intuitive, and collaborative mapping
interface for building mapping between data dictionary to ontology, so as to facilitate
data analytics through interoperability and integration and provide semantic access
across aggregated data used in knowledge-based applications and services.
Our contributions are:
We created a general framework which can apply to different domains to facili-
tate the data exploration and remove the barriers standing between researches
hypothesis and data access.
We created an informatics platform, that enables data extraction, integration,
storage, and analysis to provide clinical decision support and user interfaces
direct access to well-annotated and deidentified wide range PrI risk factors of
data.
107

We created a dedicated Spinal Cord Injury Pressure Ulcer and Deep tissue injury
ontology (SCIPUDO) as the knowledge resource for processing specialized terms
related to spinal cord injury and pressure ulcer; 4) we created an interactive
and collaborative mapping interface aiming at connecting data dictionaries to
ontologies.
7.2 Future Work
There are several aspects to the work of MetaSphere that can be improved. We will
focus on the following aspects in the future.
For X-search, we have built a pipeline for integrating new datasets. Currently, the
pipeline is in a raw form. The pipeline involves many trivial procedures and many
manual works are necessary for checking the correctness. One important future work
is to build an online task tracking and live feedback monitoring system. Basically, we
would like to make the pipeline semi-auto and reduce unnecessary manual workload.
For IMI, we provide two ways to visualize the hierarchical structure for the mapped
data dictionary. Currently, the generated graph cannot be edited. One interesting
future work would be providing an editable visualization interface. Users can edit on
the system generated graphs and save even share their work with other users.
108

REFERENCES
[1] Tracy D Gunter and Nicolas P Terry. The emergence of national electronichealth record architectures in the united states and australia: models, costs, andquestions. Journal of medical Internet research, 7(1):e3, 2005.
[2] What is human subjects research?. https://web.archive.org/web/
20120207032034/http://www.utexas.edu/research/rsc/humansubjects/
whatis.html (visited: 2020-03-10).
[3] Anca Vaduva and Thomas Vetterli. Metadata management for data warehous-ing: An overview. International Journal of Cooperative Information Systems,10(03):273–298, 2001.
[4] Francis S Collins and Lawrence A Tabak. Policy: Nih plans to enhance repro-ducibility. Nature, 505(7485):612–613, 2014.
[5] Joseph S Ross and Harlan M Krumholz. Ushering in a new era of open sciencethrough data sharing: the wall must come down. Jama, 309(13):1355–1356, 2013.
[6] Lisa M Federer, Ya-Ling Lu, Douglas J Joubert, Judith Welsh, and BarbaraBrandys. Biomedical data sharing and reuse: Attitudes and practices of clinicaland scientific research staff. PloS one, 10(6), 2015.
[7] Mark D Wilkinson, Michel Dumontier, IJsbrand Jan Aalbersberg, GabrielleAppleton, Myles Axton, Arie Baak, Niklas Blomberg, Jan-Willem Boiten,Luiz Bonino da Silva Santos, Philip E Bourne, et al. The fair guiding principlesfor scientific data management and stewardship. Scientific data, 3, 2016.
[8] Nci genomic data commons, Jan 2020. https://gdc.cancer.gov/ (visited:2020-01-30).
[9] Natalya F Noy, Nigam H Shah, Patricia L Whetzel, Benjamin Dai, Michael Dorf,Nicholas Griffith, Clement Jonquet, Daniel L Rubin, Margaret-Anne Storey,Christopher G Chute, et al. Bioportal: ontologies and integrated data resourcesat the click of a mouse. Nucleic acids research, 37(suppl 2):W170–W173, 2009.
[10] Russell A Poldrack and Krzysztof J Gorgolewski. Openfmri: Open sharing oftask fmri data. NeuroImage, 144:259–261, 2017.
[11] Dennis A Dean, Ary L Goldberger, Remo Mueller, Matthew Kim, MichaelRueschman, Daniel Mobley, Satya S Sahoo, Catherine P Jayapandian, LicongCui, Michael G Morrical, et al. Scaling up scientific discovery in sleep medicine:the national sleep research resource. Sleep, 39(5):1151–1164, 2016.
[12] Guo-Qiang Zhang, Licong Cui, Remo Mueller, Shiqiang Tao, Matthew Kim,Michael Rueschman, Sara Mariani, Daniel Mobley, and Susan Redline. Thenational sleep research resource: towards a sleep data commons. Journal of theAmerican Medical Informatics Association, 25(10):1351–1358, 2018.
109

[13] Tim Berners-Lee, James Hendler, and Ora Lassila. The semantic web. Scientificamerican, 284(5):34–43, 2001.
[14] Kevin Donnelly. Snomed-ct: The advanced terminology and coding system forehealth. Studies in health technology and informatics, 121:279, 2006.
[15] Diane K Langemo, Helen Melland, Darlene Hanson, Bette Olson, and SusanHunter. The lived experience of having a pressure ulcer: a qualitative analysis.Advances in skin & wound care, 13(5):225, 2000.
[16] Florence A Clark, Jeanne M Jackson, Michael D Scott, Mike E Carlson, Michal SAtkins, Debra Uhles-Tanaka, and Salah Rubayi. Data-based models of howpressure ulcers develop in daily-living contexts of adults with spinal cord injury.Archives of physical medicine and rehabilitation, 87(11):1516–1525, 2006.
[17] M Kristi Henzel, Kath M Bogie, Marylou Guihan, and Chester H Ho. Pressureulcer management and research priorities for patients with spinal cord injury:consensus opinion from sci queri expert panel on pressure ulcer research imple-mentation. J Rehabil Res Dev, 48(3):xi–xxxii, 2011.
[18] Barbara Oot-Giromini, Frances C Bidwell, Naomi B Heller, Marita L Parks,Elizabeth M Prebish, Patricia Wicks, and P Michele Williams. Pressure ulcerprevention versus treatment, comparative product cost study. Advances in Skin& Wound Care, 2(3):52–55, 1989.
[19] Pressure Ulcer Prevention and Treatment Following Spinal Cord Injury. A clin-ical practice guideline for health-care professionals. Consortium for Spinal CordMedicine, 2000.
[20] Pamela Elizabeth Houghton and Karen Campbell. Canadian best practice guide-lines for the prevention and management of pressure ulcers in people with SpinalCord Injury: a resource handbook for clinicians. Ontario Neurotrauma Founda-tion, 2013.
[21] Maureen Benbow. Guidelines for the prevention and treatment of pressure ulcers.Nursing Standard, 20(52):42–45, 2006.
[22] Michael Kosiak. Prevention and rehabilitation of pressure ulcers. Decubitus,4(2):60–2, 1991.
[23] North american association of central cancer registries. https://www.naaccr.
org/ (visited: 2020-03-15).
[24] Jennifer Golbeck, Gilberto Fragoso, Frank Hartel, Jim Hendler, Jim Oberthaler,and Bijan Parsia. The national cancer institute’s thesaurus and ontology. Journalof Web Semantics First Look 1 1 4, 2003.
[25] Force11. the fair data principles. https://www.force11.org/group/
fairgroup/fairprinciples (visited: 2020-01-30).
110

[26] European commission. guidelines on fair data management in horizon 2020.
[27] Ian Harrow, Rama Balakrishnan, Ernesto Jimenez-Ruiz, Simon Jupp, Jane Lo-max, Jane Reed, Martin Romacker, Christian Senger, Andrea Splendiani, JabeWilson, et al. Ontology mapping for semantically enabled applications. Drugdiscovery today, 2019.
[28] Jerome Euzenat, Pavel Shvaiko, et al. Ontology matching, volume 18. Springer,2007.
[29] William W Cohen, Pradeep Ravikumar, Stephen E Fienberg, et al. A comparisonof string distance metrics for name-matching tasks. In IIWeb, volume 2003, pages73–78, 2003.
[30] Wei He, Xiaoping Yang, and Dupei Huang. A hybrid approach for measur-ing semantic similarity between ontologies based on wordnet. In InternationalConference on Knowledge Science, Engineering and Management, pages 68–78.Springer, 2011.
[31] Cliff A Joslyn, Patrick Paulson, Amanda White, and Sinan Al Saffar. Measuringthe structural preservation of semantic hierarchy alignments. In Proceedings ofthe 4th International Workshop on Ontology Matching. CEUR Workshop Pro-ceedings, volume 551, pages 61–72, 2009.
[32] Martin Warin and HM Volk. Using wordnet and semantic similarity to disam-biguate an ontology. Retrieved January, 25:2008, 2004.
[33] Vincenzo Loia, Giuseppe Fenza, Carmen De Maio, and Saverio Salerno. Hybridmethodologies to foster ontology-based knowledge management platform. In2013 IEEE Symposium on Intelligent Agents (IA), pages 36–43. IEEE, 2013.
[34] The national sleep research resource. https://sleepdata.org/ (visited: 2020-03-16).
[35] Vista monograph. https://www.va.gov/VISTA_MONOGRAPH/VA_Monograph.pdf(visited: 2020-03-15).
[36] Va informatics and computing infrastructure (vinci). https://www.hsrd.
research.va.gov/for_researchers/vinci/ (visited: 2020-03-16).
[37] Nicholas Sioutos, Sherri de Coronado, Margaret W Haber, Frank W Hartel,Wen-Ling Shaiu, and Lawrence W Wright. Nci thesaurus: a semantic model in-tegrating cancer-related clinical and molecular information. Journal of biomedicalinformatics, 40(1):30–43, 2007.
[38] Technical notes: Collaborating partner: Naaccr. https://www.cdc.gov/
cancer/uscs/technical_notes/contributors/index.htm?CDC_AA_refVal=
https%3A%2F%2Fwww.cdc.gov%2Fcancer%2Fnpcr%2Fuscs%2Ftechnical_
notes%2Fcontributors%2Findex.htm (visited: 2020-01-30).
111

[39] Seer training modules: Naaccr. https://training.seer.cancer.gov/
operations/standards/setters/naaccr.html (visited: 2020-01-30).
[40] Health information resource database: Naaccr. https://health.gov/nhic/
scripts/Entry.cfm?HRCode=HR3343 (visited: 2020-01-30).
[41] Kentucky cancer registry. https://www.kcr.uky.edu/ (visited: 2020-03-15).
[42] Craig Larman and Victor R Basili. Iterative and incremental developments. abrief history. Computer, 36(6):47–56, 2003.
[43] Pekka Abrahamsson, Outi Salo, Jussi Ronkainen, and Juhani Warsta. Ag-ile software development methods: Review and analysis. arXiv preprintarXiv:1709.08439, 2017.
[44] React - a javascript library for building user interfaces. https://reactjs.org/(visited: 2020-01-30).
[45] Refs and the dom. react blog. https://reactjs.org/docs/
refs-and-the-dom.html (visited: 2020-02-04).
[46] Thomas Dave and Hansson David Heinemeier. Agile web development with rails.Citeseer, 2005.
[47] Uniprot: the universal protein knowledgebase. Nucleic acids research,45(D1):D158–D169, 2017.
[48] The nci’s genomic data commons (gdc). https://gdc.cancer.gov/ (visited:2020-03-04).
[49] Shawn N Murphy, Griffin Weber, Michael Mendis, Vivian Gainer, Henry CChueh, Susanne Churchill, and Isaac Kohane. Serving the enterprise and be-yond with informatics for integrating biology and the bedside (i2b2). Journal ofthe American Medical Informatics Association, 17(2):124–130, 2010.
[50] Griffin M Weber, Shawn N Murphy, Andrew J McMurry, Douglas MacFadden,Daniel J Nigrin, Susanne Churchill, and Isaac S Kohane. The shared healthresearch information network (shrine): a prototype federated query tool for clin-ical data repositories. Journal of the American Medical Informatics Association,16(5):624–630, 2009.
[51] Guo-Qiang Zhang, Trish Siegler, Paul Saxman, Neil Sandberg, Remo Mueller,Nathan Johnson, Dale Hunscher, and Sivaram Arabandi. Visage: a query in-terface for clinical research. Summit on translational bioinformatics, 2010:76,2010.
[52] Richard Bache, Simon Miles, and Adel Taweel. An adaptable architecture forpatient cohort identification from diverse data sources. Journal of the AmericanMedical Informatics Association, 20(e2):e327–e333, 2013.
112

[53] J Marc Overhage, Patrick B Ryan, Christian G Reich, Abraham G Hartzema,and Paul E Stang. Validation of a common data model for active safetysurveillance research. Journal of the American Medical Informatics Association,19(1):54–60, 2012.
[54] George Hripcsak, Jon D Duke, Nigam H Shah, Christian G Reich, Vojtech Huser,Martijn J Schuemie, Marc A Suchard, Rae Woong Park, Ian Chi Kei Wong,Peter R Rijnbeek, et al. Observational health data sciences and informatics(ohdsi): opportunities for observational researchers. Studies in health technologyand informatics, 216:574, 2015.
[55] The vanderbilt institute for clinical and translational research. https://victr.vanderbilt.edu/eleMAP/ (visited: 2020-03-11).
[56] Deepak K Sharma, Harold R Solbrig, Eric Prud’ hommeaux, Kate Lee, Jyotish-man Pathak, and Guoqian Jiang. D2refine: A platform for clinical research studydata element harmonization and standardization. AMIA Summits on Transla-tional Science Proceedings, 2017:259, 2017.
[57] Metadata for cancer data. https://cbiit.cancer.gov/ncip/
biomedical-informatics-resources/interoperability-and-semantics/
metadata-and-models (visited: 2020-03-10).
[58] Nci thesaurus. https://ncithesaurus.nci.nih.gov/ncitbrowser/ (visited:2020-02-04).
[59] The sleep heart health study data set. https://sleepdata.org/datasets/shhs(visited: 2020-03-04).
[60] Stuart F Quan, Barbara V Howard, Conrad Iber, James P Kiley, F Javier Ni-eto, George T O’Connor, David M Rapoport, Susan Redline, John Robbins,Jonathan M Samet, et al. The sleep heart health study: design, rationale, andmethods. Sleep, 20(12):1077–1085, 1997.
[61] S Redline, MH Sanders, BK Lind, SF Quan, C Iber, DJ Gottlieb, WH Bonekat,DM Rapoport, PL Smith, and JP Kiley. Sleep heart health research groupmethods for obtaining and analyzing unattended polysomnography data for amulticenter study. Sleep, 21(7):759–767, 1998.
[62] Childhood adenotonsillectomy trial. https://sleepdata.org/datasets/chat
(visited: 2020-03-04).
[63] Susan Redline, Raouf Amin, Dean Beebe, Ronald D Chervin, Susan L Garetz,Bruno Giordani, Carole L Marcus, Renee H Moore, Carol L Rosen, RaananArens, et al. The childhood adenotonsillectomy trial (chat): rationale, design,and challenges of a randomized controlled trial evaluating a standard surgicalprocedure in a pediatric population. Sleep, 34(11):1509–1517, 2011.
113

[64] Carole L Marcus, Renee H Moore, Carol L Rosen, Bruno Giordani, Susan LGaretz, H Gerry Taylor, Ron B Mitchell, Raouf Amin, Eliot S Katz, RaananArens, et al. A randomized trial of adenotonsillectomy for childhood sleep apnea.N Engl J Med, 368:2366–2376, 2013.
[65] Cleveland family study. https://sleepdata.org/datasets/cfs (visited: 2020-03-04).
[66] Susan Redline, Peter V Tishler, Tor D Tosteson, John Williamson, KennethKump, Ilene Browner, Veronica Ferrette, and Patrick Krejci. The familial aggre-gation of obstructive sleep apnea. American journal of respiratory and criticalcare medicine, 151(3 pt 1):682–687, 1995.
[67] Susan Redline, Peter V Tishler, Mark Schluchter, Joan Aylor, Kathryn Clark,and Gregory Graham. Risk factors for sleep-disordered breathing in children:associations with obesity, race, and respiratory problems. American journal ofrespiratory and critical care medicine, 159(5):1527–1532, 1999.
[68] Heart biomarker evaluation in apnea treatment. https://sleepdata.org/
datasets/hearbeat (visited: 2020-03-04).
[69] Study of osteoporotic fractures. https://sleepdata.org/datasets/sof (vis-ited: 2020-03-04).
[70] Mros sleep study. https://sleepdata.org/datasets/mros (visited: 2020-03-04).
[71] Hispanic community health study / study of latinos. https://sleepdata.org/datasets/hchs (visited: 2020-03-04).
[72] Multi-ethnic study of atherosclerosis. https://sleepdata.org/datasets/mesa(visited: 2020-03-04).
[73] The nih common data element (cde) resource portal. https://www.nlm.nih.
gov/cde/ (visited: 2020-03-11).
[74] Mysql limits on table column count and row size. https://dev.mysql.com/
doc/refman/5.7/en/column-count-limit.html (visited: 2020-03-10).
[75] Karamjit Kaur and Rinkle Rani. Modeling and querying data in nosql databases.In 2013 IEEE International Conference on Big Data, pages 1–7. IEEE, 2013.
[76] Wade L Schulz, Brent G Nelson, Donn K Felker, Thomas JS Durant, and RichardTorres. Evaluation of relational and nosql database architectures to managegenomic annotations. Journal of biomedical informatics, 64:288–295, 2016.
[77] Zohreh Goli-Malekabadi, Morteza Sargolzaei-Javan, and Mohammad Kazem Ak-bari. An effective model for store and retrieve big health data in cloud computing.Computer methods and programs in biomedicine, 132:75–82, 2016.
114

[78] Shiqiang Tao, Licong Cui, Xi Wu, and Guo-Qiang Zhang. Facilitating cohort dis-covery by enhancing ontology exploration, query management and query sharingfor large clinical data repositories. In AMIA Annual Symposium Proceedings,volume 2017, page 1685. American Medical Informatics Association, 2017.
[79] Mongodb: The database for modern applications. https://www.mongodb.com/
(visited: 2020-03-16).
[80] Avinash Lakshman and Prashant Malik. Cassandra: a decentralized structuredstorage system. ACM SIGOPS Operating Systems Review, 44(2):35–40, 2010.
[81] Datastax c/c++ driver for apache cassandra. https://github.com/datastax/cpp-driver (visited: 2020-03-11).
[82] Nsrr cross dataset query interface. https://www.x-search.net/ (visited: 2020-02-15).
[83] Mongodb ruby driver. https://github.com/mongodb/mongo-ruby-driver
(visited: 2020-03-11).
[84] Datastax, datastax enterprise 3.1 documentation, 2015. http://www.datastax.com/doc-source/pdf/dse31.pdf (visited: 2020-03-11).
[85] Courtney H Lyder and Elizabeth A Ayello. Pressure ulcers: a patient safetyissue. In Patient safety and quality: An evidence-based handbook for nurses.Agency for Healthcare Research and Quality (US), 2008.
[86] Madhuri Reddy, Sudeep S Gill, and Paula A Rochon. Preventing pressure ulcers:a systematic review. Jama, 296(8):974–984, 2006.
[87] Emily Haesler. National pressure ulcer advisory panel, european pressure ulceradvisory panel and pan pacific pressure injury alliance. Prevention and treatmentof pressure ulcers: quick reference guide, 2014.
[88] Guo-Qiang Zhang, Licong Cui, Samden Lhatoo, Stephan U Schuele, and Satya SSahoo. Medcis: multi-modality epilepsy data capture and integration system.In AMIA Annual Symposium Proceedings, volume 2014, page 1248. AmericanMedical Informatics Association, 2014.
[89] Licong Cui, Ningzhou Zeng, Matthew Kim, Remo Mueller, Emily R Hankosky,Susan Redline, and Guo-Qiang Zhang. X-search: an open access interface forcross-cohort exploration of the national sleep research resource. BMC medicalinformatics and decision making, 18(1):99, 2018.
[90] Yannis Kalfoglou and Marco Schorlemmer. Ontology mapping: the state of theart. The knowledge engineering review, 18(1):1–31, 2003.
[91] Patrick Lambrix, Lena Stromback, and He Tan. Information integration in bioin-formatics with ontologies and standards. In Semantic techniques for the web,pages 343–376. Springer, 2009.
115

[92] Natalya F Noy. Semantic integration: a survey of ontology-based approaches.ACM Sigmod Record, 33(4):65–70, 2004.
[93] Pavel Shvaiko and Jerome Euzenat. A survey of schema-based matching ap-proaches. In Journal on data semantics IV, pages 146–171. Springer, 2005.
[94] Pavel Shvaiko and Jerome Euzenat. Ontology matching: state of the artand future challenges. IEEE Transactions on knowledge and data engineering,25(1):158–176, 2011.
[95] ontologymapping. http://www.ontologymatching.org (visited: 2020-03-16).
[96] Guoqiang Zhang, Shiqiang Tao, Ningzhou Zeng, and Licong Cui. Ontologies asnested facet systems for human-data interaction. Semantic Web, 11(1):79–86,2020.
[97] Ningzhou Zeng, Guo-Qiang Zhang, Xiaojin Li, and Licong Cui. Evaluation ofrelational and nosql approaches for patient cohort identification from heteroge-neous data sources. In 2017 IEEE International Conference on Bioinformaticsand Biomedicine (BIBM), pages 1135–1140. IEEE, 2017.
[98] Fuzzy matching (computer assisted translation). https://en.wikipedia.
org/wiki/Fuzzy_matching_(computer\protect\discretionary\char\
hyphenchar\fontassisted_translation) (visited: 2020-03-16).
116

Vita
Personal Information
Name: Ningzhou Zeng
Education
MS, Computer Engineering, Case Western Reserve University, Cleveland, OH2013-2017
BS, Optical Information Science and Technology, Sun Yat-Sen University, China2009-2013
Professional Experience
Research Assistant, Institute for Biomedical Informatics, University of Ken-tucky, Lexington, KY 2016-2020
Research Assistant, Department of Computer Science, Case Western ReserveUniversity, Cleveland, OH 2013-2017
Publications
1. Cui, L., Zeng, N., Kim, M., Mueller, R., Hankosky, E. R., Redline, S., & Zhang,G. Q. (2018). Xsearch: an open access interface for cross-cohort exploration ofthe National Sleep Research Resource. BMC medical informatics and decisionmaking, 18(1), 99.
2. Zeng, N., Zhang, G. Q., Li, X., & Cui, L. (2017, November). Evaluation ofrelational and NoSQL approaches for patient cohort identification from hetero-geneous data sources. In 2017 IEEE International Conference on Bioinformaticsand Biomedicine (BIBM) (pp. 1135-1140). IEEE.
3. Zeng, N., Zhang, G. Q., Li, X., & Cui, L. (2017). Evaluation of Relational andNoSQL Approaches for Cohort Identification from Heterogeneous Data Sourcesin the National Sleep Research Resource. J Health Med Informat, 8(295), 2.
4. Zhang, G. Q., Tao, S., Zeng, N., & Cui, L. Ontologies as nested facet systemsfor human–data interaction. Semantic Web, (Preprint), 1-8.
5. Tao, S., Zeng, N., Wu, X., Li, X., Zhu, W., Cui, L., & Zhang, G. Q. (2017).A Data Capture Framework for Large-scale Interventional Studies with Sur-vey Workflow Management. AMIA Joint Summits on Translational Scienceproceedings. AMIA Joint Summits on Translational Science, 2017, 278–286.
117