metabolism in vitro of the microtubule...
TRANSCRIPT
METABOLISM IN VITRO OF THE MICROTUBULE PERTURBAGENS:
CERATAMINES A AND B
by
Sara Elizabeth Smith
Bachelor of Science, Chemistry, Pennsylvania State University, 2008
Master of Professional Studies, Forensic Science, Pennsylvania State University, 2010
Submitted to the Graduate Faculty of the
Kenneth P. Dietrich School of Arts and Sciences in partial fulfillment
of the requirements for the degree of
Doctor of Philosophy in Chemistry
University of Pittsburgh
2014
ii
UNIVERSITY OF PITTSBURGH
DIETRICH SCHOOL OF ARTS AND SCIENCES
This dissertation was presented
by
Sara Elizabeth Smith
It was defended on
July 30, 2014
and approved by
Xinyu Liu, Assistant Professor, Department of Chemistry
Samuel M. Poloyac, Associate Professor, Department of Pharmaceutical Sciences
Renã A. S. Robinson, Assistant Professor, Department of Chemistry
Dissertation Advisor: Stephen G. Weber, Professor, Department of Chemistry

iii
Copyright © by Sara E. Smith
2014
iv
Ceratamines A and B are heterocyclic alkaloids isolated from a Pseudoceratina sp. marine
sponge. These natural products behave as antimitotic agents by targeting microtubules,
specifically through a stabilization mechanism. Their identification led to the discovery of a
novel class of structurally simple microtubule stabilizers, with implications in the treatment of
cancer and perhaps tauopathies, including Alzheimer’s disease. To date, no pre-clinical studies
of the ceratamines have been reported. Therefore, I determined the phase I metabolism of each
compound in vitro. Ceratamine A is rapidly metabolized into nine phase I metabolites by rat liver
microsomes, while ceratamine B only yielded five metabolites. The majority of these metabolites
were formed as a result of N- and O-dealkylations. While the metabolites formed from both
compounds were similar when incubated with human liver microsomes, the major metabolites
were not the same as those from rat liver microsomes. The aminoimidazole is the most
metabolically labile site in rat liver microsomes, however the dibrominated aromatic moiety is
the preferred site for metabolism in human liver microsomes. A metabolic stability assay
revealed that both compounds have a high estimated clearance in rat liver microsomes, but they
appear to be more stable in human liver microsomes. Ceratamine B was estimated to have a
moderate clearance, while ceratamine A was found to have a low clearance. Finally, isozyme
mapping and small molecule inhibition studies revealed that the specific P450 isoforms
METABOLISM IN VITRO OF THE MICROTUBULE PERTURBAGENS:
CERATAMINES A AND B
Sara E. Smith, PhD
University of Pittsburgh, 2014

v
responsible for the formation of two major metabolites of ceratamine B in human liver
microsomes is CYP3A4/5.

vi
TABLE OF CONTENTS
TABLE OF CONTENTS ........................................................................................................... VI
LIST OF TABLES………………………………………………………………………………X
LIST OF FIGURES .................................................................................................................. XII
ABBREVIATIONS .................................................................................................................. XVI
1.0 INTRODUCTION ........................................................................................................ 1
1.1 MARINE NATURAL PRODUCTS IN DRUG DISCOVERY ........................ 1
1.2 ANTIMITOTIC NATURAL PRODUCTS ....................................................... 2
1.3 CLINICAL SIGNIFICANCE OF MICROTUBULE PERTURBAGENS ... 10
1.4 CERATAMINES A AND B .............................................................................. 12
1.5 PROJECT GOALS ............................................................................................ 16
1.6 METABOLISM ................................................................................................. 17
1.6.1 Introduction to xenobiotic metabolism ..................................................... 17
1.6.2 In vitro metabolism studies ......................................................................... 19
2.0 EXPERIMENTAL ..................................................................................................... 24
2.1 MATERIALS ..................................................................................................... 24
2.2 METHODS ......................................................................................................... 25
2.2.1 Microsomal incubations ............................................................................. 25
2.2.2 Large scale microsomal incubations ......................................................... 25

vii
2.2.3 Species comparison ..................................................................................... 26
2.2.4 Metabolic stability assay............................................................................. 26
2.2.5 Incubations of ceratamine B with 1-aminobenzotriazole ........................ 27
2.2.6 Incubations of ceratamine B with recombinant P450 isoforms .............. 27
2.2.7 Incubations of ceratamine B with small molecule inhibitors .................. 28
2.3 ANALYSIS ......................................................................................................... 28
2.3.1 HPLC-UV analysis ...................................................................................... 28
2.3.2 LC-MS/MS analysis .................................................................................... 29
2.3.3 UV/Vis analysis............................................................................................ 35
2.3.4 1H NMR analysis ......................................................................................... 35
3.0 STRUCTURE ELUCIDATION OF PHASE I METABOLITES OF THE
MICROTUBULE PERTURBAGENS: CERATAMINES A AND B .................................... 36
3.1 PHASE I METABOLISM OF CERATAMINES A AND B IN RAT LIVER
MICROSOMES .................................................................................................................. 36
3.2 PRELIMINARY STRUCTURE ELUCIDATION OF PHASE I
METABOLITES OF CERATAMINES A AND B .......................................................... 37
3.2.1 MS spectra of ceratamines A and B .......................................................... 37
3.2.2 Metabolites of ceratamine B ................................................................... ...39
3.2.3 Metabolites of ceratamine A ...................................................................... 43
3.2.4 Multiple reaction monitoring of metabolites of the ceratamines ........... 50
3.3 CONFIRMATORY STRUCTURE ELUCIDATION OF PHASE I
METABOLITES OF CERATAMINES A AND B .......................................................... 53
3.3.1 Co-injection experiment ............................................................................. 53
viii
3.3.2 Accurate mass determinations ................................................................... 54
3.3.3 Isolation of major metabolites of ceratamine B ....................................... 55
3.3.4 UV/Vis spectroscopy ................................................................................... 57
3.3.5 1H NMR spectroscopy................................................................................. 59
4.0 SPECIES COMPARISON OF METABOLIC PROFILE AND STABILITY OF
THE MICROTUBULE PERTURBAGENS: CERATAMINES A AND B ........................... 62
4.1 SEMI-QUANTITATIVE EVALUATION OF THE METABOLISM OF
THE CERATAMINES IN RAT LIVER MICROSOMES ............................................. 62
4.2 SEMI-QUANTITATIVE EVALUATION OF THE METABOLISM OF
THE CERATAMINES IN HUMAN LIVER MICROSOMES ...................................... 64
4.3 SPECIES DIFFERENCES IN THE METABOLISM OF THE
CERATAMINES ................................................................................................................ 72
4.4 METABOLIC STABILITY OF THE CERATAMINES ............................... 74
4.4.1 Metabolic stability of the ceratamines in rat liver microsomes .............. 75
4.4.2 Metabolic stability of the ceratamines in human liver microsomes ....... 78
5.0 IDENTIFICATION OF CYTOCHROMES P450 ISOFORMS INVOLVED IN
HUMAN PHASE I METABOLISM OF CERATAMINE B .................................................. 81
5.1 OPTIMIZATION OF CONDITIONS FOR SMALL MOLECULE
INHIBITOR STUDIES ...................................................................................................... 82
5.2 EFFECT OF 1-AMINOBENZOTRIAZOLE ON THE HUMAN PHASE I
METABOLISM OF CERATAMINE B ........................................................................... 85
5.3 IDENTIFICATION OF P450 ISOFORMS INVOLVED IN THE
FORMATION OF M3 AND M4 ....................................................................................... 88

ix
5.3.1 Isozyme mapping ........................................................................................ 88
5.3.2 Small molecule inhibition studies .............................................................. 89
6.0 CONCLUSION ........................................................................................................... 91
7.0 FUTURE DIRECTIONS ........................................................................................... 93
APPENDIX A .............................................................................................................................. 95
REFERENCES ............................................................................................................................ 99
x
LIST OF TABLES
Table 1.1 Cytochrome P450 isoforms involved in xenobiotic metabolism .................................. 18
Table 2.1 MS-MS source parameters used for the analysis of the ceratamines and the metabolic
stability control compounds……………………………………………………………………...30
Table 2.2 Additional MS-MS source parameters used for the analysis of the ceratamines and the
metabolic stability control compounds………………………………………...………………...31
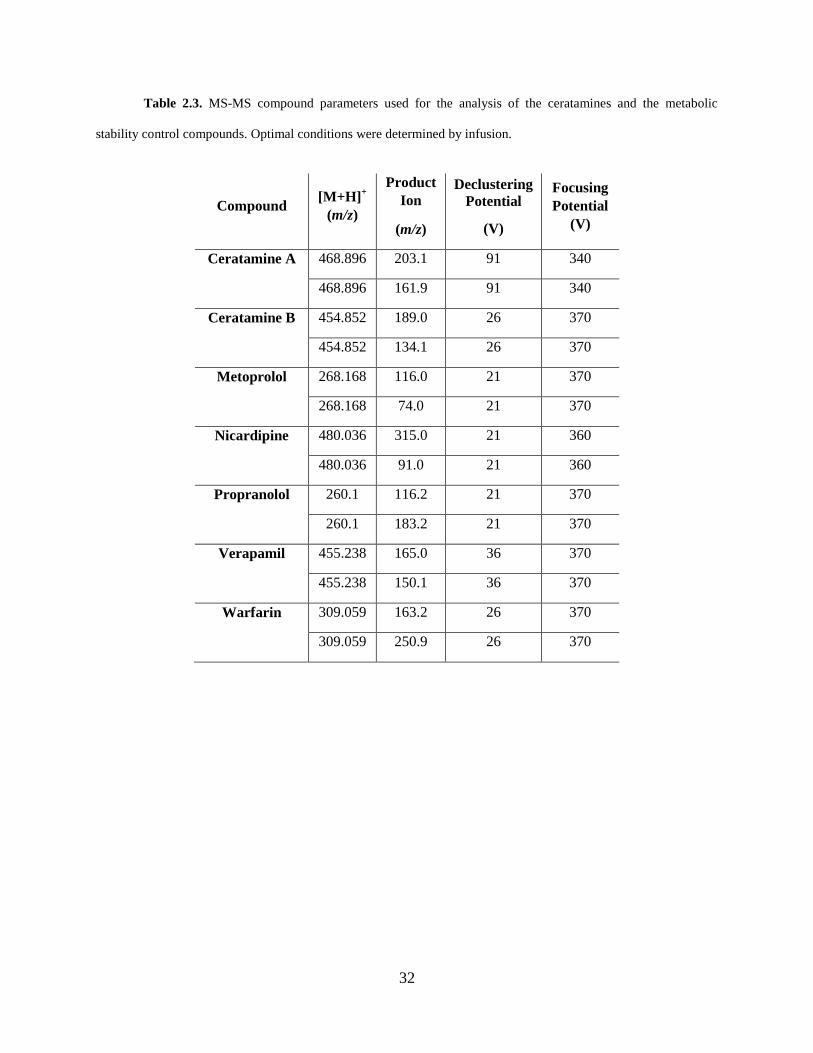
Table 2.3 MS-MS compound parameters used for the analysis of the ceratamines and the
metabolic stability control compounds ……………………………………………..………..….32
Table 2.4 Additional MS-MS compound parameters used for the analysis of the ceratamines and
the metabolic stability control compounds ……………………………..…………..………..….33
Table 3.1 Chromatographic and mass spectrometric information of metabolites of ceratamine B
used for structure elucidation..………….......................................................................................40
Table 3.2 Chromatographic and mass spectrometric information of metabolites of ceratamine A
used for structure elucidation………………………………………………………..……..…….44
Table 3.3 Relative abundances of phase I metabolites of the ceratamines after 60 min incubations
with rat liver microsomes………………………………………………………………………...54
Table 3.4 Accurate mass determination results for proposed molecular formulas of metabolites of
the ceratamines.…………………………………………………………………………………..55
Table 3.5 1H NMR Spectroscopic Data of ceratamine B, M4, and M6.…………………………60
Table 4.1 Lipinski’s rule characteristics of the ceratamines.…………………………………….75
Table 4.2 Control compounds used for metabolic stability assay in rat liver microsomes……...76

xi
Table 4.3 Validation of metabolic stability assay with rat liver microsomes.……….….…….…78
Table 4.4 Estimated clearance categories of the ceratamines……………….……….….…….…80
Table A1 Accurate mass determinations of major fragments of the ceratamines….….……...…95
xii
LIST OF FIGURES
Figure 1.1 Ribbon diagram of the α-, β-tubulin heterodimer and the structure of a microtubule,
consisting of 13 protofilaments wrapped around a hollow core. .................................................... 3
Figure 1.2 Straight and curved conformations of the plus end of microtubules. ............................ 5
Figure 1.3 Reorganization of Microtubules during mitosis. ........................................................... 7
Figure 1.4 Structures of the vinca alkaloids vinblastine and vincristine.. ...................................... 8
Figure 1.5 Paclitaxel binding site within β-tubulin.. ....................................................................... 9
Figure 1.6 Confocal images of MCF-7 cells treated with paclitaxel and vinblastine. .................. 10
Figure 1.7 Structures of Marine Natural Products Ceratamine A and Ceratamine B.. ................. 13
Figure 1.8 Effect of Ceratamine A on mitotic cells.. .................................................................... 15
Figure 3.1 RP HPLC-UV chromatograms of 60 min rat microsomal incubations of the
ceratamines.. ................................................................................................................................. 37
Figure 3.2 [M+H]+ ion clusters and CID product ions of the ceratamines... ................................ 38
Figure 3.3 Neutral loss scans of the ceratamines... ....................................................................... 39
Figure 3.4 [M+H]+ ion cluster and CID product ions of M1... ..................................................... 41
Figure 3.5 [M+H]+ ion cluster and CID product ions of M2.. ...................................................... 41
Figure 3.6 [M+H]+ ion cluster and CID product ions of M3... ..................................................... 42
Figure 3.7 [M+H]+ ion clusters and CID product ions of M4 and M6... ...................................... 43
Figure 3.8 [M+H]+ ion cluster of M9... ........................................................................................ 43
Figure 3.9 [M+H]+ ion clusters of M10, M4, and M6... .............................................................. 46
xiii
Figure 3.10 CID product ions of M10 and M4.. ........................................................................... 46
Figure 3.11 Comparison of retention times of ceratamine B and CB... ........................................ 47
Figure 3.12 [M+H]+ ion cluster and CID product ions of M8... .................................................. 48
Figure 3.13 [M+H]+ ion clusters of M5, M7, and CB... .............................................................. 49
Figure 3.14 CID product ions of M5, M7, and CB... ................................................................... 49
Figure 3.15 MRM analysis of metabolites of ceratamine A formed by rat liver microsomes.... 50
Figure 3.16 MRM analysis of metabolites of ceratamine B formed by rat liver microsomes... .. 51
Figure 3.17 Proposed structures of the phase I metabolites of the ceratamines.... ...................... 52
Figure 3.18 RP-HPLC-UV chromatogram of a co-injection of 60 min rat microsomal
incubations of ceratamine A and B... ............................................................................................ 53
Figure 3.19 HPLC-UV chromatogram displaying optimized separation of metabolites of
ceratamine B using a semi-preparative column... ......................................................................... 56
Figure 3.20 Effect of injection volume on separation of metabolites of ceratamine B using semi-
preparative conditions... ................................................................................................................ 57
Figure 3.21 UV/Vis absorbance spectra of ceratamine B, M3, M4, and M6. ............................. 58
Figure 3.22 Proposed structures of two major phase I metabolites of ceratamine B formed by rat
liver microsomes... ........................................................................................................................ 61
Figure 4.1 Formation of metabolites of ceratamine A by rat liver microsomes.. ......................... 63
Figure 4.2 Formation of metabolites of ceratamine B in rat liver microsomes.. .......................... 64
Figure 4.3 RP-HPLC-UV chromatograms of incubations of ceratamine A with rat and human
liver microsomes.. ......................................................................................................................... 65
Figure 4.4 [M+H]+ ion cluster and CID product ions of M9 formed by human liver microsomes..
....................................................................................................................................................... 66
Figure 4.5 [M+H]+ ion cluster and CID product ions of M8 formed by human liver
microsomes………………………………………………………………………………………67
Figure 4.6 [M+H]+ ion clusters and CID product ions of M5 and M7.. ...................................... 68
xiv
Figure 4.7 Formation of metabolites of ceratamine A in human liver microsomes.. .................. 69
Figure 4.8 RP-HPLC-UV chromatograms of incubations of ceratamine B with rat and human
liver microsomes.. ......................................................................................................................... 69
Figure 4.9 [M+H]+ ion cluster and CID product ions of M1 formed by human liver microsomes..
....................................................................................................................................................... 70
Figure 4.10 [M+H]+ ion clusters and CID product ions of M4 and M6 formed by human liver
microsomes.. ................................................................................................................................. 71
Figure 4.11 Formation of metabolites of ceratamine B in human liver microsomes.. ................ 72
Figure 4.12 Species comparison of the metabolic profiles of the ceratamines in rat and human
liver microsomes…...…………………………………………………………………………….73
Figure 4.13 Depletion profiles of control compounds used for the validation of the metabolic
stability assay in rat liver microsomes…………………………………………………………...77
Figure 4.14 Depletion profiles of control compounds used for the validation of the metabolic
stability assay in human liver microsomes………………………………………………………79
Figure 5.1 Depletion profile of ceratamine B in human liver microsomes……………...………82
Figure 5.2 Effect of total P450 content on the rate of formation of M2……..…………………..83
Figure 5.3 Effect of NADPH on depletion of ceratamine B in rat liver microsomes.……….…..84
Figure 5.4 Depletion of ceratamine B and formation of M3, M4, and M6 in human liver
microsomes using optimized conditions……………………...………………………………….85
Figure 5.5 Effect of 1-aminobenzotriazole (ABT), on the formation of the major metabolites of
ceratamine B in human liver microsomes ……………………………………………………….86
Figure 5.6 Effect of NADPH on the formation of M6 in HLMs.. ............................................... 87
Figure 5.7 Isozyme mapping of the formation of M3 and M4……………………………….…89
Figure 5.8 Effect of ketoconazole on the formation of the major metabolites of ceratamine B in
human liver microsomes.. ............................................................................................................. 90
Figure A1 1H NMR spectrum of ceratamine B…………………………………………………..95
Figure A2 1H NMR spectrum of M4…………………………………………………………....96
Figure A3 1H NMR spectrum of M6…………………………………………………………....97

xv
Figure A4 [M+H]+ ion clusters and product ions of M10 formed by HLMs……………….......97
Figure A5 [M+H]+ ion clusters and product ions of M3 formed by HLMs…………………….98

xvi
ABBREVIATIONS
ABT 1-Aminobenzotriazole
CB Ceratamine B formed as a metabolite from ceratamine A
GDP Guanosine Diphosphate
GTP Guanosine Triphosphate
HLMs Human Liver Microsomes
HPLC High Performance Liquid Chromatography
LC Liquid Chromatography
LC-MS/MS Liquid Chromatography-tandem Mass Spectrometry
M1, M2, etc. Metabolite 1, Metabolite 2 etc…
MRM Multiple Reaction Monitoring
MS/MS Tandem Mass Spectrometry
NADPH Nicotinamide adenine dinucleotide phosphate
QqQ Triple Quadrupole Mass Spectrometry
QqTOF Quadrupole-Time of Flight Mass Spectrometry
RLMs Rat Liver Microsomes
RP-HPLC Reversed Phase High Performance Liquid Chromatography

1
1.0 INTRODUCTION
1.1 MARINE NATURAL PRODUCTS IN DRUG DISCOVERY
Natural products have been an essential component of drug discovery and development for
hundreds of years.1 To date approximately 50% of drugs approved in the United States each year
are or are derived from natural products.1,2
Initial interest in natural products as sources of
therapeutic agents centered around terrestrial species, which was mostly due to the ease of access
to these plants and organisms. Many commonly used drugs including analgesics such as
morphine and lidocaine, and antibiotics such as penicillin were discovered from terrestrial
plants.1,3
Marine organisms were discovered as an additional source of biologically active natural
products over 60 years ago.4 These studies were limited, however, due to difficulty in accessing
the majority of marine environments. Interest began to rapidly increase as technological
advances allowed access to numerous deep sea species including marine bacteria, bryozoans,
ascidians, and sponges, which were found to contain biologically active natural products.4 Many
of these products have unique structural features, such as large rings and macrocyclic structures,
that have not been found within terrestrial organisms.5 Another advantage of marine natural
products is their potency. Marine organisms, especially invertebrates such as sponges, have little
mobility and have developed self-defenses in order to survive. They, or their microbiological

2
inhabitants, are able to synthesize and release very potent toxins that offer protection from
predators. Many of these toxins have been found to have activities that may have therapeutic
use.6
In 2004, the United States Food and Drug Administration (FDA) approved the first drug
derived from a marine source. Ziconotide (PrialtTM
), which was isolated from a cone snail, is a
peptide that is used for the treatment of chronic pain.3 Then, in 2007, the European Union
approved trabectedin (YondelisTM
) for use as an anti-cancer agent.3 It is currently estimated that
approximately 118 marine natural products are in preclinical trials and 22 are in clinical trials.7
1.2 ANTIMITOTIC NATURAL PRODUCTS
Marine environments have been found to be a rich source of natural products that display a wide
variety of biological activities. A large number of compounds, especially those isolated from
marine sponges, have been found to display antimitotic activity.3 The mechanism of this activity
includes the targeting of microtubules.3,8
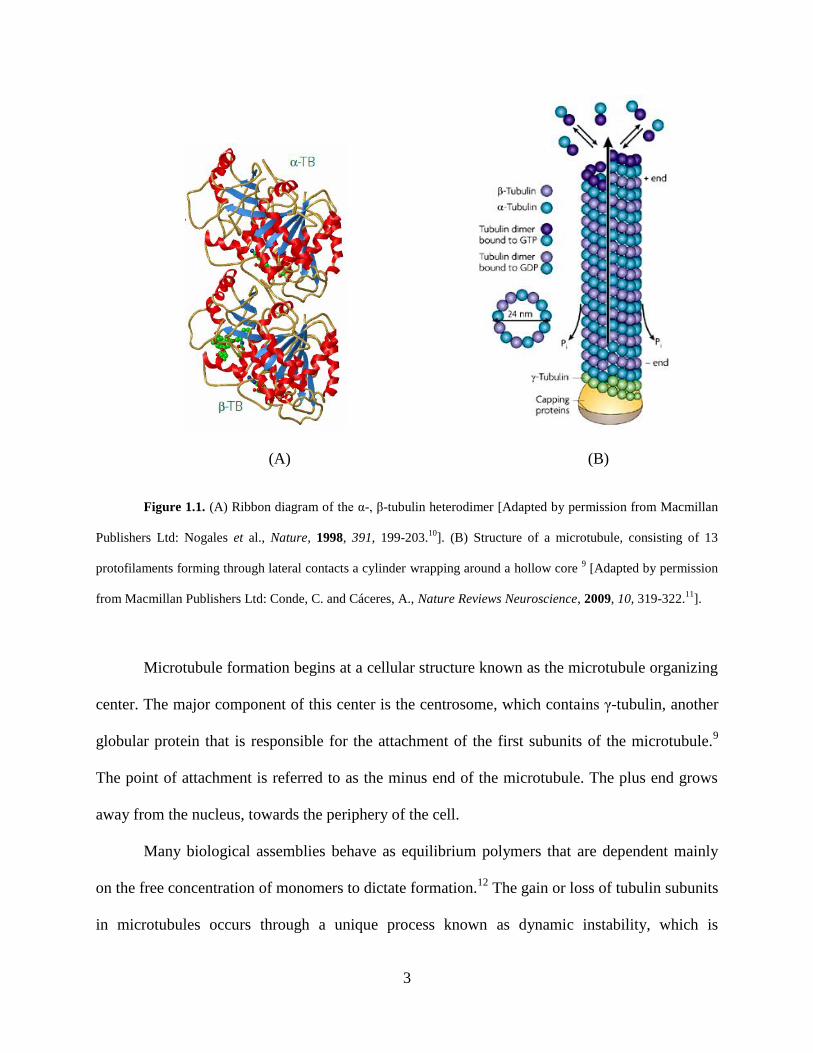
Microtubules are one of three types of biological polymers found in eukaryotic cells.9
The monomeric unit of microtubules is tubulin, which is a globular protein that consists of 12 α
helicies, a 4 strand β-sheet and a 6 strand β-sheet.10
Tubulin forms a heterodimer between α and
β tubulin (Figure 1.1). Each dimer links together, forming a chain known as a protofilament. On
average, 13 protofilaments attach due to lateral and longitudinal interactions to form a
microtubule with a hollow core.9
3
(A) (B)
Figure 1.1. (A) Ribbon diagram of the α-, β-tubulin heterodimer [Adapted by permission from Macmillan
Publishers Ltd: Nogales et al., Nature, 1998, 391, 199-203.10
]. (B) Structure of a microtubule, consisting of 13
protofilaments forming through lateral contacts a cylinder wrapping around a hollow core 9 [Adapted by permission
from Macmillan Publishers Ltd: Conde, C. and Cáceres, A., Nature Reviews Neuroscience, 2009, 10, 319-322.11
].
Microtubule formation begins at a cellular structure known as the microtubule organizing
center. The major component of this center is the centrosome, which contains γ-tubulin, another
globular protein that is responsible for the attachment of the first subunits of the microtubule.9
The point of attachment is referred to as the minus end of the microtubule. The plus end grows
away from the nucleus, towards the periphery of the cell.
Many biological assemblies behave as equilibrium polymers that are dependent mainly
on the free concentration of monomers to dictate formation.12
The gain or loss of tubulin subunits
in microtubules occurs through a unique process known as dynamic instability, which is
4
independent of the free tubulin concentration. Microtubules are constantly gaining and losing
tubulin subunits, and a single microtubule can even gain and lose tubulin simultaneously, a
process known as treadmilling.9,12
The ability to rapidly change from polymer growth to
shortening is crucial for the different cellular functions of microtubules and varies throughout the
cell cycle. This dynamicity is tightly controlled in many ways, which makes the formation of
microtubules unique and far different from equilibrium polymers. The regulation of microtubule
formation is not completely understood but it is thought to be majorly controlled by the
hydrolysis of guanosine triphosphate (GTP) which may be triggered by the binding of
microtubule associated proteins (MAPs).12, 13
Each tubulin heterodimer contains two nucleotide binding pockets, one within α-tubulin,
and one within β-tubulin. These pockets are able to bind one molecule of GTP, which is required
for tubulin polymerization. The GTP bound within α-tubulin is non-exchangeable; however, the
β-tubulin bound GTP is exchangeable and is thought to play a major role in microtubule
dynamics.9, 12
The addition of each tubulin dimer to a microtubule results in the hydrolysis of
GTP to GDP. The plus end of every microtubule consists of multiple exchanged GTP units,
known as the GTP cap. This cap maintains the straight conformation of the plus end, which is
needed in order for the addition of tubulin subunits.9, 12
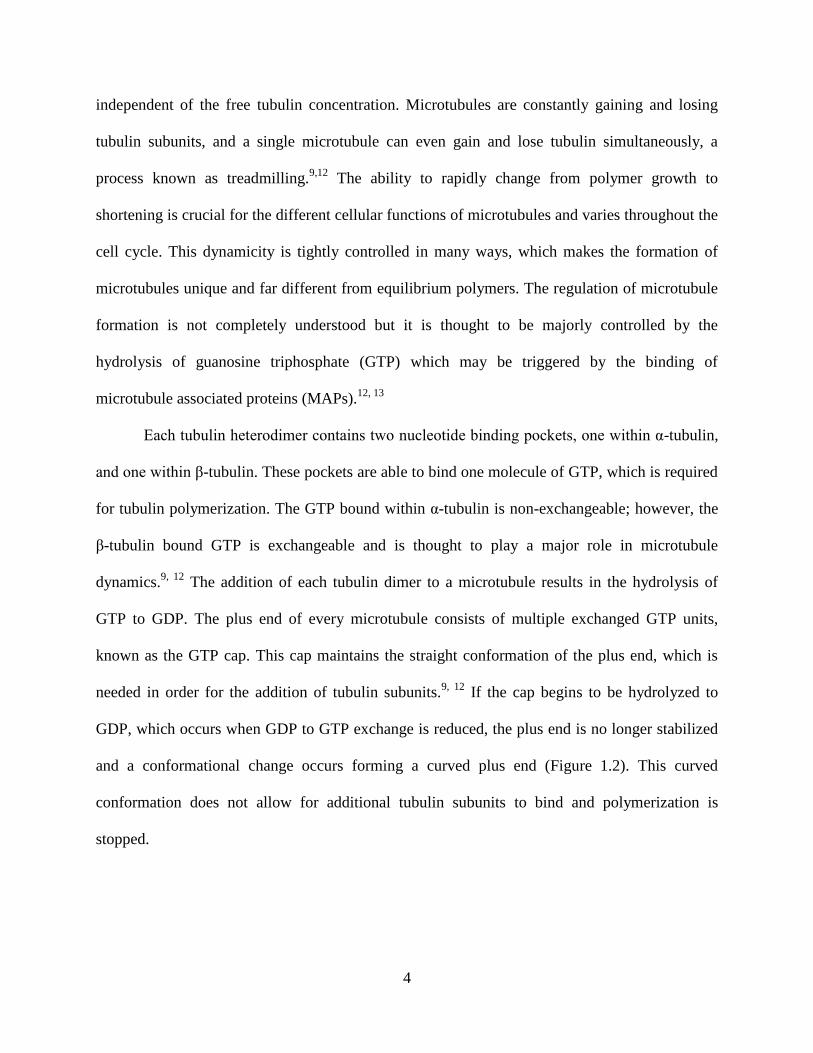
If the cap begins to be hydrolyzed to
GDP, which occurs when GDP to GTP exchange is reduced, the plus end is no longer stabilized
and a conformational change occurs forming a curved plus end (Figure 1.2). This curved
conformation does not allow for additional tubulin subunits to bind and polymerization is
stopped.
5
Figure 1.2. Straight and curved conformations of the plus end of microtubules [Adapted by permission
from Macmillan Publishers Ltd: Ravelli et al., Nature, 2004, 428, 198-202.14
].
It is not fully understood how GTP hydrolysis is triggered by the cell; however, it has
been suggested that microtubule dynamics could be controlled through the binding of MAPs
including MAP-1, MAP-2, MAP-4, tau, and even G-proteins.9, 12, 13, 15
G-Proteins are involved in
many cellular activities including extracellular signaling. Specifically, the α-subunit of G-
proteins has been found to cause a microtubule catastrophe, which is the transition from polymer
growth to disassembly.15
The mechanism of this inhibition has been investigated and it has been
proposed that the α-subunit can affect microtubule dynamics in two ways. First, the
exchangeable GTP bound within β-tubulin can bind to the G-protein, leaving the microtubule
without the necessary nucleotide. Second, the α-subunit can also activate the intrinsic GTPase
activity of tubulin that normally is only active after multiple tubulin heterodimers have been
incorporated into the polymer.15
The ability of the cell to control microtubule assembly and disassembly is essential for
cell survival. Microtubules have numerous cellular functions.9, 12
They are an important part of
the cytoskeleton and help to provide structural support.8 Many motor proteins, such as the
6
dyneins and the kinesins, are able to attach to microtubules and transport various components
throughout the cell.16
This had led to microtubules commonly being referred to as the ‘highway’
or ‘railway’ of the cell.9 Perhaps the most important function of microtubules, for the field of
cancer drug discovery, is their role in mitosis.8 During this process, genetic information stored in
chromosomes must be duplicated and transported to opposite ends of the cell before division
occurs. This is accomplished by the mitotic spindle, which is dependent on microtubules for
proper function.16
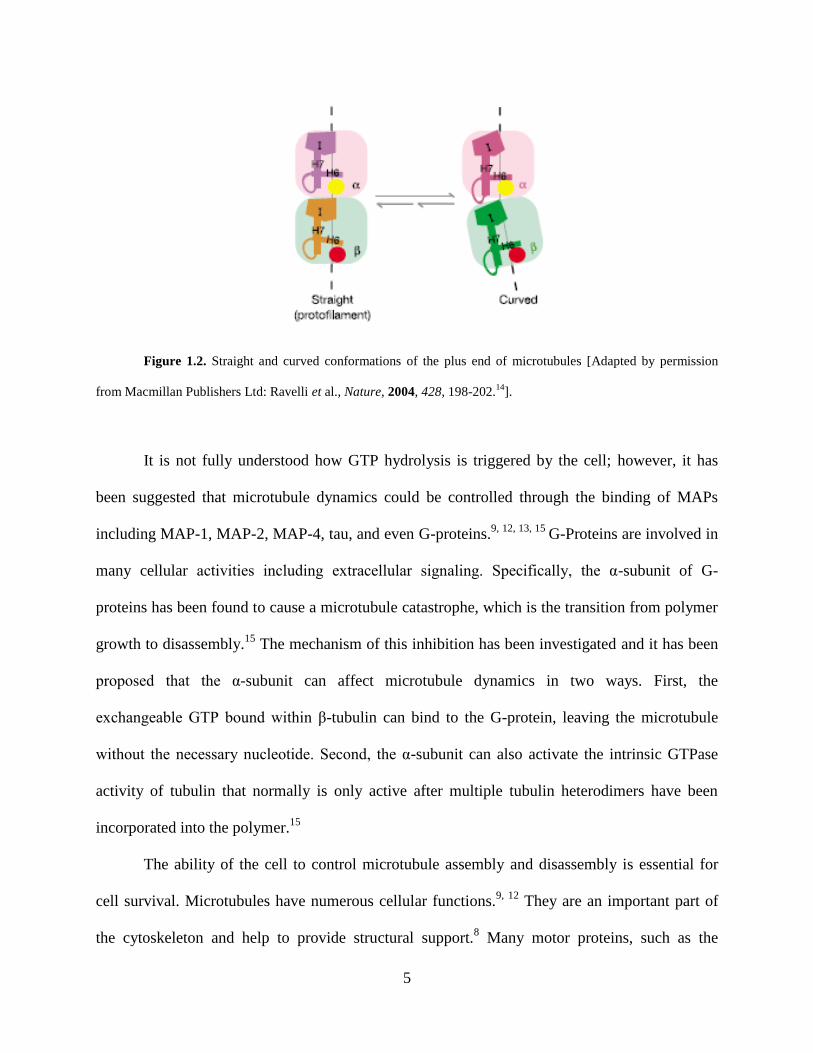
Prior to mitosis, the organization of microtubules drastically changes. The duplicated
chromosomes are also accompanied by a duplicated centrosome which will act as a second site
for microtubule formation.9 Therefore, currently formed microtubules need to disassemble to
allow for the mitotic spindle to be formed. The spindle consists of three types of microtubules,
kinetochore, polar, and astral microtubules. Kinetochore microtubules are attached to the
chromosomes and the centrosomes. Polar microtubules are attached to the centrosomes and grow
towards each other to form an overlapping structure. Astral microtubules are also attached to the
centrosomes, however they grow out into the periphery of the cell (Figure 1.3).9 These
microtubules are responsible for attaching the chromosomes to the spindle, stabilizing and
transporting the spindle through the cell, and ensuring that the chromosomes are in the correct
orientation for mitosis to occur.8, 16
A high rate of dynamic instability is crucial for the spindle to
function correctly; therefore, anything that can disrupt the dynamicity during this stage of the
cell cycle will prevent the formation of the mitotic spindle which will result in mitotic arrest and,
eventually, cell death.16

7
Figure 1.3. Reorganization of microtubules during mitosis [Adapted by permission from Macmillan
Publishers Ltd: Walczak et al., Nature Reviews Molecular Cell Biology, 2010, 11, 91-102.17
].
Small molecules that are able to interrupt the dynamicity of microtubules are often
referred to as microtubule perturbers or perturbagens. There are three major small molecule
binding sites on tubulin: the colchicine, vinca alkaloid, and taxol sites.13, 18, 19
Each site is named
after the major microtubule perturbagen that interacts with tubulin via this site.
Colchicine is a small molecule that was isolated from the plant, Colchicum autumnale
(Figure 1.4).20
The polymerization of purified tubulin is prevented in the presence of colchicine
in vitro, therefore it is considered a microtubule destabilizer. This inhibitory activity is due to
colchicine’s ability to bind to tubulin.14
The binding site is at the intradimer contact region,
located between α-1 and β-1 tubulin.
Colchicine preferentially binds to free tubulin subunits and not directly to the
microtubule. Once the colchicine-tubulin complex has formed, it can add to the plus end of the
microtubule. This bound complex can no longer remain in the straight protofilament
conformation, due to steric hinderance between colchicine and several amino acid residues of α-
tubulin.14
The loss of stability of the plus end prevents the addition of any tubulin subunits and
eventually results in disassembly. The inhibition of tubulin polymerization interrupts the
dynamic instability that is crucial for many cellular functions, especially mitosis. Colchicine-
8
exposed cells cannot properly form the mitotic spindle and the result is mitotic arrest and cell
death.14
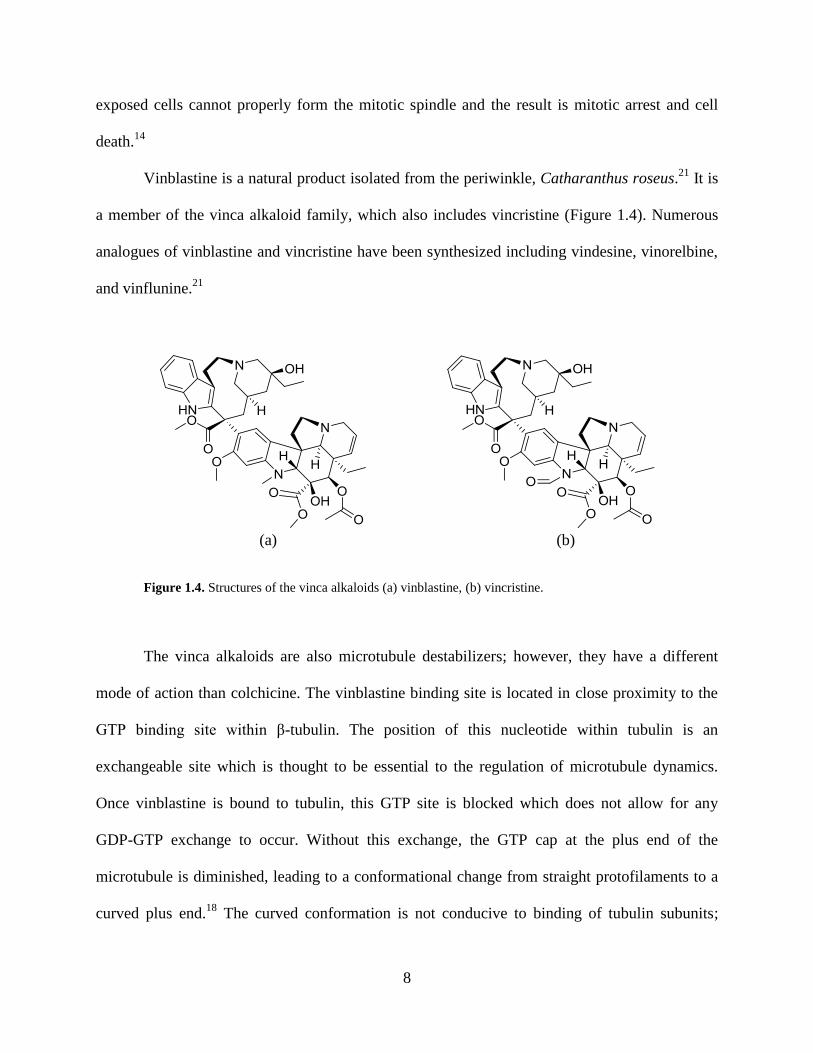
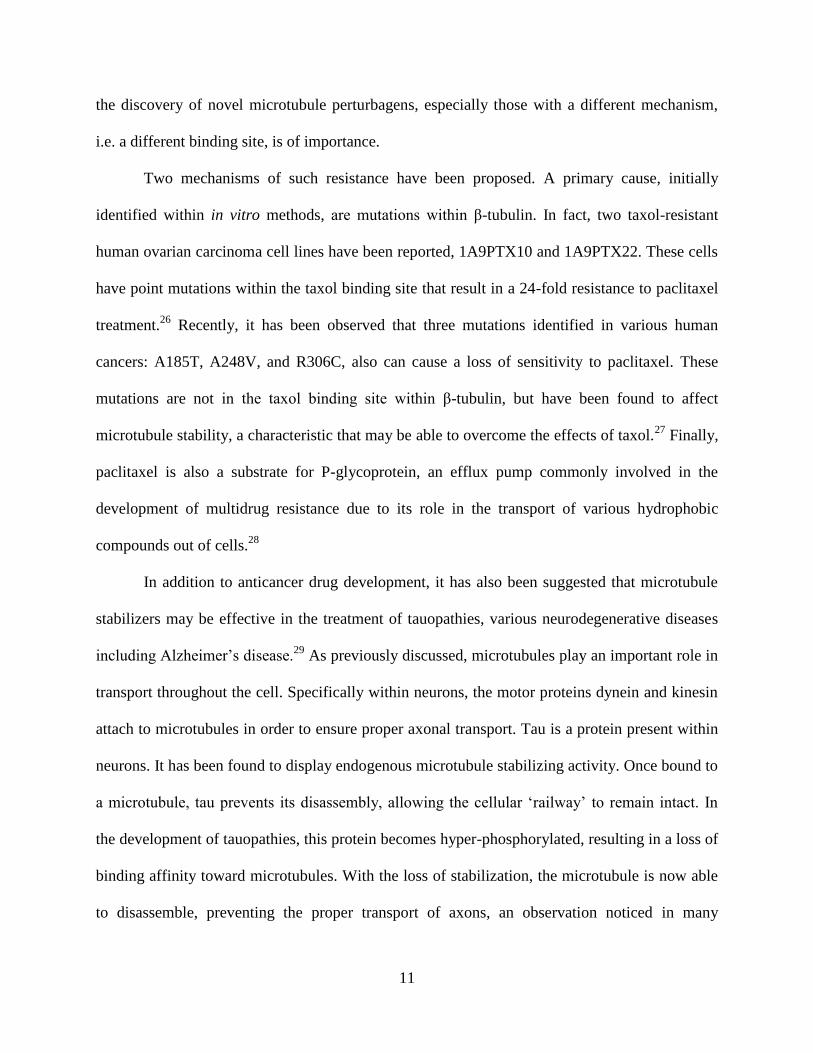
Vinblastine is a natural product isolated from the periwinkle, Catharanthus roseus.21
It is
a member of the vinca alkaloid family, which also includes vincristine (Figure 1.4). Numerous
analogues of vinblastine and vincristine have been synthesized including vindesine, vinorelbine,
and vinflunine.21
(a) (b)
Figure 1.4. Structures of the vinca alkaloids (a) vinblastine, (b) vincristine.
The vinca alkaloids are also microtubule destabilizers; however, they have a different
mode of action than colchicine. The vinblastine binding site is located in close proximity to the
GTP binding site within β-tubulin. The position of this nucleotide within tubulin is an
exchangeable site which is thought to be essential to the regulation of microtubule dynamics.
Once vinblastine is bound to tubulin, this GTP site is blocked which does not allow for any
GDP-GTP exchange to occur. Without this exchange, the GTP cap at the plus end of the
microtubule is diminished, leading to a conformational change from straight protofilaments to a
curved plus end.18
The curved conformation is not conducive to binding of tubulin subunits;
9
therefore, polymerization is ceased and disassembly will eventually occur. Another difference
from colchicine is that high concentrations of vinblastine cause alternate, non-functional
structures of microtubules to form.22
Paclitaxel (Taxol®) is a member of the taxanes, a group of natural products isolated
originally from the Pacific Yew tree, Taxus brevifolia.21
Until their discovery, the majority of
known microtubule perturbagens were destabilizers of tubulin polymerization. The taxanes are
however, able to disrupt microtubule dynamics through the stabilization of tubulin
protofilaments.19
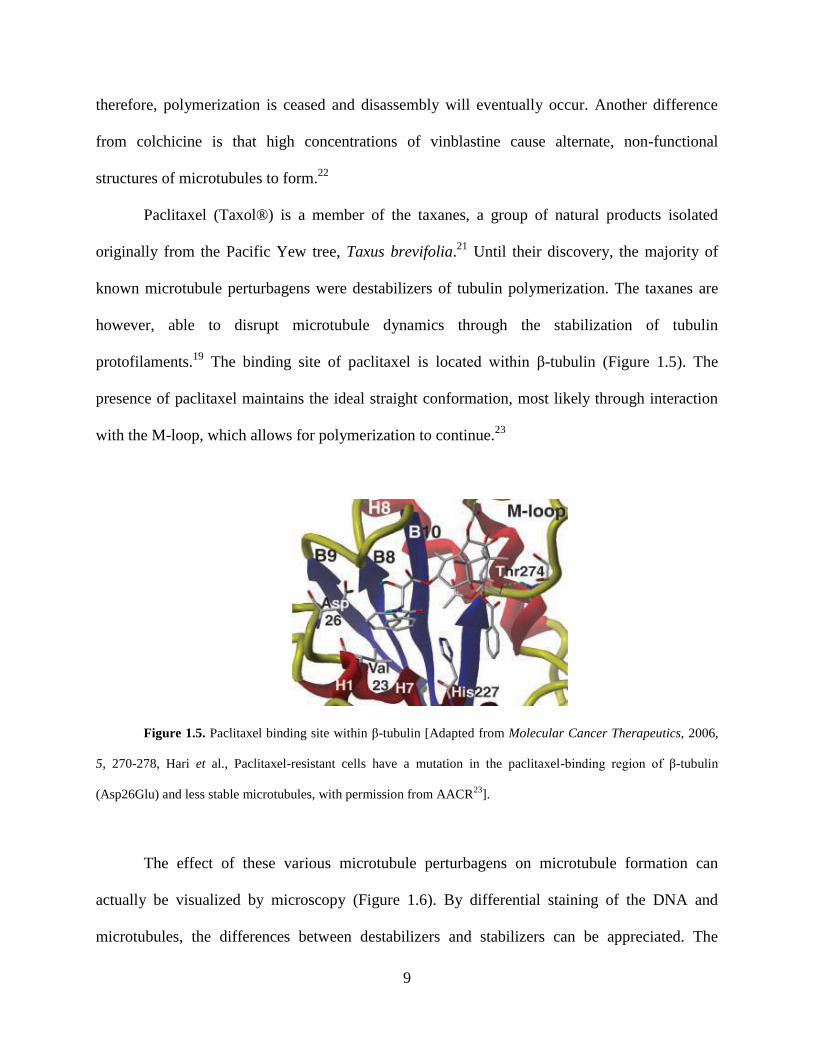
The binding site of paclitaxel is located within β-tubulin (Figure 1.5). The
presence of paclitaxel maintains the ideal straight conformation, most likely through interaction
with the M-loop, which allows for polymerization to continue.23
Figure 1.5. Paclitaxel binding site within β-tubulin [Adapted from Molecular Cancer Therapeutics, 2006,
5, 270-278, Hari et al., Paclitaxel-resistant cells have a mutation in the paclitaxel-binding region of β-tubulin
(Asp26Glu) and less stable microtubules, with permission from AACR23
].
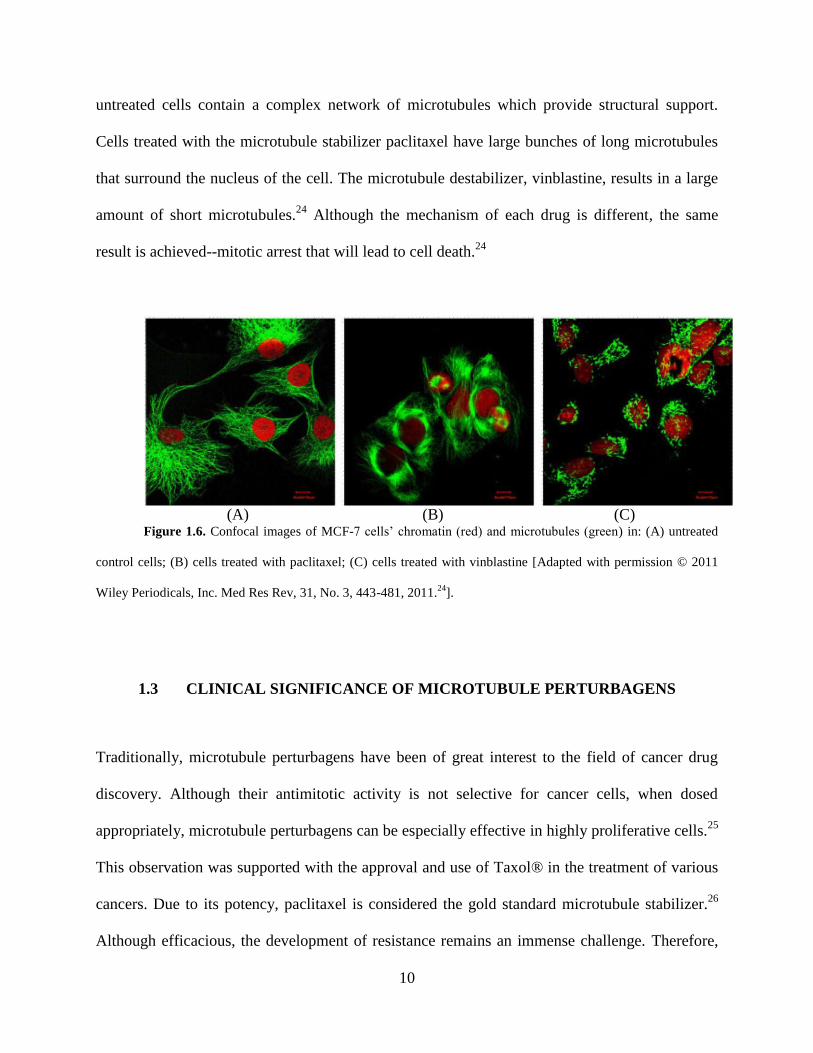
The effect of these various microtubule perturbagens on microtubule formation can
actually be visualized by microscopy (Figure 1.6). By differential staining of the DNA and
microtubules, the differences between destabilizers and stabilizers can be appreciated. The
10
untreated cells contain a complex network of microtubules which provide structural support.
Cells treated with the microtubule stabilizer paclitaxel have large bunches of long microtubules
that surround the nucleus of the cell. The microtubule destabilizer, vinblastine, results in a large
amount of short microtubules.24
Although the mechanism of each drug is different, the same
result is achieved--mitotic arrest that will lead to cell death.24
(A) (B) (C)
Figure 1.6. Confocal images of MCF-7 cells’ chromatin (red) and microtubules (green) in: (A) untreated
control cells; (B) cells treated with paclitaxel; (C) cells treated with vinblastine [Adapted with permission © 2011
Wiley Periodicals, Inc. Med Res Rev, 31, No. 3, 443-481, 2011.24
].
1.3 CLINICAL SIGNIFICANCE OF MICROTUBULE PERTURBAGENS
Traditionally, microtubule perturbagens have been of great interest to the field of cancer drug
discovery. Although their antimitotic activity is not selective for cancer cells, when dosed
appropriately, microtubule perturbagens can be especially effective in highly proliferative cells.25
This observation was supported with the approval and use of Taxol® in the treatment of various
cancers. Due to its potency, paclitaxel is considered the gold standard microtubule stabilizer.26
Although efficacious, the development of resistance remains an immense challenge. Therefore,
11
the discovery of novel microtubule perturbagens, especially those with a different mechanism,
i.e. a different binding site, is of importance.
Two mechanisms of such resistance have been proposed. A primary cause, initially
identified within in vitro methods, are mutations within β-tubulin. In fact, two taxol-resistant
human ovarian carcinoma cell lines have been reported, 1A9PTX10 and 1A9PTX22. These cells
have point mutations within the taxol binding site that result in a 24-fold resistance to paclitaxel
treatment.26
Recently, it has been observed that three mutations identified in various human
cancers: A185T, A248V, and R306C, also can cause a loss of sensitivity to paclitaxel. These
mutations are not in the taxol binding site within β-tubulin, but have been found to affect
microtubule stability, a characteristic that may be able to overcome the effects of taxol.27
Finally,
paclitaxel is also a substrate for P-glycoprotein, an efflux pump commonly involved in the
development of multidrug resistance due to its role in the transport of various hydrophobic
compounds out of cells.28
In addition to anticancer drug development, it has also been suggested that microtubule
stabilizers may be effective in the treatment of tauopathies, various neurodegenerative diseases
including Alzheimer’s disease.29
As previously discussed, microtubules play an important role in
transport throughout the cell. Specifically within neurons, the motor proteins dynein and kinesin
attach to microtubules in order to ensure proper axonal transport. Tau is a protein present within
neurons. It has been found to display endogenous microtubule stabilizing activity. Once bound to
a microtubule, tau prevents its disassembly, allowing the cellular ‘railway’ to remain intact. In
the development of tauopathies, this protein becomes hyper-phosphorylated, resulting in a loss of
binding affinity toward microtubules. With the loss of stabilization, the microtubule is now able
to disassemble, preventing the proper transport of axons, an observation noticed in many
12
neurodegenerative diseases.29
Therefore, treating with small molecule microtubule stabilizers
may be effective in overcoming the loss of the endogenous stabilization activity of tau. One of
the greatest challenges in testing this hypothesis is the identification of small molecules that are
able to cross the blood-brain barrier.29
1.4 CERATAMINES A AND B
Due to the success of microtubule perturbagens as anti-cancer agents, interest began to increase
in identifying new antimitotic natural products. To aid in this identification, high-throughput cell
based assays have been developed.30
Such assays involve three different techniques to identify
anti-mitotic activity. These techniques include visualization by microscopy, enzyme-linked
immunosorbent assay (ELISA), and enzyme-linked immunocytochemistry (ELICA). The use of
ELISA requires an antibody-antigen interaction that is specific for the activity of interest and will
promote a measureable response. The monoclonal antibody TG-3 can be used due to its
specificity for mitotic cells.30
This antibody only reacts with phosphorylated nucleolin, which is
formed upon mitosis. After the antigens and antibodies are allowed to react, an antibody which is
conjugated to horseradish peroxidase (HRP) can be added which will result in a measureable
colorimetric response upon the addition of a proper HRP substrate.30
The ELICA assay was developed based on the same principles as ELISA. Instead of
preparing titer plates with fixed antibodies, the cells can be fixed to the plate. This can allow for
the TG-3 monoclonal antibody and HRP-conjugated antibody to be added at the same time. The
ELICA assay involves a simpler procedure which contains fewer steps due to the minimized
number of washes needed when using fixed cells instead of mixed antibodies.30
13
The high throughput anti-mitotic assay was used to screen 24,000 extracts of different
species ranging from marine invertebrates to terrestrial plants. A total of 119 extracts were found
to contain antimitotically active natural products.30
One of these extracts was obtained from the
marine sponge Pseudoceratina sp. recovered in Papua, New Guinea.31
Bioassay-guided
fractionation was used to isolate the specific natural products which are responsible for the
desired antimitotic activity. This process involves fractionating the crude extract using a
separation technique such as high performance liquid chromatography (HPLC). Each fraction is
tested for the desired activity and the purity of the active fractions is tested by techniques such as
liquid chromatography-mass spectrometry (LC-MS). Once a pure natural product has been
isolated, structure elucidation is achieved using many spectroscopic techniques such as fourier
transform infrared (FTIR), UV/Vis, and nuclear magnetic resonance (NMR) spectroscopy.32
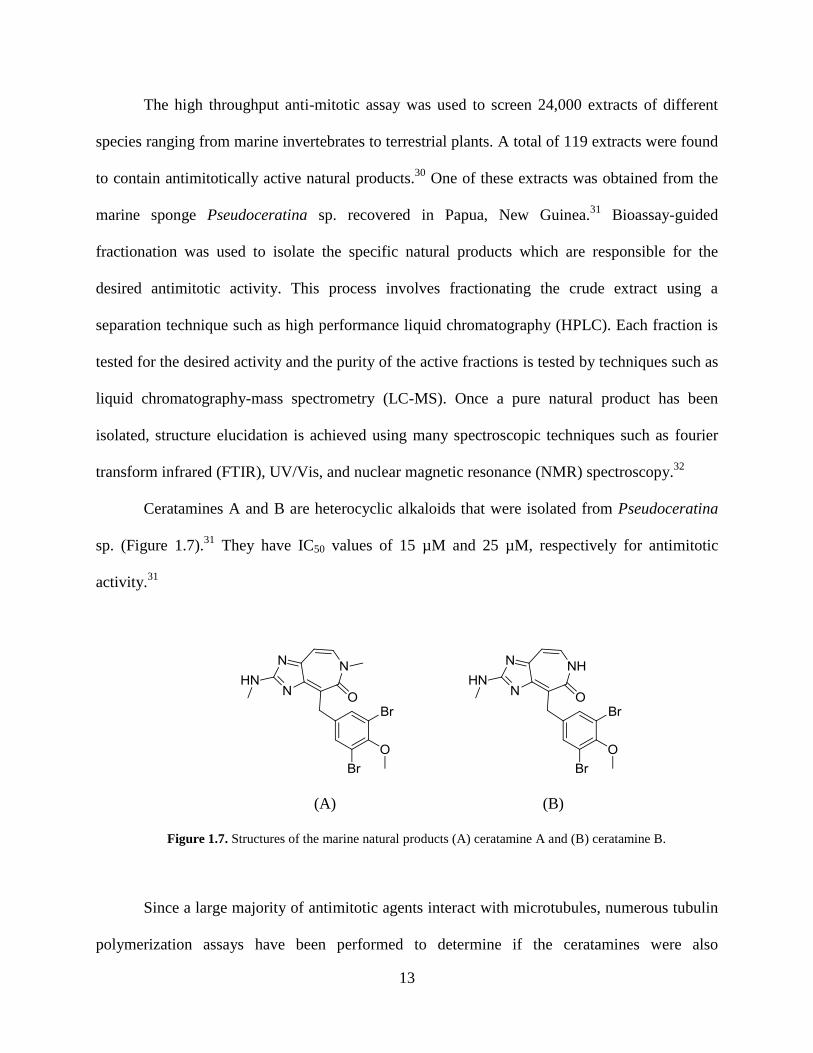
Ceratamines A and B are heterocyclic alkaloids that were isolated from Pseudoceratina
sp. (Figure 1.7).31
They have IC50 values of 15 µM and 25 µM, respectively for antimitotic
activity.31
(A) (B)
Figure 1.7. Structures of the marine natural products (A) ceratamine A and (B) ceratamine B.
Since a large majority of antimitotic agents interact with microtubules, numerous tubulin
polymerization assays have been performed to determine if the ceratamines were also
14
microtubule perturbers.31, 33
The potential of the ceratamines to inhibit tubulin polymerization
was tested by incubating 3 mg/mL of purified bovine tubulin with 100 µM of ceratamine A or B.
GTP was also included in the reaction mixture. The temperature was increased from 0 to 37°C
where, in the absence of an inhibitor, purified tubulin polymerizes in the presence of GTP.
Tubulin polymerization can be determined by monitoring the turbidity of the solution at 340 or
350 nm.34
No significant difference in the amount of tubulin polymerization was noticed between
the ceratamine reaction mixture and vehicle controls; therefore, the ceratamines are not inhibitors
of tubulin assembly.31
The ability of the ceratamines to stabilize microtubules was investigated by incubation
with 1 mg/mL of purified bovine tubulin. Polymerization occurred in the presence of either of
the ceratamines, suggesting their mechanism of antimitotic activity is by microtubule
stabilization since low concentrations of purified tubulin will not polymerize spontaneously.
Their ability to stabilize microtubules is less than that of paclitaxel.31
Cells treated with ceratamine A were unable to properly form the mitotic spindle,
therefore chromosome segregation was not achieved (Figure 1.8).33
The stabilization of
microtubule formation causes a disruption in the dynamicity of microtubules that prevents the
proper formation and function of the mitotic spindle, leading to mitotic arrest.33

15
(A) (B)
Figure 1.8. Effect of ceratamine A on chromatin in mitotic cells, (A) untreated cells showing chromosomes
congressed to the mitotic plate (upper left) and proper anaphase showing evenly segregating chromosomes (lower
right), and (B) cell treated with 20 µM ceratamine A showing uncongressed and punctuate chromatin [Adapted
from Cancer Research, 2005, 65, 3040-3043, Karjala et al., Ceratamines, Structurally Simple Microtubule-
Stabilizing Antimitotic Agents with Unusual Cellular Effects, with permission from AACR33
].
Although the ceratamines are not as potent as paclitaxel, which has an IC50 of 1.5 nM
within the antimitotic assay, the discovery of this novel class of microtubule stabilizers is due to
their significant structural differences compared to all known microtubule perturbagens.31, 33
Although they contain an atypical imidazoazepinone moiety, they are structurally simple,
allowing for efficient total synthesis.35
They are also the only known microtubule perturbagens
that are achiral.
The exact microtubule/tubulin binding site of the ceratamines has not been identified, but
it has been determined through a competitive binding assay that they do not bind at the same site
as paclitaxel.33
The uniqueness of their structures and the lack of competition for the paclitaxel
binding site also gives the ceratamines great potential as anticancer agents, particularly for
possible use in combination therapies to overcome the development of drug resistance, a major
limitation of Taxol® treatment. Although the ability of the ceratamines to cross the blood-brain

16
barrier has not been reported, due to their simple structures, they may be ideal candidates to test
the hypothesis that microtubules may be effective in the treatment of tauopathies.
1.5 PROJECT GOALS
The primary focus of all reported studies on the ceratamines has been on establishing biological
activity.31, 33
This project represents the first pre-clinical studies of this novel class of
microtubule stabilizers. The specific emphasis is on performing certain pharmacokinetic studies,
in order to begin to understand the effect the human body will have on these potential drugs. In
particular, the phase I metabolism of each compound has been investigated.
My first goals is to identify the phase I metabolites of each of the ceratamines formed by
rat and human in vitro enzyme systems. This involves comparing the overall metabolic profile
including the number of total metabolites formed, the structures of each metabolite, and their
relative abundances. Second, I want to determine the stability of each compound within rat and
human in vitro enzyme systems. My final goal is to determine which drug metabolizing enzymes
are involved in the formation of the major phase I metabolites of ceratamine B in a human in
vitro enzyme system.
17
1.6 METABOLISM
1.6.1 Introduction to xenobiotic metabolism
Xenobiotic (e.g. drug) metabolism is a complex enzymatic process with the purpose of
eliminating exogenous species from the body.36- 38
This goal is obtained by chemically modifying
the substance to decrease lipophilicity, resulting in easier excretion.36, 37
There are numerous types of metabolic reactions which are typically divided into two
phases. Phase I metabolism involves simple functional changes resulting from oxidation, such as
hydroxylations, demethylations, reductions, and hydrolysis.37, 39
If the polarity of a xenobiotic
can be significantly increased by the addition or removal of a simple functional group, then
phase I metabolism will be sufficient. If these simple changes will not ease renal excretion, then
the purpose of phase I is to create a reactive site that will allow phase II reactions to occur.40
Phase I reactions are majorly catalyzed by a superfamily of enzymes known as
cytochromes P450.36-39
The majority of P450s are found within the liver; however, metabolism
can occur in various locations throughout the body including the kidney, lungs, and blood.38
Specifically, P450s are attached to the inside membrane of the smooth endoplasmic reticulum.
The lipophilicity of this environment attracts most drugs, allowing for efficient transport to
P450s.37
P450s are of extreme importance as they are responsible for more than 75% of xenobiotic
metabolism.37, 40
There are 57 different human P450s, which are divided into 18 families and
further divided into subfamilies. These divisions are based on the homology of their sequences.
P450s belonging to the same family have 40% similarity, subfamilies have 55% similarity, and
an individual isoform from the same subfamily will only differ by 3%.37
Only 15 P450s are
18
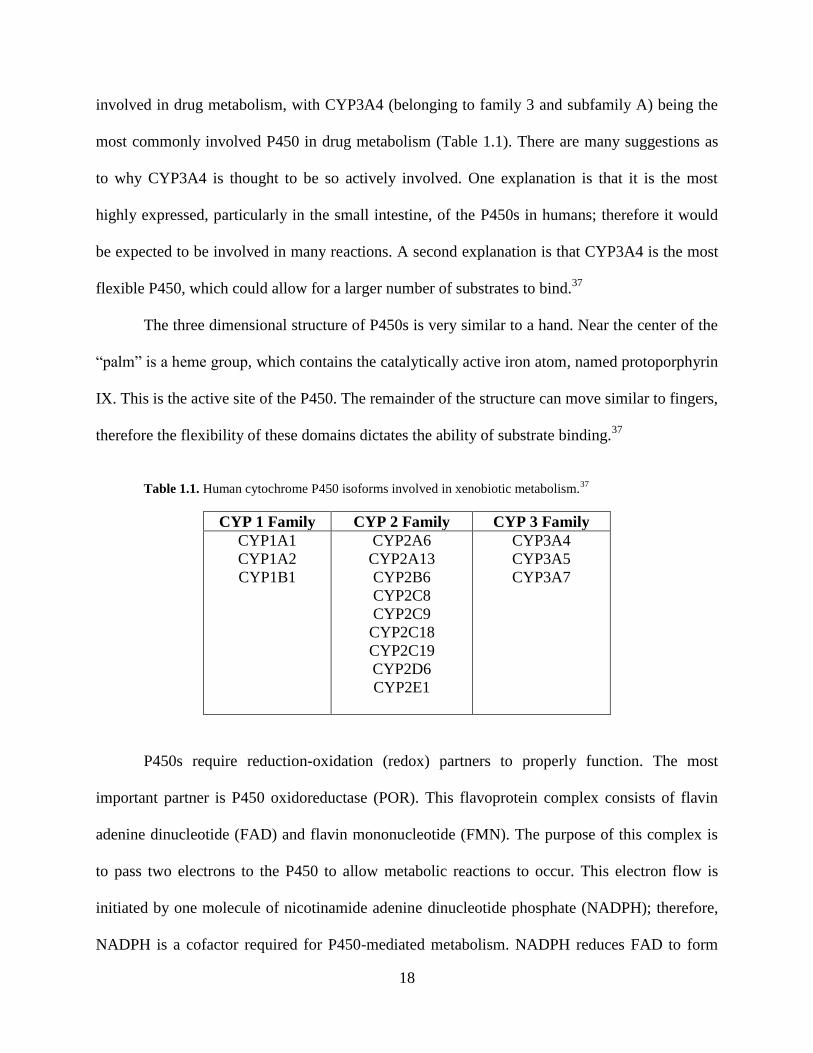
involved in drug metabolism, with CYP3A4 (belonging to family 3 and subfamily A) being the
most commonly involved P450 in drug metabolism (Table 1.1). There are many suggestions as
to why CYP3A4 is thought to be so actively involved. One explanation is that it is the most
highly expressed, particularly in the small intestine, of the P450s in humans; therefore it would
be expected to be involved in many reactions. A second explanation is that CYP3A4 is the most
flexible P450, which could allow for a larger number of substrates to bind.37
The three dimensional structure of P450s is very similar to a hand. Near the center of the
“palm” is a heme group, which contains the catalytically active iron atom, named protoporphyrin
IX. This is the active site of the P450. The remainder of the structure can move similar to fingers,
therefore the flexibility of these domains dictates the ability of substrate binding.37
Table 1.1. Human cytochrome P450 isoforms involved in xenobiotic metabolism.
37
CYP 1 Family CYP 2 Family CYP 3 Family
CYP1A1
CYP1A2
CYP1B1
CYP2A6
CYP2A13
CYP2B6
CYP2C8
CYP2C9
CYP2C18
CYP2C19
CYP2D6
CYP2E1
CYP3A4
CYP3A5
CYP3A7
P450s require reduction-oxidation (redox) partners to properly function. The most
important partner is P450 oxidoreductase (POR). This flavoprotein complex consists of flavin
adenine dinucleotide (FAD) and flavin mononucleotide (FMN). The purpose of this complex is
to pass two electrons to the P450 to allow metabolic reactions to occur. This electron flow is
initiated by one molecule of nicotinamide adenine dinucleotide phosphate (NADPH); therefore,
NADPH is a cofactor required for P450-mediated metabolism. NADPH reduces FAD to form
19
FADH2. FADH2 reduces FMN to form FMNH2, which passes two electrons to the nearby P450.
Other redox partners have been identified, such as cytochrome b5; however, their function is not
fully understood.37
Cytochromes P450 mainly behave as monooxygenases; therefore, many P450-mediated
metabolites include an oxygen containing functional group such as an alcohol or epoxide.
Common phase I reactions include aromatic hydroxylations, N-dealkylations, O-dealkylations,
deaminations, and dehalogenations.37, 35
Phase II metabolism involves the formation of conjugates with molecules such as
glucuronic acid, sulfonates, glutathione, methyl groups, and amino acids. Again the purpose is to
increase the hydrophilicity of the xenobiotic. If a conjugate is required to achieve a desirable
polarity increase then it generally occurs after a phase I reaction, however it is possible for a
phase II reaction to occur initially.37-40
1.6.2 Metabolism studies in vitro
The tedious nature of the drug discovery process is essential to ensuring the availability of only
safe and effective drugs, however this results in a high attrition rate, leading to tremendous losses
in both time and expenses. Many drugs fail due to toxicity seen in clinical trials (humans) that
was not apparent during pre-clinical trials (animals).39
It is possible that some toxicity may be a
result of the formation of toxic metabolites; therefore, the addition of thorough pre-clinical
metabolism studies can be beneficial in identifying toxicity due to biotransformation. The
formation of a toxic metabolite can be avoided by slightly changing the structure of the lead
compound so that the toxic metabolic pathway cannot occur. This is much easier at this early
stage.39
20
The simple approach to begin to study the metabolism of a potential drug candidate is
through the use of in vitro methods. All in vitro reaction mixtures must contain an enzyme
system, appropriate cofactors to ensure activity, a proper buffering system, and the drug of
interest. Although more simple than in vivo animal models, the use of human cells or tissue
shows a higher in vitro-to-in vivo correlation within humans.41
This is desirable, because it
reduces the risk that a potential drug candidate will show unexpected toxicity within clinical
trials.
Enzyme system choice is dependent on the overall goal of the experiment. Factors to
consider include what phase of metabolism is the primary focus, the cellular location of the
enzymes of interest, the specific population to be studied (e.g., children), species of interest, etc.
Typically, in vitro studies begin with understanding the phase I metabolic reactions that occur,
which requires an enzyme system containing cytochromes P450. Liver microsomes, which are
obtained through differential centrifugation of homogenated liver tissue, are a rich source of
P450s.37, 41
Microsomes also contain uridine diphosphoglucuronosyl transferase (UGT), a major
phase II enzyme that is responsible for the formation of glucuronyl conjugates. UGTs require
uridine diphosphoglucuronic acid (UDGPA) to function; therefore, if only phase I P450-
mediated processes are of interest, this can be controlled by only adding NADPH. Liver
microsomes are commercially available and are typically “pooled” samples, meaning they were
obtained from a large amount of donors, usually more than 20. Using pooled liver microsomes
allows for a reasonable estimation of metabolism across a population. The use of an individual
donor gives rise to the real risk that the results may be based on an abnormal metabolizer, either
sensitive or insensitive, and does not reflect the true average of a population. Also, specialty

21
pools are available if a specific population is of interest, such as gender-specific pools, age-
specific pools, or behavior-specific pools (smoker, etc.).41
The advantages of using liver microsomes include their commercial availability, their
stability (enzyme activity can last for years if stored at −80°C), and the simple sample
preparation. The major disadvantage of using microsomes is the incomplete metabolic profile
obtained. Microsomes are generally only useful for the study of phase I metabolism. The drug
has very easy access to P450s and there are no other enzymes competing for the substrate.
Although this system may have a lower in vitro-to-in vivo correlation in comparison to other
systems, it is a great starting point.41
Other enzyme systems can also be obtained using differential centrifugation of liver
tissues. These include the cytosol and S9 fractions. Although the major phase II metabolizing
enzyme, UGT, is found within the microsomal fraction, the majority of phase II enzymes are
located within the cytosol. These include N-acetyl transferase (NAT), glutathione S-transferase
(GST), thiopurine methyl transferase (TPMT), and sulfotransferase. Therefore, if understanding
and identifying conjugated phase II metabolites is desired, the most efficient system would be
the S9 fraction. This system contains both P450s (phase I) and the cytosolic phase II enzymes.41
In order to achieve higher in vitro-to-in vivo correlation, the use of human hepatocytes is
recommended. Hepatocytes are cells that can be isolated from the liver. Unlike microsomes or
other fractions collected by differential centrifugation, hepatocytes still contain active regulatory
pathways. This allows all phases of metabolism to occur and also is affected by influences such
as enzyme induction and the ability of the xenobiotic to enter the cell (since the membrane is still
intact). The major disadvantage of this system is the short lifetime of the hepatocytes.41

22
The highest correlation with in vivo metabolism can be obtained using precision cut liver
slices or in situ liver perfusion. These systems still contain drug transport pathways, enzyme
regulatory pathways, and cell-cell interactions. Although liver slices are the closest system to
actual human metabolism, they are only viable for 5 days after slicing.41
Besides the identification of phase I and phase II metabolites, in vitro systems can be
used to obtain other important information. This information includes simple species
comparisons, P450 isoform identification, P450 induction/inhibition prediction, and biological
activity and toxicity testing of metabolites.41, 42
Phase I species comparisons can be performed using different types of liver microsomes,
for example rat vs. human. This could help to predict the in vitro-to-in vivo correlation between
the metabolism in rats and humans. If the metabolic profile is similar between the two species,
then in vivo results obtained from rats may be beneficial in predicting what to expect during
clinical trials.
Identification of the specific P450 isoforms responsible for metabolite formation is very
important in predicting the risk of drug-drug interactions. If the drug is rapidly metabolized by
CYP3A4, then the consumption of another drug, which may be an inhibitor or inducer of
CYP3A4, will change the bioavailability of the original drug. The presence of an inducer could
result in a loss of efficacy, while an inhibitor may lead to an increase in toxicity. In vitro systems
can also be used to determine if the drug of interest itself acts as an inducer or inhibitor of a
certain P450 isoform.41
Finally, large scale in vitro metabolism reactions can be performed so as to allow for a
substantial amount of metabolite(s) to be isolated. These metabolites can be tested for potential
biological activities and toxicities. This can help to identify if the drug is acting as a pro-drug,

23
meaning it is metabolized to the active form, or if it is being negatively bioactivated, meaning it
is metabolized to a toxic form.41
Performing this evaluation at such an early stage in the drug
discovery process could allow for small structural changes to be implemented within the drug
that could increase activity or prevent a toxic metabolite from being formed. This could save
countless hours and dollars for the future.

24
2.0 EXPERIMENTAL
2.1 MATERIALS
Ceratamines A and B were prepared by total synthesis.35
Pooled Sprague-Dawley rat liver
microsomes (20 mg/mL protein content, 0.728 nmol P450/mg protein) and pooled human liver
microsomes (20 mg/mL protein content, 0.258 nmol P450/mg protein) were purchased from
Invitrogen (Grand Island, NY). Metoprolol tartrate, propranolol hydrochloride, verapamil
hydrochloride, β-nicotinamide adenine dinucleotide phosphate reduced tetra(cyclohexyl
ammonium) salt, and ammonium acetate were purchased from Sigma-Aldrich (St. Louis, MO).
Warfarin, Optima® LC/MS grade methanol, Optima® LC/MS grade water, Optima® LC/MS
grade acetonitrile, ketoconazole, and dimethyl sulfoxide were purchased from Fisher Scientific
(Pittsburgh, PA). Milli-Q H2O was purified by Millipore Academic Milli-Q Water Purification
System. CYP1A2, CYP2C8, CYP2C9, CYP2C18, CYP2C19, CYP2D6, CYP2E1, CYP3A4, and
CYP3A5 (Bactosomes) obtained from Escherichia coli expressed recombinant enzymes were
purchased from Xenotech (Lenexa, KS).
25
2.2 METHODS
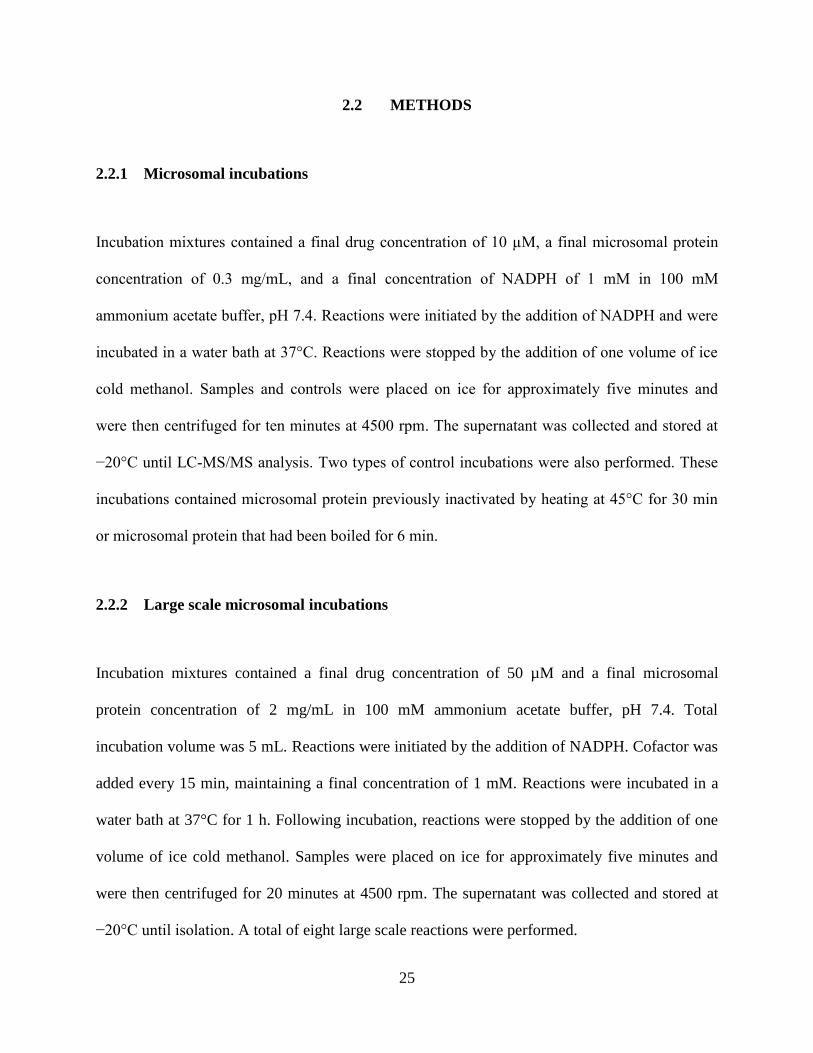
2.2.1 Microsomal incubations
Incubation mixtures contained a final drug concentration of 10 µM, a final microsomal protein
concentration of 0.3 mg/mL, and a final concentration of NADPH of 1 mM in 100 mM
ammonium acetate buffer, pH 7.4. Reactions were initiated by the addition of NADPH and were
incubated in a water bath at 37°C. Reactions were stopped by the addition of one volume of ice
cold methanol. Samples and controls were placed on ice for approximately five minutes and
were then centrifuged for ten minutes at 4500 rpm. The supernatant was collected and stored at
−20°C until LC-MS/MS analysis. Two types of control incubations were also performed. These
incubations contained microsomal protein previously inactivated by heating at 45°C for 30 min
or microsomal protein that had been boiled for 6 min.
2.2.2 Large scale microsomal incubations
Incubation mixtures contained a final drug concentration of 50 µM and a final microsomal
protein concentration of 2 mg/mL in 100 mM ammonium acetate buffer, pH 7.4. Total
incubation volume was 5 mL. Reactions were initiated by the addition of NADPH. Cofactor was
added every 15 min, maintaining a final concentration of 1 mM. Reactions were incubated in a
water bath at 37°C for 1 h. Following incubation, reactions were stopped by the addition of one
volume of ice cold methanol. Samples were placed on ice for approximately five minutes and
were then centrifuged for 20 minutes at 4500 rpm. The supernatant was collected and stored at
−20°C until isolation. A total of eight large scale reactions were performed.

26
2.2.3 Species comparison
Reaction mixtures contained final concentrations of 10 µM drug (ceratamine A or B), 0.3 mg/mL
rat or human liver microsomes, and 1 mM NADPH in 100 mM ammonium acetate, pH 7.4.
Controls were prepared using microsomes that were boiled for 6 min prior to incubation. Neat
standards were prepared in ammonium acetate buffer. Reactions were initiated upon the addition
of NADPH. Incubations were performed in a water bath at 37°C. Aliquots were removed at
various time points (0, 15, 30, 45, and 60 min). Reactions were terminated upon the addition of
one volume of ice cold MeOH. Following an approximately 5 min incubation on ice, reaction
mixtures were centrifuged for ten min at 4500 rpm. Supernatants were collected and stored at
−20°C until analysis. All samples and controls were performed in triplicate.
2.2.4 Metabolic stability assay
Reaction mixtures contained final concentrations of 1µM drug, 1 mg/mL (0.047 nmol P450/ mg
protein) rat liver microsomes or 0.047 nmol P450/mg protein human liver microsomes, and 1
mM NADPH in a 100 mM ammonium acetate buffer at pH 7.4. Controls were prepared with
microsomes that had been boiled for 6 min prior to incubation. Neat standards were prepared in
ammonium acetate buffer. Reactions were initiated upon the addition of NADPH. Incubations
were performed at 37°C for 30 min. Reactions were terminated by the addition of one volume of
ice cold methanol. Following a 5 min incubation on ice, samples were centrifuged for ten min at
4500 rpm. Supernatants were collected and stored at −20°C prior to LC-MS/MS analysis. All
samples and controls were performed in triplicate.

27
2.2.5 Incubations of ceratamine B with 1-aminobenzotriazole
Incubations were performed in a similar manner as previously described. Reaction mixtures
contained final concentrations of 10 µM ceratamine B, 0.047 nmol P450/mg protein human liver
microsomes in 100 mM ammonium acetate buffer, pH 7.4. A final concentration of 1 mM
NADPH was utilized, however two additions of co-factor were performed at t=0 and t=15 min.
For non-specific cytochromes P450 inhibition samples, 1-ABT (500 µM) was pre-incubated with
human liver microsomes for 15 min at 37°C prior to addition of ceratamine B. Samples without
any inhibitor were prepared for comparison. Boiled microsomes were used as a chemical
stability control.
2.2.6 Incubations of ceratamine B with recombinant P450 isoforms
Incubations were performed in a similar manner as previously described. Reaction mixtures
contained final concentrations of 10 µM ceratamine B and 1 mM NADPH in 100 mM
ammonium acetate buffer, pH 7.4. Recombinant P450 concentrations were chosen according to
the vendor. Reactions were initiated by the addition of NADPH. Following a 30 min incubation
at 37 °C, reactions were terminated with the addition of one volume of ice cold MeOH. Samples
were incubated on ice for approximately 5 min, centrifuged for 10 min at 4500 rpm, and stored at
−20 °C prior to analysis.
28
2.2.7 Incubations of ceratamine B with a small molecule inhibitor of P450 isoforms
Incubations were performed in a similar manner as previously described. Reaction mixtures
contained final concentrations of 10 µM ceratamine B, 1 µM ketoconazole, 0.047 nmol P450/mg
protein human liver microsomes in 100 mM ammonium acetate buffer, pH 7.4. A final
concentration of 1 mM NADPH was utilized, however two additions of co-factor were
performed at t=0 and t=15 min. Samples without any inhibitor were prepared for comparison.
Boiled microsomes were used as a chemical stability control.
2.3 ANALYSIS
2.3.1 HPLC-UV analysis
A Shimadzu Prominence HPLC coupled with a UV detector (Shimadzu Scientific Instruments,
Columbia, MD) was used to determine the metabolic profiles of the ceratamines in rat and
human liver microsomes and for P450 phenotyping of the major metabolites of ceratamine B.
Separations were achieved using a ThermoFisher Beta Basic C18 column (150 x 2.1 mm, 5 µm
particle diameter) (Fisher Scientific, Pittsburgh PA). Mobile phase A was H2O containing 0.1%
acetic acid. Mobile phase B was acetonitrile. A 25 µL injection volume was used for the species
comparison experiment, while a 50 µL injection volume was utilized for the inhibition studies.
The flow rate was 0.2 mL/min. UV analysis was performed using a wavelength of 350 nm.
Separation of ceratamine metabolites was achieved using the following mobile phase gradient: 3
min hold at 15% B, increase to 17% B over 1 min, 18 min hold at 17% B, increase to 27% B
29
over 1 min, 4 min hold at 27% B, increase to 35% B over 2 min, 11 min hold at 35% B, decrease
to 15% B over 2 min, 3 min hold at 15% B.
2.3.2 LC-MS/MS analysis
2.3.2.1 LC-triple quadrupole (QqQ) analysis
A Shimadzu Prominence HPLC equipped with a UV detector and coupled to an API 2000 triple
quadrupole mass spectrometer with a turboion spray source (Applied Biosystems/MDS Sciex,
Foster City, CA) was used to monitor metabolites of the ceratamines. Separations were achieved
using a ThermoFisher C18 column (150 x 2.1 mm, 5 µM particle diameter). Mobile phase A was
H2O containing 0.1% acetic acid. Mobile phase B was CH3CN.
The mobile phase gradient used for the separation of ceratamine A metabolites was as
follows: 3 min hold at 15% CH3CN, increase to 19% CH3CN over 1 min, 7 min hold at 19%
CH3CN, increase to 27% CH3CN over 2 min, 2 min hold at 27% CH3CN, increase to 33%
CH3CN over 1 min, 10 min hold at 33% CH3CN, decrease to 15% CH3CN over 2 min, 7 min
hold at 15% CH3CN.
The mobile phase gradient used for the separation of ceratamine B metabolites was as
follows: 1 min hold at 15% CH3CN, increase to 50% CH3CN over 3 min, 2 min hold at 50%
CH3CN, decrease to 15% CH3CN over 2 min, 2 min hold at 15% CH3CN.
Ideal MS parameters were determined by infusion of each compound. For metabolites of
ceratamine A: IonSpray voltage was 5500 V, source temperature was 425 °C, declustering
potential was 80 V, and focusing potential was 400 V. A collision energy of 50 (arbitrary units)
was used for all metabolites of ceratamine A.
For metabolites of ceratamine B: IonSpray voltage was 5300 V, source temperature was

30
425 °C, declustering potential was 26 V, and focusing potential was 370 V. A collision energy
of 37 (arbitrary units) was used for all metabolites of ceratamine B.
For the metabolic stability assay, MS parameters were optimized via infusion of each
control compound. An isocratic mobile phase gradient of 50% mobile phase B. Tables 2.1-2.4
displays the optimized parameters for each compound.
Table 2.1. MS-MS source parameters used for the analysis of the ceratamines and the metabolic stability
control compounds. Optimal conditions were determined by infusion.
Compound [M+H]
+
(m/z)
Product
Ion
(m/z)
Source
Temperature
(°C)
IonSpray
Voltage
(V)
Ceratamine A 468.896 203.1 425 5300
468.896 161.9 425 5300
Ceratamine B 454.852 189.0 425 5300
454.852 134.1 425 5300
Metoprolol 268.168 116.0 425 5300
268.168 74.0 425 5300
Nicardipine 480.036 315.0 425 4500
480.036 91.0 425 4500
Propranolol 260.1 116.2 425 5300
260.1 183.2 425 5300
Verapamil 455.238 165.0 400 5300
455.238 150.1 400 5300
Warfarin 309.059 163.2 425 5300
309.059 250.9 425 5300

31
Table 2.2. Additional MS-MS source parameters used for the analysis of the ceratamines and the metabolic
stability control compounds. Optimal conditions were determined by infusion.
Compound
Nebulizer
Gas
(psi)
Turbo
Heater Gas
(psi)
Curtain
Gas
(psi)
Ceratamine A 40 10 20
40 10 20
Ceratamine B 40 10 30
40 10 30
Metoprolol 30 10 25
30 10 25
Nicardipine 40 10 20
40 10 20
Propranolol 40 10 30
40 10 30
Verapamil 30 10 10
30 10 10
Warfarin 30 10 10
30 10 10
32
Table 2.3. MS-MS compound parameters used for the analysis of the ceratamines and the metabolic
stability control compounds. Optimal conditions were determined by infusion.
Compound [M+H]
+
(m/z)
Product
Ion
(m/z)
Declustering
Potential
(V)
Focusing
Potential
(V)
Ceratamine A 468.896 203.1 91 340
468.896 161.9 91 340
Ceratamine B 454.852 189.0 26 370
454.852 134.1 26 370
Metoprolol 268.168 116.0 21 370
268.168 74.0 21 370
Nicardipine 480.036 315.0 21 360
480.036 91.0 21 360
Propranolol 260.1 116.2 21 370
260.1 183.2 21 370
Verapamil 455.238 165.0 36 370
455.238 150.1 36 370
Warfarin 309.059 163.2 26 370
309.059 250.9 26 370

33
Table 2.4. Additional MS-MS compound parameters used for the analysis of the ceratamines and the
metabolic stability control compounds. Optimal conditions were determined by infusion.
Compound
Collision
Energy
(arbitrary
units)
Collision
Cell Exit
Potential
(V)
Entrance
Potential
(V)
Ceratamine A 37 8 4
45 6 4
Ceratamine B 37 6 5.5
67 2 5.5
Metoprolol 25 4 4.5
37 8 4.5
Nicardipine 29 16 12
79 10 12
Propranolol 25 4 4.5
27 6 4.5
Verapamil 33 8 7.5
49 6 7.5
Warfarin 19 6 6.5
23 6 6.5
A multiple reaction monitoring method was developed for ceratamine A. This method involved
monitoring the following seven transitions: 441→175, 441→189, 455→189, 455→203,
469→203, 471→189, and 483→203.

34
2.3.2.2 LC-quadrupole-time-of-flight (QqTOF) analysis
A Shimadzu Prominence LC equipped with a UV detector and coupled to a QSTAR Elite
QqTOF mass spectrometer with a turboion spray source (Applied Biosystems/MDS Sciex, Foster
City, CA) was used to identify all metabolites and obtain accurate mass data. Separations were
accomplished using a ThermoFisher C18 column (150 x 2.1 mm, 5 µM particle diameter).
Mobile phase A was H2O containing 0.1% acetic acid. Mobile phase B was CH3CN. A total flow
rate of 0.2 mL/min was used. Typical injection volumes were 25 µL, however 40 µL injections
were performed for accurate mass determinations of very minor metabolites. UV analysis was
performed using a wavelength of 350 nm.
The mobile phase gradient used for the separation of ceratamine A metabolites was as follows:
3 min hold at 15% CH3CN, increase to 17% CH3CN over 1 min, 18 min hold at 17% CH3CN,
increase to 27% CH3CN over 1 min, 4 min hold at 27% CH3CN, increase to 35% CH3CN over 2
min, 11 min hold at 35% CH3CN, decrease to 15% CH3CN over 2 min, 3 min hold at 15%
CH3CN.
The mobile phase gradient used for the separation of ceratamine B metabolites was as follows:
3 min hold at 15% CH3CN, increase to 25% CH3CN over 1 min, 5 min hold at 25% CH3CN,
increase to 35% CH3CN over 1 min, 11 min hold at 35% CH3CN, decrease to 15% CH3CN over
1 min, 3 min hold at 15% CH3CN.
Ideal MS parameters were determined by infusion of each compound. For metabolites of
ceratamine A: IonSpray voltage was 5300 V, source temperature was 450 °C, declustering
potential was 70 V, and focusing potential was 225 V. A collision energy of 30 (arbitrary units)
was used for CA-M3. A collision energy of 35 (arbitrary units) was used for all other metabolites
of ceratamine A.

35
For metabolites of ceratamine B: IonSpray voltage was 5300 V, source temperature was
425 °C, declustering potential was 70 V, and focusing potential was 300 V. A collision energy of
35 (arbitrary units) was used for all metabolites of ceratamine B.
Accurate mass determinations were performed using a QSTAR Elite QqTOF mass
spectrometer. The monoisotopic [M+H]+ ion signal from the corresponding parent compound
was used as an accurate mass calibrant (ceratamine A: 466.9713 Da; ceratamine B: 452.9556
Da).
2.3.3 UV/Vis analysis
UV/Vis spectra were collected using a Perkin Elmer Lambda 35 dual beam UV/Vis
spectrometer. Absorbance values were measured over a range of 200-700 nm. A slit width of 1
nm and a scan speed of 480 nm/min was utilized. Water was used as the background reference.
2.3.4 1H NMR analysis
1H NMR spectra were collected using a Brüker 600 MHz NMR equipped with a 5 mm
cryoprobe. DMSO-d6 was used as a solvent for all NMR analysis.

36
3.0 STRUCTURE ELUCIDATION OF PHASE I METABOLITES OF THE
MICROTUBULE PERTURBAGENS: CERATAMINES A AND B
3.1 PHASE I METABOLISM OF CERATAMINES A AND B IN RAT LIVER
MICROSOMES
To date there have been no reported studies on the pharmacokinetics of the ceratamines,
therefore the initial goal was to perform a qualitative study focused on identifying phase I
metabolites of each compound.43
Rat liver microsomes were chosen as they are a rich source of
cytochromes P450, a large family of enzymes that are heavily involved in drug metabolism.37
Metabolites of the ceratamines were found to be formed within 15 min of addition of the co-
factor NADPH. Several control incubations were performed using heat inactivated and boiled
microsomes to ensure the chemical stability of each compound. Species that were only detected
within an active enzyme system in the presence of NADPH and not in the chemical stability
controls were considered for structure elucidation.
Reversed phase HPLC was used to separate the newly formed metabolites, with UV
being the initial detection method. The chromatograms suggested the presence of at least seven
metabolites of ceratamine A and five metabolites of ceratamine B after 60 min of incubation
with rat liver microsomes (Figure 3.1).

37
Figure 3.1. RP HPLC-UV chromatograms of 60 min rat microsomal incubations of (A) ceratamine A and
(B) ceratamine B [Adapted with permission from Smith et al., Journal of Natural Products, 2014, 77, 1572-1578.43
Copyright (2014) American Chemical Society.].
3.2 PRELIMINARY STRUCTURE ELUCIDATION OF PHASE I METABOLITES
OF CERATAMINES A AND B
Initial structure elucidation was performed using tandem mass spectrometry.43
Although the
structures of the metabolites were unknown, the types of metabolic reactions were limited to
phase I due to the enzyme source and cofactor. Phase I metabolism typically involves simple
reactions, leaving the majority of the compound unchanged.37
Therefore, potential metabolites
should share similar MS characteristics with the parent drugs.
3.2.1 MS spectra of ceratamines A and B
The molecular ion, [M+H]+, of each of the ceratamines appeared as three ion signals with a 1:3:1
intensity ratio (Figure 3.2). This ratio corresponds with the presence of two bromine atoms and
also served as a useful marker for metabolite identification. Each compound was fragmented into
38
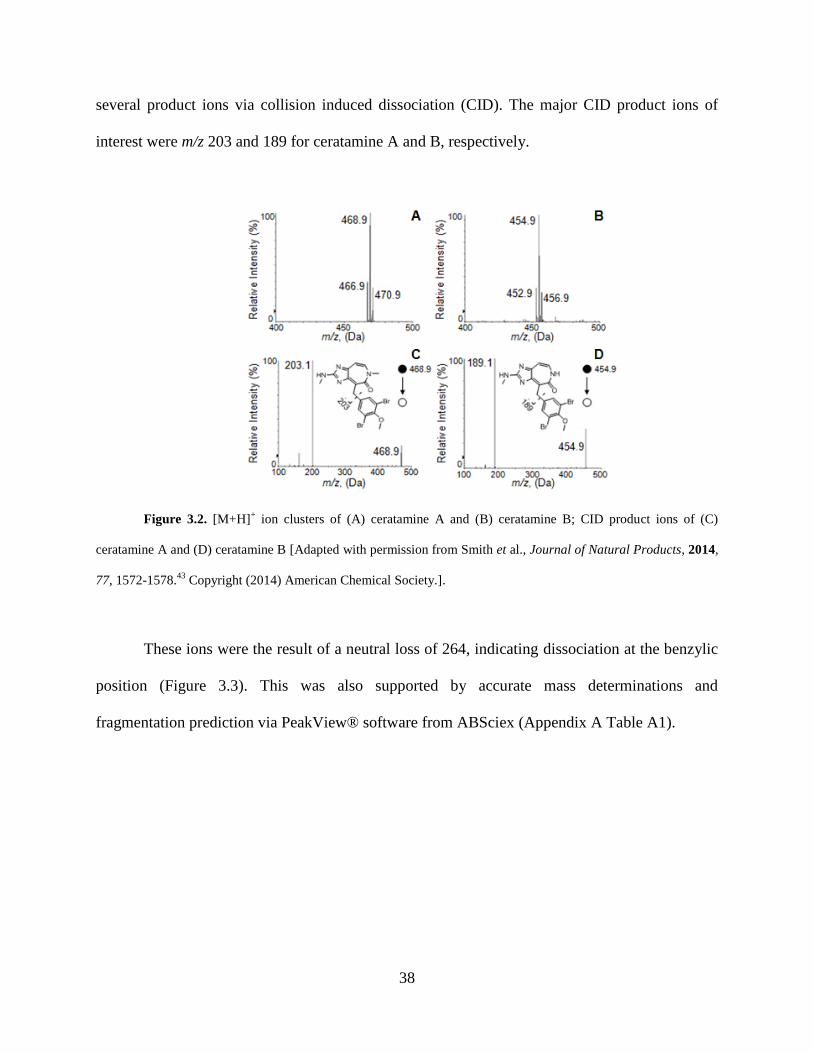
several product ions via collision induced dissociation (CID). The major CID product ions of
interest were m/z 203 and 189 for ceratamine A and B, respectively.
Figure 3.2. [M+H]+ ion clusters of (A) ceratamine A and (B) ceratamine B; CID product ions of (C)
ceratamine A and (D) ceratamine B [Adapted with permission from Smith et al., Journal of Natural Products, 2014,
77, 1572-1578.43
Copyright (2014) American Chemical Society.].
These ions were the result of a neutral loss of 264, indicating dissociation at the benzylic
position (Figure 3.3). This was also supported by accurate mass determinations and
fragmentation prediction via PeakView® software from ABSciex (Appendix A Table A1).

39
Figure 3.3. Neutral loss scans confirming the fragmentation of the ceratamines resulted in a loss of 263.88
Da; (A) ceratamine A, (B) ceratamine B [Adapted with permission from Smith et al., Journal of Natural Products,
2014, 77, 1572-1578.43
Copyright (2014) American Chemical Society.].
The presence of three ion signals with a 1:3:1 isotopic intensity ratio was used as a
marker for metabolites of the ceratamines. The difference in the m/z values of the molecular ions
was then utilized to determine the type of structural change. The location of the structural
change(s) was determined by comparing the major product ions of each metabolite to the parent
compound.
3.2.2 Metabolites of ceratamine B
Quadrupole-time-of-flight (QqTOF) mass spectrometry was used as the second method of
detection to identify metabolites. QqTOF instruments offer an increased sensitivity in full scan
mode due to an improved duty cycle. QqTOF-MS was used to identify the precursor and major
product ion of each metabolite. Five phase I metabolites were identified using both UV and
QqTOF-MS detection, having molecular ion differences of +2, −28, +16, and −14 Da from the
parent compound, ceratamine B. (Table 3.1).

40
Table 3.1. Chromatographic and mass spectrometric information of metabolites of ceratamine B used for
structure elucidation [Adapted with permission from Smith et al., Journal of Natural Products, 2014, 77, 1572-
1578.43
Copyright (2014) American Chemical Society.].
Analyte tr (min) [M+H]+ (m/z) Mass Difference from
ceratamine B [M+H]+
(m/z)
Major CID
product ion
(m/z)
M1 6.3 455, 457, 459 +2 175
M2 7.2 425, 427, 429 −28 175
M3 9.4 469, 471, 473 +16 189
M4 10.9 439, 441, 443 −14 189
M6 14.1 439, 441, 443 −14 189
Ceratamine B 18.9 453, 455, 457 -- 189
Metabolite 1 (M1). Metabolite 1 had a monoisotopic m/z of 455, which is a +2 Da difference
from ceratamine B (Figure 3.4). This molecular weight difference was noticed in the analysis of
ceratamine A and was determined to be consistent with a demethylation and monooxygenation.
The major CID product ion of m/z 175, indicated that the demethylation occurred within the
imidazoazepinone (Figure 3.4). The only likely site of dealkylation is at the aminoimidazole.
Fragmentation supports that the monooxygenation occurred on the aromatic ring, however the
specific site and type of reaction cannot be determined using tandem mass spectrometry.

41
Figure 3.4. (A) [M+H]+ ion cluster of M1, (B) CID product ions of M1 [Adapted with permission from
Smith et al., Journal of Natural Products, 2014, 77, 1572-1578.43
Copyright (2014) American Chemical Society.].
Metabolite 2 (M2). Metabolite 2 had a −28 Da molecular ion difference when compared with
ceratamine B. The monoisotopic m/z was 425, which is consistent with a double demethylation
(Figure 3.5). The major CID product ion had an m/z value of 175, indicating that one
demethylation occurred within the imidazoazepinone (Figure 3.5). M2 was determined to be the
result of a demethylation at the aminoimidazole and the methoxy.
Figure 3.5. (A) [M+H]+ ion cluster of M2, (B) CID product ions of M2 [Adapted with permission from
Smith et al., Journal of Natural Products, 2014, 77, 1572-1578.43
Copyright (2014) American Chemical Society.].

42
Metabolite 3 (M3). The third phase I metabolite of ceratamine B had a monoisotopic m/z of
469, which is a difference of +16 Da from the parent (Figure 3.6). This is consistent with a
monooxygenation. The major CID product ion of m/z 189 suggested that this structural change
occurred on the aromatic ring, although the site and type of reaction could not be determined
(Figure 3.6).
Figure 3.6. (A) [M+H]+ ion cluster of M3, (B) CID product ions of M3 [Adapted with permission from
Smith et al., Journal of Natural Products, 2014, 77, 1572-1578.43
Copyright (2014) American Chemical Society.].
Metabolites 4 and 6 (M4 and M6). The major metabolites of ceratamine B were isobaric
species with monoisotopic m/z values of 439 (Figure 3.7). They share a difference of −14 Da
from ceratamine B itself. This is consistent with a demethylation, which could occur at the
aminoimidazole or the methoxy. To determine this location, the major product ions were
compared with the parent. M4 fragmented to the same major CID product ion as ceratamine B,
m/z 189. This allowed for the conclusion that M4 was formed through demethylation at the
methoxy. M6 had a major CID product ion of m/z 175, which is a loss of 14 Da from that of
ceratamine B. M6 was determined to be the result of demethylation at the aminoimidazole.

43
Figure 3.7. [M+H]+ ion clusters of (A) M4 and (B) M6; CID product ions of (C) M4 and (D) M6 [Adapted
with permission from Smith et al., Journal of Natural Products, 2014, 77, 1572-1578.43
Copyright (2014) American
Chemical Society.].
3.2.3 Metabolites of ceratamine A
The only structural difference between the ceratamines is the presence of a methyl group at the
amide position. Since ceratamine A has an additional site for demethylation, it is expected to
have a similar, yet more complex metabolic profile. Although a total of eight phase I metabolites
were initially detected, there were only four differences in the m/z values of molecular ions
(Table 3.2). Therefore, many isobaric species were present which led to challenges in structure
elucidation.
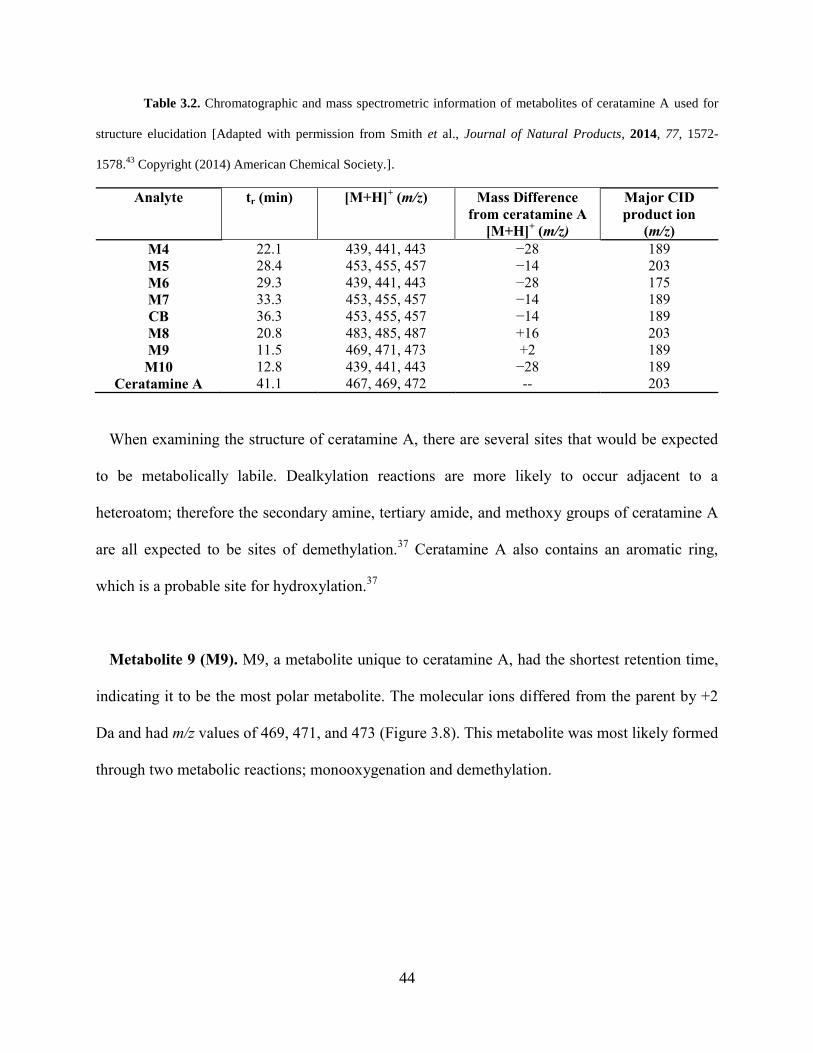
44
Table 3.2. Chromatographic and mass spectrometric information of metabolites of ceratamine A used for
structure elucidation [Adapted with permission from Smith et al., Journal of Natural Products, 2014, 77, 1572-
1578.43
Copyright (2014) American Chemical Society.].
Analyte tr (min) [M+H]+ (m/z) Mass Difference
from ceratamine A
[M+H]+ (m/z)
Major CID
product ion
(m/z)
M4 22.1 439, 441, 443 −28 189
M5 28.4 453, 455, 457 −14 203
M6 29.3 439, 441, 443 −28 175
M7 33.3 453, 455, 457 −14 189
CB 36.3 453, 455, 457 −14 189
M8 20.8 483, 485, 487 +16 203
M9 11.5 469, 471, 473 +2 189
M10 12.8 439, 441, 443 −28 189
Ceratamine A 41.1 467, 469, 472 -- 203
When examining the structure of ceratamine A, there are several sites that would be expected
to be metabolically labile. Dealkylation reactions are more likely to occur adjacent to a
heteroatom; therefore the secondary amine, tertiary amide, and methoxy groups of ceratamine A
are all expected to be sites of demethylation.37
Ceratamine A also contains an aromatic ring,
which is a probable site for hydroxylation.37
Metabolite 9 (M9). M9, a metabolite unique to ceratamine A, had the shortest retention time,
indicating it to be the most polar metabolite. The molecular ions differed from the parent by +2
Da and had m/z values of 469, 471, and 473 (Figure 3.8). This metabolite was most likely formed
through two metabolic reactions; monooxygenation and demethylation.
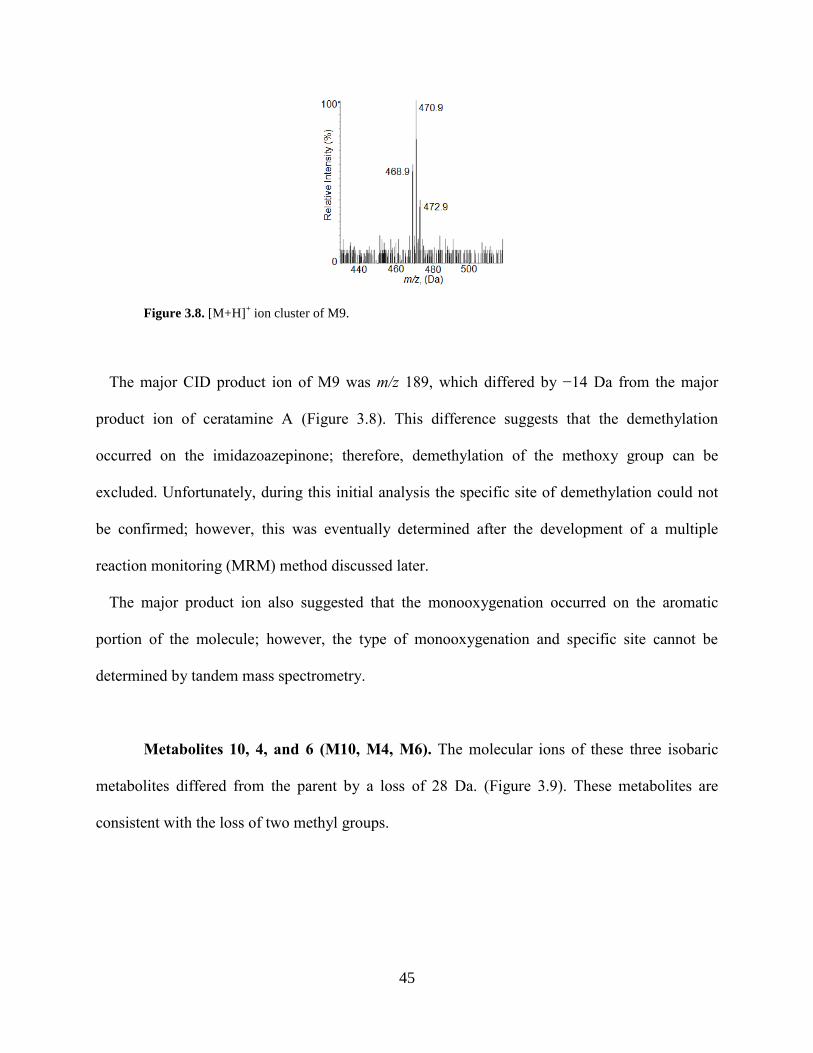
45
Figure 3.8. [M+H]+ ion cluster of M9.
The major CID product ion of M9 was m/z 189, which differed by −14 Da from the major
product ion of ceratamine A (Figure 3.8). This difference suggests that the demethylation
occurred on the imidazoazepinone; therefore, demethylation of the methoxy group can be
excluded. Unfortunately, during this initial analysis the specific site of demethylation could not
be confirmed; however, this was eventually determined after the development of a multiple
reaction monitoring (MRM) method discussed later.
The major product ion also suggested that the monooxygenation occurred on the aromatic
portion of the molecule; however, the type of monooxygenation and specific site cannot be
determined by tandem mass spectrometry.
Metabolites 10, 4, and 6 (M10, M4, M6). The molecular ions of these three isobaric
metabolites differed from the parent by a loss of 28 Da. (Figure 3.9). These metabolites are
consistent with the loss of two methyl groups.
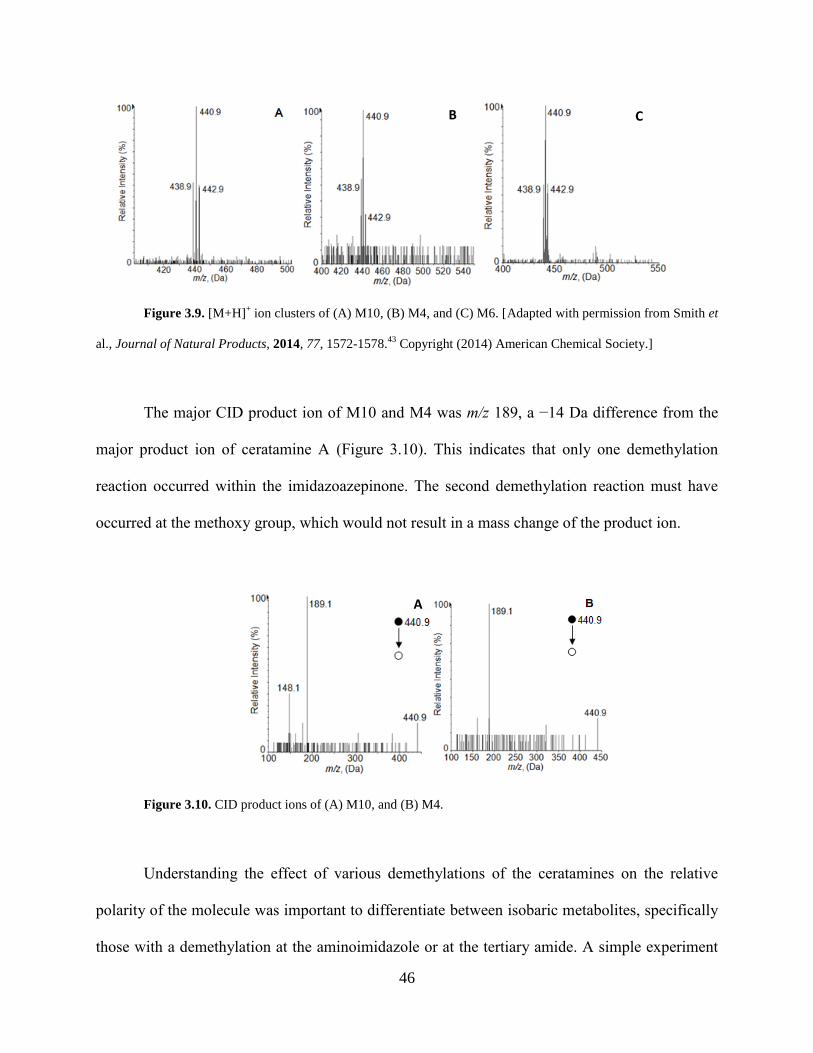
46
Figure 3.9. [M+H]+ ion clusters of (A) M10, (B) M4, and (C) M6. [Adapted with permission from Smith et
al., Journal of Natural Products, 2014, 77, 1572-1578.43
Copyright (2014) American Chemical Society.]
The major CID product ion of M10 and M4 was m/z 189, a −14 Da difference from the
major product ion of ceratamine A (Figure 3.10). This indicates that only one demethylation
reaction occurred within the imidazoazepinone. The second demethylation reaction must have
occurred at the methoxy group, which would not result in a mass change of the product ion.
Figure 3.10. CID product ions of (A) M10, and (B) M4.
Understanding the effect of various demethylations of the ceratamines on the relative
polarity of the molecule was important to differentiate between isobaric metabolites, specifically
those with a demethylation at the aminoimidazole or at the tertiary amide. A simple experiment
C B
A
B C
A

47
was performed that involved analyzing ceratamine B with the same chromatographic conditions
used to separate ceratamine A metabolites. This experiment revealed that a demethylation at the
aminoimidazole would result in a larger increase in polarity, therefore the elution order of
isobaric species can be used to differentiate between these sites of demethylation (Figure 3.11).
Figure 3.11. Comparison of retention times of ceratamine B to CB. (A) 60 min incubation of ceratamine B
with rat liver microsomes, (B) 10 µM standard of ceratamine B. This experiment revealed that a demethylation at
the aminoimidazole resulted in a shorter retention time and therefore a larger increase in polarity [Adapted with
permission from Smith et al., Journal of Natural Products, 2014, 77, 1572-1578.43
Copyright (2014) American
Chemical Society.].
M10 was the most polar of the three double demethylated metabolites, therefore it was
determined to be the result of demethylation at the aminoimidazole and the methoxy. M4
resulted from a demethylation at the tertiary amide and the methoxy. Finally, M6 had a major
CID product ion of m/z 175, which is consistent with demethylation at the aminoimidazole and
tertiary amide.
CB
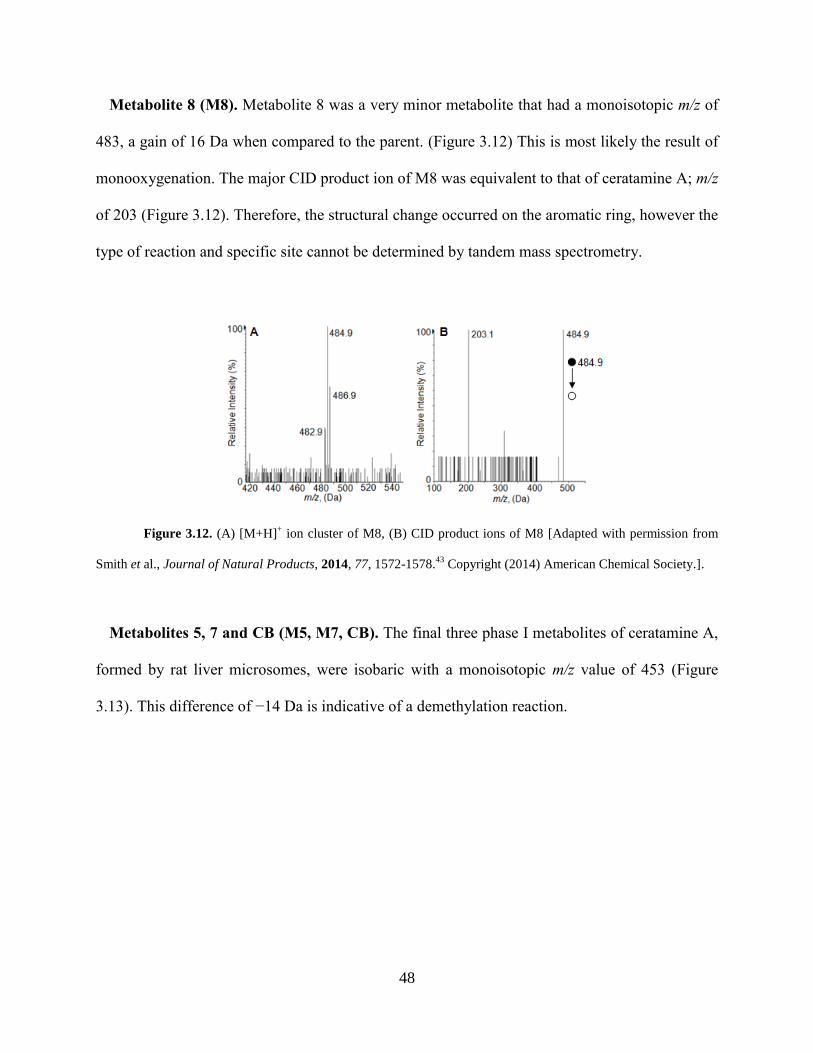
48
Metabolite 8 (M8). Metabolite 8 was a very minor metabolite that had a monoisotopic m/z of
483, a gain of 16 Da when compared to the parent. (Figure 3.12) This is most likely the result of
monooxygenation. The major CID product ion of M8 was equivalent to that of ceratamine A; m/z
of 203 (Figure 3.12). Therefore, the structural change occurred on the aromatic ring, however the
type of reaction and specific site cannot be determined by tandem mass spectrometry.
Figure 3.12. (A) [M+H]+ ion cluster of M8, (B) CID product ions of M8 [Adapted with permission from
Smith et al., Journal of Natural Products, 2014, 77, 1572-1578.43
Copyright (2014) American Chemical Society.].
Metabolites 5, 7 and CB (M5, M7, CB). The final three phase I metabolites of ceratamine A,
formed by rat liver microsomes, were isobaric with a monoisotopic m/z value of 453 (Figure
3.13). This difference of −14 Da is indicative of a demethylation reaction.
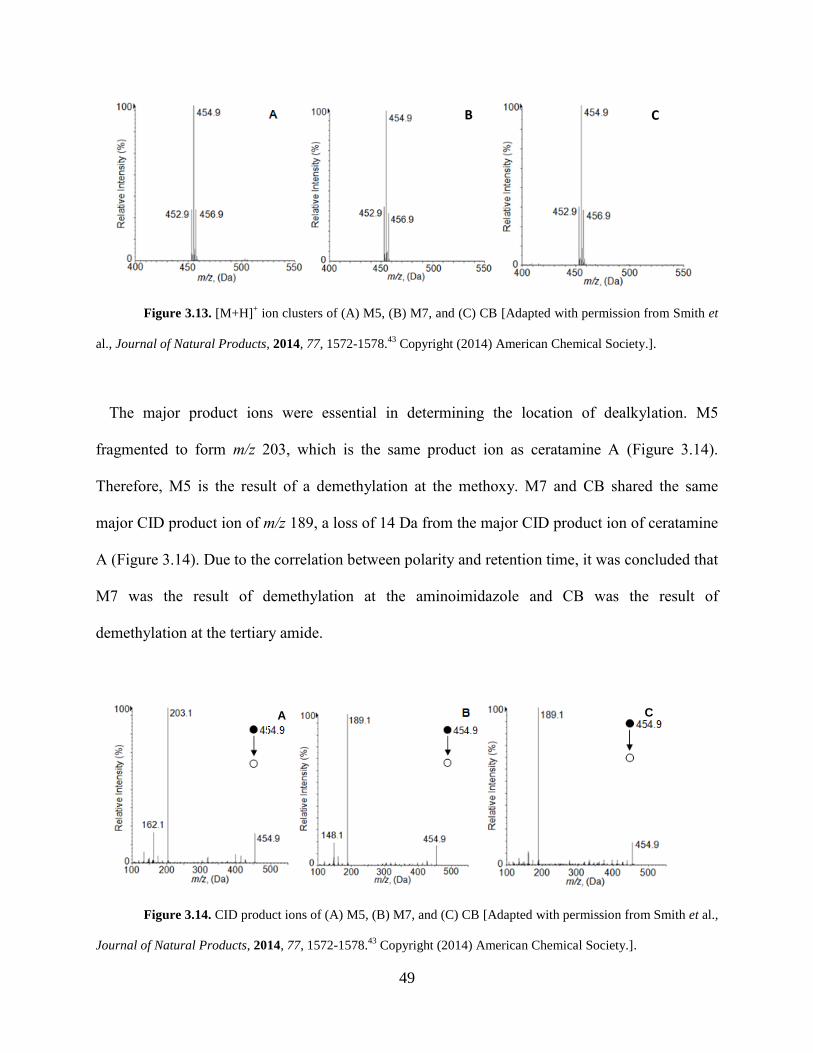
49
Figure 3.13. [M+H]+ ion clusters of (A) M5, (B) M7, and (C) CB [Adapted with permission from Smith et
al., Journal of Natural Products, 2014, 77, 1572-1578.43
Copyright (2014) American Chemical Society.].
The major product ions were essential in determining the location of dealkylation. M5
fragmented to form m/z 203, which is the same product ion as ceratamine A (Figure 3.14).
Therefore, M5 is the result of a demethylation at the methoxy. M7 and CB shared the same
major CID product ion of m/z 189, a loss of 14 Da from the major CID product ion of ceratamine
A (Figure 3.14). Due to the correlation between polarity and retention time, it was concluded that
M7 was the result of demethylation at the aminoimidazole and CB was the result of
demethylation at the tertiary amide.
Figure 3.14. CID product ions of (A) M5, (B) M7, and (C) CB [Adapted with permission from Smith et al.,
Journal of Natural Products, 2014, 77, 1572-1578.43
Copyright (2014) American Chemical Society.].
B C
A C
A C
B C

50
3.2.4 Multiple reaction monitoring (MRM) of metabolites of the ceratamines
As previously mentioned, structure elucidation was achieved by comparing molecular ions and
major product ions of each metabolite to the parent compounds. This analysis was performed
using a QqTOF-MS, which allows for a highly sensitive full scan due to an improved duty cycle.
After this information was obtained, a MRM method was developed for each compound and
their corresponding metabolites using a triple quadrupole tandem mass spectrometer.
Figure 3.15. MRM analysis of metabolites of Ceratamine A formed by rat liver microsomes. Incubation
time: 90 min.
An additional, very minor metabolite was identified for ceratamine A that was not
detected during initial analysis (Figure 3.15). M11 had a MRM transition identical with that of
M9 (471 → 189). The identification of this metabolite allowed the structure of both M9 and M11
to be deduced. Due to its slightly longer retention time, M11 is most likely the result of a
demethylation at the tertiary amide and monooxygenation along the aromatic ring; therefore, M9
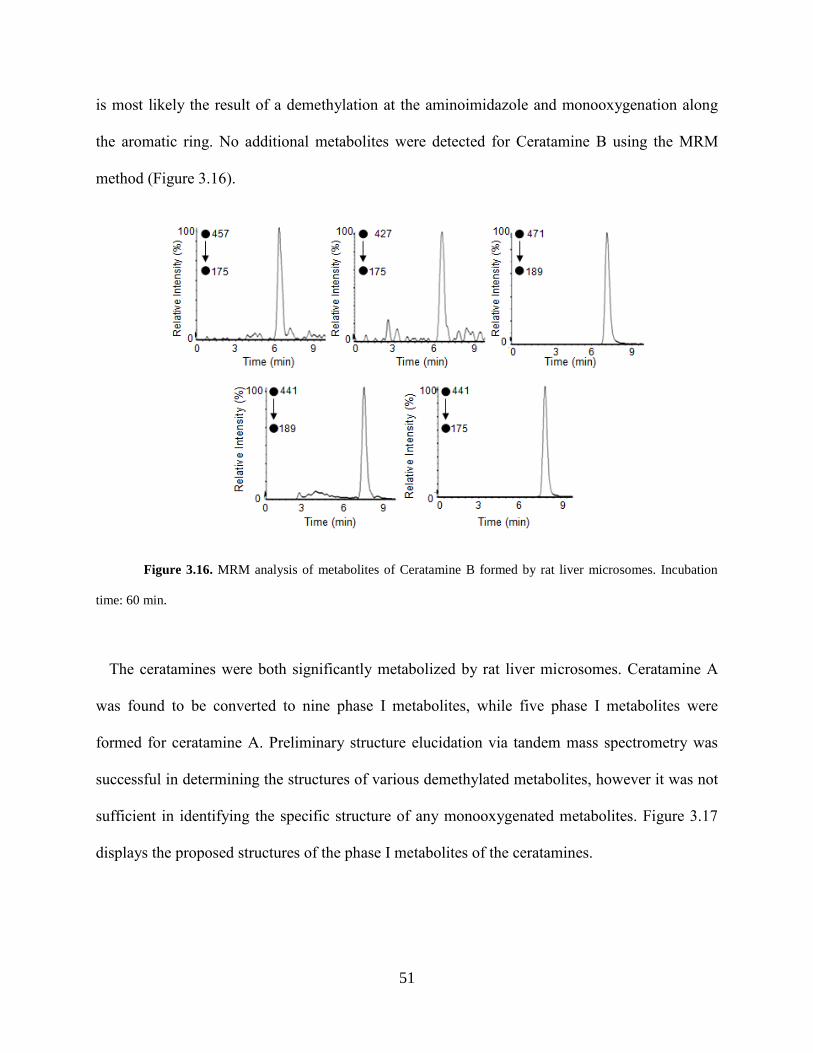
51
is most likely the result of a demethylation at the aminoimidazole and monooxygenation along
the aromatic ring. No additional metabolites were detected for Ceratamine B using the MRM
method (Figure 3.16).
Figure 3.16. MRM analysis of metabolites of Ceratamine B formed by rat liver microsomes. Incubation
time: 60 min.
The ceratamines were both significantly metabolized by rat liver microsomes. Ceratamine A
was found to be converted to nine phase I metabolites, while five phase I metabolites were
formed for ceratamine A. Preliminary structure elucidation via tandem mass spectrometry was
successful in determining the structures of various demethylated metabolites, however it was not
sufficient in identifying the specific structure of any monooxygenated metabolites. Figure 3.17
displays the proposed structures of the phase I metabolites of the ceratamines.

52
Figure 3.17. Proposed structures of the phase I metabolites of the ceratamines.
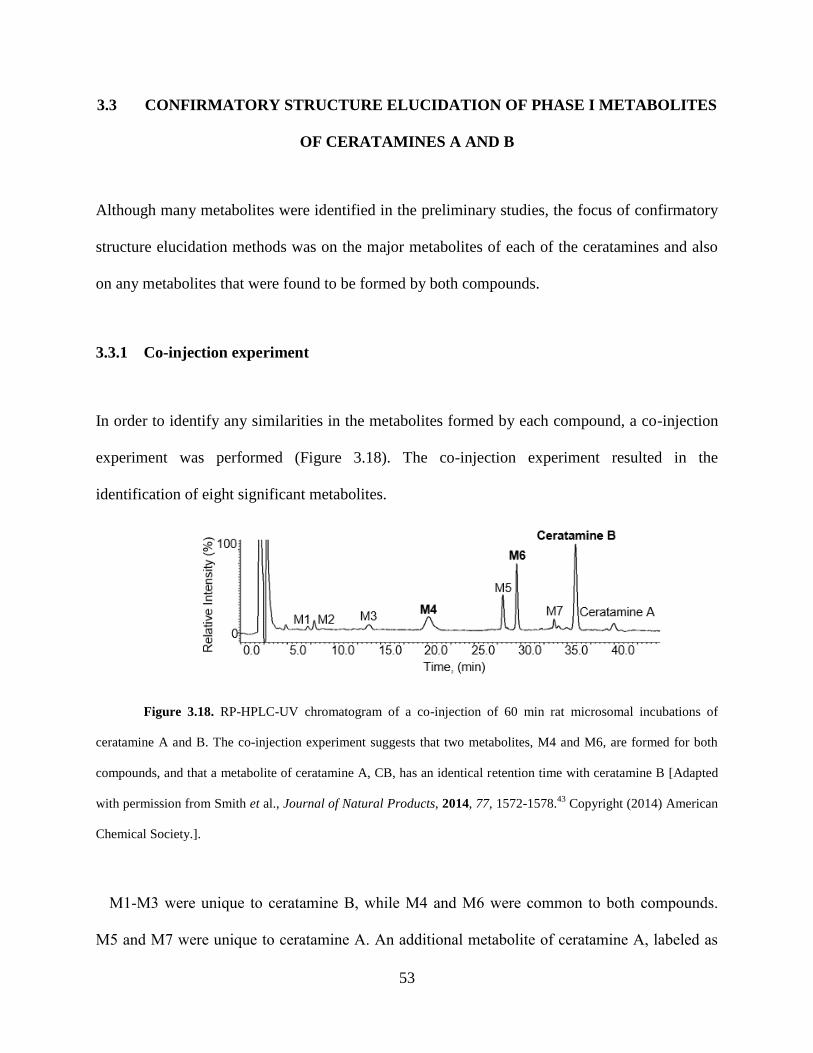
53
3.3 CONFIRMATORY STRUCTURE ELUCIDATION OF PHASE I METABOLITES
OF CERATAMINES A AND B
Although many metabolites were identified in the preliminary studies, the focus of confirmatory
structure elucidation methods was on the major metabolites of each of the ceratamines and also
on any metabolites that were found to be formed by both compounds.
3.3.1 Co-injection experiment
In order to identify any similarities in the metabolites formed by each compound, a co-injection
experiment was performed (Figure 3.18). The co-injection experiment resulted in the
identification of eight significant metabolites.
Figure 3.18. RP-HPLC-UV chromatogram of a co-injection of 60 min rat microsomal incubations of
ceratamine A and B. The co-injection experiment suggests that two metabolites, M4 and M6, are formed for both
compounds, and that a metabolite of ceratamine A, CB, has an identical retention time with ceratamine B [Adapted
with permission from Smith et al., Journal of Natural Products, 2014, 77, 1572-1578.43
Copyright (2014) American
Chemical Society.].
M1-M3 were unique to ceratamine B, while M4 and M6 were common to both compounds.
M5 and M7 were unique to ceratamine A. An additional metabolite of ceratamine A, labeled as
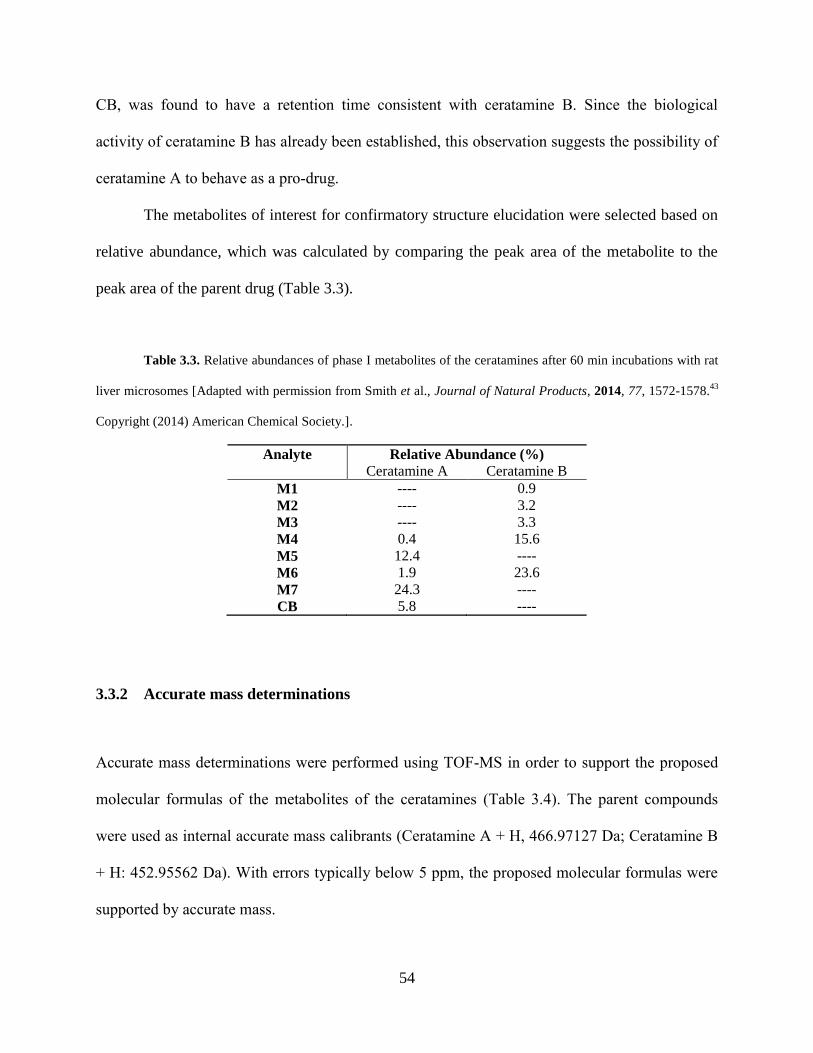
54
CB, was found to have a retention time consistent with ceratamine B. Since the biological
activity of ceratamine B has already been established, this observation suggests the possibility of
ceratamine A to behave as a pro-drug.
The metabolites of interest for confirmatory structure elucidation were selected based on
relative abundance, which was calculated by comparing the peak area of the metabolite to the
peak area of the parent drug (Table 3.3).
Table 3.3. Relative abundances of phase I metabolites of the ceratamines after 60 min incubations with rat
liver microsomes [Adapted with permission from Smith et al., Journal of Natural Products, 2014, 77, 1572-1578.43
Copyright (2014) American Chemical Society.].
Analyte Relative Abundance (%)
Ceratamine A Ceratamine B
M1 ---- 0.9
M2 ---- 3.2
M3 ---- 3.3
M4 0.4 15.6
M5 12.4 ----
M6 1.9 23.6
M7 24.3 ----
CB 5.8 ----
3.3.2 Accurate mass determinations
Accurate mass determinations were performed using TOF-MS in order to support the proposed
molecular formulas of the metabolites of the ceratamines (Table 3.4). The parent compounds
were used as internal accurate mass calibrants (Ceratamine A + H, 466.97127 Da; Ceratamine B
+ H: 452.95562 Da). With errors typically below 5 ppm, the proposed molecular formulas were
supported by accurate mass.

55
Table 3.4. Accurate mass determination results for proposed molecular formulas of metabolites of the
ceratamines [Adapted with permission from Smith et al., Journal of Natural Products, 2014, 77, 1572-1578.43
Copyright (2014) American Chemical Society.].
Analyte Proposed
Molecular
Formula
Experimentally
determined monoisotopic ion
signal
(m/z)
Theoretical
monoisotopic
mass (Da)
Error
(ppm)
M1 C15H12Br2N4O3 454.9357 454.9349 1.8
M2 C15H12Br2N4O3 424.9235 434.9243 1.9
M3 C16H14Br2N4O3 468.9486 468.9505 4.1
M4 C15H12Br2N4O2 438.9395 438.9400 1.1
M5 C16H14Br2N4O2 452.9570 452.9556 3.1
M6 C15H12Br2N4O2 438.9391 438.9400 2.0
M7 C16H14Br2N4O2 452.9533 452.9556 5.1
CB* C16H14Br2N4O2 452.9577 452.9556 4.6
*Source of ceratamine B was from an incubation of ceratamine A with rat liver microsomes.
3.3.3 Isolation of major metabolites of ceratamine B
In order to additionally support the proposed structures of the major metabolites of ceratamine B
formed by rat liver microsomes, a proper isolation method needed to be developed. Due to the
somewhat polar nature of the ceratamines, reversed phase HPLC was found to be an effective
method of separation. Therefore, semi-preparative HPLC was chosen for the isolation of
metabolites. Incubation conditions were also modified in order to increase the relative
abundances of each metabolite. Optimal conditions for the large scale incubations were
determined to be a drug concentration of 50 µM, a five-fold increase from the traditional method.
Microsomal protein concentration was increased to 2 mg/mL (0.094 nmol P450/mg protein). A
final concentration of 1 mM NADPH was still utilized, however cofactor was added after every
15 min to ensure an excess throughout the reaction. A 60 min incubation was performed with a
total volume of 5 mL. Figure 3.19 displays a chromatogram obtained using the optimized mobile
phase gradient for semi-preparative separation.

56
Figure 3.19. HPLC-UV chromatogram displaying optimized separation of metabolites of ceratamine B
using a semi-preparative column. Incubation Conditions: [Drug]: 50 µM, [Rat liver microsomes]: 2 mg/mL (0.094
nmol P450/mg protein), [NADPH]: 1 mM (added every 15 min), 100 mM ammonium acetate buffer pH 7.4,
incubated for 60 min at 37°C.
Semi-preparative separations require a significant increase in resolution as peak shape
will be significantly affected by an increase in concentration and injection volume. In order to
increase the efficiency of isolation, the effect of injection volume on peak shape and resolution
was investigated. Figure 3.20 shows an overlay of chromatograms obtained using three different
injection volumes: 50, 250, and 1000 µL.
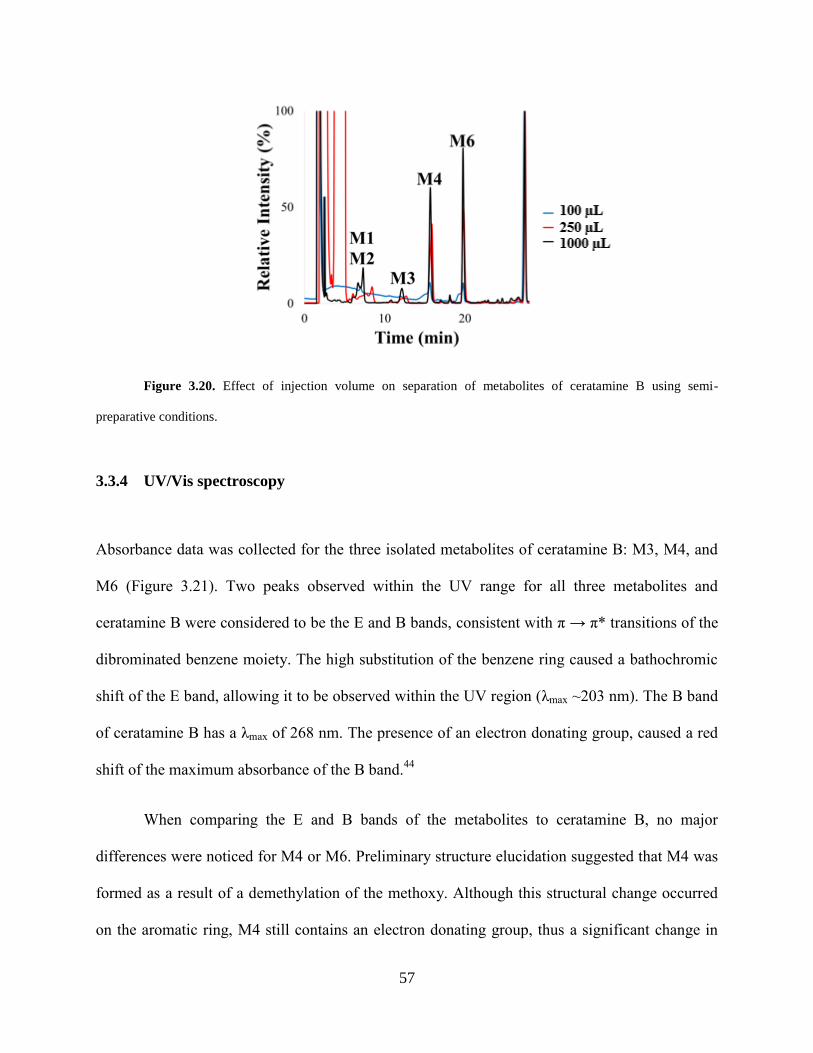
57
Figure 3.20. Effect of injection volume on separation of metabolites of ceratamine B using semi-
preparative conditions.
3.3.4 UV/Vis spectroscopy
Absorbance data was collected for the three isolated metabolites of ceratamine B: M3, M4, and
M6 (Figure 3.21). Two peaks observed within the UV range for all three metabolites and
ceratamine B were considered to be the E and B bands, consistent with π → π* transitions of the
dibrominated benzene moiety. The high substitution of the benzene ring caused a bathochromic
shift of the E band, allowing it to be observed within the UV region (λmax ~203 nm). The B band
of ceratamine B has a λmax of 268 nm. The presence of an electron donating group, caused a red
shift of the maximum absorbance of the B band.44
When comparing the E and B bands of the metabolites to ceratamine B, no major
differences were noticed for M4 or M6. Preliminary structure elucidation suggested that M4 was
formed as a result of a demethylation of the methoxy. Although this structural change occurred
on the aromatic ring, M4 still contains an electron donating group, thus a significant change in

58
the B band was not expected.42
M6 has been proposed to form as a result of a demethylation at
the aminoimidazole. This would not result in any change to the aromatic ring, which is consistent
with the observation of no significant shift in the absorbance of the B band.
Tandem mass spectrometry data supported the addition of an oxygen atom on the
aromatic ring in order to form M3, however the exact structure of this monooxygenation could
not be elucidated. When examining the absorbance data of M3, a hypsochromic shift was noticed
at the B band. The addition of a hydroxy would be expected to increase delocalization and result
in a bathochromic shift. Therefore, the observed hypsochromic shift does not support an
aromatic hydroxylation. The loss of delocalization suggests that the metabolic reaction possibly
resulted in a loss of aromaticity.
Figure 3.21. (A) UV-Vis absorbance spectra of ceratamine B, M3, M4 and M6 showing E band, B band,
and imidazoazepinone band. (B) UV-Vis absorbance spectra of ceratamine B, M3, M4, and M6 focusing on the B
band and imidazoazepinone band [Adapted with permission from Smith et al., Journal of Natural Products, 2014,
77, 1572-1578.43
Copyright (2014) American Chemical Society.].

59
An additional absorbance band was noticed within the UV/Vis region for ceratamine B
(λmax: 357 nm). This band was attributed to a π → π* transition of the highly conjugated
imidazoazepinone portion of ceratamine B. No change was observed in this absorbance band for
M3 or M4. Tandem mass spectrometry suggested no structural changes within the
imidazoazepinone portion for either metabolite, therefore no shift in the visible band was
expected. A hypsochromic shift (357 to 335 nm) was observed for M6, suggesting that a
demethylation at the aminoimidazole, would result in a loss of delocalization.
3.3.5 1H NMR spectroscopy
1H NMR was utilized to further confirm the proposed structures of the two major isolated
metabolites, M4 and M6. Table 3.5 displays the 1H NMR spectroscopic data for ceratamine B,
M4, and M6. Ceratamine B contains a total of 15 protons at eight different positions (Figure 1.9;
Appendix A, Figure A1). Preliminary structure elucidation suggested that M4 formed as a result
of a demethylation at the methoxy. The 1H NMR spectrum of M4 showed an absence of a singlet
at δ 3.70, consistent with the loss of the methyl of the methoxy. The addition of a broad singlet at
δ 6.57 was attributed to the resulting phenol (Appendix A, Figure A2).44
M6 was proposed to result from a demethylation of the aminoimidazole of ceratamine B.
The 1H NMR spectrum revealed an absence of a doublet at δ 3.07 ppm, consistent with the loss
of the methyl at the aminoimidazole. Also, the multiplicity of the signal at δ 8.67 has changed
from a broad quartet to a broad singlet (Appendix A, Figure A3). This change is due to the loss
of any neighboring protons to the aminoimidazole, consistent with a demethylation.

60
Table 3.5. 1H NMR Spectroscopic Data of ceratamine B, M4, and M6 [Adapted with permission from
Smith et al., Journal of Natural Products, 2014, 77, 1572-1578.43
Copyright (2014) American Chemical Society.].
Position Ceratamine B
δh, (J in Hz)
M4
δh, (J in Hz)
M6
δh, (J in Hz)
1 3.07, d (4.8) 3.06, d (5.4) n.d.
2 8.67, q (broad)
(4.8)
8.67, d (very
broad) 8.53, s (broad)
3 6.42, d (9) 6.40, d (9) 6.48, d (9)
4 7.15, t (broad) (7.8) 7.10, d (broad) (9) 7.21, t (broad)
(8.4)
5 11.40, d (broad) (6) 11.30, s (broad) n.d.
6 4.17, s 4.10, s 4.15, s
7 7.70, s 7.90, s 7.95, s
8 3.70, s 6.57, s 3.73, s
n.d.: not detected
In conclusion, a total of eight metabolites were identified for the ceratamines. Preliminary
structure elucidation, performed using tandem mass spectrometry, revealed that the majority of
ceratamine metabolites are the result of various demethylation reactions. All proposed molecular
formulas were supported by accurate mass. Monooxygenation was projected to occur in the
formation of two metabolites, M1 and M3. MS-MS data suggested that the location of
monooxygenation was along the aromatic ring. A hypsochromic shift in the B absorbance band
of M3 revealed that the monooxygenation may result in a loss of aromaticity, however this
observation needs to be further investigated before a structure can be proposed. Finally, the
proposed structures of two major metabolites, M4 and M6, were confirmed by 1H NMR (Figure
3.22).
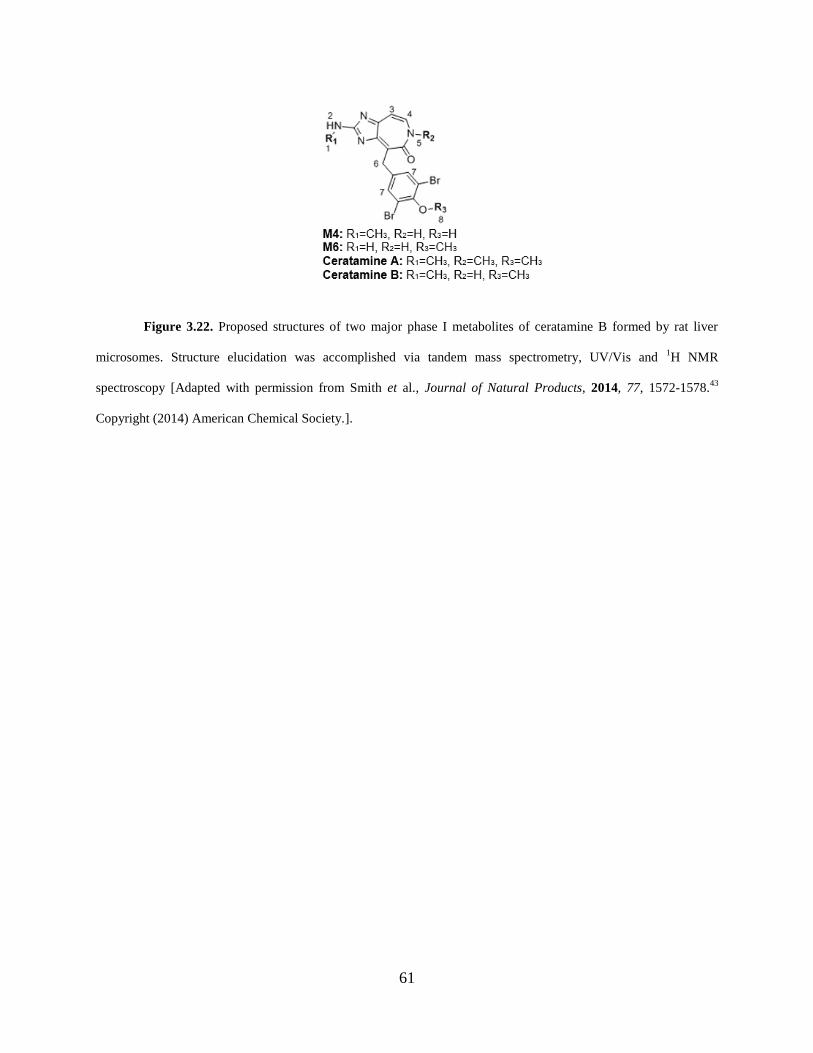
61
Figure 3.22. Proposed structures of two major phase I metabolites of ceratamine B formed by rat liver
microsomes. Structure elucidation was accomplished via tandem mass spectrometry, UV/Vis and 1H NMR
spectroscopy [Adapted with permission from Smith et al., Journal of Natural Products, 2014, 77, 1572-1578.43
Copyright (2014) American Chemical Society.].
62
4.0 SPECIES COMPARISON OF METABOLIC PROFILE AND STABILITY OF
THE MICROTUBULE PERTURBAGENS: CERATAMINES A AND B
An important part of the pre-clinical development of new chemical entities is the understanding
of metabolite formation. Preliminary studies typically begin in species such as rat or mouse, as
these are often utilized for initial in vivo studies.37
However, since the overall goal of the
discovery process is the approval of new drugs for use in humans, it is important to consider any
species differences in metabolism. Performing in vitro metabolism studies with systems such as
human liver microsomes early in pre-clinical development can be effective in revealing potential
problems that may not have been noticed until clinical trials. At this earlier stage it is much
easier and more cost effective to optimize lead compounds to avoid problems such as metabolic
activation or stability.
4.1 SEMI-QUANTITATIVE EVALUATION OF THE METABOLISM OF THE
CERATAMINES IN RAT LIVER MICROSOMES
The ceratamines were both found to be significantly metabolized by rat liver microsomes, with
nine metabolites identified for ceratamine A and five for ceratamine B. The metabolism of each
compound was monitored over 60 min in order to further understand the formation of each
metabolite (Figure 4.1).

63
Figure 4.1. Formation of metabolites of ceratamine A by rat liver microsomes (0.01 nmol P450/mg
protein). (A) minor metabolites, (B) major metabolites.
Due to the lack of pure standards of each metabolite for optimization of MS source and
compound conditions, the analysis of these semi-quantitative assays was accomplished using the
UV trace, as it is more likely that the phase I metabolites of the ceratamines would have similar
UV absorbance than similar ionization characteristics.
Figure 4.1 displays the formation of eight of the nine phase I metabolites of ceratamine A
formed by rat liver microsomes. M11 will not be further discussed as it is a very minor
metabolite that is below the limit of detection of the UV analysis method. The major metabolites
of ceratamine A were found to be M5, M7, and CB. All three of these metabolites were formed
as the result of a single metabolic reaction, N-dealkylation. M7 was determined to be the most
abundant metabolite, resulting from a demethylation at the aminoimidazole (Figure 4.1).
The five minor metabolites of ceratamine A were identified as M4, M6, and M8-M10.
The majority of these metabolites were formed due to two metabolic reactions, most of which
also involved a demethylation at the aminoimidazole. When observing metabolite formation, it
became apparent that the formation of the minor metabolites was delayed over the first 30 min.

64
This observation is consistent with secondary metabolites, with the formation of the three major
primary metabolites being the rate limiting step.
Figure 4.2. Formation of metabolites of ceratamine B in rat liver microsomes.
Figure 4.2 displays the formation of the five phase I metabolites by rat liver microsomes.
The most abundant metabolite, M6, was formed as the result of a demethylation at the
aminoimidazole, similar to what was observed for ceratamine A. Other similarities were noticed
including the fact that the three most abundant metabolites were the result of a single metabolic
reaction and that the two secondary metabolites were very minor with delayed formation.
4.2 SEMI-QUANTITATIVE EVALUATION OF THE METABOLISM OF THE
CERATAMINES IN HUMAN LIVER MICROSOMES
A total of six phase I metabolites were identified in incubations of ceratamine A with human
liver microsomes (0.01 nmol P450/mg protein). Initial analysis was performed using HPLC
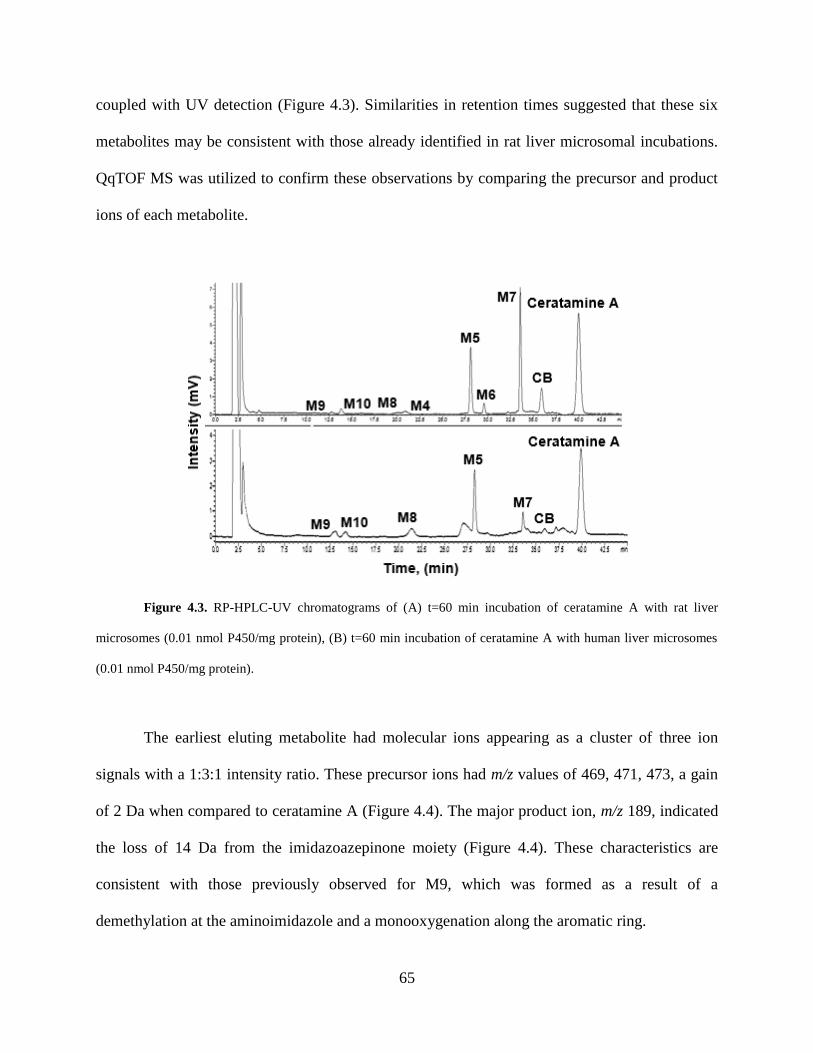
65
coupled with UV detection (Figure 4.3). Similarities in retention times suggested that these six
metabolites may be consistent with those already identified in rat liver microsomal incubations.
QqTOF MS was utilized to confirm these observations by comparing the precursor and product
ions of each metabolite.
Figure 4.3. RP-HPLC-UV chromatograms of (A) t=60 min incubation of ceratamine A with rat liver
microsomes (0.01 nmol P450/mg protein), (B) t=60 min incubation of ceratamine A with human liver microsomes
(0.01 nmol P450/mg protein).
The earliest eluting metabolite had molecular ions appearing as a cluster of three ion
signals with a 1:3:1 intensity ratio. These precursor ions had m/z values of 469, 471, 473, a gain
of 2 Da when compared to ceratamine A (Figure 4.4). The major product ion, m/z 189, indicated
the loss of 14 Da from the imidazoazepinone moiety (Figure 4.4). These characteristics are
consistent with those previously observed for M9, which was formed as a result of a
demethylation at the aminoimidazole and a monooxygenation along the aromatic ring.
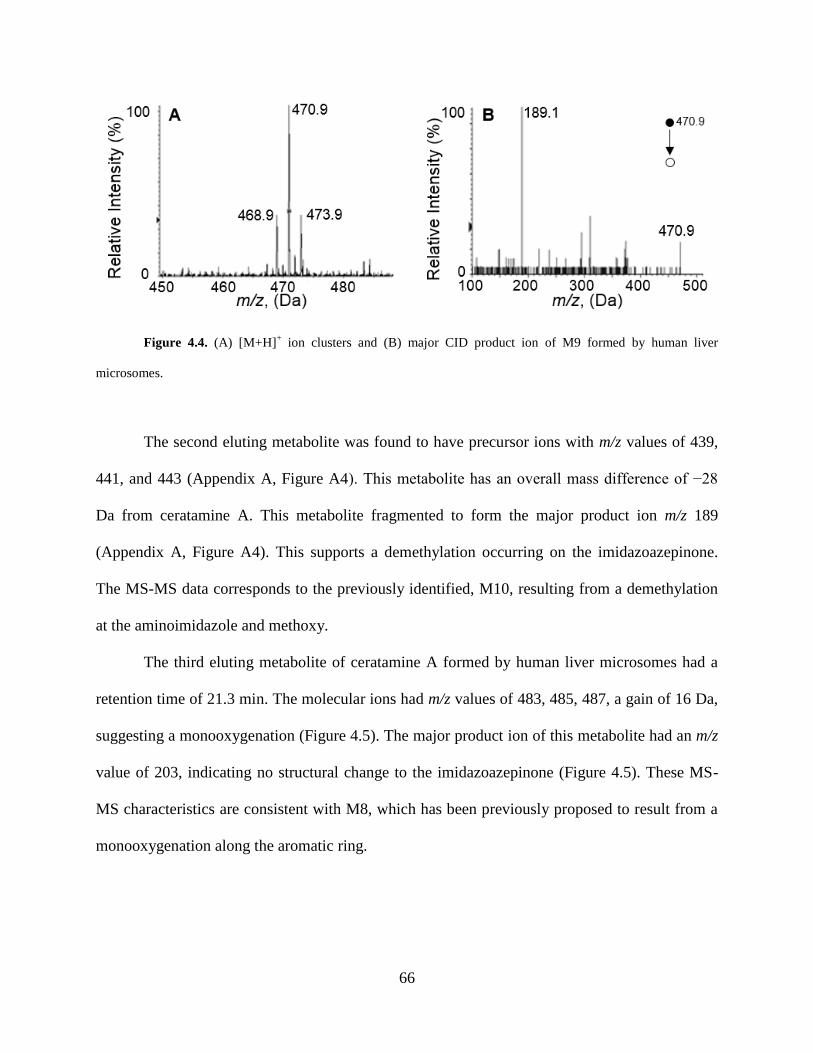
66
Figure 4.4. (A) [M+H]+ ion clusters and (B) major CID product ion of M9 formed by human liver
microsomes.
The second eluting metabolite was found to have precursor ions with m/z values of 439,
441, and 443 (Appendix A, Figure A4). This metabolite has an overall mass difference of −28
Da from ceratamine A. This metabolite fragmented to form the major product ion m/z 189
(Appendix A, Figure A4). This supports a demethylation occurring on the imidazoazepinone.
The MS-MS data corresponds to the previously identified, M10, resulting from a demethylation
at the aminoimidazole and methoxy.
The third eluting metabolite of ceratamine A formed by human liver microsomes had a
retention time of 21.3 min. The molecular ions had m/z values of 483, 485, 487, a gain of 16 Da,
suggesting a monooxygenation (Figure 4.5). The major product ion of this metabolite had an m/z
value of 203, indicating no structural change to the imidazoazepinone (Figure 4.5). These MS-
MS characteristics are consistent with M8, which has been previously proposed to result from a
monooxygenation along the aromatic ring.

67
Figure 4.5. (A) [M+H]+ ion clusters and (B) major CID product ion of M8 formed by human liver
microsomes.
The final three detected metabolites had retention times of 28.3, 33.5, and 35.9 min.
These metabolites were isobaric with precursor ions having m/z values of 453, 455, 457, a loss of
14 Da (Figure 4.6). The major product ions were found to be m/z 203, 189, and 189, respectively
(Figure 4.6). Based on elution order and MS-MS characteristics, these metabolites were found to
be consistent with M5, M7, and CB, being formed as a result of a single demethylation at the
methoxy (M5), aminoimidazole (M7), or tertiary amide (CB).

68
Figure 4.6. (A)[M+H]+ of M5, (B) major CID product ion of M5, (C) [M+H]
+ of M7, (D) major CID
product ion of M7, (E) [M+H]+ of CB, (F) major CID product ion of CB.
The formation of these six metabolites was monitored over 60 min (Figure 4.7). In terms
of abundances, only one major metabolite was observed for ceratamine A in human liver
microsomes. This metabolite was identified as M5. The remaining five metabolites were each
responsible for approximately less than a 5% loss of the initial control.

69
Figure 4.7. Formation of metabolites of ceratamine A in human liver microsomes (0.01 nmol P450/mg
protein).
HPLC-UV analysis suggested the formation of four phase I metabolites of ceratamine B
by human liver microsomes. The retention times of these metabolites were similar to those
formed by rat liver microsomes (Figure 4.8).
Figure 4.8. RP-HPLC-UV chromatograms of (A) t=60 min incubation of ceratamine B with rat liver
microsomes (0.01 nmol P450/mg protein), (B) t=60 min incubation of ceratamine B with human liver microsomes
(0.01 nmol P450/mg protein).

70
Tandem mass spectrometry was used to confirm if these four metabolites are consistent with
those previously identified. The metabolite with the shortest retention time had precursor ions
with m/z values of 453, 455, 457 (Figure 4.9). This mass change of +2 Da had been previously
observed and most likely is the result of a demethylation (−14 Da) and a monooxygenation (+16
Da). The major product ion was determined to be m/z 175, suggesting that the demethylation
occurred on the imidazoazepinone (Figure 4.9). These characteristics are consistent with the
previously identified metabolite, M1.
Figure 4.9. (A) [M+H]+ ion clusters and (B) CID product ions of M1 formed by human liver microsomes.
The second metabolite of ceratamine B, formed by human liver microsomes had
precursor ions with m/z values of 469, 471, 473, a gain of 16 Da (Appendix A, Figure A5). The
major product ion was found to have an m/z value of 189, supporting that no structural change
occurred on the imidazoazepinone (Appendix A, Figure A5). Therefore, this metabolite was
identified as M3.
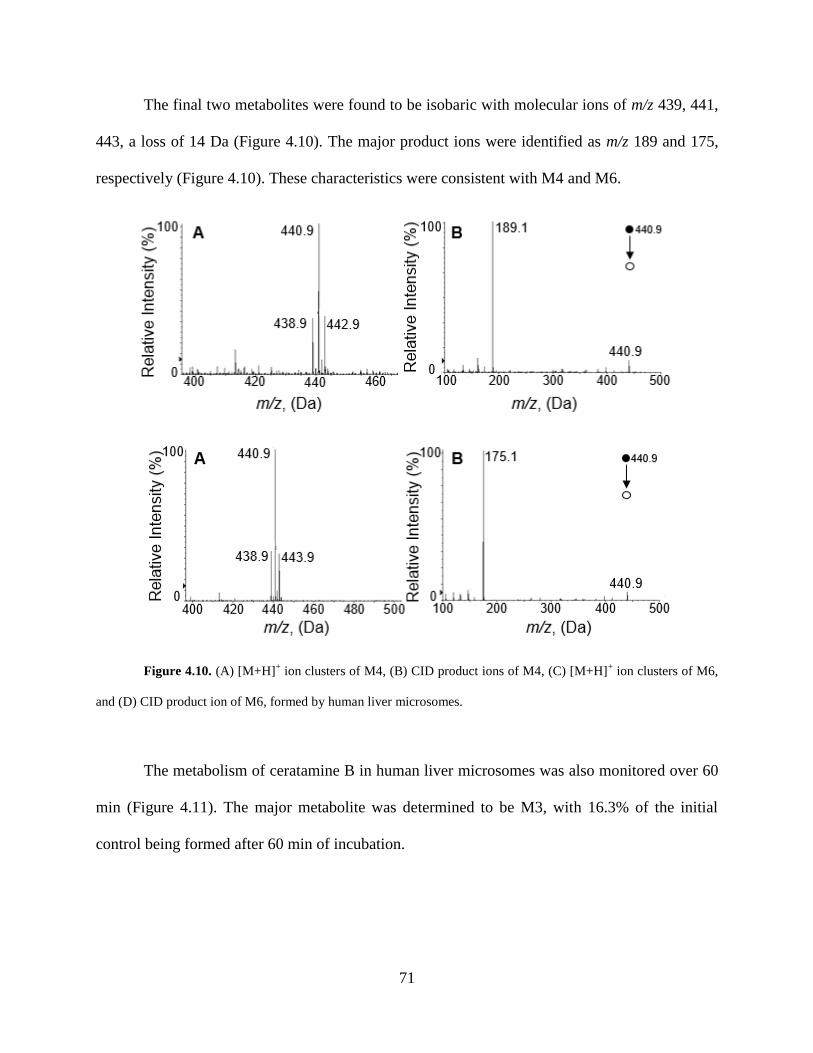
71
The final two metabolites were found to be isobaric with molecular ions of m/z 439, 441,
443, a loss of 14 Da (Figure 4.10). The major product ions were identified as m/z 189 and 175,
respectively (Figure 4.10). These characteristics were consistent with M4 and M6.
Figure 4.10. (A) [M+H]+ ion clusters of M4, (B) CID product ions of M4, (C) [M+H]
+ ion clusters of M6,
and (D) CID product ion of M6, formed by human liver microsomes.
The metabolism of ceratamine B in human liver microsomes was also monitored over 60
min (Figure 4.11). The major metabolite was determined to be M3, with 16.3% of the initial
control being formed after 60 min of incubation.
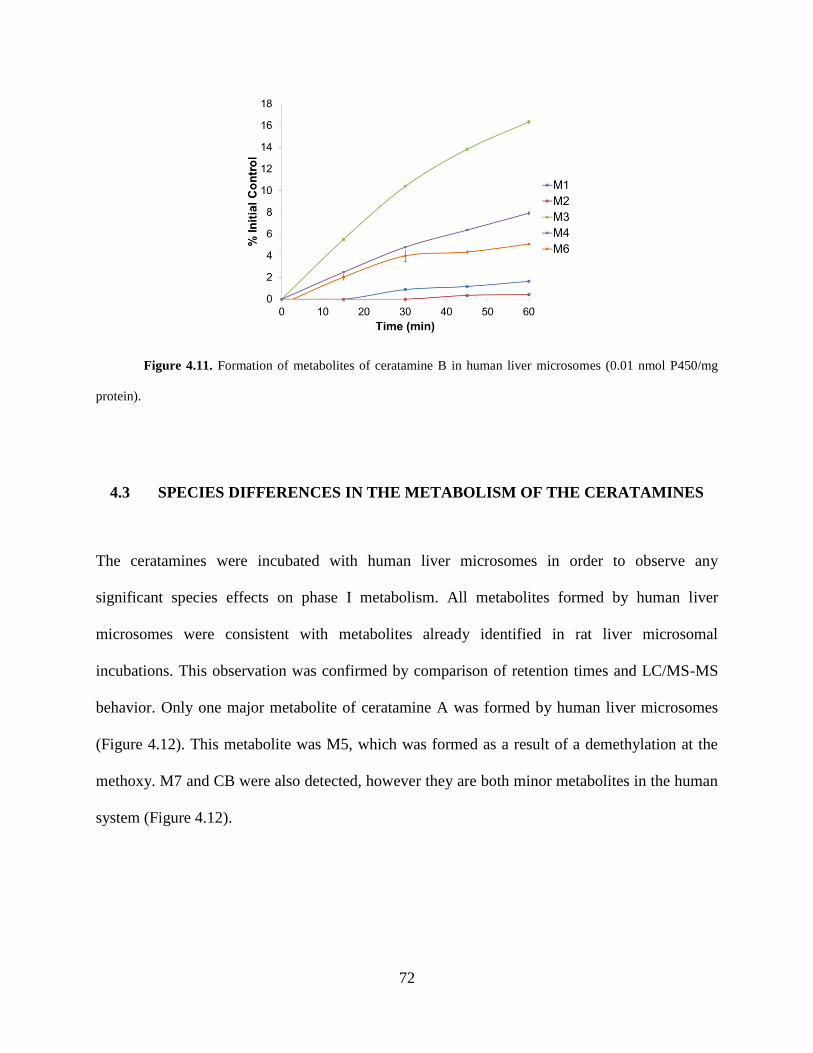
72
Figure 4.11. Formation of metabolites of ceratamine B in human liver microsomes (0.01 nmol P450/mg
protein).
4.3 SPECIES DIFFERENCES IN THE METABOLISM OF THE CERATAMINES
The ceratamines were incubated with human liver microsomes in order to observe any
significant species effects on phase I metabolism. All metabolites formed by human liver
microsomes were consistent with metabolites already identified in rat liver microsomal
incubations. This observation was confirmed by comparison of retention times and LC/MS-MS
behavior. Only one major metabolite of ceratamine A was formed by human liver microsomes
(Figure 4.12). This metabolite was M5, which was formed as a result of a demethylation at the
methoxy. M7 and CB were also detected, however they are both minor metabolites in the human
system (Figure 4.12).
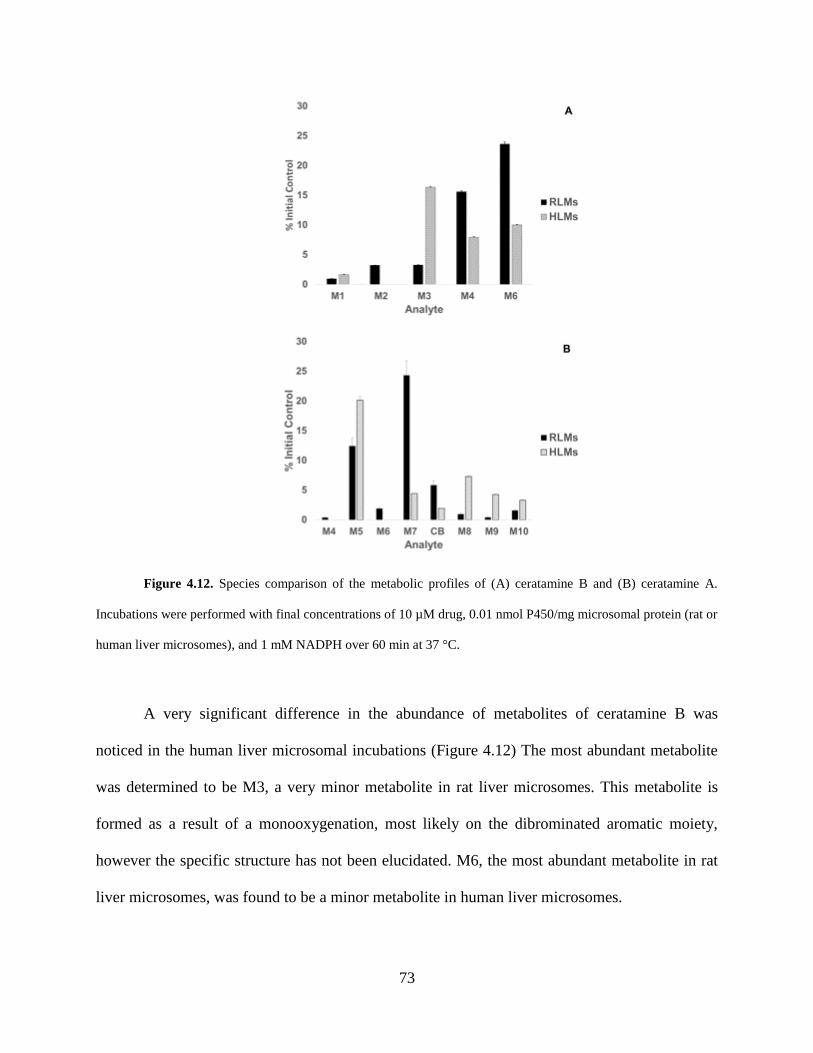
73
Figure 4.12. Species comparison of the metabolic profiles of (A) ceratamine B and (B) ceratamine A.
Incubations were performed with final concentrations of 10 µM drug, 0.01 nmol P450/mg microsomal protein (rat or
human liver microsomes), and 1 mM NADPH over 60 min at 37 °C.
A very significant difference in the abundance of metabolites of ceratamine B was
noticed in the human liver microsomal incubations (Figure 4.12) The most abundant metabolite
was determined to be M3, a very minor metabolite in rat liver microsomes. This metabolite is
formed as a result of a monooxygenation, most likely on the dibrominated aromatic moiety,
however the specific structure has not been elucidated. M6, the most abundant metabolite in rat
liver microsomes, was found to be a minor metabolite in human liver microsomes.
74
The results of the species comparison suggest that the aminoimidazole is the most
metabolically labile site in rat liver microsomes, however the dibrominated aromatic moiety is
the preferred site of phase I metabolism in human liver microsomes. The significant species
differences in the major metabolites may suggest that a cytochromes P450 subfamily that has
been established to have highly variable substrate specificity between species may be involved.
Specifically, the CYP2A, CYP2C, and CYP3A families have all been found to have significant
species differences in the substrates that they metabolize.45, 46
4.4 METABOLIC STABILITY OF THE CERATAMINES
Besides identifying the metabolic profile in multiple species, the evaluation of the metabolic
stability of a new drug is also an important part of pre-clinical development. A critical factor in
the efficacy of a drug is the amount of that drug that is free (unbound) within the body.37, 39
This
characteristic is commonly referred to as bioavailability and can be significantly influenced by
the route of absorption. Oral administration is the preferred method of absorption for new drugs,
when possible. The potential of a drug to be orally bioavailable can be evaluated using Lipinski’s
rules.39
According to Lipinski, a drug can likely be considered for oral administration if it has the
following characteristics: a molecular weight less than 500 g/mol, a log P less than 5, less than
10 hydrogen bond acceptors, and less than 5 hydrogen bond donors.39
When examining the structures of the ceratamines it is apparent that they would be
predicted to have an oral bioavailability according to Lipinski’s rules (Table 4.1). Both
compounds are smaller than 500 g/mol, have fewer than 10 hydrogen bond acceptors, and fewer

75
than 5 hydrogen bond donors. The log P has not been experimentally determined for either of the
ceratamines but they have predicted values of 2.5 and 1.8 for ceratamine A and B, respectively.
The predicted log P values were estimated using the XLogP3-AA algorithm via Pubchem.47-49
Table 4.1. Lipinski’s rule characteristics of the ceratamines.47, 48
Analyte Molecular
Weight (g/mol)
Log P Number of
Hydrogen Bond
Acceptors
Number of
Hydrogen Bond
Donors
Ceratamine A 468.14 2.5 3 1
Ceratamine B 454.12 1.8 3 2
Since the ceratamines have structural characteristics supporting oral administration, it is
essential to investigate their metabolic stability in liver microsomes. Drugs that are taken orally
pass directly to the liver via portal circulation, where they undergo initial metabolism before
being distributed throughout the body.37, 39
This process, commonly referred to as first pass
metabolism, typically involves phase I metabolic reactions, therefore liver microsomes are an
appropriate enzyme system for the evaluation of metabolic stability.37, 39
If a compound is found
to be highly cleared in liver microsomes, it may suggest that oral administration is not warranted.
4.4.1 Metabolic stability of the ceratamines in rat liver microsomes
In order to properly evaluate the metabolic stability of the ceratamines in rat liver microsomes, a
simple and robust assay was developed. Optimization and validation was accomplished using
four control compounds: propranolol, verapamil, metoprolol, and warfarin. These compounds
were chosen based on their range of intrinsic clearance, CLint, values (Table 4.2). To increase the
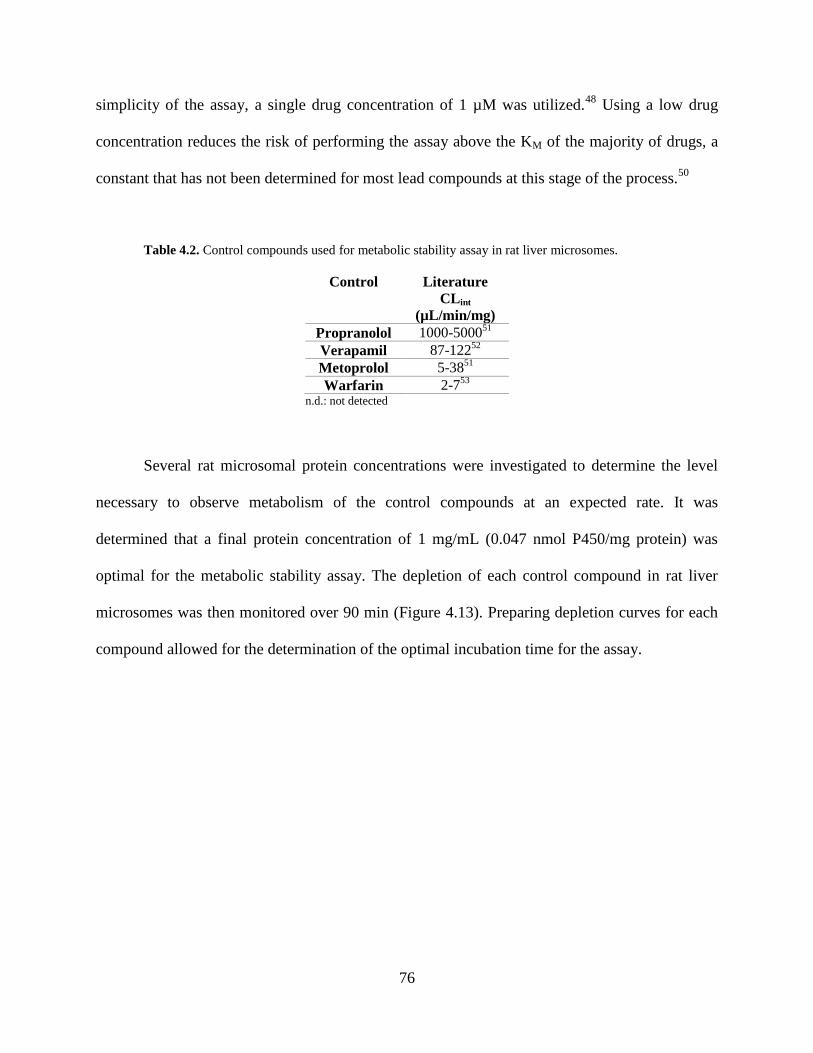
76
simplicity of the assay, a single drug concentration of 1 µM was utilized.48
Using a low drug
concentration reduces the risk of performing the assay above the KM of the majority of drugs, a
constant that has not been determined for most lead compounds at this stage of the process.50
Table 4.2. Control compounds used for metabolic stability assay in rat liver microsomes.
Control Literature
CLint
(µL/min/mg)
Propranolol 1000-500051
Verapamil 87-12252
Metoprolol 5-3851
Warfarin 2-753
n.d.: not detected
Several rat microsomal protein concentrations were investigated to determine the level
necessary to observe metabolism of the control compounds at an expected rate. It was
determined that a final protein concentration of 1 mg/mL (0.047 nmol P450/mg protein) was
optimal for the metabolic stability assay. The depletion of each control compound in rat liver
microsomes was then monitored over 90 min (Figure 4.13). Preparing depletion curves for each
compound allowed for the determination of the optimal incubation time for the assay.

77
Figure 4.13. Depletion profiles of control compounds used for the validation of the metabolic stability
assay in rat liver microsomes: (A) propranolol (high clearance), (B) verapamil (moderate/high clearance), (C)
metoprolol (low clearance) and (D) warfarin (low clearance). Incubations were performed with final concentrations
of 1 µM drug, 0.047 nmol P450/mg rat liver microsomal protein, and 1 mM NADPH over 90 min at 37 °C.
A 30 min incubation was deemed sufficient to differentiate between drugs with low,
moderate, or high clearance categories. The estimation of clearance was determined in a semi-
quantitative manner by observing the percentage of the initial control remaining after 30 min.
High clearance was defined as <30% remaining, moderate as 30-70% remaining, and low
clearance as >70% remaining. The developed assay estimated propranolol as a high clearance
control, verapamil as a high-moderate control, and metoprolol and warfarin as low clearance
controls; all of which are consistent with literature CLint values.

78
The reliability of the assay was also evaluated using the control compounds. The intra-
and inter-day precision of the assay was typically below 5%, showing acceptable consistency
(Table 4.3).
Table 4.3. Validation of metabolic stability assay with rat liver microsomes.
Control Remaining after
30 min (%)
Intra-day
Precision
(%)
Inter-day
Precision
(%)
Clearance
Category
Propranolol n.d. --- --- High
Verapamil 26.3 ± 2.1 13.9 3.6 High/Moderate
Metoprolol 95.4 ± 2.3 2.3 3.3 Low
Warfarin 89.0 ± 2.9 3.0 5.0 Low n.d.: not detected
The results of the metabolic stability assay in rat liver microsomes can be seen in table
4.4. After a 30 min incubation, <30% of each of the ceratamines was remaining. Therefore, it
was estimated that both ceratamine A and B have high clearance in rats.
4.4.2 Metabolic stability of the ceratamines in human liver microsomes
For the metabolic stability assay in human liver microsomes, nicardipine was utilized as a high
clearance control, verapamil was chosen as a moderate clearance control, and propranolol and
warfarin were used as low clearance controls (Figure 4.14).

79
Figure 4.14. Depletion profiles of control compounds used for the validation of the metabolic stability
assay in human liver microsomes: (A) nicardipine (high clearance), (B) verapamil (moderate clearance), (C)
propranolol (low clearance) and (D) warfarin (low clearance). Incubations were performed with final concentrations
of 1 µM drug, 0.047 nmol P450/mg human liver microsomal protein, and 1 mM NADPH over 90 min at 37 °C.
After a 30 min incubation with human liver microsomes, 82.5% was remaining for
ceratamine A and 58.8% was remaining for ceratamine B, indicating low and moderate clearance
categories for ceratamine A and B, respectively (Table 4.4)
Table 4.4. Clearance categories of the ceratamines estimated by the metabolic stability assay.
Remaining after
30 min in RLMs
(%)
Clearance
Category in
RLMs
Remaining after
30 min in HLMs
(%)
Clearance
Category in
HLMs
Ceratamine A 10.8 ± 1.3 High 82.5 ± 6.2 Low
Ceratamine B 13.7 ± 0.8 High 58.8 ± 0.5 Moderate
80
The metabolic stability experiment revealed that both of the ceratamines are rapidly
metabolized by rat liver microsomes, however a slower rate of metabolism was observed in
human liver microsomes. Although rat systems are commonly used in the study of in vitro
metabolism of novel drug candidates, significant species differences, particularly between rat
and human, have been observed.54
These differences are typically the result of variations in
isoform composition, expression, inhibitory effects, and/or catalytic activities.54, 55
The determination of species differences in either metabolic profile or stability is
important information to be gathered in early drug discovery.56
However, the observation of
species differences does not necessarily deem a chemical entity a failure as a drug. There are
many approved and successful drugs that have been found to have substantial metabolism
differences between species during pre-clinical assessments.57, 58
Compounds such as
pregnenolone-16α-carbonitrile (PCN) or the antibiotic rifampicin, are both metabolized at very
different rates by rats and humans as a result of variations in the induction of the major
metabolizing family, CYP3A. PCN effectively induces CYP3A in rats, however it is unable to
increase the expression of human CYP3A, thus it is not significantly metabolized. Conversely,
rifampicin has been found to be an inducer of CYP3A in humans but not in rats, explaining the
significant difference in metabolic stability between the two species.57
Finally, the previously introduced microtubule stabilizer, paclitaxel, is primarily
hydroxylated by phase I liver enzymes. The specific site of hydroxylation has been found to
differ among several species with the C3’-hydroxy being the predominant metabolite in rats and
the 6α-hydroxy in humans.58

81
5.0 IDENTIFICATION OF CYTOCHROMES P450 ISOFORMS INVOLVED IN
HUMAN PHASE I METABOLISM OF CERATAMINE B
A final characteristic that is of interest to this pharmacokinetic study is the identification of the
specific drug metabolizing enzyme(s) responsible for the formation of the major human phase I
metabolites of ceratamine B. The determination of these enzymes can be used to predict the risk
of certain drug-drug interactions.37
The presence of exogenous compounds, such as xenobiotics, or even many foods,
including certain fruits and herbal remedies, can have a significant effect on the activity of drug
metabolizing enzymes, either through inhibition or induction.37
Therefore, the identification of
the enzymes involved in the metabolism of a drug can ensure that an individual is not prescribed
negatively interacting drugs and is advised on a proper diet to avoid effecting bioavailability due
to changes in metabolic clearance.
The focus of this project has been on phase I metabolism, therefore liver microsomes
were used as an in vitro enzyme system. Although many families of enzymes can be involved in
phase I drug metabolism, the majority of phase I metabolic reactions are catalyzed by a
superfamily of enzymes known as cytochromes P450.38
Therefore, the final stage of this study
was designed to identify the specific P450 isoform(s) involved. This will be determined using
two methods: small molecule inhibition studies and isozyme mapping via recombinant P450s.
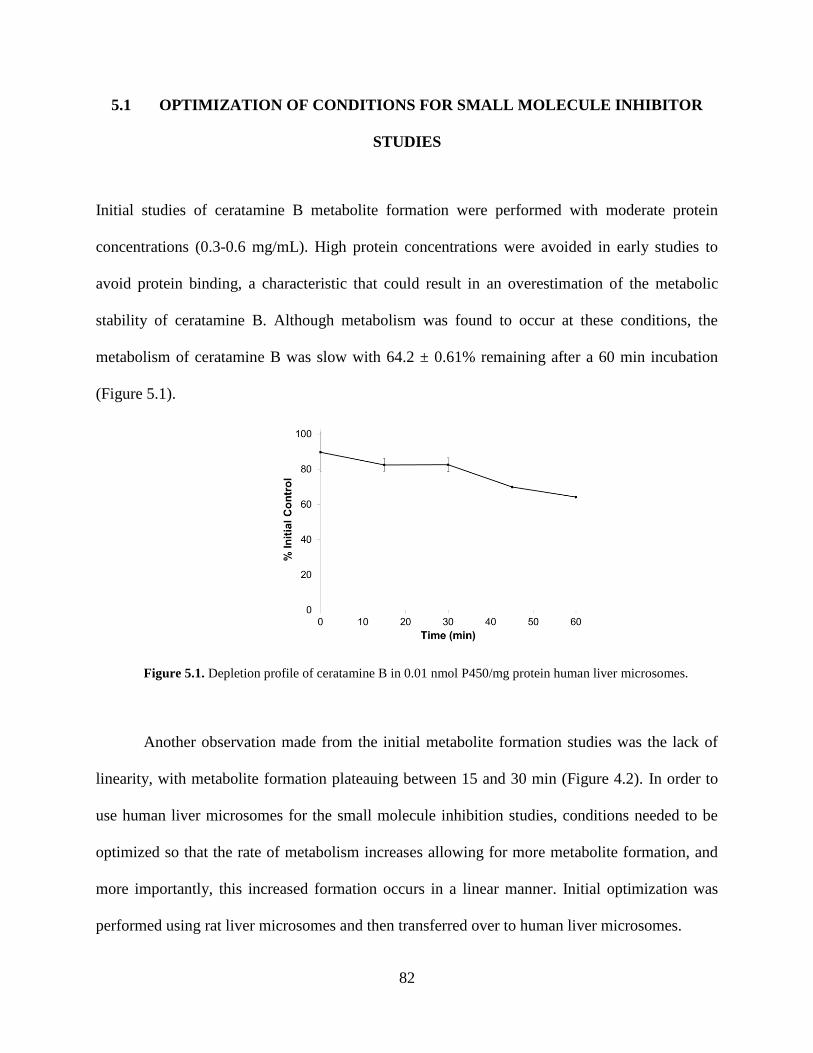
82
5.1 OPTIMIZATION OF CONDITIONS FOR SMALL MOLECULE INHIBITOR
STUDIES
Initial studies of ceratamine B metabolite formation were performed with moderate protein
concentrations (0.3-0.6 mg/mL). High protein concentrations were avoided in early studies to
avoid protein binding, a characteristic that could result in an overestimation of the metabolic
stability of ceratamine B. Although metabolism was found to occur at these conditions, the
metabolism of ceratamine B was slow with 64.2 ± 0.61% remaining after a 60 min incubation
(Figure 5.1).
Figure 5.1. Depletion profile of ceratamine B in 0.01 nmol P450/mg protein human liver microsomes.
Another observation made from the initial metabolite formation studies was the lack of
linearity, with metabolite formation plateauing between 15 and 30 min (Figure 4.2). In order to
use human liver microsomes for the small molecule inhibition studies, conditions needed to be
optimized so that the rate of metabolism increases allowing for more metabolite formation, and
more importantly, this increased formation occurs in a linear manner. Initial optimization was
performed using rat liver microsomes and then transferred over to human liver microsomes.

83
Increasing total P450 content was found to have a significant effect on the rate of
metabolism. Figure 5.2 displays the formation of M2 by rat liver microsomes over 60 min using
3 different total P450 concentrations: 0.01, 0.024, and 0.047 nmol P450/mg protein. Significant
differences in the rate of formation were observed within the first 30 min.
Figure 5.2. Effect of total P450 content on the rate of formation of M2.
Although higher P450 content increased metabolism rate, it did not improve linearity of
metabolite formation. The plateau effect that has been observed indicates a lack of substrate or
co-factor, either of which would prevent the formation of additional metabolite. Since substrate
was always remaining after 60 min incubations with all total P450 concentrations analyzed, it
was determined that a lack of co-factor was responsible for non-linearity of metabolite
formation. In prior incubations, a single addition of NADPH (1 mM final concentration) was
used to initiate the reaction. Increasing the final concentration of NADPH to 2 mM was found to
only slightly increase the depletion of ceratamine B in rat liver microsomes (Figure 5.3) This
suggested that the cofactor may not be stable over the entire incubation time. An additional
incubation was performed using a final concentration of 1 mM NADPH, however two additions
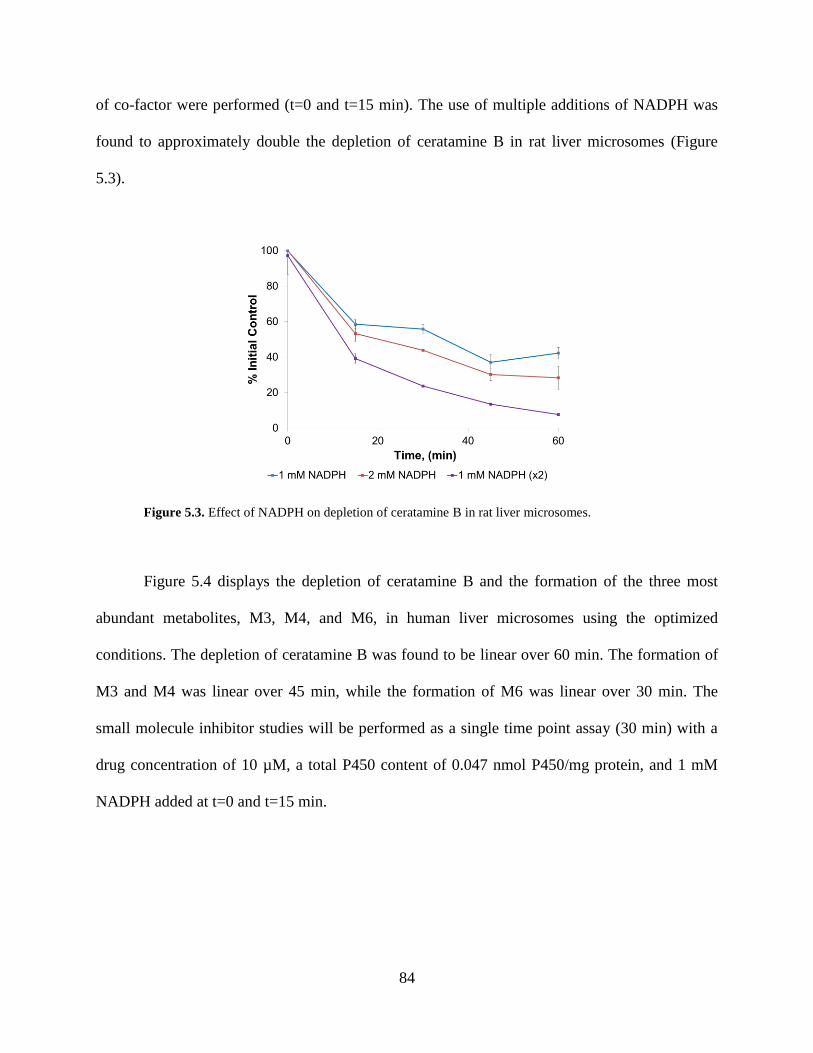
84
of co-factor were performed (t=0 and t=15 min). The use of multiple additions of NADPH was
found to approximately double the depletion of ceratamine B in rat liver microsomes (Figure
5.3).
Figure 5.3. Effect of NADPH on depletion of ceratamine B in rat liver microsomes.
Figure 5.4 displays the depletion of ceratamine B and the formation of the three most
abundant metabolites, M3, M4, and M6, in human liver microsomes using the optimized
conditions. The depletion of ceratamine B was found to be linear over 60 min. The formation of
M3 and M4 was linear over 45 min, while the formation of M6 was linear over 30 min. The
small molecule inhibitor studies will be performed as a single time point assay (30 min) with a
drug concentration of 10 µM, a total P450 content of 0.047 nmol P450/mg protein, and 1 mM
NADPH added at t=0 and t=15 min.

85
Figure 5.4. (A) Depletion of ceratamine over 60 min of incubation, (B) formation of M3, M4, and M6 over
60 min of incubation. Incubation conditions were performed with final concentrations of 10 µM ceratamine B, 0.047
nmol P450/mg human liver microsomal protein, and 1 mM NADPH (added at t=0 and t=15 min).
5.2 EFFECT OF 1-AMINOBENZOTRIAZOLE ON HUMAN PHASE I
METABOLISM OF CERATAMINE B
Cytochromes P450 are a large class of enzymes that are involved in both endogenous and
xenobiotic metabolism. Specifically, they are responsible for more than 75% of all drug
metabolism.37
As the focus of this pharmacokinetic study is on phase I metabolism, it is likely
that the formation of the major metabolites of ceratamine B in human liver microsomes are
catalyzed by P450s. This hypothesis can be tested using the small molecule inhibitor, 1-
aminobenzotriazole (ABT).
ABT is a non-specific mechanism-based or suicide inhibitor of cytochromes P450. It is
metabolized to a reactive intermediate that irreversibly binds with the porphyrin moiety of the
prosthetic heme located in the active site of the enzyme, resulting in the inactivation of the
catalytic site.59
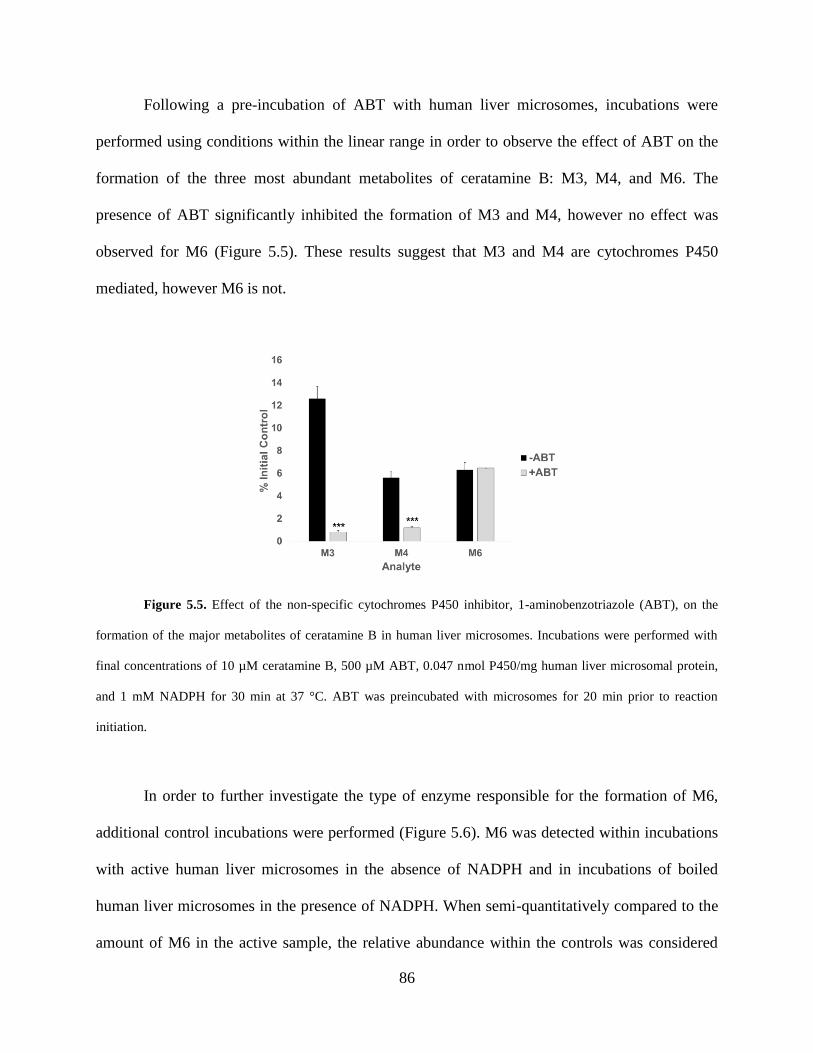
86
Following a pre-incubation of ABT with human liver microsomes, incubations were
performed using conditions within the linear range in order to observe the effect of ABT on the
formation of the three most abundant metabolites of ceratamine B: M3, M4, and M6. The
presence of ABT significantly inhibited the formation of M3 and M4, however no effect was
observed for M6 (Figure 5.5). These results suggest that M3 and M4 are cytochromes P450
mediated, however M6 is not.
Figure 5.5. Effect of the non-specific cytochromes P450 inhibitor, 1-aminobenzotriazole (ABT), on the
formation of the major metabolites of ceratamine B in human liver microsomes. Incubations were performed with
final concentrations of 10 µM ceratamine B, 500 µM ABT, 0.047 nmol P450/mg human liver microsomal protein,
and 1 mM NADPH for 30 min at 37 °C. ABT was preincubated with microsomes for 20 min prior to reaction
initiation.
In order to further investigate the type of enzyme responsible for the formation of M6,
additional control incubations were performed (Figure 5.6). M6 was detected within incubations
with active human liver microsomes in the absence of NADPH and in incubations of boiled
human liver microsomes in the presence of NADPH. When semi-quantitatively compared to the
amount of M6 in the active sample, the relative abundance within the controls was considered
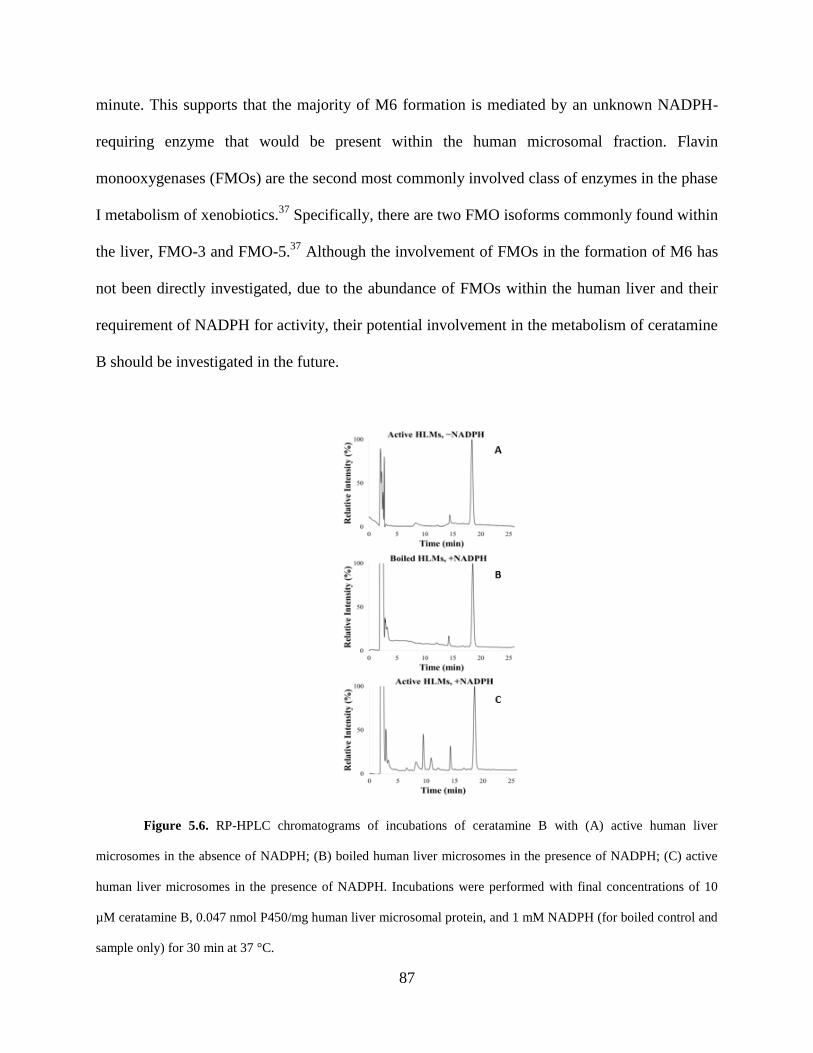
87
minute. This supports that the majority of M6 formation is mediated by an unknown NADPH-
requiring enzyme that would be present within the human microsomal fraction. Flavin
monooxygenases (FMOs) are the second most commonly involved class of enzymes in the phase
I metabolism of xenobiotics.37
Specifically, there are two FMO isoforms commonly found within
the liver, FMO-3 and FMO-5.37
Although the involvement of FMOs in the formation of M6 has
not been directly investigated, due to the abundance of FMOs within the human liver and their
requirement of NADPH for activity, their potential involvement in the metabolism of ceratamine
B should be investigated in the future.
Figure 5.6. RP-HPLC chromatograms of incubations of ceratamine B with (A) active human liver
microsomes in the absence of NADPH; (B) boiled human liver microsomes in the presence of NADPH; (C) active
human liver microsomes in the presence of NADPH. Incubations were performed with final concentrations of 10
µM ceratamine B, 0.047 nmol P450/mg human liver microsomal protein, and 1 mM NADPH (for boiled control and
sample only) for 30 min at 37 °C.

88
5.3 IDENTIFICATION OF P450 ISOFORMS INVOLVED IN THE FORMATION OF
M3 AND M4
Once it had been determined that M3 and M4 are formed by cytochromes P450, an experiment
was designed in order to identify the specific isoforms involved in metabolite formation.
Initially, isozyme mapping was used as a preliminary screen. Ceratamine B was incubated with
nine different isoforms: CYP1A2, CYP2C8, CYP2C9, CYP2C18, CYP2C19, CYP2D6,
CYP2E1, CYP3A4, and CYP3A5. These specific isozymes were chosen based on their
involvement in xenobiotic metabolism and their abundance in the human liver. Based on the
results of the isozyme mapping experiment, incubations with specific small molecule inhibitors
were performed in order to confirm the identification of the P450 isoforms involved.
5.3.1 Isozyme mapping
The isozyme mapping experiment revealed that the CYP3A family is responsible for the
formation of both M3 and M4 in human liver microsomes (Figure 5.7). For the most abundant
metabolite, M3, both isoforms (CYP3A4 and CYP3A5) were significantly involved in the
formation, however for M4, CYP3A5 was found to be responsible for the majority of formation.
As isoforms within the same subfamily, CYP3A4 and CYP3A5 are very similar, with a structural
homology >97%. Although they are thought to be capable of metabolizing similar substrates,
their abundances significantly differ within the liver, with CYP3A4 being the major hepato-
expressed isoform. The expression of CYP3A5 in the liver is typically very low, however it has
been found to be highly variable. Approximately one third of Caucasians have been found to
express CYP3A5 within the liver, while this expression is increased within the African-

89
American population where up to 50% express CYP3A5. Therefore the observation that
CYP3A5 is the major enzyme involved in the formation of M4 may suggest significant
differences in first pass clearance of ceratamine B across different races.60
Figure 5.7. Isozyme mapping of the formation of (A) M3 and (B) M4. Incubations were performed with 10
µM ceratamine B, recombinant P450, and 1 mM NADPH for 30 min at 37 °C.
5.3.2 Small molecule inhibition studies
Due to the similarity in the homology of CYP3A4 and CYP3A5, there currently are no known
inhibitors specific for each isoform. However, there are several known small molecule inhibitors
of the CYP3A subfamily. When used in low concentrations (≤ 1 µM), ketoconazole is an
accepted small molecule specific inhibitor of CYP3A.59
The mechanism of this inhibitor is quite
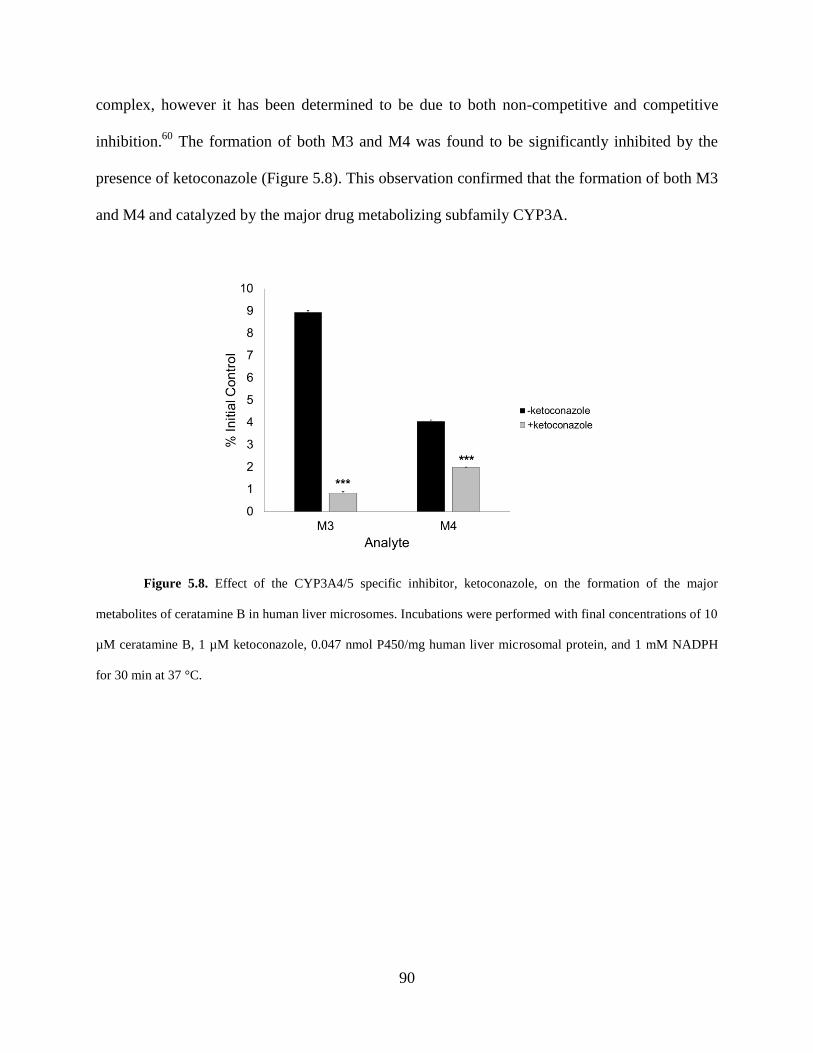
90
complex, however it has been determined to be due to both non-competitive and competitive
inhibition.60
The formation of both M3 and M4 was found to be significantly inhibited by the
presence of ketoconazole (Figure 5.8). This observation confirmed that the formation of both M3
and M4 and catalyzed by the major drug metabolizing subfamily CYP3A.
Figure 5.8. Effect of the CYP3A4/5 specific inhibitor, ketoconazole, on the formation of the major
metabolites of ceratamine B in human liver microsomes. Incubations were performed with final concentrations of 10
µM ceratamine B, 1 µM ketoconazole, 0.047 nmol P450/mg human liver microsomal protein, and 1 mM NADPH
for 30 min at 37 °C.
91
6.0 CONCLUSION
In conclusion, the ceratamines represent a novel class of structurally simple microtubule
perturbagens. They have great potential in the field of cancer drug discovery and possibly in the
treatment of various tauopathies, such as Alzheimer’s Disease.29
This work signifies the first
pharmacokinetic study of these compounds, greatly contributing to their pre-clinical
development. The fate of the ceratamines has been determined in both rat and human liver
microsomes. A thorough structure evaluation was performed using a variety of analytical
techniques including LC-MS/MS, UV spectroscopy, and NMR spectroscopy. The phase I
metabolites were determined to form as the result of N-dealkylation, O-dealkylation, and/or
monooxygenation along the dibrominated aromatic moiety. A species comparison revealed
significant differences in the preferred site of metabolism. In rats, the major metabolites for each
of the ceratamines resulted from a demethylation at the aminoimidazole, suggesting this is the
most metabolically labile site. However, in human liver microsomes the major metabolites for
each compound both involved structural changes on the dibrominated aromatic moiety.
An assay was also developed in order to estimate the metabolic stability of the
ceratamines in rat and human liver microsomes. Ceratamines A and B were both found to have a
high clearance in rats, however they were observed to be more stable in human liver
microsomes, with an estimated clearance category of low and moderate, for ceratamine A and B
respectively.
92
Finally, the formation of the two major metabolites of ceratamine B in human liver
microsomes were both determined to be cytochromes P450 mediated. An isozyme mapping
experiment with various recombinant P450s suggested that the major drug metabolizing
subfamily, CYP3A, was responsible for the formation of both metabolites. This was confirmed
by performing incubations with the CYP3A specific small molecule inhibitor, ketoconazole.
93
7.0 FUTURE DIRECTIONS
Based on the initial investigation of the metabolism of each compound, the conclusion of this
study is that the ceratamines are potential drug candidates for the treatment of cancer and
perhaps tauopathies. Although the results of this project have made significant contributions to
the development of the ceratamines as drugs, due to the highly collaborative nature of the drug
discovery process, there is a plethora of additional studies that need to be performed.
The interest in the development of the ceratamines can be attributed to their unique, yet
simple, structures and the fact that they do not compete for the taxol binding site, suggesting the
possibility of use in combination therapies to overcome the challenge of acquired drug
resistance. The potential of the ceratamines as a substrate for the P-glycoprotein efflux pump and
their ability to penetrate the blood-brain barrier (BBB) should also be evaluated. If they are
found to not be substrates of P-glycoprotein and can cross the BBB, their pre-clinical
development could gain even more momentum. The identification of the specific binding site of
the ceratamines within tubulin is also of great importance as this may reveal a novel binding
pocket that can be used as a target for the discovery of additional microtubule stabilizers.
In terms of pre-clinical development there are numerous studies that could be performed.
These include the expansion of metabolism studies, comprising those that investigate phase II
metabolism and the use of in vitro systems that have a higher in vivo correlation such as human
hepatocytes and precision cut liver slices. The major metabolites identified within each species

94
analyzed should also be evaluated for biological activity and toxicity. These studies could reveal
if the structures of the ceratamines need to be further optimized before reaching clinical
development. Finally, the effect of the ceratamines on the activity of major drug metabolizing
enzymes should also be investigated, allowing for the prediction of additional drug-drug
interactions.
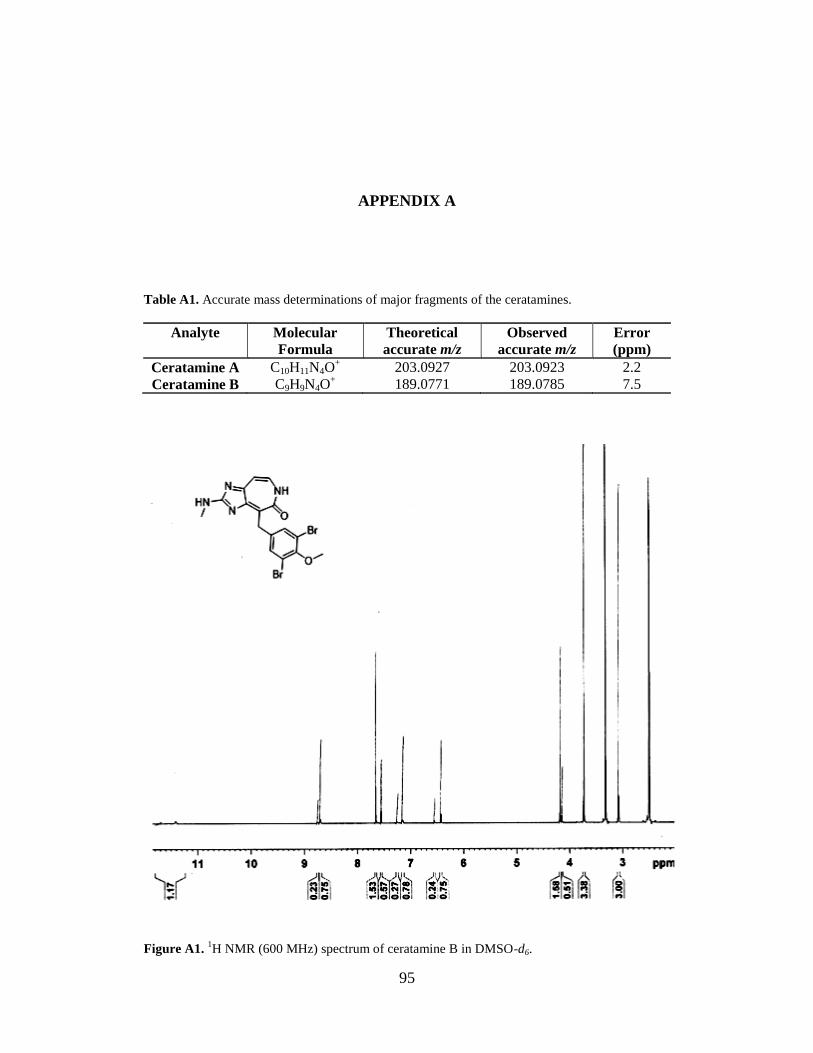
95
APPENDIX A
Table A1. Accurate mass determinations of major fragments of the ceratamines.
Analyte Molecular
Formula
Theoretical
accurate m/z
Observed
accurate m/z
Error
(ppm)
Ceratamine A C10H11N4O+
203.0927 203.0923 2.2
Ceratamine B C9H9N4O+ 189.0771 189.0785 7.5
Figure A1.
1H NMR (600 MHz) spectrum of ceratamine B in DMSO-d6.
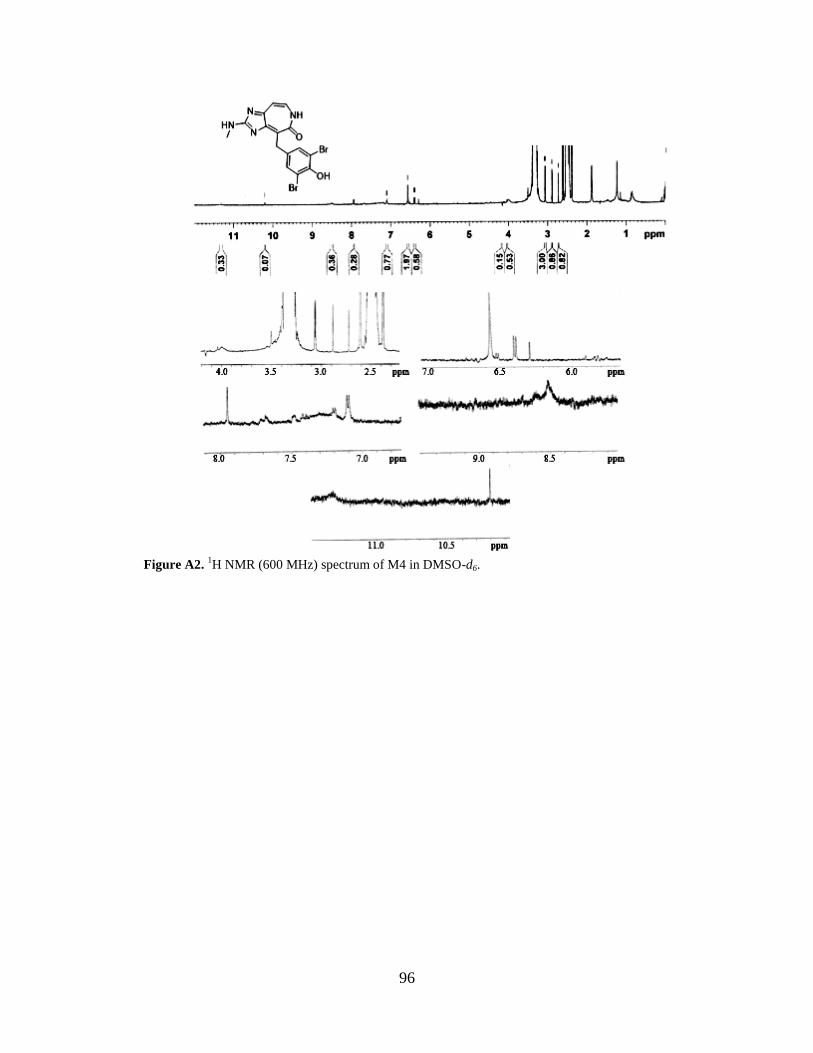
96
Figure A2.
1H NMR (600 MHz) spectrum of M4 in DMSO-d6.

97
Figure A3. 1H NMR (600 MHz) spectrum of M6 in DMSO-d6.
Figure A4. (A) [M+H]+ ion clusters and (B) CID product ions of M10 formed by human liver microsomes.

98
Figure A5. (A) [M+H]+ ion clusters and (B) CID product ions of M3 formed by human liver microsomes.

99
REFERENCES
1. Li, J. and Vederas, J., Science, 2009, 325, 161-165.
2. Newman, D.J., J. Nat. Prod., 2004, 67, 1216-1238.
3. Molinski, T.; Dalisay, D.; Lievens, S.; Saludes, J., Nat. Rev., 2009, 8, 69-85.
4. Carte, B., BioScience, 1996, 46, 271-286.
5. Usami, Y. Mar. Drugs, 2009, 7, 314-330.
6. Haefner, B., Drug Discovery Today, 2003, 8, 536-544.
7. Nastrucci, C.; Cesario, A.; Russo, P., Recent Patents in Anticancer Drug Discovery, 2012, 7,
218-232.
8. Jordan, M.; Wilson, L., Nat. Rev. Cancer, 2004, 4, 253-265.
9. Cooper, G., The Cell: A molecular approach, 2nd
ed., Sunderland, MA, 2000.
10. Nogales, E.; Wolf, S.; Downing, K., Nature, 1998, 391, 199-203.
11. Conde, C. and Cáceres, A., Nat Rev Neurosci, 2009, 9, 319-332.
12. Kirschner, M.; Mitchison, T., Cell, 1986, 45, 329-342.
13. Amos, L., Curr. Opin. Struct. Biol., 2000, 10, 236-241.
14. Ravelli, R.; Gigant, B.; Curmi, P.; Jourdain, I.; Lachkar, S.; Sobel, A.; Knossow, M., Nature,
2004, 428, 198-202.
15. Roychowdhury, S.; Panda, D.; Wilson, L.; Rasenick, M., J. Biol. Chem., 1999, 274, 13485-
13490.
16. Wittman, T; Hyman, A.; Desai, A., Nat. Cell Biol., 2001, 3, 28-34.
17. Walczak, C.; Cai, S.; Khodjakov, A., Nat Rev Mol Cell Biol, 2010, 11, 91-102.
18. Gigant, B.; Wang, C.; Ravelli, R.; Roussi, F.; Steinmetz, M.; Curmi, P.; Sobel, A.; Knossow,
M., Nature, 2005, 435, 519-522.
19. Löwe, J.; Li, H.; Downing, K.; Nogales, E., J. Mol. Biol., 2001, 313, 1045-1057.
20. Bhattacharyya, B.; Panda, D.; Gupta, S.; Banerjee, M., Med. Res. Rev., 2008, 28, 155-183.
21. Cragg, G., Med. Res. Rev., 1998, 18, 315-331.
22. Han, Y.; Malak, H.; Chaudhary, A.; Chordia, M.; Kingston, D.; Bane, S., Biochemistry, 1998,
37, 6636-6644.
23. Hari, M.; Loganzo, F.; Annable, T.; Tan, X.; Musto, S.; Morilla, D.; Nettles, J.; Snyder, J.;
Greenberger, L., Mol. Cancer Ther., 2006, 5, 270-278.
24. Checci, P.; Nettles, J.; Zhou, J.; Snyder, J.; Joshi, H., TRENDS Pharmacol. Sci., 2003, 24,
361-365
25. Mitchison, T., Mol Biol Cell, 2012, 23, 1-6.
26. Orr, G.; Verdier-Pinard, P.; McDaid, H.; Horwitz, S., Oncogene, 2003, 22, 7280-7295.
27. Yin, S.; Bhattacharya, R.; Cabral, F., Mol Cancer Ther, 2010, 9, 327-335.
28. Gottesman, M., Annu Rev Med, 2002, 53, 615-627.

100
29. Ballatore, C.; Brunden, K.; Huryn, D.; Trojanowski, J.; Lee, V.; Smith, A., J. Med. Chem.,
2012, 55, 8979-8996.
30. Roberge, M.; Cinel, B.; Anderson, H.; Lim, L.; Jiang, X.; Xu, L.; Bigg, C.; Kelly, M.;
Andersen, R., Cancer Res., 2000, 60, 5052-5058.
31. Manzo, E.; Van Soest, R.; Matainaho, L.; Roberge, M.; Andersen, R., Org. Lett., 2003, 5,
4591-4594.
32. Koehn, F.; Carter, G., Nat. Rev. Drug Discovery, 2005, 4, 206-220.
33. Karjala, G.; Can, Q.; Manzo, E.; Andersen, R.; Roberge, M., Cancer Res., 2005, 65, 3040-
3043.
34. Hall, D.; Minton, A., Anal. Biochem., 2005, 345, 198-213.
35. Coleman, R.; Campbell, E.; Carper, D., Org. Lett., 2009, 11, 2133-2136.
36. Bell, S., Forensic Chemistry, Prentice Hall, 2005.
37. Coleman, M., Human Drug Metabolism: An Introduction, Wiley, 1st ed., 2005.
38. Levine, B., Principles of Forensic Toxicology, American Association for Clinical Chemistry,
2nd
ed., 2006.
39. Thomas, G., Medicinal Chemistry; John Wiley & Sons Ltd.: West Sussex, England, 2007.
40. Josephy, P.; Mannervik, B., Molecular Toxicology, Oxford University Press, 2nd
ed., 2006.
41. Hariparsad, N.; Sane, R.; Strom, S.; Desai, P., Toxicol. in Vitro, 2006, 20, 135-153.
42. Brandon, E.; Raap, C.; Meijerman, I.; Beijnen, J.; Schellens, J., Toxicol. Appl. Pharmacol.,
2003, 189, 233-246.
43. Smith, S.; Dello Buono, M.; Carper D.; Coleman, R.; Day, B.; J. Nat. Prod., 2014, 77, 1572-
1578.
44. Pasto, D.; Johnson, C., Organic Structure Determination; Prentice-Hall, Inc.: Englewood
Cliffs, NJ, 1969, p. 83-108.
45. Martignoni, M.; Groothuis, G.; de Kanter, R., Exp Opin Drug Met Tox, 2006, 26, 875-894.
46. Guengerich, F., Chem-Biol Interact, 1997, 106, 161-182.
47. NCBI PubChem Compound: Ceratamine A Chemical and Physical Properties,
http://pubchem.ncbi.nlm.nih.gov/summary/summary.cgi?cid=11488186&loc=ec_rcs#x27
website accessed: 06/17/2014.
48. NCBI PubChem Compound: Ceratamine B Chemical and Physical Properties,
http://pubchem.ncbi.nlm.nih.gov/summary/summary.cgi?cid=11201846&loc=ec_rcs#x27
website accessed: 06/17/2014.
49. Cheng, T.; Zhao, Y.; Li, X.; Lin, F.; Xu, Y.; Zhang, X.; Li, Y.; Wang, R., J. Chem. Inf.
Model, 2007, 47, 2140-2148.
50. Di, L.; Kerns, E.; Hong, Y.; Kleintop, T.; McConnel, O.; Huryn, D., J. Biomol. Screen, 2003,
8, 453-462.
51. Komura, H.; Kawase, A.; Masahiro, I., J. Pharm. Sci., 2005, 94, 2656-2666.
52. Chen GM, Hu N, Xie SS, Wang P, Li J, Xie L, Wang GJ, Liu XD, Xenobiotica, 2011, 11,
494-500.
53. Hermans, J. and Thijssen, H., Xenobiotica, 1991, 21, 295-307.
54. Jones, S.; Moore, L.; Shenk, J.; Wisely, G.; Hamilton, G.; McKee, D.; Tomkinson, N.;
LeCluyse, E.; Lambert, M.; Wilson, T.; Kliewer, S.; Moore, J., Mol Endocrinol, 2000, 14, 27-
39.
55. Xie W., Structure and function of PXR and CAR in Nuclear Receptors in Drug Metabolism,
John Wiley & Sons, Inc., Hoboken, NJ., 2006, p 147-164.
56. Zhang, D.; Luo, G.; Ding, X.; Lu, C., Acta Pharmaceutica Sinica B, 2012, 2, 549-561.

101
57. Nassar, A., Drug Metabolism Handbook: Concepts and Applications, John Wiley & Sons.
Hoboken, NJ, 2009, p. 461.
58. Vaclavikova, R.; Soucek, P.; Svobodova, L.; Ansenbacher, P.; Simek, P.; Guengerich, F.;
Gut, I., Drug Metab and Dispos, 2004, 32, 666-674.
59. Ortiz de Montellano, P. and Mathews, J., Biochem. J., 1981, 195, 761-764.
60. Williams, J.; Ring, B.; Cantrell, V.; Jones, D.; Eckstein, J.; Ruterbories, K.; Hamman, M.;
Hall, S.; Wrighton, S., Drug Metab. Dispos., 2002, 30, 883-891.
61. Khojasteh, S.; Prabhu, S.; Kenny, J.; Halladay, J.; Lu, A., Eur. J. Drug Metab.
Pharmacokinet., 2011, 36, 1-16.
62. Greenblatt, D.; Zhao, Y.; Venkatakrishnan, K.; Duan, S.; Harmatz, J.; Parent, S.; Court, M.;
von Moltke, L., J. Pharm. Pharmacol., 2011, 63, 214-221.