metabolic and epigenomic regulation of th17/treg …...perturbation of the polyamine pathway in th17...
TRANSCRIPT
1
Metabolic and Epigenomic Regulation of Th17/Treg Balance by the Polyamine Pathway
Chao Wang1,2,&,*, Allon Wagner3,4,&, Johannes Fessler1,&, Julian Avila-Pacheco2, Jim Karminski3,4, Pratiksha Thakore2, Sarah Zaghouani1, Kerry Pierce2, Lloyd Bod1, Alexandra Schnell1, David DeTomaso4, Noga Ron-Harel5, Marcia Haigis5, Daniel Puleston6, Erika Pearce6, Manoocher Soleimani7, Ray Sobel8, Clary Clish2, Aviv Regev2,9,10, Nir Yosef3,4,11,#,* & Vijay K. Kuchroo1,2,#,*
1 Evergrande center for immunologic diseases, Harvard Medical School and Brigham and Women’s Hospital, Boston, MA 02115, USA 2 Broad Institute of MIT and Harvard, Cambridge, MA 02142, USA 3 Department of electrical engineering and computer science, University of California, Berkeley, CA 94720, USA 4 Center for Computational Biology, University of California, Berkeley, CA 94720, USA 5 Department of Cell Biology, Harvard Medical School, Boston, MA 02115 6 Max Planck Institute of Immunobiology and Epigenetics, 79108 Freiburg, Germany 7 University of Cincinnati, OH, 45221, USA 8 Palo Alto Veteran’s Administration Health Care System and Department of Pathology, Stanford University School of Medicine, Stanford, CA
9 Howard Hughes Medical Institute, Department of Biology, Massachusetts Institute of Technology, Cambridge, MA 02140, USA 10 Koch Institute for Integrative Cancer Research, Massachusetts Institute of Technology, Cambridge, MA 02139, USA 11 Chan-Zuckerberg Biohub, San Francisco, CA 94158, USA 12 Ragon Institute of MGH, MIT, and Harvard, Cambridge, MA, USA & These authors contributed equally # These authors contributed equally * Correspondence to: [email protected], [email protected], [email protected]
author/funder. All rights reserved. No reuse allowed without permission. The copyright holder for this preprint (which was not peer-reviewed) is the. https://doi.org/10.1101/2020.01.23.911966doi: bioRxiv preprint
2
ABSTRACT
Cellular metabolism can orchestrate immune cell function. We previously demonstrated that
lipid biosynthesis represents one such gatekeeper to Th17 cell functional state. Utilizing
Compass, a transcriptome-based algorithm for prediction of metabolic flux, we constructed a
comprehensive metabolic circuitry for Th17 cell function and identified the polyamine pathway
as a candidate metabolic node, the flux of which regulates the inflammatory function of T cells.
Testing this prediction, we found that expression and activities of enzymes of the polyamine
pathway were enhanced in pathogenic Th17 cells and suppressed in regulatory T cells.
Perturbation of the polyamine pathway in Th17 cells suppressed canonical Th17 cell cytokines
and promoted the expression of Foxp3, accompanied by dramatic shift in transcriptome and
epigenome, transitioning Th17 cells into a Treg-like state. Genetic and chemical perturbation of
the polyamine pathway resulted in attenuation of tissue inflammation in an autoimmune disease
model of central nervous system, with changes in T cell effector phenotype.
author/funder. All rights reserved. No reuse allowed without permission. The copyright holder for this preprint (which was not peer-reviewed) is the. https://doi.org/10.1101/2020.01.23.911966doi: bioRxiv preprint
3
INTRODUCTION
Th17 cells and FoxP3+ regulatory T cells play a key role in maintaining the balance between
inflammatory and regulatory functions in the immune system. One key aspect is the balance
between Th17 and Treg cells. FoxP3+ Tregs play a critical role in maintaining immune tolerance,
highlighted by loss-of-function mutations in the Foxp3 gene in human, the master regulator of
Tregs, results in the development of IPEX syndrome where patients develop a series of
autoimmune pathologies (autoimmune enteropathy, type 1 diabetes, dermatitis) and die
prematurely. In contrast, Th17 cells have been shown to be critical for the induction of a number
of autoimmune diseases including psoriasis, psoriatic arthritis, ankylosing spondylitis, multiple
sclerosis and inflammatory bowel disease [1, 2]. While TGFβ alone can induce FoxP3+ Tregs in
vitro, the addition of proinflammatory cytokine IL-6 suppresses the generation of FoxP3+ T cells
and together with TGFβ induces generation of Th17 cells. This led to the hypothesis that
proinflammatory Th17 and regulatory FoxP3+ Tregs are reciprocally regulated, further supported
by experiments on the role of these two cytokines in the induction and differentiation of Th17
cells in vivo [3-6].
However, not all Th17 cells are pathogenic or disease inducing, and they also play a protective
role in mucosal tissues, promoting tissue homeostasis, maintaining barrier function as well as
preventing invasion of microbiota at the mucosal sites [7-12]. Th17 cells that are induced by
TGFb + IL-6 in vitro, produce IL-17 but are not capable of inducing potent tissue
inflammation/autoimmunity upon adoptive transfer [13-15]. Additional stimuli, such as IL-1b
and IL-23, are needed to evoke pathogenic potential in these Th17 cells [13, 14, 16-20].
Therefore, there appear to be at least two different types of Th17 cells: Th17 cells that are
author/funder. All rights reserved. No reuse allowed without permission. The copyright holder for this preprint (which was not peer-reviewed) is the. https://doi.org/10.1101/2020.01.23.911966doi: bioRxiv preprint
4
present at homeostasis and do not promote tissue inflammation that we have termed
nonpathogenic Th17 cells and the Th17 cells which produce IL-17 together with IFN-g and
GMCSF induce tissue inflammation and autoimmunity [21]. Different types of Th17 cells have
also been identified in humans where Th17 cells akin to mouse pathogenic Th17 cells have been
shown to be specific for Candida albicans and non-pathogenic Th17 cells have been shown to be
similar to Th17 cells that have specificity for Staphlococcus aureus infection [22]. Thus, Treg,
non-pathogenic Th17 cells and pathogenic Th17 cells represent a functional spectrum in tissue
homeostasis, disease and infection and can be differentiated reciprocally with different cytokine
cocktails in vitro. However, in addition to cytokines, how these cells are generated in vivo and
what are the factors that trigger their development of different functional states has not been fully
elucidated.
Cellular metabolism is a mediator and modulator of immune cell differentiation and function,
which we hypothesized may play a key role in this balance. In a previous study using scRNA-seq
of Th17 cells, we identified CD5L as a major regulator that co-varies in its expression with the
pro-inflammatory gene module in Th17 cells. Loss of CD5L made Th17 cells highly pathogenic
by altering lipid biosynthesis and transcriptional activity of RoR γt, the master transcription
factor critical for development and differentiation of Th17 cells [23]. This observation provided a
proof of concept that metabolic processes can be directly involved in gene regulation and
balancing proinflammatory and regulatory states of Th17 cells.
However, a full appreciation of metabolic circuitry and its connection with immune cell function
has been limited by available technologies that typically define the average metabolic state of a
large population of cells. We have developed a flux balance analysis algorithm called Compass
that allows prediction of metabolic state of a cell using transcriptome data at the single cell level,
author/funder. All rights reserved. No reuse allowed without permission. The copyright holder for this preprint (which was not peer-reviewed) is the. https://doi.org/10.1101/2020.01.23.911966doi: bioRxiv preprint

5
allowing comprehensive profiling of metabolic pathways even in a smaller number of cells that
could not be otherwise interrogated by traditional metabolomic techniques (accompanying
manuscript, Wagner et al, BioRxiv preprint). Here, we used the Compass algorithm to
interrogate the metabolic status of pathogenic and nonpathogenic Th17 cells using scRNA-seq
datasets of Th17 cells. We show that enzymes of the polyamine pathway are suppressed and
cellular polyamine content is significantly lower in regulatory T cells and non-pathogenic Th17
cells (Th17n) as compared to pathogenic Th17 cells (Th17p) due to alternative fluxing.
Perturbation of the polyamine pathway in Th17 cells suppressed canonical Th17 cytokines and
promoted Foxp3 expression, shifting the Th17 cell transcriptome in favor of a Treg-like state.
We demonstrated that the polyamine pathway is critical in maintaining the Th17-specific
chromatin landscape against the induction of Tregs-like program. Consistent with the cellular
phenotype, chemical inhibition and genetic perturbation of the polyamine pathway in T cells
restricted the development of autoimmune responses in the EAE model.
author/funder. All rights reserved. No reuse allowed without permission. The copyright holder for this preprint (which was not peer-reviewed) is the. https://doi.org/10.1101/2020.01.23.911966doi: bioRxiv preprint

6
RESULTS
Identifying the polyamine pathway as a candidate in regulating Th17 cell function
To better analyze the metabolic landscape of Th17 cells that may regulate their functional state,
we first used two approaches: untargeted metabolomics (Supplemental Figure 1) and standard
analysis of single-cell RNAseq data (Figure 1A, B). For both analyses, we compared Th17 cells
differentiated from naïve CD4+ T cells using two combinations of cytokines: IL-1b+IL-6+IL-23
(Th17p, pathogenic) and TGFb+IL-6 (Th17n, non-pathogenic) that we previously reported to
either promote or restrict Th17 cell pathogenicity respectively in the context of the EAE model,
and therefore represents the two extremes of functional state of Th17 cells [14, 23]. Untargeted
metabolomics identified 1,101 (out of 7,436) metabolic features to be differentially expressed
between Th17n and Th17p (BH-adjusted Welch t-test p < 0.05; Supplemental Figure 1). We
identified 52 of the differentially expressed metabolites, a third of which (19 / 52) are of lipid
nature, consistent with our previous finding that lipid biosynthesis is a key regulator of Th17 cell
functions [23], and the rest related to multiple amino-acid pathways. Next, we evaluated the
expression of metabolic enzyme genes (“metabolic transcriptome”) of sorted IL-17-GFP+ Th17
cells differentiated in vitro, which we previously profiled by scRNA-seq [24]. The distributions
of the computational pathogenicity signature scores (computed by expression of key cytokines
and transcription factors [14, 24]) of cells from the two conditions were readily distinguishable
(p < 3*10-16, two-sided Welch t-test). However, there was considerable variation across the
individual cells within each condition [23, 24], such that some of the cells from the Th17n
condition has higher pathogenicity scores than cells from the Th17p condition (Figure 1A), with
a minor distinctive mode of more pathogenic-like cells. This intra-population heterogeneity
highlights the benefit of studying the Th17n and Th17p populations at a single-cell level.
author/funder. All rights reserved. No reuse allowed without permission. The copyright holder for this preprint (which was not peer-reviewed) is the. https://doi.org/10.1101/2020.01.23.911966doi: bioRxiv preprint

7
Interestingly, many of the genes that most covaried with the genes associated with Th17 cell
function belonged to ancillary metabolic pathways (Figure 1B), as were most of the identified
differentially expressed metabolites, rather than the central and well-studied glycolysis pathway.
Next, to obtain a comprehensive view of the metabolic state of each cell despite the inability to
measure single cell metabolomic profiles, we investigated the metabolic circuitry of Th17 cells
using Compass (accompanying manuscript, Wagner et al, BioRxiv preprint; see Methods), with
the scRNA-seq profiles from sorted IL-17-GFP+ Th17 cells [24]. Briefly, Compass is a Flux
Balance Analysis (FBA)-based algorithm [25, 26] and utilizes a comprehensive compendium of
thousands of metabolic reactions, their stoichiometry, and the enzymes catalyzing them [27].
Compass models in silico the fluxes through the network of metabolic reactions, while
accounting for the observed expression levels of enzyme-coding transcripts in each cell. It does
so by optimizing a series of objective functions, each corresponding to an individual metabolic
reaction (rather than a single FBA objective such as biomass production). The result of the
optimization procedure is a score for each reaction in each cell, indicative of the potential of the
cell to direct flux through that reaction, given the transcriptome of that cell. The Compass scores
matrix is then subject to downstream analysis, while relying on the statistical power afforded by
scRNA-Seq to derive biological insight from the high-dimensional matrix.
Analysis of the Compass scores for each reaction across all single cells in our data (Figure 1C)
showed that among those metabolic reactions significantly correlated with Th17 cell
pathogenicity, the polyamine pathway stood out as one that is differentially activated in
pathogenic vs. nonpathogenic Th17 cells (Figure 1C and Supplemental Table 1). To explore
author/funder. All rights reserved. No reuse allowed without permission. The copyright holder for this preprint (which was not peer-reviewed) is the. https://doi.org/10.1101/2020.01.23.911966doi: bioRxiv preprint

8
this, we constructed a data-driven metabolic network anchored around putrescine, the entrance
metabolite into the canonical polyamine synthesis, by including adjacent metabolites whose
reactions are predicted to be negatively associated with pathogenicity (Figure 1D). While
several polyamine-associated genes (e.g., Sat1 in Figure 1B) are differentially expressed
between Th17p and Th17n, the network tied the differential polyamine metabolism to
differences in upstream and downstream metabolic reactions which could not be captured from
differential gene expression directly. Specifically, Compass predicted that Th17n cells are more
active in arginine metabolic pathways, lying upstream of putrescine, and in alternative fates of
putrescine (other than conversion to spermidine, along the canonical polyamine synthesis
pathway) (Figure 1D). We hypothesized that the arginine/polyamine pathway may be a
metabolic bifurcation point that can regulate Th17 cell function and set out to investigate this
metabolic network surrounding polyamines.
Cellular polyamines are suppressed in regulatory T cells and nonpathogneic Th17
To investigate the polyamine metabolic process (Figure 1E), we first asked whether critical
enzymes of this pathway are differentially expressed in different CD4+ T cell subsets using
qPCR. Ornithine Decarboxylase 1 (ODC1) and Spermidine/Spermine N1 Acetyltransferase 1
(SAT1) are the rate-limiting enzymes of polyamine biosynthesis and catabolic processes,
respectively, and Ornithine decarboxylase antizyme 1 (OAZ1) can regulate the enzymatic
activity of ODC1. ODC1 catalyzes ornithine to putrescine, the first step of the polyamines
biosynthesis; SAT1 regulates the intracellular recycling of polyamines and their transport out of
the cell. SAT1, but not ODC1 or OAZ1, was suppressed in Th17n vs. Th17p cells (Figure 1F and
data not shown). Intriguingly, both ODC1 and SAT1 expression was lower in Tregs, whereas
author/funder. All rights reserved. No reuse allowed without permission. The copyright holder for this preprint (which was not peer-reviewed) is the. https://doi.org/10.1101/2020.01.23.911966doi: bioRxiv preprint

9
Ass1, an enzyme upstream of the polyamine biosynthesis pathway is upregulated, consistent with
Compass-predicted alternative flux in the polyamine neighborhood (Figure 1F). Collectively,
these data suggest the polyamine pathway may be associated with functional state beyond Th17
cells.
As the polyamine pathway, similar to most metabolic pathways, is regulated beyond the
transcriptional level, we next directly measured total cellular polyamine content using an
enzymatic assay (Methods). Compared to Th17p cells, Tregs and Th17n cells have significantly
reduced levels of total polyamines (Figure 1G), reflective of either reduced import, biosynthesis
or increased export of polyamines in these cells.
To further investigate the concentrations and activities of different polyamines in Th17 cells at
different functional states, we applied both targeted metabolomics and carbon tracing. We
differentiated Th17n and Th17p cells for 68 hours (Methods) and measured the amount of
polyamines and related precursors in cell and media by LC/MS (Figure 1H and S1B). Consistent
with Compass’s predictions, there was higher creatine content in Th17n vs. Th17p cells. On the
other hand, while the total amount of cellular ornithine, precursor to polyamines, was
comparable between Th17n and Th17p cells, there was a significant increase of putrescine and
acetyl-putrescine content in Th17p cells (Figure 1H), indicative of increased activity of this
pathway in Th17p cells, consistent with the enzymatic assay. Of note, cellular spermidine (or
acetyl-spermidine) content was not different between the conditions, and spermine was not
detected (Figure 1H). The reduced putrescine and its acetyl form in Th17n cells are not due to
increased export, as we observed very little polyamines in the media in either Th17n or Th17p
author/funder. All rights reserved. No reuse allowed without permission. The copyright holder for this preprint (which was not peer-reviewed) is the. https://doi.org/10.1101/2020.01.23.911966doi: bioRxiv preprint

10
cells (Supplemental Figure 1B). These data suggest that polyamines accumulate within Th17p
cells and the main function of SAT1 in Th17p cells may be to recycle rather than to export
polyamines.
To directly investigate polyamine biosynthesis, we cultured differentiated Th17n and Th17p cells
in the presence of low amount of carbon or hydrogen labeled arginine or citrulline, which can be
used to synthesize ornithine, precursor to the polyamine pathway (Supplemental Figure 1C, D).
First, we harvested cells and media for LC/MS at 0, 1, 5 and 24 hours post addition of arginine.
While there was comparable accumulation of labeled cellular guanidinoacetic acid, a byproduct
of arginine conversion into ornithine, in Th17n and Th17p cells over time (Supplemental
Figure 1C), Th17p cells accumulated higher intracellular amounts of putrescine,
acetylputrescine and acetylspermidine, consistent with increased polyamine biosynthesis and/or
recycling activity in these cells (Supplemental Figure 1C). Conversely, there were higher levels
of labeled arginine in Th17n cells vs. Th17p cells, prompting us to investigate whether Th17n
cells can better synthesize (as opposed to better uptake) arginine, which would be consistent with
increased ASS1 expression (Figure 1F) in these cells. To this end, we harvested cells for LC/MS
24 hours after addition of labeled citrulline, a precursor to arginine synthesis. Indeed, there was
higher accumulation of labeled arginine in Th17n cells (Supplemental Figure 1D). Collectively,
our targeted metabolomics and carbon tracing data suggest that Th17n cells accumulate arginine,
consistent with Compass’s prediction (Figure 1D), and that Th17p cells preferentially synthesize
or recycle polyamines. We conclude that differences in the alternative flux hinged on polyamine
biosynthesis is associated with the different functional states of Th17 cells.
author/funder. All rights reserved. No reuse allowed without permission. The copyright holder for this preprint (which was not peer-reviewed) is the. https://doi.org/10.1101/2020.01.23.911966doi: bioRxiv preprint

11
ODC1 or SAT1 inhibition restricts Th17 cell function in a putrescine-dependent manner
To investigate the functional relevance of these metabolic changes, we studied the effects of
polyamine pathway inhibitors on differentiation of pathogenic and nonpathogenic Th17 cells in
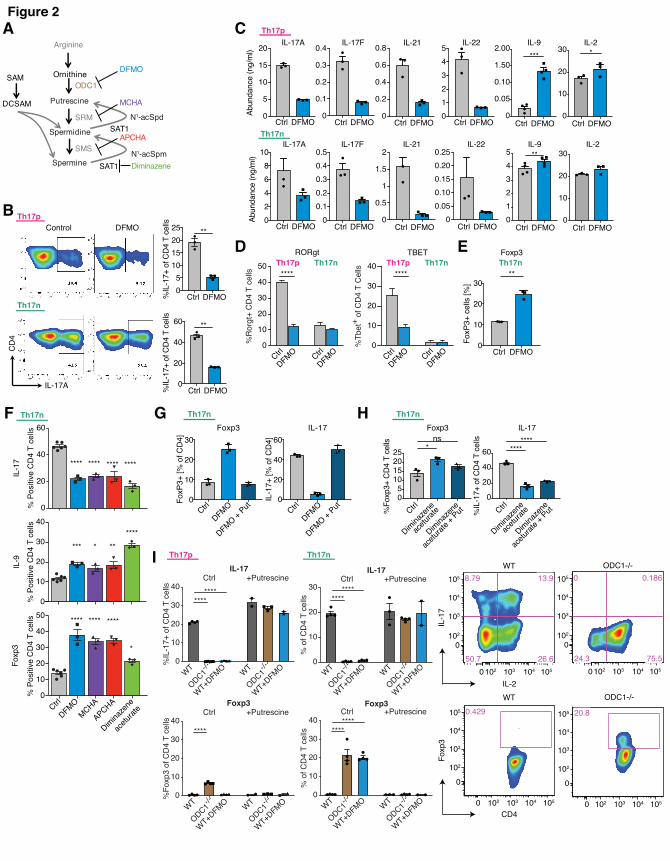
vitro, using previously defined culture conditions. We first used difluoromethylornithine
(DFMO), an irreversible inhibitor of ODC1 (Figure 2A), the enzyme that catalyzes the
conversion of ornithine to putrescine. Enzymatic assays of in vitro differentiated Th17n, Th17p,
or iTreg cells treated by DFMO comfirmed its suppression of polyamines in all three cell types
(Supplemental Figure 2A). At an optimized concentration where we observed similar viability
between control and treatment, DFMO significantly inhibited IL-17 expression in both Th17n
and Th17p cells by intracellular staining and flow cytometry (Figure 2B), as well other
canonical Th17 cytokines such as IL-17A, IL-17F, IL-21 and IL-22, while promoting IL-9
expression in supernatant from both Th17n and Th17p cultures (Figure 2C). DFMO did not
consistently influence, IFNg, TNFa, IL-13, IL-10 or IL-5 expression (Supplemental Figure 2B).
IL-17 inhibition does not appear to be solely related to regulation of IL-2 production [28], as
DFMO promoted IL-2 expression in supernatant from only Th17p, but not Th17n cells (Figure
2C). Polyamines can influence cell proliferation. While we did observe reduced cell proliferation
in cultures treated with DFMO, the frequency of IL-17+ cells was significantly reduced in cells
that have divided just once (data not shown), suggesting DFMO can regulate Th17 cell function
independent of cellular proliferation. The increase in IL-9 following DFMO treatment also
supports the hypothesis that DFMO is not universally inhibiting viability of Th17 cells and
enhances Th9 derived cytokines.
author/funder. All rights reserved. No reuse allowed without permission. The copyright holder for this preprint (which was not peer-reviewed) is the. https://doi.org/10.1101/2020.01.23.911966doi: bioRxiv preprint

12
To determine whether DFMO inhibited Th17 cell differentiation, we measured the expression
and activity of key transcription factors. Interestingly, DFMO suppressed Rorgt and Tbet
expression in Th17p but not Th17n cells (Figure 2D), suggesting a nuanced effect. Consistently,
DFMO decreased pStat3, and not total Stat3 protein levels, only in Th17p but not Th17n cells
(Supplemental Figure 2C). IL-17 inhibition is not due to increased Foxo1 activity, another
critical regulator of Th17 cell function, as DFMO promoted pFoxo1(S256) in both types of Th17
cells, which would have resulted in a net increase in IL-17 expression (Supplemental Figure
2C). Given the known reciprocal relationship between Th17 cells and Tregs, and as DMFO also
impacted polyamine concentration in Tregs, we asked whether DFMO can regulate Foxp3
expression in Th17 cells, even under Th17 differentiation conditions. We observed increased
frequency of Foxp3+ cells in Th17n but not Th17p conditions (Figure 2E), presumably because
TGFb is required for the differentiation in this condition and DFMO strengthens TGFb derived
activity to induce Treg differentiation over Th17 cells.
To determine whether other enzymes of the polyamine pathway could play a similar role in
regulating Th17 cell function, we used inhibitors of spermine synthase (SRM), spermidine
synthase (SMS), and SAT1 (Figure 2A). Similar to DFMO, inhibitors of any of the polyamine
biosynthesis enzymes resulted in suppression of IL-17 and upregulation of IL-9 and Foxp3
expression, the latter in Th17n cells (Figure 2F). Furthermore, inhibiting SAT1 by diminazene, a
rate-limiting enzyme of polyamine acetylation and recycling, had similar effects to DFMO
(Figure 2F). SAT1 perturbation was previously reported to have a feedback effect on ODC1
activity and vice versa [29-31]. Consistent with this finding, inhibition with DFMO consistently
author/funder. All rights reserved. No reuse allowed without permission. The copyright holder for this preprint (which was not peer-reviewed) is the. https://doi.org/10.1101/2020.01.23.911966doi: bioRxiv preprint

13
suppressed SAT1 expression in both Th17n and Th17p cells (Supplemental Figure 2D). Thus,
it may be the flux of polyamines and not metabolites per se that modulate Th17 cell function.
Finally, we confirmed that the effect of DFMO is through the inhibition of ODC1, as addition of
putrescine to cells treated with DFMO completely reversed their phenotype (Figure 2G).
Interestingly, addition of putrescine during SAT1 inhibitor treatment also partially reversed the
upregulation of Foxp3, but not suppression of IL-17 (Figure 2H), suggesting putrescine flux
may be particularly important in the control of the regulatory program in Th17 cells. Overall, the
inhibitor data are consistent with a role of the polyamine pathway in regulating Th17 cell
differentiation, but genome-wide profiling would be necessarily to further support this claim.
ODC1-/- Th17 cells promoted Foxp3 expression
To further confirm the effects of chemical inhibition of polyamine pathway on Th17/Treg
differentiation, we tested the impact of genetic perturbation of ODC1 on the differentiation and
functions of Th17 cells, using cells isolated from WT and ODC1-/- mice. Similar to DFMO
treatment, there was complete inhibition of Th17 canonical cytokines, such as IL-17A, IL-17F
and IL-22, but not IFNg, in ODC1-/- Th17 cells (Figure 2I upper panel and S2E). ODC1
deficiency did not lead to a decrease in Rorgt expression (data not shown), but there was a
dramatic loss of Th17 canonical cytokines, consistent with loss of the Th17 program.
Furthermore, ODC1-/- Th17n cells upregulated Foxp3 expression, consistent with promotion of a
Treg program (Figure 2I, lower panel). Finally, all the observed effects of ODC1-/- were rescued
by addition of putrescine (Figure 2I and S2E).
author/funder. All rights reserved. No reuse allowed without permission. The copyright holder for this preprint (which was not peer-reviewed) is the. https://doi.org/10.1101/2020.01.23.911966doi: bioRxiv preprint
14
DFMO restricts Th17-cell transcriptome and epigenome in favor of Treg-like state
To gain mechanistic insight on the effects of inhibiting polyamine biosynthesis in Th17 cells, we
profiled by RNA-Seq Th17n, Th17p, and iTreg cells treated with DFMO or control. DFMO had
a profound impact on the transcriptome of all Th cell lineages, driving Th17 cells towards Treg
cell profiles in Principal Components Analysis (PCA) (Figure 3A, PC1). To gain further
insights, we determined the aggregate effect of DFMO on genes up-regulated (n= 1,284), down-
regulated (n= 1,255) or comparable ( n= 8,257) in Th17 vs. Treg cells (Figure 3B). In both Th17n
and Th17p cells, DFMO suppressed the Th17 cell specific gene set, and promoted the Treg-
specific transcriptome (Figure 3C, Supplemental Table 2 and 3). Specifically, canonical Th17
cell genes such as Il17a, Il17f and Il23r were significantly suppressed, whereas Treg related
genes, such as Foxp3, were upregulated (Figure 3B). There was no significant effect of DFMO
treatment on genes expressed comparably in Th17 cells and Treg, nor did DFMO have an effect
in Treg cells (Figure 3B and 3C). These results are consistent with a model where the
polyamine pathway is important for restricting the iTreg-like program in Th17 cells at both
functional states (Figure 3A).
The profound impact of DFMO on the transcriptome prompted us to investigate the mechanism
by which the polyamine pathway regulates Th17 cell functions. As DFMO does not appear to
consistently restrict phosphorylation of key Th17 cell regulators, particularly not in Th17n cells
(Supplemental Figure 2C), we hypothesized that polyamines may impact the epigenome.
Consistent with a role of the polyamine pathway in affecting chromatin modification, we
observed significant changes in expression of many chromatin modifiers (Supplemental Figure
3A).
author/funder. All rights reserved. No reuse allowed without permission. The copyright holder for this preprint (which was not peer-reviewed) is the. https://doi.org/10.1101/2020.01.23.911966doi: bioRxiv preprint
15
To test this hypothesis, we measured chromatin accessibility by ATAC-seq in Th17n and iTregs
cells treated with either control or DFMO (Methods). Overall, DFMO treatment resulted in
considerable changes in accessible peaks in both types of Th cells (Supplemental Figure 3B
and Supplemental Table 4A and 4B). Next, we asked whether DFMO preferentially altered
accessibility to regions specific to Th17 cells and iTregs. To this end, we partitioned all
accessible peaks into (1) those more accessible in Th17 cells (n = 10,431), (2) more accessible in
iTregs (n = 3,421), and (3) comparably accessible in both (n = 34,591) (Figure 3D,
Supplemental Table 3, and Methods). Consistent with the expression changes, following
DFMO treatment there was a significant shift towards less accessibility in Th17 specific regions
and more accessibility in Treg specific regions (Figure 3D and Supplemental Table 3).
Differentially accessible regions were found near loci encoding key effector molecules
(Supplemental Table 4A and 4B). For instance, DFMO treatment significantly restricted peaks
in the promoter and intergenic regions of Il17a-Il17f that corresponds to Rorgt binding site
(using ChIP-seq data from [32]) known to regulate IL17 expression (Figure 3E). Thus, DFMO
treatment can shape chromatin accessibility in favor of an iTreg epigenomic landscape, and this
may contribute to the emergence of iTreg transcriptional program in DFMO-treated Th17 cells.
The chromatin regulator JMJD3 partially mediates the polyamine-dependent effect on
Th17 cells
To investigate which transcription factors (TFs) may be responsible for the suppression of the
Th17 specific program and upregulation of the iTreg program, we looked for putative binding
sites (based on DNA binding motifs or ChIP-seq data when available) that significantly overlap
author/funder. All rights reserved. No reuse allowed without permission. The copyright holder for this preprint (which was not peer-reviewed) is the. https://doi.org/10.1101/2020.01.23.911966doi: bioRxiv preprint
16
with regions whose accessibility is modulated by DFMO (Figure 3F and Supplemental Table
5). We restricted our analysis to genomic regions that are typically accessible only in Tregs
(compared to Th17 cells) and may be modulated by DFMO (Figure 3F and Supplemental
Figure 3C). In Th17n cells, DFMO increased accessibility near potential binding sites of the
chromatin regulator JMJD3 along with a number of POU-domain containing TFs.
As JMJD3 is a known regulator of T cell plasticity [33], we tested whether it also contributes to
the genome-wide shifts induced by DFMO. We analyzed the effect of DFMO on Th17 cells
differentiated from naïve CD4 T cells isolated from control or JMJD3fl/flCD4cre mice (Figure
3G). Supporting our hypothesis, the upregulation of Foxp3 by DFMO in Th17n cells was
partially abrogated in the absence of JMJD3, and loss of JMJD3 also reduced the DFMO-
dependent upregulation of IL-10 in Th17n cells (Figure 3G).
Perturbation of ODC1 and SAT1, key enzymes of the polyamine pathway, alleviates EAE
To investigate the relevance of the polyamine pathway in vivo, we took two approaches to
perturbing it in the context of CNS autoimmune disease, EAE: chemical inhibition of ODC1 and
T-cell specific genetic deletion of SAT1 (Figure 4). As targeting multiple nodes in the
polyamine pathway resulted in upregulation of Foxp3 during Th17 differentiation in vitro
(Figure 2 and 3), we hypothesized that targeting rate-limiting enzymes in polyamine pathway in
vivo would regulate induction of EAE.
We first tested ODC1 inhibition by adding DFMO in the drinking water for mice immunized
with MOG/CFA for the induction of EAE (Methods). DFMO significantly delayed the onset and
author/funder. All rights reserved. No reuse allowed without permission. The copyright holder for this preprint (which was not peer-reviewed) is the. https://doi.org/10.1101/2020.01.23.911966doi: bioRxiv preprint

17
severity of EAE (Figure 4B). Consistently, we observed a significantly reduced antigen-specific
recall response in the draining lymph node of DFMO treated animals (Figure 4C). Further
analysis of lymphocytes isolated from the CNS showed no difference in the frequency of
cytokine producing cells, but increased frequency of Foxp3+ CD4+ T cells out of all CD4 T cells
(Figure 4D and data not shown), consistent with the polyamine biosynthesis pathway as an
important positive regulator of the balance between proinflammatory Th17 cells and Foxp3+
Tregs and induction of autoimmune CNS inflammation, which is highly dependent on Th17
cells.
Since administering DFMO in the drinking water could affect multiple cell types, we also
genetically deleted SAT1, the rate limiting enzyme of the polyamine pathway, in CD4+ T cells
(SAT1fl/flCD4cre). We confirmed that genetic deletion of SAT1 in T cells resulted in loss of
polyamine acetylation as reflected in reduced levels of acetyl-putrescine and acetyl-spermidine
(Figure 4E). Notably, loss of SAT1 also resulted in reduced level of putrescine in Th17 cells,
likely through a feedback mechanism. This is consistent with reports in other cell types [31] and
our in vitro inhibitor data (Supplemental Figure 2), suggesting similar effect of DFMO and
SAT1 deletion in the context of T cell biology may be due to overall changes in polyamine flux.
Indeed, we observed significantly delayed onset and severity of EAE in SAT1fl/flCD4cre mice
(Figure 4F). Similar to global inhibition of ODC1 by DFMO treatment, we observed an
inhibition of antigen-specific recall responses as measured by T cell proliferation (Figure 4G).
Although we did not observe significant differences in cytokine production (Figure 4H and
Supplemental Figure 4A), there was a trend towards a decrease in IFN-g, IL-17 and TNF
production with an increase in IL-9 production in response to antigen (Figure 4H). Furthermore,
author/funder. All rights reserved. No reuse allowed without permission. The copyright holder for this preprint (which was not peer-reviewed) is the. https://doi.org/10.1101/2020.01.23.911966doi: bioRxiv preprint

18
there was a significant increase in the proportion of Foxp3+CD4+ T cells (out of all CD4 T cells)
and concomitant decrease of Rorgt+CD4+ T cells isolated from the target organ (CNS) of
SAT1fl/flCD4cre mice (Figure 4I). Notably, the frequencies of Foxp3+ or Rorgt+ cells are not
different in the draining lymph node (Supplemental Figure 4B), suggesting that the effect of
SAT1 on T cells may be amplified in tissue recall responses. Thus, using both chemical and
genetic perturbations at multiple levels, we demonstrated that the polyamine pathway is an
important mediator of autoimmune inflammation.
DISCUSSION
To understand the functional relevance of metabolic pathways in Th17 cells, we utilized
metabolomics, a novel computational algorithm (Compass, companion manuscript) and chemical
and genetic perturbation to investigate the functional metabolic networks that impact Th17
pathogenicity. In this study, we investigated in depth the metabolic circuitry centered around the
polyamine pathway. We demonstrated that 1) At the transcriptome level, Compass points to the
significance of the polyamine pathway as a top candidate in association with Th17 cell
pathogenicity and implicates reactions upstream and downstream of putrescine to be associated
with functional phenotype of Th17 cells; 2) As predicted by Compass and measured by
enzymatic assay and LC/MS metabolomics, we showed that Th17 cells at different functional
state have alternative metabolic flux anchored around arginine and putrescine, the precursor to
polyamines, and that both regulatory T cells and non-pathogenic Th17 cell have reduced cellular
content of polyamines; 3) Chemical targeting of multiple enzymes in the polyamine pathway and
genetic deletion of ODC1 resulted in suppression of the Th17 functional program and
upregulation of Foxp3 in a putrescine dependent manner; 4) Inhibiting polyamine biosynthesis
author/funder. All rights reserved. No reuse allowed without permission. The copyright holder for this preprint (which was not peer-reviewed) is the. https://doi.org/10.1101/2020.01.23.911966doi: bioRxiv preprint

19
shifts Th17 cells in favor of Treg-like transcriptome and epigenome; 5) Targeting ODC1 and
SAT1 both resulted in upregulation of Foxp3 in vivo and inhibition of effector Th17 cells and
regulation of EAE. Taken together, we have provided evidence supporting a critical role of the
polyamine pathway in suppressing regulatory program in Th17 cells.
Th17 cells are critical in inducing autoimmune inflammation. In fact, loss of all the components
in Th17 pathway including TGF-b, IL-6, IL-1 or IL-23 results in inhibition of Th17
differentiation, upregulation of FoxP3+ Tregs and suppression of EAE. Because of reciprocal
generation of Tregs vs. Th17 cells, the effects observed with the inhibition of polyamine pathway
may be unique to the diseases where Th17 cells are the effector cells. Whether the effect of
polyamine pathway can be generalized to other autoimmune diseases (e.g. autoimmune colitis or
type 1 diabetes), where Th1 or NK cells are the effectors, need to be further evaluated. In fact the
effects of blocking polyamine pathway in diverting Th17 differentiation to Treg phenotype was
much more profound in generating nonpathogenic Th17 (differentiation with TGFb) than in
pathogenic Th17 cells (differentiation with IL-1b and IL-23). This observation suggests that
inhibition of the pathway may have an effect that is unique to Th17 driven diseases.
The significance of the polyamine pathway in autoimmune diseases is further supported by
anecdotal data that polyamine levels are increased in several autoimmune diseases [34, 35] and it
is thought that aberrant polyamine metabolism can contribute to autoantigen stabilization [36].
Here we present a potential mechanism of how the polyamine pathway can regulate Th17/Treg
balance and impact development of autoimmunity. DFMO is an FDA-approved drug for cancer
therapy. We showed that DFMO has significant impact in curtailing EAE, providing the
author/funder. All rights reserved. No reuse allowed without permission. The copyright holder for this preprint (which was not peer-reviewed) is the. https://doi.org/10.1101/2020.01.23.911966doi: bioRxiv preprint
20
grounds/mechanism for drug repurposing. It should be noted that while targeting any enzyme in
the polyamine pathway resulted in similar effects in Th17 cells in vitro, genetic manipulation of
ODC1 and SAT1 are not identical in that while both ODC1 and SAT1 deletion promoted Foxp3
expression (Figure 2I and data not shown), ODC1 but not SAT1 suppressed Th17 cytokine
expression in vitro (Figure 2I and data not shown). Further studies are necessary to understand
the mechanistic difference within the polyamine pathway.
By studying the metabolic differences within the same lineage of effector Th17 cells, we
unexpectedly uncovered a central role of the polyamines in regulating Th17-Treg balance. This
study suggests a functional role of metabolic pathways beyond energy production. One of the
observations made in this study is the role that polyamine pathway plays in shaping the
epigenetic landscape of differentiating immune cells. In fact, looking at the ATACseq and
RNAseq profiles of Th17 cells activated in the presence of inhibitors of the polyamine pathway
shows profound global ATACseq changes concomitantly with changes in transcription,
differentiation and function. Polyamines appear to regulate gene expression, cell proliferation
and stress responses due to their ability to bind to nucleic acids (both DNA, RNA), alter
posttranslational modification and regulate ion channels [37, 38]. A number of studies have
suggested the role of polyamines in regulating gene expression due to their polycationic nature
and ability to function as a sink to S-adenosylmethionine and Acetyl-coA, both critical
metabolites for histone modifications [29, 30, 39, 40]. Furthermore, intracellular polyamines and
their analogues are also known to inhibit lysine-specific demethyltransferases such as LSD1 [41]
and thereby changing epigenetic landscape affecting development and differentiation. Thus, it
stands to reason that metabolic processes that impact polyamines will not only affect energetics
author/funder. All rights reserved. No reuse allowed without permission. The copyright holder for this preprint (which was not peer-reviewed) is the. https://doi.org/10.1101/2020.01.23.911966doi: bioRxiv preprint

21
but more broadly including shaping the epigenome and transcriptome by the resultant
metabolites that are produced during the process of development or differentiation. In this vein, a
number of developmental disorders (eg. Snyder-Robinson syndrome) have been associated with
maladapted polyamine metabolism [42].
It is very clear that when immune cells take up residence in different tissues they also change
their transcriptomes and attain specialized or different functions. Notable examples of this issue
has been shown in tissue Tregs [43] and macrophages [44], where the cells look very different
transcriptomically depending on the tissue of residence. We and others have observed a similar
situation in Th17 cells, where they differ in their function of whether they are in lymph nodes,
gut or CNS, as observed by the scRNAseq analysis of Th17 cells [23, 24]. Based on our studies,
presented here, we suggest that the metabolic activity of the cell within a defined tissue may
have a profound impact in the epigenome and transcriptome, resulting in their changed or
specialized functions. With the emerging cell atlases and mapping transcriptome of tissues
resident immune cells at the single cell level, the Compass algorithm will provide a powerful tool
for studying metabolic pathways across different cell types in different tissues, taking advantage
of the wealth of single cell data sets that are being published.
In summary, our study highlights the advantage of utilizing single cell genomics and novel
algorithms in studying cellular metabolism, providing roadmaps for studying metabolic
pathways in immune cells across normal or diseased tissues. The study validates the predictions
made by algorithms, both in vitro and in vivo and shows that interfering with these metabolic
author/funder. All rights reserved. No reuse allowed without permission. The copyright holder for this preprint (which was not peer-reviewed) is the. https://doi.org/10.1101/2020.01.23.911966doi: bioRxiv preprint
22
pathways identified by Compass have profound effect on the function of the effector cells, by
regulating both epigenome and transcriptome of the Th17 cell.
ACKNOWLEDGEMENTS
This investigation is supported in part by a Career Transitional Fellowship from the National
Multiple Sclerosis Society awarded to CW. NY and AW were supported by the Chan Zuckerberg
Biohub. JF was supported by a Max Kade fellowship awarded by the Austrian Acadamy of
Science (ÖAW). VKK is supported by grants from National Institutes of Health (R01NS045937,
RO1 NS 30843, R01AI144166, P01AI073748, P01AI039671 and P01AI056299)
AUTHOR CONTRIBUTIONS
CW, AW, AR, NY and VKK conceptualized the study. CW conceived and designed experiments
with help from JF; CW, AW, JAP, CC conceived the metabolomics experiments; CW, JF and SZ
performed most of the experiments; JAP and KP performed LC/MS metabolomics; AW and JK
analyzed RNAseq and ATACseq datasets; PT provided help with ATACseq experiments; PT and
AS optimized ATAC-seq protocol, with input from AR; NR, MH provided critical assay support;
DP, EP, MS provided critical materials; CW, VKK and NY supervised the study. CW, AW, AR,
NY and VKK wrote the manuscript with contributions from all authors.
DECLARATION OF INTERESTS
A.R. is a SAB member of ThermoFisher Scientific, Neogene Therapeutics, Asimov and Syros
Pharmaceuticals. A.R. is a cofounder of and equity holder in Celsius Therapeutics and an equity
holder in Immunitas. V.K.K. is a co-founder, has ownership interest and is on the SAB of in
Celsius Therapeutics and Tizona Therapeutics. V.K.K.’s interests were reviewed and managed
author/funder. All rights reserved. No reuse allowed without permission. The copyright holder for this preprint (which was not peer-reviewed) is the. https://doi.org/10.1101/2020.01.23.911966doi: bioRxiv preprint

23
by the Brigham and Women’s Hospital and Partners Healthcare in accordance with their conflict
of interest policies. V.K.K. are inventors on patents related to Th17 cells. C.W., A.W., J.F., A.R.,
N.Y. and V.K.K. are co-inventors on a provisional patent application directed to inventions
relating to methods for modulating metabolic regulators of T cell pathogenicity as described in
this manuscript filed by The Broad Institute, MIT, Brigham and Women’s Hospital and the
Regents of California.
METHODS
Mice
C57BL/6 wildtype (WT) were obtained from Jackson laboratory (Bar Harbor, ME). SAT1flox
mice were kindly provided by Dr. Manoocher Soleimani (University of Cincinnati), which we
crossed to CD4cre to generate conditional T cell deletion of SAT1. Note that only male mice
were used in all experiments as SAT1 is an X chromosome gene and female mice have
incomplete deletion due to random inactivation of x chromosome. ODC1fl/flCD4cre were gifted
by Dr. Erika Pearce (Max Planck Institute). For experiments, mice were matched for sex and
age, and most mice were 6–10 weeks old. Littermate WT or Cre- mice were used as controls. All
experiments were conducted in accordance with animal protocols approved by the Harvard
Medical Area Standing Committee on Animals or BWH IACUC.
T cell differentiation culture and flow cytometry
author/funder. All rights reserved. No reuse allowed without permission. The copyright holder for this preprint (which was not peer-reviewed) is the. https://doi.org/10.1101/2020.01.23.911966doi: bioRxiv preprint

24
Naïve CD4+CD44-CD62L+CD25- T cells were sorted using BD FACSAria sorter and activated
with plate-bound anti-CD3 (1µg/ml) and antiCD28 antibodies (1µg/ml) in the presence of
cytokines at a concentration of 5 X 10⁵ cells/ml. For T cell differentiations the following
combinations of cytokines were used: pathogenic Th17: 25ng/ml rmIL-6, 20ng/ml rmIL-1b (both
Miltenyi Biotec) and 20ng/ml rmIL-23 (R&D systems); non-pathogenic Th17: 25ng/ml rmIL-6
and 2ng/ml of rhTGFb1 (Miltenyi Biotec); iTreg: 2ng/ml of rhTGFb1; Th1: 20ng/ml rmIL-12
(R&D systems); Th2: 20ng/ml rmIL-4 (Miltenyi Biotec). Intracellular cytokine staining was
performed after incubation for 4-6h with Cell Stimulation cocktail plus Golgi transport inhibitors
(Thermo Fisher Scientific) using the BD Cytofix/Cytoperm buffer set (BD Biosciences) per
manufacturer’s instructions. Transcription factor staining was performed using the
Foxp3/Transcription Factor Staining Buffer Set (eBioscience). Proliferation was assessed by
staining with CellTrace Violet (Thermo Fisher Scientific) per manufacturer’s instructions.
Apoptosis was assessed using Annexin V staining kit (BioLegend). Phosphorylation of proteins
to determine cell signaling was performed with BD Phosflow buffer system (BD bioscience) as
per manufacturer’s instructions.
Inhibitors and metabolites
For differentiation experiments, cells were harvested at 72 hours and were performed in the
presence or absence of 100-200µM DFMO, 500µM trans-4-Methylcyclohexylamine (MCHA,
both Sigma), 500µM N-(3-Aminopropyl)cyclohexylamine (APCHA, Santa Cruz
Biotechnology), 50µM Diminazene aceturate (Dize, Cayman Chemical) with or without 2.5 mM
Putrescine (Sigma, P7505) as indicated.
author/funder. All rights reserved. No reuse allowed without permission. The copyright holder for this preprint (which was not peer-reviewed) is the. https://doi.org/10.1101/2020.01.23.911966doi: bioRxiv preprint

25
Compass analysis
Compass is descried in detail in a companion manuscript (Wagner et al). In the following we
provide a high level description of the algorithm.
Compass integrates scRNA-Seq profiles with prior knowledge of the metabolic network to infer
a metabolic state of the cell. The metabolic network we use here consists of 7,440 reactions and
2,626 metabolites (Recon2 database, [27]), along with reaction stoichiometry, gene-enzyme-
reaction associations and biochemical constraints (such as reaction irreversibility and nutrient
availability).
Compass builds on the paradigm of Flux Balance Analysis (FBA) to model metabolic fluxes,
namely the rate by which chemical reactions convert substrates to products [25, 26, 45, 46]
(Orth, Thiele, and Palsson 2010; O’Brien, Monk, and Palsson 2015; Lewis, Nagarajan, and
Palsson 2012; Palsson 2015). The modeling is based on linear programming, maximizing a
certain objective (here, flux through a given reaction), while using the metabolic network to pose
constraints.
In its first step, Compass is agnostic to any measurement of gene expression levels and
computes, for every metabolic reaction r, the maximal flux !!!"# it can carry without imposing
any constraints on top of those imposed by stoichiometry and mass balance. Next, Compass
assigns every reaction in every cell a penalty inversely proportional to the mRNA expression
associated with its enzyme(s) in that cell. Compass then finds a flux distribution which
minimizes the overall penalty incurred in any given cell i (summing over all reactions), while
maintaining a flux of at least 0.95 ⋅ !!!!" in r. The Compass score of reaction r in cell i is the
author/funder. All rights reserved. No reuse allowed without permission. The copyright holder for this preprint (which was not peer-reviewed) is the. https://doi.org/10.1101/2020.01.23.911966doi: bioRxiv preprint
26
negative of that minimal penalty (so that lower scores correspond to lower potential metabolic
activity). Intuitively, these scores reflect how well adjusted is each cell’s transcriptome to
maintaining high flux through each reaction. To reduce the effects of data sparsity (characteristic
of scRNA-Seq) Compass uses an information-sharing approach. Instead of treating each cell in
isolation, the score vector for each cell is determined by a combined objective that balances the
effects in the cell in question with those in its ten nearest neighbors (based on similarity of their
RNA profiles).
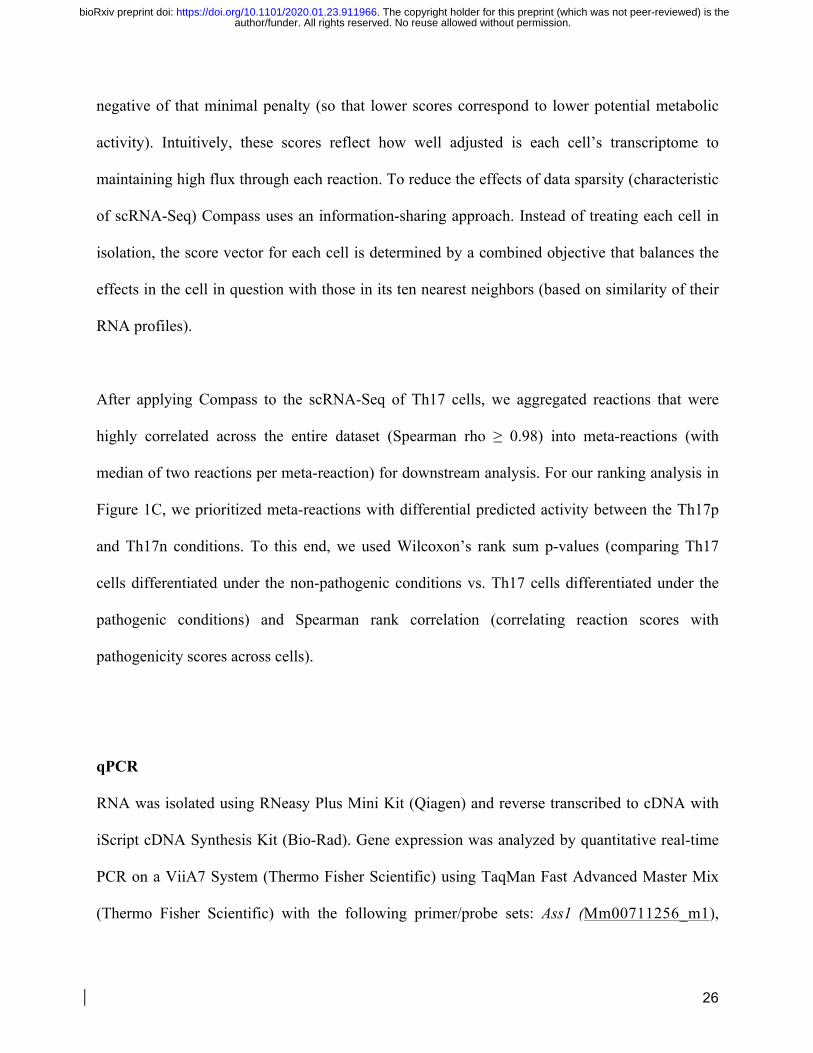
After applying Compass to the scRNA-Seq of Th17 cells, we aggregated reactions that were
highly correlated across the entire dataset (Spearman rho ≥ 0.98) into meta-reactions (with
median of two reactions per meta-reaction) for downstream analysis. For our ranking analysis in
Figure 1C, we prioritized meta-reactions with differential predicted activity between the Th17p
and Th17n conditions. To this end, we used Wilcoxon’s rank sum p-values (comparing Th17
cells differentiated under the non-pathogenic conditions vs. Th17 cells differentiated under the
pathogenic conditions) and Spearman rank correlation (correlating reaction scores with
pathogenicity scores across cells).
qPCR
RNA was isolated using RNeasy Plus Mini Kit (Qiagen) and reverse transcribed to cDNA with
iScript cDNA Synthesis Kit (Bio-Rad). Gene expression was analyzed by quantitative real-time
PCR on a ViiA7 System (Thermo Fisher Scientific) using TaqMan Fast Advanced Master Mix
(Thermo Fisher Scientific) with the following primer/probe sets: Ass1 (Mm00711256_m1),
author/funder. All rights reserved. No reuse allowed without permission. The copyright holder for this preprint (which was not peer-reviewed) is the. https://doi.org/10.1101/2020.01.23.911966doi: bioRxiv preprint

27
Odc1 (Mm02019269_g1), Sat1 (Mm00485911_g1), Srm (Mm00726089_s1), Sms
(Mm00786246_s1), Il-17a (Mm00439618_m1), Il-17f (Mm00521423_m1), Foxp3
(Mm00475162_m1), Tead1 (Mm00493507_m1), Taz (Mm00504978_m1), and Actb (Applied
Biosystems). Expression values were calculated relative to Actb detected in the same sample by
duplex qPCR.
Polyamine ELISA
Cell pellets of in vitro differentiated cells were frozen down and further processed with the Total
Polyamine Assay Kit (BioVision Inc.) according to the manufacturer’s instructions.
Metabolomics / Carbon tracing
For untargeted metabolomics, Th17 cells were differentiated as described. Culture media were
snap frozen. Cells were harvested at 96h. 1×10⁶ cells per sample were snap frozen and extracted
in either 80% methanol (for fatty acids and oxylipids) or isopropanol (for polar and nonpolar
lipids). Two liquid chromatography tandem mass spectrometry (LC-MS) methods were used to
measure fatty acids and lipids in cell extracts.
For carbon tracing experiments Th17 cells were differentiated as described. At 48h, cells were
washed and cultured in media supplemented with Arginine (13C6, Sigma, Cat# 643440) or
aspartic acid (13C4, Sigma, Cat# 604852) for 1, 5 and 24 hours.
Legendplex
author/funder. All rights reserved. No reuse allowed without permission. The copyright holder for this preprint (which was not peer-reviewed) is the. https://doi.org/10.1101/2020.01.23.911966doi: bioRxiv preprint

28
Cytokine concentrations in supernatants of in vitro cultures were analyzed by the LegendPlex
Mouse Th Cytokine Panel (13-plex) (BioLegend) according to the manufacturer’s instructions
and analyzed on a FACS LSR II (BD Biosciences).
RNA-seq
For population (bulk) RNA-seq, in vitro differentiated T-cells were sorted for live cells and lysed
with RLT Plus buffer and RNA was extracted using the RNeasy Plus Mini Kit (Qiagen). Full-
length RNA-seq libraries were prepared as previously described [47] and paired-end sequenced
(75 bp × 2) with a 150 cycle Nextseq 500 high output V2 kit.
Bioinformatic analysis of RNA-seq data
Alignment, quantification, and computation of pathogenicity signatures based on single-cell
transcriptomes were conducted as described in the accompanying manuscript (Wagner et al,
BioRxiv preprint). Briefly, raw scRNA-seq reads from Gaublomme et al. (2015) [24] (Figure 1)
were aligned with Bowtie2, quantified into TPM gene expression with RSEM. Quality control
tested and batch effects and other nuisance factors removed with SCONE [48].
To compute a pathogenicity score for each cell we used a similar scheme as in [24]: For each
cell we take the average z-scored normalized log expression of pro-pathogenic markers (CASP1,
CCL3, CCL4, CCL5, CSF2, CXCL3, GZMB, ICOS, IL22, IL7R, LAG3, LGALS3, LRMP,
STAT4, TBX21) and of pro-regulatory markers (AHR, IKZF3, IL10, IL1RN, IL6ST, IL9,
MAF), with the latter multiplied by -1.
Bulk RNA libraries from DFMO- or vehicle-treated Th17p, Th17n, or Treg were studied with 3
replicates per condition for a total of 18 libraries as shown in Figure 3A. Genes that are
author/funder. All rights reserved. No reuse allowed without permission. The copyright holder for this preprint (which was not peer-reviewed) is the. https://doi.org/10.1101/2020.01.23.911966doi: bioRxiv preprint
29
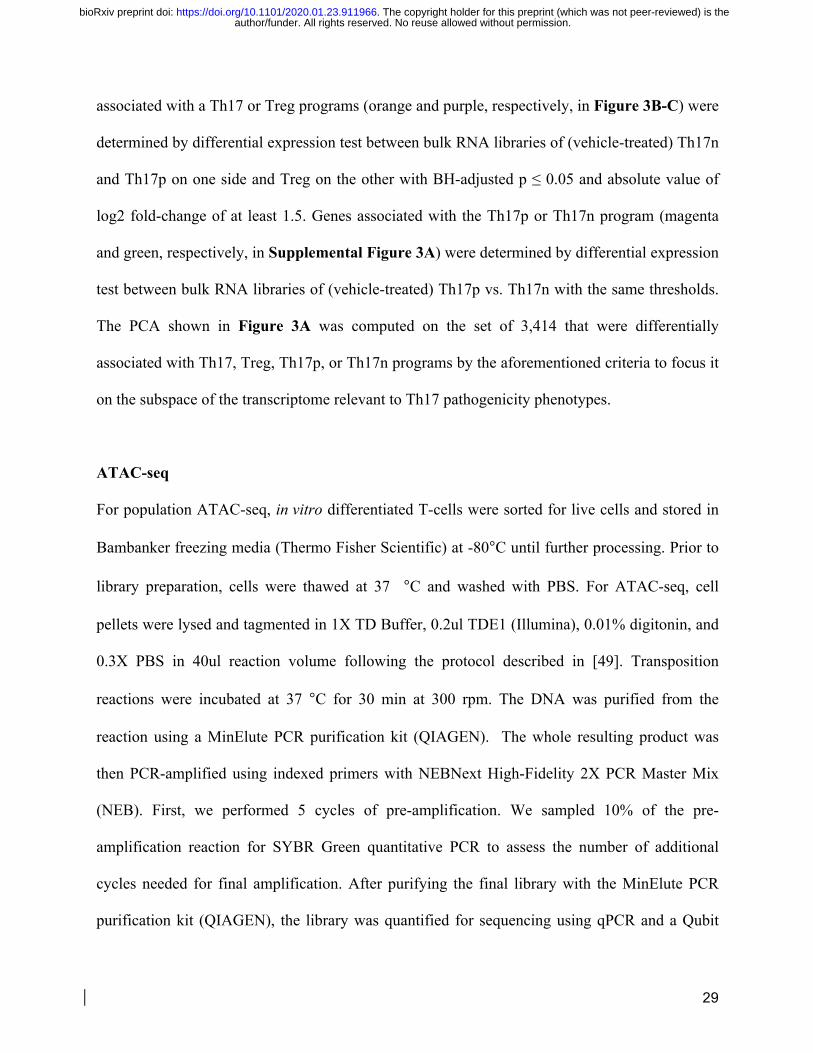
associated with a Th17 or Treg programs (orange and purple, respectively, in Figure 3B-C) were
determined by differential expression test between bulk RNA libraries of (vehicle-treated) Th17n
and Th17p on one side and Treg on the other with BH-adjusted p ≤ 0.05 and absolute value of
log2 fold-change of at least 1.5. Genes associated with the Th17p or Th17n program (magenta
and green, respectively, in Supplemental Figure 3A) were determined by differential expression
test between bulk RNA libraries of (vehicle-treated) Th17p vs. Th17n with the same thresholds.
The PCA shown in Figure 3A was computed on the set of 3,414 that were differentially
associated with Th17, Treg, Th17p, or Th17n programs by the aforementioned criteria to focus it
on the subspace of the transcriptome relevant to Th17 pathogenicity phenotypes.
ATAC-seq
For population ATAC-seq, in vitro differentiated T-cells were sorted for live cells and stored in
Bambanker freezing media (Thermo Fisher Scientific) at -80°C until further processing. Prior to
library preparation, cells were thawed at 37 °C and washed with PBS. For ATAC-seq, cell
pellets were lysed and tagmented in 1X TD Buffer, 0.2ul TDE1 (Illumina), 0.01% digitonin, and
0.3X PBS in 40ul reaction volume following the protocol described in [49]. Transposition
reactions were incubated at 37 °C for 30 min at 300 rpm. The DNA was purified from the
reaction using a MinElute PCR purification kit (QIAGEN). The whole resulting product was
then PCR-amplified using indexed primers with NEBNext High-Fidelity 2X PCR Master Mix
(NEB). First, we performed 5 cycles of pre-amplification. We sampled 10% of the pre-
amplification reaction for SYBR Green quantitative PCR to assess the number of additional
cycles needed for final amplification. After purifying the final library with the MinElute PCR
purification kit (QIAGEN), the library was quantified for sequencing using qPCR and a Qubit
author/funder. All rights reserved. No reuse allowed without permission. The copyright holder for this preprint (which was not peer-reviewed) is the. https://doi.org/10.1101/2020.01.23.911966doi: bioRxiv preprint

30
dsDNA HS Assay kit (Invitrogen). Libraries were sequenced on an Illumina NextSeq 550 system
with paired-end reads of 37 base pairs in length.
Alignment of ATAC-Seq and Peak Calling
All ATAC-Seq reads were trimmed using Trimmomatic [50] to remove primer and low-quality
bases. Reads < 36bp were dropped. Reads were then passed to FastQC
[http://www.bioinformatics.babraham.ac.uk/projects/fastqc/] to check the quality of the trimmed
reads. The paired-end reads were then aligned to the mm10 reference genome using bowtie2
[51], allowing maximum insert sizes of 2000 bp, with the “--no-mixed” and “--no-discordant”
parameters added. Reads with a mapping quality (MAPQ) below 30 were removed. Duplicates
were removed with PicardTools, and the reads mapping to the blacklist regions and
mitochondrial DNA were also removed. Reads mapping to the positive strand were moved +4
bp, and reads mapping to the negative strand were moved -5bp following the procedure outlined
in [52] to account for the binding of the Tn5 transposase.
Peaks were called using macs2 on the aligned fragments [53] with a qvalue cutoff of 0.001 and
overlapping peaks among replicates were merged.
Tests of Differential Accessibility
Differential accessibility was assessed using DESeq2 [54] on with a matrix of peaks (merging all
samples) by samples. Similar to common practice in the analysis of differential gene expression,
author/funder. All rights reserved. No reuse allowed without permission. The copyright holder for this preprint (which was not peer-reviewed) is the. https://doi.org/10.1101/2020.01.23.911966doi: bioRxiv preprint

31
our analysis of differential accessibility was conducted using the number of observed Tn5 cuts
(i.e., number of reads).
Peaks that are associated with a Th17 or Treg programs (orange and purple, respectively, in
Figure 3D) were determined by differential accessibility test between libraries of (vehicle-
treated) Th17n and Th17p on one side (unpublished dataset) and Treg on the other with BH-
adjusted p ≤ 0.05 and absolute value of log2 fold-change of at least 1.
Reprocessing of published ChIP-Seq data
ChIP-Seq Peaks from Xiao et al 2014 [32] were transferred from mm9 to mm10 using the UCSC
liftOver tool. ChIP-Seq replicates from Ciofani et al 2012 were downloaded and were trimmed
using Trimmomatic [26] to remove primer and low-quality bases. Reads were then passed to
FastQC [http://www.bioinformatics.babraham.ac.uk/projects/fastqc/] to check the quality of the
trimmed reads. These single-end reads were then aligned to the mm10 reference genome using
bowtie2 [27], allowing maximum insert sizes of 2000 bp, with the “--no-mixed” and “--no-
discordant” parameters added. Reads with a mapping quality (MAPQ) below 30 were removed.
Duplicates were removed with PicardTools , and the reads mapping to the blacklist regions and
mitochondrial DNA were also removed.
ChIP-Seq peaks were called in each replicate, versus a control sample, using macs2 [29] with a
qvalue cutoff of 0.05.
author/funder. All rights reserved. No reuse allowed without permission. The copyright holder for this preprint (which was not peer-reviewed) is the. https://doi.org/10.1101/2020.01.23.911966doi: bioRxiv preprint
32
Enrichment of motifs and ChIP-seq peaks in differentially accessible regions
Peaks were considered differentially accessible if they had a BH-adjusted p <0.05. We calculated
fold enrichment of various genomic features in these peaks (described below) versus a
background set of peaks. q-values were estimated using q-value package. [Storey JD, Bass AJ,
Dabney A, Robinson D. qvalue: Q-value estimation for false discovery rate control.
http://github.com/jdstorey/qvalue]
Motifs / Annotation Tracks
PWM’s for motifs were downloaded from the 2018 release of JASPAR [55, 56]. We used fimo
[56] to identify motifs in mm10, and applied the default threshold of 1e-4. We also included
regulatory features from the ORegAnno database[57], (iii) conserved regions annotated by the
multiz30way algorithm, and repeat regions annotated by RepeatMasker
(http://www.repeatmasker.org).
GREAT Pathways / Genes
Loci were associated with pathways using GREAT[58], submitted with the rGREAT package
(https://github.com/jokergoo/rGREAT). We retrieved pathways found in the MSigDB
Immunologic Signatures, MSigDB Pathway, and GO Biological Process databases. Loci were
mapped to genes using GREAT.
Experimental Autoimmune Encephalomyelitis (EAE)
For active EAE immunization, MOG35-55 peptide was emulsified in complete freund adjuvant
(CFA). Equivalent of 40µg MOG peptide was injected per mouse subcutaneously followed by
author/funder. All rights reserved. No reuse allowed without permission. The copyright holder for this preprint (which was not peer-reviewed) is the. https://doi.org/10.1101/2020.01.23.911966doi: bioRxiv preprint
33
pertussis toxin injection intravenously on day 0 and day 2 of immunization. Mice were treated
with 0.5% DFMO in drinking water for 10 days as indicated. DFMO was replenished every third
day.
Statistical Analysis
Unless otherwise specified, all statistical analyses were performed using the two-tail student t
test using GraphPad Prism software. P value less than 0.05 is considered significant (P < 0.05 =
*; P < 0.01 = **; P < 0.001 = ***) unless otherwise indicated.
author/funder. All rights reserved. No reuse allowed without permission. The copyright holder for this preprint (which was not peer-reviewed) is the. https://doi.org/10.1101/2020.01.23.911966doi: bioRxiv preprint

Arginine
Ornithine
Putrescine
Spermine
ODC1
SRM
SMS
N1-acSpm
N1-acSpdSAT1
SAT1
SAM
DCSAM
Spermidine
Figure 1
A B
D
C
E
FTH1
Cell typePathogenicity signature
B4GALT1ASS1CNDP2ACOT7RRM2PRDX6PRPS1NT5CCHST12ATP2B4CPOXPIK3C2BMAFIL9AHRCD38CYP11A1NT5EIKZF3ATP6V0A1ACSBG1MGST3GFPT2IL6STSAT1ICOSENO1HSD17B10PLA2G12ASMSB3GNT2CTHUQCR10STAT4LRMPAGPAT4IL22ACSL6LAG3GZMBCCL5CXCL3CSF2IL10LGALS3TBX21CASP1CCL4CCL3
Normalizedexpression
00.20.40.60.81
0.0
1.0
2.0
−0.5 0.0 0.5 1.0Manually curated pathogenicity score
Dens
ity
Th17n
Th17p
Ornithine
4-aminobutanalGABA
Putrescine
Creatine
Phosphocreatine
Arginine Agmatine
p < 0.1p < 0.12p > 0.12
BH-adjusted:
Urea
1-pyrroline
Aspartate CitrullineArginosuccinate
Fumarate
Guanidinoacetate
Glycine
SAM
SAH Spermidine
Polyamine demand
Spermine
Ornithine Putrescine N-acPut
0
1×10⁶
2×10⁶
3×10⁶
RE
ns
0
1×10⁷
2×10⁷
3×10⁷
4×10⁷
RE
**
0
5.0×10⁸
1.0×10⁹
1.5×10⁹
2.0×10⁹
2.5×10⁹
RE
ns
0
5×10⁴
1×10⁵
1.5×10⁵
2×105
RE
*
0
5.0×10⁷
1.0×10⁸
1.5×10⁸
2.0×10⁸
2.5×10⁸
RE
ns
Spermidine N-acSpd
Th17n Th17p Th17n Th17p Th17n Th17p Th17n Th17p Th17n Th17p
H
F G
Th1Th1
7pTh1
7niTreg
0.00
0.05
0.10
0.15
RE
ODC1
Th1Th1
7pTh1
7niTreg
0
50
100
150
200
250
RE
SAT1
Th1Th1
7pTh1
7niTreg
0
200
400
600
800
RE
ASS1
Th17n
Th17p
iTreg0
50
100
150
200Po
lyam
ine
conc
. (pm
ol/w
ell)
* *** ** *
**
0.0
5.0x10⁸
1.0x10⁹
1.5x10⁹
RE
Creatine
*
Th17n Th17p
−0.5
0.0
0.50 20 40
Spea
rman
cor
rela
tion
with
path
ogen
icity
sig
natu
re
Signed –log10(BH-adjusted Wilcoxonrank sum p)
Polyamine metabolism
UMP exchange
NAD nucleosidase (CD38)
author/funder. All rights reserved. No reuse allowed without permission. The copyright holder for this preprint (which was not peer-reviewed) is the. https://doi.org/10.1101/2020.01.23.911966doi: bioRxiv preprint
Arginine
Ornithine
Putrescine
Spermine
ODC1
SRM
SMS N1-acSpm
N1-acSpdSAT1
SAT1
SAM
DCSAM
Spermidine
DFMO
MCHA
Diminazene
APCHA
Ctrl DFMO
Ctrl DFMO
Ctrl
DFMO Ctrl
DFMO Ctrl
DFMO Ctrl
DFMO
0
20
40
60
%IL
-17+
of C
D4 T
cel
ls
**
05
10152025
%IL
-17+
of C
D4 T
cel
ls
**
0
10
20
30
FoxP
3+ c
ells
[%]
Foxp3
**
012345
Ctrl DFMO
IL-22
0
0.2
0.4
0.6
0.8
Ctrl DFMO
IL-21
0
0.1
0.2
0.3
0.4
Ctrl DFMO
IL-17F
00.050.100.150.200.25
Ctrl DFMO
IL-22
0
0.5
1
1.5
2
Ctrl DFMO
IL-21
00.10.20.30.40.5
Ctrl DFMO
IL-17F
Ctrl DFMO0
5
10
15
20
Abun
danc
e (n
g/m
l)
IL-17A
Ctrl DFMO02468
10
Abun
danc
e (n
g/m
l)
IL-17A
G
0
20
40
60
IL-1
7+ [%
of C
D4]
IL-17
0
10
20
30
FoxP
3+ [%
of C
D4]
Foxp3H
I
Ctrl
DFMO
DFMO + Put Ctrl
DFMO
DFMO + Put0
20
40
60
% P
ositiv
e CD
4 T
cells
IL-1
7 **** **** **** ****
0
10
20
30
40
% P
ositiv
e CD
4 T
cells
IL-9
*** * ******
Ctrl
DFMOMCHA
APCHA
Dimina
zene
acetu
rate
0
10
20
30
40
50
% P
ositiv
e CD
4 T
cells
Foxp
3
**** **** ****
*
0
10
20
30IL-2
IL-2
Ctrl DFMO
0
10
20
30
Ctrl DFMO012345
Ctrl DFMO
IL-9
IL-9
0
0.05
0.10
1.50
2.00
Ctrl DFMO
Th17n Th17n
Ctrl
Dimina
zene
acetu
rate
Dimina
zene
acetu
rate +
Put05
10152025
%Fo
xp3+
CD4
T c
ells
Foxp3
*ns
Ctrl
Dimina
zene
acetu
rate
Dimina
zene
acetu
rate +
Put0
20
40
60
%IL
-17+
of C
D4 T
cel
ls
IL-17
********
Figure 2A
E Control DFMO
CD4
C
D
B
Th17p
Th17p
Th17p
Th17n
Th17n
Th17n
Th17n
Th17n
F
IL-17A
Ctrl DFMO
Ctrl
Ctrl Ctrl
Ctrl+Putrescine
0
10
20
30
40
%IL
-17+
of C
D4 T
cel
ls
IL-17
WT
ODC1-/-
WT+DFMO WT
ODC1-/-
WT+DFMO WT
ODC1-/-
WT+DFMO WT
ODC1-/-
WT+DFMO
WT
ODC1-/-
WT+DFMO WT
ODC1-/-
WT+DFMOWT
ODC1-/-
WT+DFMO WT
ODC1-/-
WT+DFMO
********
+Putrescine
0
10
20
30
40
%Fo
xp3
of C
D4 T
cel
ls
Foxp3
****
+Putrescine
0
10
20
30
40
% o
f CD4
T c
ells
Foxp3
********
+Putrescine
0
10
20
30
% o
f CD4
T c
ells
IL-17
********
Th17p Th17n
0
10
20
30
40
50
%Ro
rgt+
CD4
T c
ells
RORgt
****Th17p Th17n
0
10
20
30
40
%Tb
et+ o
f CD4
T C
ells
TBET
****
0102 103 104 105
105
104
103
102
026.6
13.98.79
50.70102 103 104 105
105
104
103
102
075.5
0.1860
24.3
IL-2
IL-1
7
ODC1-/-WT
0 102 103 104 105
105
104
103
102
0
20.8
0 102 103 104 105
105
104
103
102
0
0.429WT ODC1-/-
Foxp
3
CD4
***
**
*
author/funder. All rights reserved. No reuse allowed without permission. The copyright holder for this preprint (which was not peer-reviewed) is the. https://doi.org/10.1101/2020.01.23.911966doi: bioRxiv preprint

Th17n
Th17p
Th17n
A
−40
−20
0
20
40
−30 0 30 60PC1 (39.42% variance)
PC2
(17.
95%
var
ianc
e)
Th17n VehicleTh17n DFMOTh17p VehicleTh17p DFMOiTreg VehicleiTreg DFMO
ATAC−SeqRNA−Seq D Figure 3
C
DFMO effect in iTreg
DFMO effect in Th17n
DFMO effect in Th17p
−2 0 20.00
0.25
0.50
0.75
1.00
0.00
0.25
0.50
0.75
1.00
0.00
0.25
0.50
0.75
1.00
log2 FC (DFMO vs. vehicle)
Dens
ityDe
nsity
Dens
ity
DE decisionUp in Th17NSUp in iTreg
0.000000.000050.000100.000150.000200.00025
RE IL
-17A
0.00
0.01
0.02
0.03
0.04
RE IL
-17F
0.000
0.002
0.004
0.006
0.008
RE IL
-17A
IL17A
0.0
0.1
0.2
0.3
RE IL
-17F
IL17F
IL17A IL17F
0.000
0.005
0.010
0.015
RE F
oxP3
CtrlDFMO
Foxp3
B
0
10
20
30
−5.0 −2.5 0.0 2.5 5.0log2 fold change
−log
10(a
djus
ted
p)
LGALS9LY6A
CTLA2B
TGFB3
IL23AIL23R
CCL5
IL17AGATA3
ICAM5IL33
CCL1
CCL22
DFMO effect on Th17n
IL9IL2ICAM2FOXP3IL10
CD5LCCL3
IL1RN
VCAM1
IL1A
SELP
0
5
10
15
20
−5.0 −2.5 0.0 2.5log2 fold change
−log
10(a
djus
ted
p)
Up in Th17NSUp in iTreg
DFMO effect on Th17p
IL17FLGALS9
IL23R
SELP
CCL5IL17A
CCL3IL9TGFB3
IL1RNIL33
CTLA2BICAM2IL1AICAM5
CD5LIL10
FOXP3CCL22
IL23AVCAM1
CCL1
LY6A
GATA3
IL2
IL17F
IL17 E WT1 iTreg 500WT1 iTreg DFMO
WT1 Th17nWT1 Th17n DFMO
refGeneRORyt (Xiao et al)
20730K 20740K 20750K 20760K
Il17a
F G
Differentially accesiblepeak group
Th17p_WT_DFMOTh17p_WT_NoTrt
Significant
●NoYes
*Ciofani et al
0
5
10
15
20
% o
f CD
4 T
cells
Foxp3**** ****
0
100
200
300
400
500
pg/m
l
IL-10**** ****
JMJD
3fl/fl C
D4cre
+DFM
O
JMJD
3fl/f lC
D4cre
JMJD
3fl/fl
+DFM
O
JMJD
3fl/fl
0.0
0.4
0.8
1.2
Dens
ity
0.0
0.4
0.8
1.2
−2 0 2logFC
Dens
ity
DFMO effect in iTreg
DFMO effect in Th17nDifferentiallyopen in:
iTregNSTh17
Th17 BATF WT *Rep. SL3033Th17 Fosl2 WT *Rep. SL6498
Th17 Batf IRF4 WT *Rep. SL9449Th17 Batf IRF4 WT *Rep. SL8349
Th17 BATF WT *Rep. SL10570Stat4
Stat5a Stat5bSTAT1
Th17 Stat3 WT *Rep. SL9624FOSL1 JUNFOS JUND
FOSFOSL2 JUN
BATF JUNJUN JUNB
Stat6POU2F1POU3F4POU1F1
POU5F1BPou2f3
POU3F1POU3F2POU3F3
Th17 Jmjd3 WT *Rep. SL12384
1.0 1.5 2.0Fold Enrichment
Top Motifs/ChIP−Seq TFs Enriched
Background: iTreg. Peaks in background: 8523Foregrounds: Th17n_WT_DFMO:1010 ; Th17n_WT_NoTrt:111
author/funder. All rights reserved. No reuse allowed without permission. The copyright holder for this preprint (which was not peer-reviewed) is the. https://doi.org/10.1101/2020.01.23.911966doi: bioRxiv preprint

p = 0.01
**
Ctrl DFMO
Arginine
Ornithine
Putrescine
Spermine
ODC1
SRM
SMS N1-acSpm
N1-acSpdSAT1
SAT1
SAM
DCSAM
Spermidine
DFMO
0
5
10
15
20
Foxp
3+ [%
of C
D4]
0 5 10 15 20 250
2
4
6
8
MOG [ug/ml]
Ctrl
DFMO
3 H in
corp
orat
ion
(ratio
com
pare
d to
no
MO
G)
0 10 20 300
1
2
3
4Proliferation
3 H in
corp
orat
ion
(ratio
com
pare
d to
no
MO
G)
WT
MOG (ug/ml)
Th17n Th17p0
5×10⁵
1×10⁶
2×10⁶
RE
N-AcPut**
Th17n Th17p0
5×10⁴
1×10⁵
1.5×10⁵
2×10⁵
2.5×10⁵
RE
N-acSpm********
Th17n Th17p0
2×10⁵
4×10⁵
6×10⁵
REOrnithine
*
Th17n Th17p0
2×10⁶
4×10⁶
6×10⁶
8×10⁶
RE
Putrescine****
Th17n Th17p0
5.0×10⁷
1.0×10⁸
1.5×10⁸
2.0×10⁸
RE
Spermidine
WTSat1-/-
WTSat1fl/flCD4cre
ns
F G
0 5 10 15 20 250
1
2
3
4
Days
EAE
scor
e
WT
Sat1fl/flCD4cre+
Incidence Onset Peak diseaseWT 100% (9/9) 10.7 +/- 0.9 3.6 +/- 0.3
92% (11/12) 14.1 +/- 1 2.4 +/- 0.2Sat1fl/flCD4cre+
n/a p = 0.0172 p = 0.0058Significant?
Sat1fl/flCD4cre+
Sat1fl/flCD4cre+
p < 0.0001
WT0
100
200
300
400
500Histology
CNS
infilt
rate
s
A B C D Figure 4
E
I
H
0 250
5
10
15
20
MOG ug/ml
pg/m
l
IFNg
0 250
2
4
6
8
10
MOG ug/ml
pg/m
l
IL-17A
0 250
5
10
15
20
25
MOG ug/ml
pg/m
l
IL-9
0 250
10
20
30
40
50
MOG ug/ml
pg/m
l
TNFa
WT
Sat1fl/f
l CD4cre
0
10
20
30CNS: Foxp3
%Fo
xp3+
of C
D4+
T ce
lls **
WT
Sat1fl/f
l CD4cre
0
10
20
30
40CNS: Rorgt
%Ro
rgt+
CD4
T c
ells *
WT
Sat1fl/f
l CD4cre
0
2
4
6
8CNS: Tbet
%Tb
et+
of C
D4 T
Cel
ls0 102 103 104 105
0
103
104
105 23.4
0102 103 104 105
0
103
104
105 13.5WT Sat1fl/flCD4cre
Foxp
3
Incidence Onset Peak diseaseCtrl 90% (18/20) 11 +/- 2.2 2.6 +/- 0.9
75% (15/20) 12.1 +/- 2.9 1.4 +/- 1.1n/a No p = 0.0005
DFMOSignificant?
p = 0.00159
0 5 10 15 20 250
1
2
3
4
Day
EAE
scor
e
CtrlDFMO
p = 0.0041
Ctrl or DFMO Normal water
author/funder. All rights reserved. No reuse allowed without permission. The copyright holder for this preprint (which was not peer-reviewed) is the. https://doi.org/10.1101/2020.01.23.911966doi: bioRxiv preprint

34
FIGURE LEGENDS
Figure 1. Prediction and metabolic validation of the polyamine pathway as a candidate in
regulating Th17 cell function. (A-B) Standard single-cell RNAseq analysis of Th17 cells we
published in [24]. Briefly, IL-17.GFP+ cells were isolated from pathogenic Th17 cells (Th17p,
IL-1b+IL-6+IL-23) and non-pathogenic Th17 cells (Th17n, TGFb+IL-6) differentiated in vitro.
A, Histogram of a transcriptional pathogenicity score per cell, based on [14]; B, Gene expression
heatmap of top metabolic genes associated with Th17 cell pathogenicity as we qualified in [14].
Marker genes associated with pro-inflammatory or pro-regulatory programs and used to compute
the pathogenicity score are colored in red and green, respectively, black genes are metabolic.
Cell are ordered by the ranked pathogenicity score; (B-C) Compass analysis of scRNAseq of
Th17 cells. C, meta-reactions (data-driven clusters reactions with similar Compass scores across
cells, with median of two reactions per meta-reaction; Methods) differential activity between
Th17p and Th17n conditions is assessed via Benjamini-Hochberg (BH)-adjusted Wilcoxon rank
sum p value, signed by the direction of change and by the Spearman correlation of their Compass
scores with cell pathogenicity scores, across all cells. Green dots represent meta-reactions
containing at least one metabolic reaction that appear in network of panel D. The meta-reaction
labelled “polyamine metabolism” contains uptake of putrescine, spermidine, spermidine
monoaldehyde, spermine monoaldehyde, and 4-aminobutanal from the extracellular
compartment, and the conversion of 4-aminobutanal to putrescine. D, a metabolic network that
is preferentially active in the pro-regulatory (Th17n) state based on Compass results. Green
arrows represent reactions that were predicted to be significantly associated with the Th17n
program (BH-adjusted p < 0.1 for their meta-reaction, dashed line for borderline significance,
BH-adjusted p < 0.12), grey arrows represent reactions that were not significantly different
author/funder. All rights reserved. No reuse allowed without permission. The copyright holder for this preprint (which was not peer-reviewed) is the. https://doi.org/10.1101/2020.01.23.911966doi: bioRxiv preprint
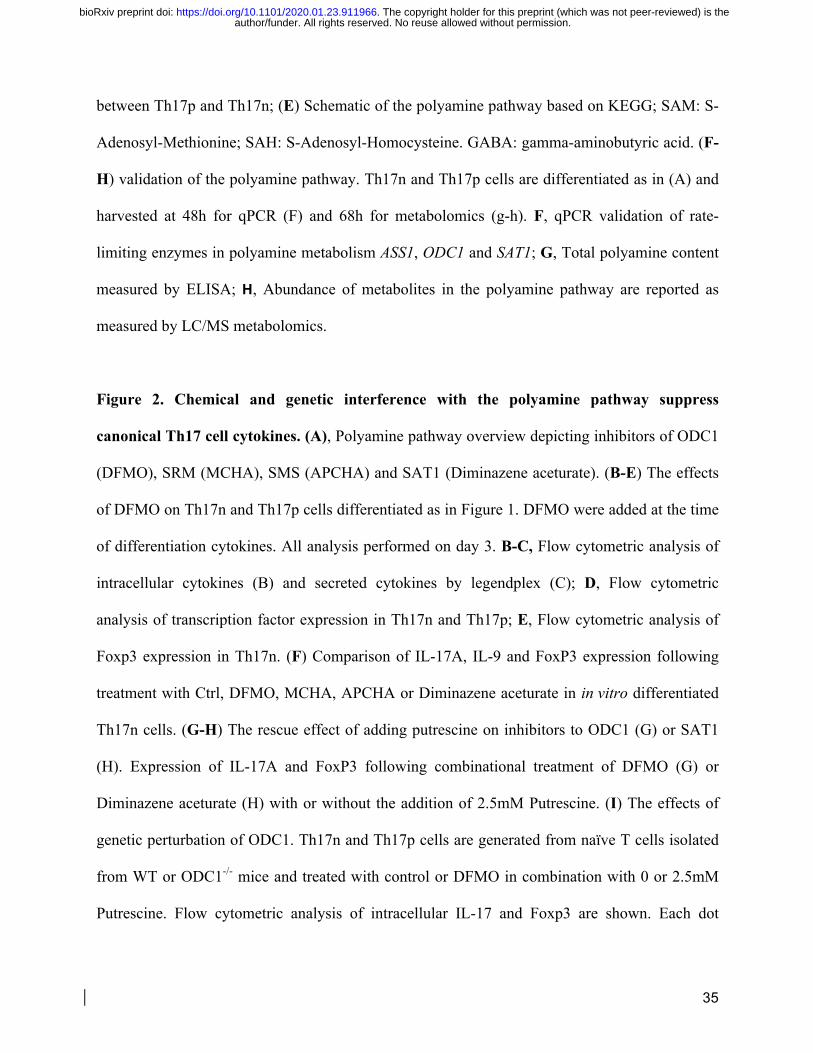
35
between Th17p and Th17n; (E) Schematic of the polyamine pathway based on KEGG; SAM: S-
Adenosyl-Methionine; SAH: S-Adenosyl-Homocysteine. GABA: gamma-aminobutyric acid. (F-
H) validation of the polyamine pathway. Th17n and Th17p cells are differentiated as in (A) and
harvested at 48h for qPCR (F) and 68h for metabolomics (g-h). F, qPCR validation of rate-
limiting enzymes in polyamine metabolism ASS1, ODC1 and SAT1; G, Total polyamine content
measured by ELISA; H, Abundance of metabolites in the polyamine pathway are reported as
measured by LC/MS metabolomics.
Figure 2. Chemical and genetic interference with the polyamine pathway suppress
canonical Th17 cell cytokines. (A), Polyamine pathway overview depicting inhibitors of ODC1
(DFMO), SRM (MCHA), SMS (APCHA) and SAT1 (Diminazene aceturate). (B-E) The effects
of DFMO on Th17n and Th17p cells differentiated as in Figure 1. DFMO were added at the time
of differentiation cytokines. All analysis performed on day 3. B-C, Flow cytometric analysis of
intracellular cytokines (B) and secreted cytokines by legendplex (C); D, Flow cytometric
analysis of transcription factor expression in Th17n and Th17p; E, Flow cytometric analysis of
Foxp3 expression in Th17n. (F) Comparison of IL-17A, IL-9 and FoxP3 expression following
treatment with Ctrl, DFMO, MCHA, APCHA or Diminazene aceturate in in vitro differentiated
Th17n cells. (G-H) The rescue effect of adding putrescine on inhibitors to ODC1 (G) or SAT1
(H). Expression of IL-17A and FoxP3 following combinational treatment of DFMO (G) or
Diminazene aceturate (H) with or without the addition of 2.5mM Putrescine. (I) The effects of
genetic perturbation of ODC1. Th17n and Th17p cells are generated from naïve T cells isolated
from WT or ODC1-/- mice and treated with control or DFMO in combination with 0 or 2.5mM
Putrescine. Flow cytometric analysis of intracellular IL-17 and Foxp3 are shown. Each dot
author/funder. All rights reserved. No reuse allowed without permission. The copyright holder for this preprint (which was not peer-reviewed) is the. https://doi.org/10.1101/2020.01.23.911966doi: bioRxiv preprint

36
represents biological replicates performed with different mice. All statistical analyses are
performed using pair-wise comparison or one-way anova.
Figure 3. DFMO treatment promotes Treg-like transcriptome and epigenome. (A-C)
Th17n, Th17p and iTreg cells were differentiated and harvested at 68h for live cell sorting and
population RNAseq. A, PCA plot showing in vitro differentiated Th17n (green), Th17p (red) and
iTregs (blue) in the presence (lighter color) or absence of DFMO. B, Volcano plots (upper) and
qPCR validation (lower) showing affected genes by DFMO treatment in Th17n and Th17p cells.
Th17 (orange) and iTreg specific genes (violet) are highlighted. C, Histograms showing the
effects of DFMO on iTreg, Th17n and Th17p transcriptome. Transcriptome space is divided into
those up-regulated in Th17 cells (orange), Treg (violet) or neither (grey). (D-F) Th17n and iTreg
cells were differentiated and harvested at 68h for live cell sorting and population ATAC-seq. D,
Histograms showing the effects of DFMO on chromatin accessibility as measured by ATAC-seq.
The accessibility regions are divided into those more accessible in Th17 cells (orange), Treg
(violet) or neither (grey). E, IGV plots of Il17 regions. Regions significantly altered (DESeq2,
BH-adjusted p <0.05) by DFMO treatment and binding sites for RORγt [32] are highlighted. F,
Motif enrichment analysis of in vitro differentiated Th17n in the presence (red) or absence
(green) of DFMO for iTreg specific genes. (G), Cells were cultured under Th17n condition as in
Figure 2 with DFMO or solvent control (water), replated to rest at 68h in new plate and
harvested at 120h for analysis of intracellular Foxp3 expression and IL-10 expression in
supernatant.
author/funder. All rights reserved. No reuse allowed without permission. The copyright holder for this preprint (which was not peer-reviewed) is the. https://doi.org/10.1101/2020.01.23.911966doi: bioRxiv preprint

37
Figure 4. Targeting ODC1 and SAT1 alleviate EAE. (A) Schematics of the polyamine
pathway; (B-D) The effects of chemical inhibition of ODC1 by DFMO on EAE. Wildtype mice
were immunized with MOG35-55/CFA to induce experimental autoimmune encephalomyelitis and
followed for clinical scoring. DFMO were provided in drinking water from day 0 for 10 days in
experimental group. B, Clinical score over time. Graph shows pooled results from 3 independent
experiments. C, Antigen-specific cell proliferation is measured by thymidine incorporation after
culturing cells isolated from draining lymph node of mice (d15 post immunization) with
increasing dose of MOG35-55 peptide for 3 days. D, Flow cytometric analysis of intracellular
Foxp3 expression in T cells isolated from CNS at day 15 post immunization. (E-I) The effects of
genetic perturbation of SAT1. E, The effects of SAT1 deficiency on metabolome. Abundance of
metabolites in the polyamine pathway were determined by LC/MS based metabolomics. Th17n
and Th17p cells were differentiated in vitro from naïve cells isolated from WT or SAT1-/- mice.
(F-I) The effects of SAT1 deficiency on EAE. EAE were induced as in (B) in wildtype and
SAT1fl/flCD4cre mice. F, Clinical score (left) and histological score (right) showing the number of
CNS infiltrates show representative experiment with 5 WT and 8 CKO mice. Similar results
were obtained from 2 independent experiments summarized in table (lower). G-H, Cells were
isolated from draining lymph node of mice (d23 post immunization) and co-cultured with
increasing dose of MOG35-55 peptide for 3 days. Antigen-specific cell proliferation is measured
by thymidine incorporation (G) and antigen-specific cytokine secretion by legendplex (H). I,
Flow cytometry analysis of intracellular transcription factor expression in CD4 T cells isolated
from CNS day 15 post immunization. Linear regression analysis (b, c, f, g), two-way anova (e)
and student t test (d, i) were used for statistical analysis.
author/funder. All rights reserved. No reuse allowed without permission. The copyright holder for this preprint (which was not peer-reviewed) is the. https://doi.org/10.1101/2020.01.23.911966doi: bioRxiv preprint

Th17nTh17
p
Th17n (m
edia)
Th17p (m
edia)
0.0
5.0×10⁷
1.0×10⁸
1.5×10⁸
2.0×10⁸
2.5×10⁸
N1-acetylspermidine
rela
tive
unit
Th17nTh17p
Th17n (media)
Th17p (media)
0
50000
100000
150000
200000
N-acetylputrescine
rela
tive
unit
Figure S1
Th17nTh17p
Th17n (media)
Th17p (media)
0
2 ×10 7
4 ×10 7
6 ×10 7
8 ×10 7
Ornithine
rela
tive
unit
Th17nTh17p
Th17n (media)
Th17p (media)
0
1×10 7
2 ×10 7
3 ×10 7
4 ×10 7
Putrescine
rela
tive
unit
Th17nTh17p
Th17n (media)
Th17p (media)
0.0
5.0×10⁸
1.0×10⁹
1.5×10⁹
2.0×10⁹
2.5×10⁹
Spermidine
rela
tive
unit
B A
C Arginine tracing
cell_0h cell_24h media_0h media_24h0.0
2.5×10⁶
5.0×10⁶
7.5×10⁶
1.0×10⁷
abun
danc
e
arginine [13C]C[2H]H4
**
cell_0h cell_24h media_0h media_24h0
1000
2000
3000
4000
5000
abun
danc
e
Putrescine [13C]C[2H]H4
Th17nTh17pno cell
cell_0h cell_24h media_0h media_24h0
5×10⁷
1×10⁸
abun
danc
e
citrulline [13C1][2H4]
Citrulline tracingD
0h 1h 5h 24h0
2×10⁶
4×10⁶
6×10⁶
8×10⁶
1×10⁷
hours post labeling
abun
danc
e
0h 1h 5h 24h0
1000000
2000000
3000000
4000000
hours post labeling
abun
danc
e
0h 1h 5h 24h0
20000
40000
60000
80000
hours post labeling
abun
danc
e
0h 1h 5h 24h0
5000
10000
15000
20000
25000
hours post labeling
abun
danc
e
0h 1h 5h 24h0
5000
10000
15000
hours post labeling
abun
danc
e
arginine Guanidinoacetic acid Putrescine AcPutr AcSpd
Th17n mediaTh17p mediano cell
0h 1h 5h 24h0
2×10⁷
4×10⁷
6×10⁷
8×10⁷
hours post labeling
abun
danc
e
0h 1h 5h 24h0
200000
400000
600000
800000
hours post labeling
abun
danc
e
0h 1h 5h 24h0
20000
40000
60000
80000
hours post labeling
abun
danc
e
0h 1h 5h 24h0
20000
40000
60000
80000
hours post labeling
abun
danc
e
0h 1h 5h 24h0
20000
40000
60000
80000
hours post labeling
abun
danc
e
Th17nTh17pTh17n (no C13)Th17p (no C13)
cell
media
amino_acidlipidunidentified
Normalizedabundance
00.20.40.60.81
Th17nTh17p
author/funder. All rights reserved. No reuse allowed without permission. The copyright holder for this preprint (which was not peer-reviewed) is the. https://doi.org/10.1101/2020.01.23.911966doi: bioRxiv preprint
Th17p Th17n iTreg0
50
100
150
200
Poly
amin
e co
nc. (
pmol
/wel
l)
Ctrl
DFMO
A
C
Ctrl
DFMO0
10000
20000
30000
40000
TNFa
(pg/
ml)
TNFa
Ctrl
DFMO0
2
4
6
8
IL-4
(pg/
ml)
IL-4
Ctrl
DFMO0
10
20
30
IL-1
0 (p
g/m
l)
IL-10
Ctrl
DFMO0
20
40
60
IL-1
3 (p
g/m
l)
IL-13
Ctrl
DFMO0
5000
10000
15000
20000
25000
TNFa
(pg/
ml)
TNFa
Ctrl
DFMO0
1
2
3
4
5
IL-4
(pg/
ml)
IL-4
Ctrl
DFMO0
100
200
300
400
500
IL-1
0 (p
g/m
l)
IL-10
Ctrl
DFMO0
2
4
6
8
10
IL-1
3 (p
g/m
l)
IL-13
B
pSTAT3 (Y705) STAT3 FoxO1 pFoxO1 (S256) pFoxO1 (T240)
Th17p0
500
1000
1500
2000
2500
FoxO
1 [M
FI]
Ctrl
DFMO
Th17p0
500
1000
1500
2000
2500
pFox
O1(
Ser2
56) [
MFI
]
Ctrl
DFMO
Th17p0
200
400
600
800
1000
pFox
O1(
Thr2
40/F
oxO
3A(T
hr32
) [M
FI] Ctrl
DFMO
Th17n0
100
200
300
400
500
pFox
O1(
Thr2
40/F
oxO
3A(T
hr32
) [M
FI] Ctrl
DFMO
Th17n0
500
1000
1500
pFox
O1(
Ser2
56) [
MFI
]
Ctrl
DFMO
Th17n0
500
1000
1500
2000
FoxO
1 [M
FI]
Ctrl
DFMO
Th17p0
100
200
300
STAT
3 [M
FI]
Ctrl
DFMO
Th17n0
100
200
300
400
STAT
3 [M
FI]
-
DFMO
Th17p0
500
1000
1500
pSTA
T3 [M
FI]
Ctrl
DFMO
Th17n0
500
1000
1500
2000
pSTA
T3 [M
FI]
Ctrl
DFMO
Th17p
Th17n
Ctrl
DFMO0.0
0.5
1.0
1.5
IL-5
(pg/
ml)
IL-5Ctrl
DFMO0
1
2
3
IL-5
(pg/
ml)
IL-5
Th17p
Th17n
Ctrl
DFMO0
200
400
600
800
IFN
g (p
g/m
L)
IFNg
Ctrl
DFMO0
50
100
150
200
250
IFN
g (p
g/m
L)
IFNg
Figure S2 author/funder. All rights reserved. No reuse allowed without permission. The copyright holder for this preprint (which was not peer-reviewed) is the. https://doi.org/10.1101/2020.01.23.911966doi: bioRxiv preprint
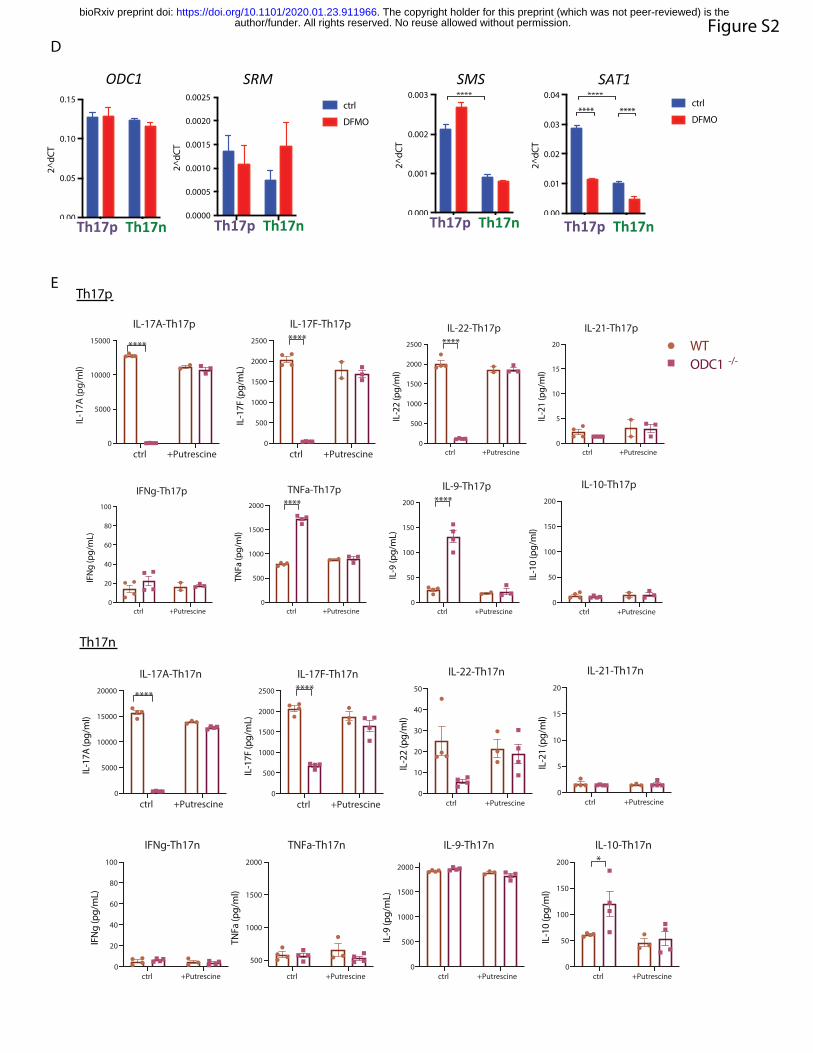
0.00
0.05
0.10
0.15
2^dC
T
Th17p Th17n Th17p Th17n0.0000
0.0005
0.0010
0.0015
0.0020
0.0025
2^dC
T
SRM
ctrl
DFMO
Th17p Th17n 0.000
0.001
0.002
0.003
2^dC
T
ctrl
DFMO
****
Th17p Th17n Th17p Th17n 0.00
0.01
0.02
0.03
0.04
2^dC
T
ctrl
DFMO
****
**** ****
ODC1 SRM SMS SAT1
D
E
ctrl +Putrescine0
5000
10000
15000
IL-1
7A (p
g/m
l)
IL-17A-Th17p
****
ctrl +Putrescine0
500
1000
1500
2000
2500
IL-1
7F (p
g/m
L)
IL-17F-Th17p****
ctrl +Putrescine0
500
1000
1500
2000
2500
IL-22-Th17p
IL-2
2 (p
g/m
l)
****
ctrl +Putrescine0
20
40
60
80
100
IFN
g (p
g/m
L)
IFNg-Th17p
ctrl +Putrescine0
500
1000
1500
2000
TNFa-Th17p
TNFa
(pg/
ml)
****
ctrl +Putrescine0
50
100
150
200
IL-1
0 (p
g/m
l)
IL-10-Th17p
ctrl +Putrescine0
50
100
150
200
IL-9
(pg/
mL)
IL-9-Th17p****
ctrl +Putrescine0
5
10
15
20
IL-2
1 (p
g/m
l)
IL-21-Th17p
WTODC1 -/-
Th17p
ctrl +Putrescine0
5000
10000
15000
20000
IL-1
7A (p
g/m
l)
IL-17A-Th17n
****
ctrl +Putrescine0
500
1000
1500
2000
2500
IL-1
7F (p
g/m
L)
IL-17F-Th17n****
ctrl +Putrescine0
10
20
30
40
50
IL-22-Th17n
IL-2
2 (p
g/m
l)
ctrl +Putrescine0
5
10
15
20
IL-2
1 (p
g/m
l)
IL-21-Th17n
ctrl +Putrescine0
20
40
60
80
100
IFN
g (p
g/m
L)
IFNg-Th17n
ctrl +Putrescine
500
1000
1500
2000
TNFa
(pg/
ml)
TNFa-Th17n
ctrl +Putrescine0
500
1000
1500
2000
IL-9
(pg/
mL)
IL-9-Th17n
ctrl +Putrescine0
50
100
150
200
IL-10-Th17n
IL-1
0 (p
g/m
l)
*
Th17n
Figure S2 author/funder. All rights reserved. No reuse allowed without permission. The copyright holder for this preprint (which was not peer-reviewed) is the. https://doi.org/10.1101/2020.01.23.911966doi: bioRxiv preprint

A B
C Th17n
Figure S3
0
2500
5000
7500
0.5 1.0 1.5 2.0 2.5log2 fold−change threshold for DE decision
# D
E pe
aks,
DFM
O v
s. v
ehic
le
iTreg
Th17n
2000
3000
4000
5000
6000
0.0250.0500.0750.100BH−adjusted p threshold for DE decision
# D
E pe
aks,
DFM
O v
s. v
ehic
le
iTreg
Th17n
●●
●
●
●
●●
●
●
●
●
●●
●
●
●
●
●
●
●
●
●
●
●
●
●
●
●
●
●
●
●
●●
●
●
●
●
●
●
●
●●
●
●
●
●
NR2F1ASCL1
Klf12NR2F2THAP1
Pparg RxraREST
NR4A1Myog
PLAG1ESR2
Myod1Bach1 Mafk
Klf1Zfx
SP2Nr2f6
NR2C2KLF9
Th17 IRF4 RORgWT, Ciofani et al Rep. SL3317KLF4
Th17 IRF4 RORgWT, Ciofani et al Rep. SL2872Th17 IRF4 Batf++, Ciofani et al Rep. SL7824Th17 Batf IRF4WT, Ciofani et al Rep. SL9449Th17 Batf IRF4WT, Ciofani et al Rep. SL8349
Th17 p300 RORgWT, Ciofani et al Rep. SL3594Th17 cMaf WT, Ciofani et al Rep. SL3031
Th17 IRF4 BatfWT, Ciofani et al Rep. SL6628RUNX1
Th17 BATF WT, Ciofani et al Rep. SL10570Th17 IRF4 WT, Ciofani et al Rep. SL9855
Th17 IRF4 WT, Ciofani et al Rep. SL971Th17 p300 WT, Ciofani et al Rep. SL1041
Th17 p300 Batf++, Ciofani et al Rep. SL13870Th17 p300 IRF4++, Ciofani et al Rep. SL13874
Th17 STAT3 RORgWT, Ciofani et al Rep. SL2874Th17 Stat3 WT, Ciofani et al Rep. SL9624Th17 p300 WT, Ciofani et al Rep. SL1042
POU2F2MEF2CPou2f3
POU2F1POU3F1POU3F2POU3F3POU1F1
1.0 1.5 2.0 2.5Fold Enrichment
Differentially AccesiblePeak Group●
●
Th17n_WT_DFMO
Th17n_WT_NoTrt
Significant
●
No
Yes
Top Motifs/ChIP−Seq TFs Enriched
Background: Th17. Peaks in background: 12144Foregrounds: Th17n_WT_NoTrt:1498 ; Th17n_WT_DFMO:155
author/funder. All rights reserved. No reuse allowed without permission. The copyright holder for this preprint (which was not peer-reviewed) is the. https://doi.org/10.1101/2020.01.23.911966doi: bioRxiv preprint

WT
Sat1fl/fl CD4
cre0
10
20
30
40
CNS: IL-17
%IL
-17+
of C
D4
T ce
lls
WT
Sat1fl/fl CD4
cre0
2
4
6
8
10
CNS: IFNg
%IF
Ng+
CD
4+ T
cel
ls
WT
Sat1fl/fl CD4
cre0
5
10
15
20
25
CNS: GMCSF
%G
M-C
SF+
of C
D4
T ce
lls
WT
Sat1fl/fl CD4
cre0
20
40
60
CNS: IL-2
%IL
-2+
of C
D4
T ce
lls
WT
Sat1fl/fl CD4
cre0
2
4
6
CNS: IL-10
%IL
-10+
of C
D4
T ce
lls
A
WT
Sat1fl/fl CD4
cre0.0
0.5
1.0
1.5
2.0
iLN: IL-17
%IL
-17+
of C
D4
T ce
lls
p = 0.06
WT
Sat1fl/fl CD4
cre0.0
0.5
1.0
1.5
iLN: IFNg
%IF
Ng+
CD
4+ T
cel
ls *
WT
Sat1fl/fl CD4
cre0.0
0.5
1.0
1.5
iLN: GMCSF%
GM
-CSF
+ of
CD
4 T
cells *
WT
Sat1fl/fl CD4
cre0
5
10
15
20
iLN: IL-2
%IL
-2+
of C
D4
T ce
lls
WT
Sat1fl/fl CD4
cre0.0
0.5
1.0
1.5
2.0
iLN: IL-10
%IL
-10+
of C
D4
T ce
lls *
WT
Sat1fl/fl CD4
cre0
5
10
15
%Fo
xp3+
of C
D4+
T c
ells
iLN: Foxp3
WT
Sat1fl/fl CD4
cre0.00
0.05
0.10
0.15
0.20
iLN: Rorgt
%Ro
rgt+
CD
4 T
cells
WT
Sat1fl/fl CD4
cre0.15
0.20
0.25
0.30
iLN: Tbet
%Tb
et+ o
f CD
4 T
Cells
B
Figure S4 author/funder. All rights reserved. No reuse allowed without permission. The copyright holder for this preprint (which was not peer-reviewed) is the. https://doi.org/10.1101/2020.01.23.911966doi: bioRxiv preprint

38
Supplementary FIGURE LEGENDS
Supplemental Figure 1. Prediction and metabolic validation of the polyamine pathway as a
candidate in regulating Th17 cell function. (A) Metabolomics analysis of Th17n (green) and
Th17p (red) cells. Cells were differentiated as described (Methods) and harvested at 68h for
LC/MS based metabolomics. Shown are 1,101 differentially expressed metabolites between
Th17n and Th17p (BH-adjusted Welch t-test p < 0.05), 52 of which are identified and divided
between lipids and amino-acid derivatives; (B) Metabolomics analysis of the polyamine
pathway as in Figure 1H. Cell lysates as well as media from Th17n and Th17p differentiation
cultures are shown. (C-D) Carbon tracing in the polyamine pathway. Th17n and Th17p cells
were differentiated as described (Methods), lifted to rest at 68 hours and pulsed with C13 labeled
Arginine (C) or Citrulline (D) followed by LC/MS analysis at time points indicated.
Supplemental Figure 2. Chemical and genetic interference with the polyamine pathway
suppress canonical Th17 cell cytokines. (A) The effect of DFMO on cellular polyamine
concentration is measured by an enzymatic assay. Th17p, Th17n and iTregs are differentiated in
the presence of DFMO and harvested at 96 hours for analysis. (B) Additional analysis of
cytokines in supernatant as in Figure 2C. (C) Protein and phospho-protein analysis by flow
cytometry for Th17n and Th17p cells treated with control of DFMO. (D) The effect of DFMO on
enzymes in the polyamine pathway as measured by qPCR. Th17p and Th17n cells were
differentiated in the presence of control or DFMO and harvested at 48h for RNA extraction and
qPCR analysis. (E) The effect of genetic perturbation of ODC1 on cytokine production from
Th17p (upper panels) and Th17n cells (lower panels). Supernatant from Th17p and Th17n
author/funder. All rights reserved. No reuse allowed without permission. The copyright holder for this preprint (which was not peer-reviewed) is the. https://doi.org/10.1101/2020.01.23.911966doi: bioRxiv preprint

39
differentiation culture was harvested at 96 hours and analyzed by legendplex for cytokine
concentration.
Supplemental Figure 3. DFMO treatment promotes Treg-like transcriptome and
epigenome. (A) Volcano plots showing affected chromatin modifiers by DFMO treatment in
Th17n, Th17p and iTreg cells. (B) Number of differentially expressed (DE) peaks between
DFMO and vehicle-treated cells as a function of the significance threshold. Upper panel, log2FC
used as threshold; Lower panel, BH-adjusted P used as threshold. (C) Motif enrichment analysis
of in vitro differentiated Th17n in the presence (red) or absence (green) of DFMO for Th17
specific genes.
Supplemental Figure 4. Targeting ODC1 and SAT1 alleviate EAE. Cells were isolated from
CNS or inguinal lymph node of WT or SAT1fl/flCD4cre mice on day 15 post EAE induction
(similar experiments as in Figure 4F). (A) Intracellular cytokines were measured by flow
cytometry after 4-hour PMA/ionomycine stimulation ex vivo in the presence of brefaldin and
monensin. (B) Transcription factors were analyzed directly ex vivo by intracellular staining.
author/funder. All rights reserved. No reuse allowed without permission. The copyright holder for this preprint (which was not peer-reviewed) is the. https://doi.org/10.1101/2020.01.23.911966doi: bioRxiv preprint

40
REFERENCE
[1] M. Kleinewietfeld and D. A. Hafler, "The plasticity of human Treg and Th17 cells and its role in autoimmunity," Semin Immunol, vol. 25, pp. 305-12, Nov 15 2013.
[2] M. Noack and P. Miossec, "Th17 and regulatory T cell balance in autoimmune and inflammatory diseases," Autoimmun Rev, vol. 13, pp. 668-77, Jun 2014.
[3] E. Bettelli, Y. Carrier, W. Gao, T. Korn, T. B. Strom, M. Oukka, et al., "Reciprocal developmental pathways for the generation of pathogenic effector TH17 and regulatory T cells," Nature, vol. 441, pp. 235-8, May 11 2006.
[4] P. R. Mangan, L. E. Harrington, D. B. O'Quinn, W. S. Helms, D. C. Bullard, C. O. Elson, et al., "Transforming growth factor-beta induces development of the T(H)17 lineage," Nature, vol. 441, pp. 231-4, May 11 2006.
[5] M. Veldhoen, R. J. Hocking, C. J. Atkins, R. M. Locksley, and B. Stockinger, "TGFbeta in the context of an inflammatory cytokine milieu supports de novo differentiation of IL-17-producing T cells," Immunity, vol. 24, pp. 179-89, Feb 2006.
[6] M. J. McGeachy and D. J. Cua, "Th17 cell differentiation: the long and winding road," Immunity, vol. 28, pp. 445-53, Apr 2008.
[7] L. Guglani and S. A. Khader, "Th17 cytokines in mucosal immunity and inflammation," Curr Opin HIV AIDS, vol. 5, pp. 120-7, Mar 2010.
[8] W. Ouyang, J. K. Kolls, and Y. Zheng, "The biological functions of T helper 17 cell effector cytokines in inflammation," Immunity, vol. 28, pp. 454-67, Apr 2008.
[9] E. Bettelli, T. Korn, M. Oukka, and V. K. Kuchroo, "Induction and effector functions of T(H)17 cells," Nature, vol. 453, pp. 1051-7, Jun 19 2008.
[10] T. Korn, E. Bettelli, M. Oukka, and V. K. Kuchroo, "IL-17 and Th17 Cells," Annu Rev Immunol, vol. 27, pp. 485-517, 2009.
[11] S. L. Gaffen, N. Hernandez-Santos, and A. C. Peterson, "IL-17 signaling in host defense against Candida albicans," Immunol Res, vol. 50, pp. 181-7, Aug 2011.
[12] L. Romani, "Immunity to fungal infections," Nat Rev Immunol, vol. 11, pp. 275-88, Apr 2011.
[13] A. Jager, V. Dardalhon, R. A. Sobel, E. Bettelli, and V. K. Kuchroo, "Th1, Th17, and Th9 effector cells induce experimental autoimmune encephalomyelitis with different pathological phenotypes," J Immunol, vol. 183, pp. 7169-77, Dec 1 2009.
[14] Y. Lee, A. Awasthi, N. Yosef, F. J. Quintana, S. Xiao, A. Peters, et al., "Induction and molecular signature of pathogenic TH17 cells," Nat Immunol, vol. 13, pp. 991-9, Oct 2012.
[15] M. J. McGeachy, K. S. Bak-Jensen, Y. Chen, C. M. Tato, W. Blumenschein, T. McClanahan, et al., "TGF-beta and IL-6 drive the production of IL-17 and IL-10 by T cells and restrain T(H)-17 cell-mediated pathology," Nat Immunol, vol. 8, pp. 1390-7, Dec 2007.
[16] A. Awasthi, L. Riol-Blanco, A. Jager, T. Korn, C. Pot, G. Galileos, et al., "Cutting edge: IL-23 receptor gfp reporter mice reveal distinct populations of IL-17-producing cells," J Immunol, vol. 182, pp. 5904-8, May 15 2009.
[17] D. J. Cua, J. Sherlock, Y. Chen, C. A. Murphy, B. Joyce, B. Seymour, et al., "Interleukin-23 rather than interleukin-12 is the critical cytokine for autoimmune inflammation of the brain," Nature, vol. 421, pp. 744-8, Feb 13 2003.
author/funder. All rights reserved. No reuse allowed without permission. The copyright holder for this preprint (which was not peer-reviewed) is the. https://doi.org/10.1101/2020.01.23.911966doi: bioRxiv preprint
41
[18] M. J. McGeachy, Y. Chen, C. M. Tato, A. Laurence, B. Joyce-Shaikh, W. M. Blumenschein, et al., "The interleukin 23 receptor is essential for the terminal differentiation of interleukin 17-producing effector T helper cells in vivo," Nat Immunol, vol. 10, pp. 314-24, Mar 2009.
[19] Y. Chung, S. H. Chang, G. J. Martinez, X. O. Yang, R. Nurieva, H. S. Kang, et al., "Critical regulation of early Th17 cell differentiation by interleukin-1 signaling," Immunity, vol. 30, pp. 576-87, Apr 17 2009.
[20] K. Ghoreschi, A. Laurence, X. P. Yang, C. M. Tato, M. J. McGeachy, J. E. Konkel, et al., "Generation of pathogenic T(H)17 cells in the absence of TGF-beta signalling," Nature, vol. 467, pp. 967-71, Oct 21 2010.
[21] Y. Lee, M. Collins, and V. K. Kuchroo, "Unexpected targets and triggers of autoimmunity," J Clin Immunol, vol. 34 Suppl 1, pp. S56-60, Jul 2014.
[22] C. E. Zielinski, F. Mele, D. Aschenbrenner, D. Jarrossay, F. Ronchi, M. Gattorno, et al., "Pathogen-induced human TH17 cells produce IFN-gamma or IL-10 and are regulated by IL-1beta," Nature, vol. 484, pp. 514-8, Apr 26 2012.
[23] C. Wang, N. Yosef, J. Gaublomme, C. Wu, Y. Lee, C. B. Clish, et al., "CD5L/AIM Regulates Lipid Biosynthesis and Restrains Th17 Cell Pathogenicity," Cell, vol. 163, pp. 1413-27, Dec 3 2015.
[24] J. T. Gaublomme, N. Yosef, Y. Lee, R. S. Gertner, L. V. Yang, C. Wu, et al., "Single-Cell Genomics Unveils Critical Regulators of Th17 Cell Pathogenicity," Cell, vol. 163, pp. 1400-12, Dec 3 2015.
[25] J. D. Orth, I. Thiele, and B. O. Palsson, "What is flux balance analysis?," Nat Biotechnol, vol. 28, pp. 245-8, Mar 2010.
[26] E. J. O'Brien, J. M. Monk, and B. O. Palsson, "Using Genome-scale Models to Predict Biological Capabilities," Cell, vol. 161, pp. 971-987, May 21 2015.
[27] I. Thiele, N. Swainston, R. M. Fleming, A. Hoppe, S. Sahoo, M. K. Aurich, et al., "A community-driven global reconstruction of human metabolism," Nat Biotechnol, vol. 31, pp. 419-25, May 2013.
[28] T. L. Bowlin, B. J. McKown, and P. S. Sunkara, "The effect of alpha-difluoromethylornithine, an inhibitor of polyamine biosynthesis, on mitogen-induced interleukin 2 production," Immunopharmacology, vol. 13, pp. 143-7, Apr 1987.
[29] J. Jell, S. Merali, M. L. Hensen, R. Mazurchuk, J. A. Spernyak, P. Diegelman, et al., "Genetically altered expression of spermidine/spermine N1-acetyltransferase affects fat metabolism in mice via acetyl-CoA," J Biol Chem, vol. 282, pp. 8404-13, Mar 16 2007.
[30] A. E. Pegg, "Spermidine/spermine-N(1)-acetyltransferase: a key metabolic regulator," Am J Physiol Endocrinol Metab, vol. 294, pp. E995-1010, Jun 2008.
[31] B. C. Mounce, E. Z. Poirier, G. Passoni, E. Simon-Loriere, T. Cesaro, M. Prot, et al., "Interferon-Induced Spermidine-Spermine Acetyltransferase and Polyamine Depletion Restrict Zika and Chikungunya Viruses," Cell Host Microbe, vol. 20, pp. 167-77, Aug 10 2016.
[32] S. Xiao, N. Yosef, J. Yang, Y. Wang, L. Zhou, C. Zhu, et al., "Small-molecule RORgammat antagonists inhibit T helper 17 cell transcriptional network by divergent mechanisms," Immunity, vol. 40, pp. 477-89, Apr 17 2014.
[33] Q. Li, J. Zou, M. Wang, X. Ding, I. Chepelev, X. Zhou, et al., "Critical role of histone demethylase Jmjd3 in the regulation of CD4+ T-cell differentiation," Nat Commun, vol. 5, p. 5780, 2014.
[34] E. Karouzakis, R. E. Gay, S. Gay, and M. Neidhart, "Increased recycling of polyamines is associated with global DNA hypomethylation in rheumatoid arthritis synovial fibroblasts," Arthritis Rheum, vol. 64, pp. 1809-17, Jun 2012.
[35] H. C. Hsu, J. R. Seibold, and T. J. Thomas, "Regulation of ornithine decarboxylase in the kidney of autoimmune mice with the lpr gene," Autoimmunity, vol. 19, pp. 253-64, 1994.
author/funder. All rights reserved. No reuse allowed without permission. The copyright holder for this preprint (which was not peer-reviewed) is the. https://doi.org/10.1101/2020.01.23.911966doi: bioRxiv preprint
42
[36] W. H. Brooks, "Increased polyamines alter chromatin and stabilize autoantigens in autoimmune diseases," Front Immunol, vol. 4, p. 91, 2013.
[37] A. E. Pegg, "Mammalian polyamine metabolism and function," IUBMB Life, vol. 61, pp. 880-94, Sep 2009.
[38] A. E. Pegg, "Functions of Polyamines in Mammals," J Biol Chem, vol. 291, pp. 14904-12, Jul 15 2016.
[39] D. Kraus, Q. Yang, D. Kong, A. S. Banks, L. Zhang, J. T. Rodgers, et al., "Nicotinamide N-methyltransferase knockdown protects against diet-induced obesity," Nature, vol. 508, pp. 258-62, Apr 10 2014.
[40] A. C. Childs, D. J. Mehta, and E. W. Gerner, "Polyamine-dependent gene expression," Cell Mol Life Sci, vol. 60, pp. 1394-406, Jul 2003.
[41] K. Tamari, M. Konno, A. Asai, J. Koseki, K. Hayashi, K. Kawamoto, et al., "Polyamine flux suppresses histone lysine demethylases and enhances ID1 expression in cancer stem cells," Cell Death Discov, vol. 4, p. 104, 2018.
[42] T. Murray-Stewart, M. Dunworth, J. R. Foley, C. E. Schwartz, and R. A. Casero, Jr., "Polyamine Homeostasis in Snyder-Robinson Syndrome," Med Sci (Basel), vol. 6, Dec 7 2018.
[43] D. Cipolletta, D. Kolodin, C. Benoist, and D. Mathis, "Tissular T(regs): a unique population of adipose-tissue-resident Foxp3+CD4+ T cells that impacts organismal metabolism," Semin Immunol, vol. 23, pp. 431-7, Dec 2011.
[44] S. Epelman, K. J. Lavine, and G. J. Randolph, "Origin and functions of tissue macrophages," Immunity, vol. 41, pp. 21-35, Jul 17 2014.
[45] N. E. Lewis, H. Nagarajan, and B. O. Palsson, "Constraining the metabolic genotype-phenotype relationship using a phylogeny of in silico methods," Nat Rev Microbiol, vol. 10, pp. 291-305, Feb 27 2012.
[46] B. O. Palsson, Systems Biology: Constraint-Based Reconstruction and Analysis. 2nd ed.edition. : Cambridge University Press., 2015.
[47] M. Singer, C. Wang, L. Cong, N. D. Marjanovic, M. S. Kowalczyk, H. Zhang, et al., "A Distinct Gene Module for Dysfunction Uncoupled from Activation in Tumor-Infiltrating T Cells," Cell, vol. 166, pp. 1500-1511 e9, Sep 08 2016.
[48] M. B. Cole, D. Risso, A. Wagner, D. DeTomaso, J. Ngai, E. Purdom, et al., "Performance Assessment and Selection of Normalization Procedures for Single-Cell RNA-Seq," Cell Syst, vol. 8, pp. 315-328 e8, Apr 24 2019.
[49] M. R. Corces, J. D. Buenrostro, B. Wu, P. G. Greenside, S. M. Chan, J. L. Koenig, et al., "Lineage-specific and single-cell chromatin accessibility charts human hematopoiesis and leukemia evolution," Nat Genet, vol. 48, pp. 1193-203, Oct 2016.
[50] A. M. Bolger, M. Lohse, and B. Usadel, "Trimmomatic: a flexible trimmer for Illumina sequence data," Bioinformatics, vol. 30, pp. 2114-20, Aug 1 2014.
[51] B. Langmead and S. L. Salzberg, "Fast gapped-read alignment with Bowtie 2," Nat Methods, vol. 9, pp. 357-9, Mar 4 2012.
[52] J. D. Buenrostro, P. G. Giresi, L. C. Zaba, H. Y. Chang, and W. J. Greenleaf, "Transposition of native chromatin for fast and sensitive epigenomic profiling of open chromatin, DNA-binding proteins and nucleosome position," Nat Methods, vol. 10, pp. 1213-8, Dec 2013.
[53] Y. Zhang, T. Liu, C. A. Meyer, J. Eeckhoute, D. S. Johnson, B. E. Bernstein, et al., "Model-based analysis of ChIP-Seq (MACS)," Genome Biol, vol. 9, p. R137, 2008.
[54] M. I. Love, W. Huber, and S. Anders, "Moderated estimation of fold change and dispersion for RNA-seq data with DESeq2," Genome Biol, vol. 15, p. 550, 2014.
[55] A. Khan, O. Fornes, A. Stigliani, M. Gheorghe, J. A. Castro-Mondragon, R. van der Lee, et al., "JASPAR 2018: update of the open-access database of transcription factor
author/funder. All rights reserved. No reuse allowed without permission. The copyright holder for this preprint (which was not peer-reviewed) is the. https://doi.org/10.1101/2020.01.23.911966doi: bioRxiv preprint
43
binding profiles and its web framework," Nucleic Acids Res, vol. 46, pp. D260-D266, Jan 4 2018.
[56] C. E. Grant, T. L. Bailey, and W. S. Noble, "FIMO: scanning for occurrences of a given motif," Bioinformatics, vol. 27, pp. 1017-8, Apr 1 2011.
[57] R. Lesurf, K. C. Cotto, G. Wang, M. Griffith, K. Kasaian, S. J. Jones, et al., "ORegAnno 3.0: a community-driven resource for curated regulatory annotation," Nucleic Acids Res, vol. 44, pp. D126-32, Jan 4 2016.
[58] C. Y. McLean, D. Bristor, M. Hiller, S. L. Clarke, B. T. Schaar, C. B. Lowe, et al., "GREAT improves functional interpretation of cis-regulatory regions," Nat Biotechnol, vol. 28, pp. 495-501, May 2010.
author/funder. All rights reserved. No reuse allowed without permission. The copyright holder for this preprint (which was not peer-reviewed) is the. https://doi.org/10.1101/2020.01.23.911966doi: bioRxiv preprint