epigenomic signatures of neuronal diversity in the ...papers.cnl.salk.edu/pdfs/epigenomic signatures...
TRANSCRIPT
NeuroResource
Epigenomic Signatures of Neuronal Diversity in theMammalian Brain
Highlights
d Affinity purification of nuclei in mice enables cell-type-
specific epigenomics
d 3 neuron types adopt unique landscapes of DNA methylation
and accessible chromatin
d Distinct TF sets are predicted to bind neuron type-specific
gene regulatory regions
d A hyper-methylation signature in adult neurons captures
developmental history
Authors
Alisa Mo, Eran A. Mukamel,
Fred P. Davis, ..., Sean R. Eddy,
Joseph R. Ecker, Jeremy Nathans
[email protected] (J.R.E.),[email protected] (J.N.)
In Brief
Mo et al. develop a broadly applicable
tool to purify genetically labeled nuclei in
mice and, using genome-wide maps of
gene expression, DNA methylation, and
chromatin accessibility, show how three
neuronal subtypes adopt distinct
epigenomic configurations associated
with function and development.
Accession Numbers
GSE63137
Mo et al., 2015, Neuron 86, 1369–1384June 17, 2015 ª2015 Elsevier Inc.http://dx.doi.org/10.1016/j.neuron.2015.05.018
Neuron
NeuroResource
Epigenomic Signaturesof Neuronal Diversity in the Mammalian BrainAlisa Mo,1,2,11 Eran A. Mukamel,3,4,11 Fred P. Davis,5,11 Chongyuan Luo,6,11 Gilbert L. Henry,5 Serge Picard,5
Mark A. Urich,6 Joseph R. Nery,6 Terrence J. Sejnowski,3,7,8 Ryan Lister,6,9 Sean R. Eddy,5 Joseph R. Ecker,6,8,*and Jeremy Nathans1,2,10,*1Department of Molecular Biology and Genetics2Department of Neuroscience
Johns Hopkins University School of Medicine, Baltimore, MD 21205, USA3Computational Neurobiology Laboratory, The Salk Institute for Biological Studies, La Jolla, CA 92037, USA4Department of Cognitive Science, University of California San Diego, La Jolla, CA 92037, USA5Janelia Research Campus, Howard Hughes Medical Institute, Ashburn, VA 20147, USA6Genomic Analysis Laboratory, The Salk Institute for Biological Studies, La Jolla, CA 92037, USA7Division of Biological Sciences, University of California at San Diego, La Jolla, CA 92037, USA8Howard Hughes Medical Institute, The Salk Institute for Biological Studies, La Jolla, CA 92037, USA9The ARC Centre of Excellence in Plant Energy Biology, The University of Western Australia, Crawley, Western Australia 6009, Australia10Howard Hughes Medical Institute, Johns Hopkins University School of Medicine, Baltimore, MD 21205, USA11Co-first author*Correspondence: [email protected] (J.R.E.), [email protected] (J.N.)
http://dx.doi.org/10.1016/j.neuron.2015.05.018
SUMMARY
Neuronal diversity is essential for mammalian brainfunction but poses a challenge tomolecular profiling.To address the need for tools that facilitate cell-type-specific epigenomic studies, we developed thefirst affinity purification approach to isolate nucleifrom genetically defined cell types in a mammal.We combine this technique with next-generationsequencing to show that three subtypes of neocor-tical neurons have highly distinctive epigenomiclandscapes. Over 200,000 regions differ in chromatinaccessibility and DNA methylation signatures char-acteristic of gene regulatory regions. By footprintingand motif analyses, these regions are predicted tobinddistinct cohorts of neuron subtype-specific tran-scription factors. Neuronal epigenomes reflect bothpast and present gene expression, with DNA hyper-methylation at developmentally critical genes ap-pearing as a novel epigenomic signature in matureneurons. Taken together, our findings link the func-tional and transcriptional complexity of neurons totheir underlying epigenomic diversity.
INTRODUCTION
In the mammalian brain, distinct types of neurons interact in
intricate networks to govern thought, emotion, and behavior.
Neurons can differ in their morphologies, synaptic connec-
tions, electrophysiological properties, neurotransmitter identi-
ties, and developmental histories. The balance of signaling
across heterogeneous neurons is critical for healthy brain
function, and disruptions of genes that mediate this balance
are implicated in neurological and psychiatric diseases (Sulli-
van et al., 2012).
Neuronal diversity arises partly through spatiotemporal
regulation of gene expression by regulatory regions such as
promoters and enhancers. These discrete regions of DNA
can be identified using epigenomic signatures, which include
accessible chromatin, active histone modifications, and low
levels of DNA methylation (Bird, 2002; Heintzman et al.,
2007; Stadler et al., 2011; Thurman et al., 2012). Neurons un-
dergo extensive epigenomic changes during post-natal brain
development, including de novo establishment of non-CG
methylation (Lister et al., 2013; Xie et al., 2012). However,
the genome-wide patterns of accessible chromatin and both
CG and non-CG methylation in specific neuronal subpopula-
tions are unknown. We reasoned that neuronal epigenomic
landscapes should mirror neuronal diversity. Whereas gene
expression analysis provides a snapshot of a neuron’s molec-
ular activity at a single point in time, the complementary epige-
nomic information captures gene regulatory mechanisms,
developmental origins, and potential future responses induced
by neuronal activity.
Cellular diversity is important for brain function, but it also
poses a technical challenge for epigenomic studies. Cell-type-
specific molecular profiling requires the isolation of targeted
cell populations from complex tissues (Maze et al., 2014).
Manual sorting (Sugino et al., 2006) and laser capture microdis-
section (Emmert-Buck et al., 1996) are useful for isolating
small numbers of cells but do not provide enough material
for epigenomic studies. Fluorescence-activated cell sorting
(FACS) can isolate larger numbers of cells but may be chal-
lenging in tissues such as the adult brain, where cells are
morphologically complex and densely interconnected. Although
improvements have been made (Saxena et al., 2012), the
neuronal dissociation process may also induce cellular stress
Neuron 86, 1369–1384, June 17, 2015 ª2015 Elsevier Inc. 1369
responses and perturb subsequent molecular profiles. Geneti-
cally directed strategies that isolate RNA from specific cell pop-
ulations in mice (Doyle et al., 2008; Gay et al., 2013; Heiman
et al., 2008; Sanz et al., 2009) have begun to chart transcrip-
tional diversity across cell types but cannot profile epigenomic
features unless combined with FACS (Mellen et al., 2012).
Although nuclei can be isolated by FACS for epigenomic
studies (Jiang et al., 2008), FACS-sorted nuclei are fragile and
difficult to concentrate into the small volumes that are optimal
for chromatin assays. An alternate approach is INTACT (isola-
tion of nuclei tagged in specific cell types; Deal and Henikoff,
2010), which uses affinity purification to isolate tagged nuclei.
Captured nuclei can be used for gene expression, epigenomic,
and proteomic profiling (Amin et al., 2014; Henry et al., 2012;
Steiner et al., 2012).
Here, we present the first application of INTACT in a
mammalian organism and use it to address the cell-type-spe-
cific neuronal epigenome. Our approach uses the Cre-loxP
system in mice to express a tagged nuclear membrane protein,
allowing affinity purification of labeled nuclei from genetically
defined cell populations. In this study, we applied INTACT
to examine the core transcriptional and epigenomic features
of three major functional classes of neocortical neurons:
excitatory pyramidal neurons, Parvalbumin (PV)-expressing
fast-spiking interneurons, and Vasoactive intestinal peptide
(VIP)-expressing interneurons. 70%–85% of cortical neurons
are excitatory. The remaining 15%–30% are inhibitory neurons,
with approximately 40% expressing PV and 12% expressing
VIP (Gelman and Marın, 2010; Rudy et al., 2011). Together,
these mutually exclusive cell types represent both glutamater-
gic (excitatory) and GABAergic (inhibitory) signaling. Neocor-
tical pyramidal neurons provide the long-range excitatory
output of the brain, and inhibitory neurons modulate the rate
and temporal structure of this network output (Molyneaux
et al., 2007; Rudy et al., 2011). PV and VIP neurons have
distinct computational roles as a result of differences in their
firing patterns and synaptic connections (Kepecs and Fishell,
2014).
Several studies have identified genome-wide differences in
gene expression across neuronal subpopulations (Doyle et al.,
2008; Molyneaux et al., 2015; Sugino et al., 2006). However,
neuron subtype-specific epigenomes remain largely unexplored.
We find that among excitatory, PV, and VIP neurons, global epi-
genomic landscapes of DNA methylation and chromatin acces-
sibility show widespread differences. These differences reflect
distinct mechanisms of gene regulation, with candidate regula-
tors identified using transcription factor (TF) footprinting and
motif analyses. Integrating epigenomes together with expression
profiles, we find intragenic non-CGmethylation to be particularly
salient for inferring neuronal gene expression. At TF genes with
cell-type-specific developmental roles, we further identify a
unique pattern of DNA hyper-methylation in adult neurons that
is a long-lasting epigenomic signature of transient expression
during brain development. Collectively, our results provide a
comprehensive view of how distinct neuronal classes adopt
unique epigenomic and gene regulatory configurations that
reflect both mature neuronal function as well as developmental
origin.
1370 Neuron 86, 1369–1384, June 17, 2015 ª2015 Elsevier Inc.
RESULTS
Mammalian INTACT Isolates Specific Populations ofNeuronal Nuclei from the BrainTo generate amouse line for affinity purification of labeled nuclei,
we tagged the C terminus of mouse SUN1, a nuclear membrane
protein, with two tandem copies of superfolder GFP and six
copies of the Myc epitope (SUN1-sfGFP-Myc). We targeted
Sun1-sfGFP-myc to the ubiquitously expressed Rosa26 locus
preceded by a CAG promoter and a loxP-3x polyA-loxP
transcriptional roadblock (R26-CAG-LSL-Sun1-sfGFP-myc)
(Figure 1A). Cells expressing Cre recombinase remove the
roadblock and allow transcription of Sun1-sfGFP-myc. We first
recombined R26-CAG-LSL-Sun1-sfGFP-myc in all cells using
Sox2-Cre, a germline Cre driver (Figure S1A). Sox2-Cre; R26-
CAG-LSL-Sun1-sfGFP-myc mice are healthy and fertile with no
obvious phenotypic deficits, indicating that long-term expres-
sion of the fusion protein is well tolerated.
We expressed Sun1-sfGFP-myc in excitatory (Exc) neurons
(Camk2a-Cre), PV interneurons (PV-Cre), and VIP interneurons
(VIP-Cre) (Figure 1B and Table S1). Immunohistochemistry tar-
geting GFP showed that the SUN1 fusion protein is localized to
the nuclear periphery. Quantification of labeled nuclei together
with neuronal markers (Figures 1B and S1B–S1G) indicated
that each Cre driver predominantly recombines the targeted
cell type. The pattern of labeling using anti-Myc is identical to
anti-GFP (Figure S1H).
We next developed an affinity purification method to capture
GFP+/Myc+ nuclei from fresh tissue homogenates (Figure 1C).
Either anti-GFP or anti-Myc antibodies, together with Protein
G-coated magnetic beads, can be used to isolate nuclei from
both rare and common cell types with high yield and specificity.
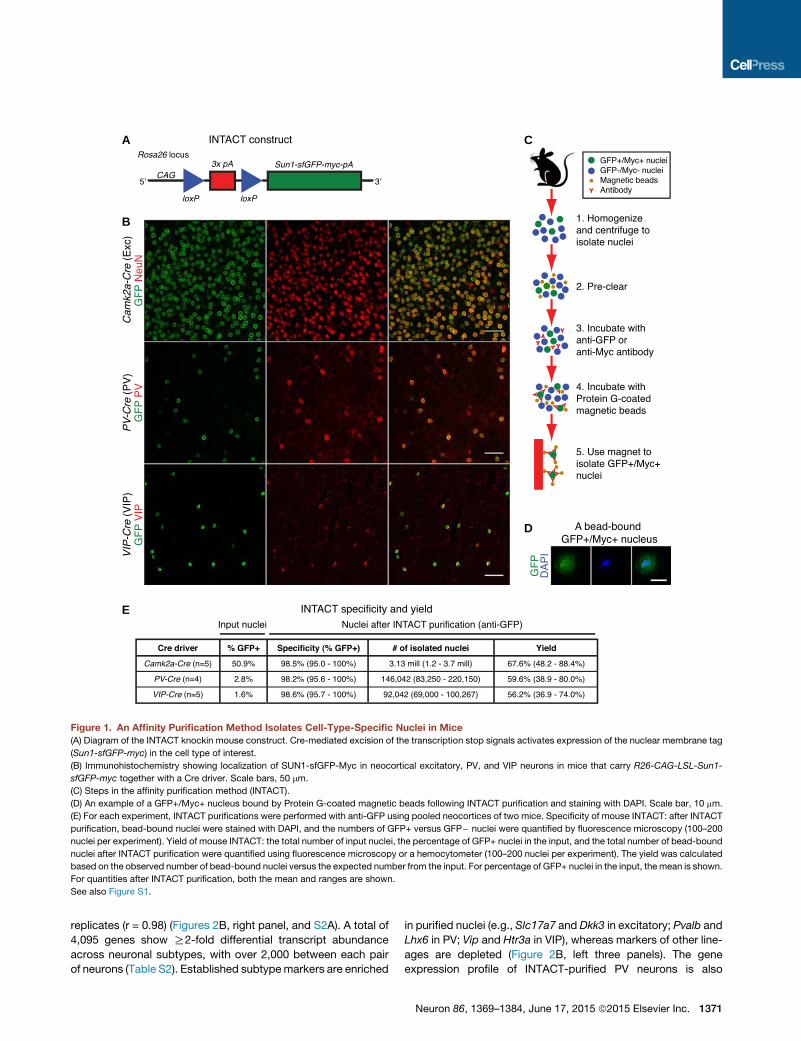
Examination of input versus affinity-purified (anti-GFP) nuclei
(Figure 1D) by fluorescence microscopy showed that INTACT
achieves >98% purity with >50% yield, even for cell types that
represent only 1%–3% of the starting tissue (Figure 1E). Similar
results were obtained using anti-Myc (95%–98% purity with
42%–65%yield, n = 3). To further assess the specificity ofmouse
INTACT, we performed flow cytometry on input and affinity puri-
fied (anti-Myc) nuclei from VIP-Cre; R26-CAG-LSL-Sun1-sfGFP-
myc mice (Figure S1I). Flow cytometry showed that more than
99% of input nuclei (after step 2 in Figure 1C) were singlets, cor-
responding to well-isolated nuclei, and 1.5% of input nuclei were
GFP+. In contrast, 98.9% of affinity purified nuclei were GFP+.
Similar results were obtained using anti-GFP (Figure S1J). There-
fore, both manual quantification and flow cytometry indicate that
mouse INTACT isolates highly pure preparations of tagged
nuclei.
INTACT RNA-Seq Captures Neuronal Subtype MarkersTo assess patterns of gene expression and DNA methylation in
distinct neuronal subtypes, we used RNA-seq to profile tran-
script abundance from INTACT-purified nuclei in adult mice,
and we used MethylC-seq to generate single-base resolution
methylome maps (Lister et al., 2008) from the same cell types,
with the caveat that bisulfite sequencing does not differentiate
between methylcytosine (mC) and hydroxymethylcytosine
(hmC) (Figure 2A). RNA-seq profiles are highly similar across
A
B
C
D
E
Figure 1. An Affinity Purification Method Isolates Cell-Type-Specific Nuclei in Mice
(A) Diagram of the INTACT knockin mouse construct. Cre-mediated excision of the transcription stop signals activates expression of the nuclear membrane tag
(Sun1-sfGFP-myc) in the cell type of interest.
(B) Immunohistochemistry showing localization of SUN1-sfGFP-Myc in neocortical excitatory, PV, and VIP neurons in mice that carry R26-CAG-LSL-Sun1-
sfGFP-myc together with a Cre driver. Scale bars, 50 mm.
(C) Steps in the affinity purification method (INTACT).
(D) An example of a GFP+/Myc+ nucleus bound by Protein G-coated magnetic beads following INTACT purification and staining with DAPI. Scale bar, 10 mm.
(E) For each experiment, INTACT purifications were performed with anti-GFP using pooled neocortices of two mice. Specificity of mouse INTACT: after INTACT
purification, bead-bound nuclei were stained with DAPI, and the numbers of GFP+ versus GFP� nuclei were quantified by fluorescence microscopy (100–200
nuclei per experiment). Yield of mouse INTACT: the total number of input nuclei, the percentage of GFP+ nuclei in the input, and the total number of bead-bound
nuclei after INTACT purification were quantified using fluorescence microscopy or a hemocytometer (100–200 nuclei per experiment). The yield was calculated
based on the observed number of bead-bound nuclei versus the expected number from the input. For percentage of GFP+ nuclei in the input, the mean is shown.
For quantities after INTACT purification, both the mean and ranges are shown.
See also Figure S1.
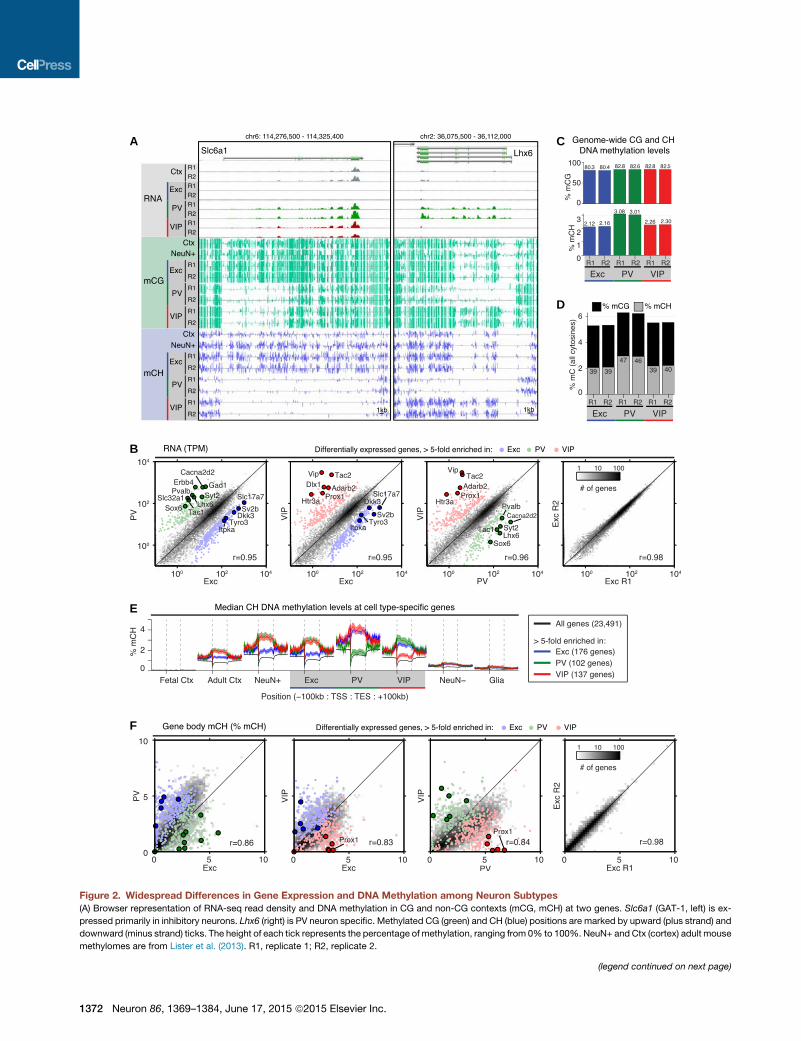
replicates (r = 0.98) (Figures 2B, right panel, and S2A). A total of
4,095 genes show R2-fold differential transcript abundance
across neuronal subtypes, with over 2,000 between each pair
of neurons (Table S2). Established subtypemarkers are enriched
in purified nuclei (e.g., Slc17a7 and Dkk3 in excitatory; Pvalb and
Lhx6 in PV; Vip and Htr3a in VIP), whereas markers of other line-
ages are depleted (Figure 2B, left three panels). The gene
expression profile of INTACT-purified PV neurons is also
Neuron 86, 1369–1384, June 17, 2015 ª2015 Elsevier Inc. 1371
A
B
C
D
E
F
Figure 2. Widespread Differences in Gene Expression and DNA Methylation among Neuron Subtypes
(A) Browser representation of RNA-seq read density and DNA methylation in CG and non-CG contexts (mCG, mCH) at two genes. Slc6a1 (GAT-1, left) is ex-
pressed primarily in inhibitory neurons. Lhx6 (right) is PV neuron specific. Methylated CG (green) and CH (blue) positions are marked by upward (plus strand) and
downward (minus strand) ticks. The height of each tick represents the percentage of methylation, ranging from 0% to 100%. NeuN+ and Ctx (cortex) adult mouse
methylomes are from Lister et al. (2013). R1, replicate 1; R2, replicate 2.
(legend continued on next page)
1372 Neuron 86, 1369–1384, June 17, 2015 ª2015 Elsevier Inc.
consistent with RNA microarray data from manually sorted PV
neurons (Figure S2B). We further used double fluorescent
in situ hybridization to examine ten genes with previously un-
known specificity in neocortical excitatory or PV neurons. Probe
labeling for nine out of ten genes co-localized with the neuron
type as predicted by RNA-seq and was excluded from other
classes (Figure S2C), indicating that INTACT RNA-seq profiles
identify novel patterns of gene expression.
Non-CG Methylation Is a Common Feature of BothExcitatory and Inhibitory Neurons, but ShowsWidespread Differences in Genomic DistributionIn our MethylC-seq data, we observed substantial levels of DNA
methylation in the non-CG context for all three neuronal popula-
tions (Figures 2A, 2C, and 2D). In most differentiated mammalian
cells, DNAmethylation is largely confined to the CG dinucleotide
context. On the other hand, non-CG methylation (mCH, where
H = A, C, or T) is a special feature of adult neurons but accumu-
lates at much lower levels in adult glia and non-neuronal tissues
(Lister et al., 2013; Xie et al., 2012). We find that mCH is most
abundant in PV neurons (Figure 2C), where it constitutes nearly
half (46%–47%) of the total methylcytosines (Figure 2D).
Because mCH accumulates during the first weeks of post-natal
development, coincident with the period of rapid synaptogene-
sis and long after excitatory and inhibitory lineages have
diverged (Guo et al., 2014; Lister et al., 2013), these data suggest
that a high level of non-CG methylation is a shared distinction of
mature cortical neurons. Furthermore, because all three neuron
subtypes share similar motif preferences for mCH, with CAC
showing the highest methylation level (Figure S2D), it is likely
that a common enzymatic mechanism (Gabel et al., 2015; Guo
et al., 2014) is responsible for mCH deposition and maintenance
in these neurons.
Both promoter and intragenic DNA methylation in CG and
CH contexts inversely correlate with gene expression in the
mammalian brain (Lister et al., 2013; Xie et al., 2012). However,
a lack of cell-type specificity in existing in vivo datasets can
complicate the interpretation at individual genes. For example,
Slc6a1 (GAT-1, primarily expressed in inhibitory neurons) and
Lhx6 (a PV-specific TF) appear to be both actively transcribed
and highly methylated in samples of whole cortical tissue and
in mixed neurons (NeuN+) (Figure 2A). Our datasets from
INTACT-purified nuclei resolve these conflicting signals by
showing that active gene expression and DNA methylation do
not occur in the same cells but rather in distinct subpopulations.
Using a list of highly specific genes from our RNA-seq data, we
(B) Pairwise comparisons of protein-coding gene expression measured by RNA-s
most differentially expressed genes (>5-fold change) are shown as colored poin
log(TPM+0.1); TPM, transcripts per million.
(C) Percentage of MethylC-seq calls supporting methylation in the CG and CH c
(D) Percentage of all MethylC-seq calls supporting methylation. The number in ea
occur in the CH context.
(E) Median ± 1 SEM of percentage of mCH within and surrounding gene bodies
differentially expressed genes identified from our RNA-seq data (>5-fold change
site; TES, transcription end site; SEM, standard error of the mean.
(F) Pairwise comparisons of gene body percentage of mCH across cell types (left t
same genes shown in (B).
See also Figure S2.
find that both intragenic and promoter levels of CH (Figure 2E)
and CG (Figure S2E) methylation are higher in the non-express-
ing cell type.
DNA methylation levels in gene bodies are highly variable
across neuronal subtypes. As measured by pairwise Pearson
correlations (Figures 2B, 2F, S2A, and S2F–S2H), gene body
mCH levels are more divergent (r = 0.83–0.86) than both gene
expression levels (r = 0.95–0.96, p = 0.003, t test) andmCG levels
(r = 0.93–0.94, p = 0.001), whereas biological replicate signals
are nearly identical for all features (rR 0.97). After normalization
to adjust for the genome-wide average level of mCH, 8,662
genes (38%) show >50% difference in intragenic mCH in at least
one pairwise comparison of cell types, versus 6.1% between
biological replicates (Figure S2I, top). Certain genes display
notably higher differences. For example, the VIP-specific TF
Prox1 has 23-fold higher mCH in excitatory neurons and
32-fold higher mCH in PV neurons compared to VIP neurons
(Figure 2F). Variability in gene body CH methylation is paralleled
by extensive differences at a global scale (Figure S2I, bottom).
Genome-wide, 37% of all 5 kb bins show >50% difference in
mCH between at least one pair of cell types, compared to only
3.8% between biological replicates.
Neuronal Regulatory DNA Is Predominantly Cell TypeSpecificLocalized regions of accessible chromatin and low levels of DNA
methylation are well-established signatures of cis-regulatory
elements such as promoters and enhancers (Neph et al., 2012;
Stadler et al., 2011; Thurman et al., 2012). Therefore, wemapped
the locations of putative gene regulatory regions in specific
neuronal subtypes by systematically identifying these two fea-
tures (Figures 3A and S3A). In excitatory neurons, we also pro-
filed histone modifications using chromatin immunoprecipitation
(ChIP) followed by sequencing to identify potential promoters
(marked by H3K4me3), enhancers (H3K4me1 and H3K27ac),
and Polycomb-associated repressed regions (H3K27me3). A
limitation of our analysis is that we generally did not factor in
sequence variation across mouse strains, which could poten-
tially affect mapping to the C57BL/6 reference genome as well
as levels of chromatin accessibility and DNA methylation (but
see Supplemental Experimental Procedures).
We identified 322,452 discrete peaks of chromatin accessi-
bility (median length 501 bp) in excitatory, PV, and VIP neurons
using sub-nucleosomal (<100 bp) reads resulting from in vitro
transposition of native chromatin by Tn5 transposase (ATAC-
seq, Buenrostro et al., 2013) (Table S3). We find that most
eq across cell types (left three panels) or between replicates (right panel). The
ts, and selected cell-type-specific genes are labeled. r, Pearson correlation of
ontexts for each cell type on autosomes.
ch bar indicates the percentage of all methylated cytosines on autosomes that
, showing an inverse correlation between expression and DNA methylation at
for one cell type relative to both of the other cell types). TSS, transcription start
hree panels) or between replicates (right panel). Colored dots correspond to the
Neuron 86, 1369–1384, June 17, 2015 ª2015 Elsevier Inc. 1373
A
B
C
E
D
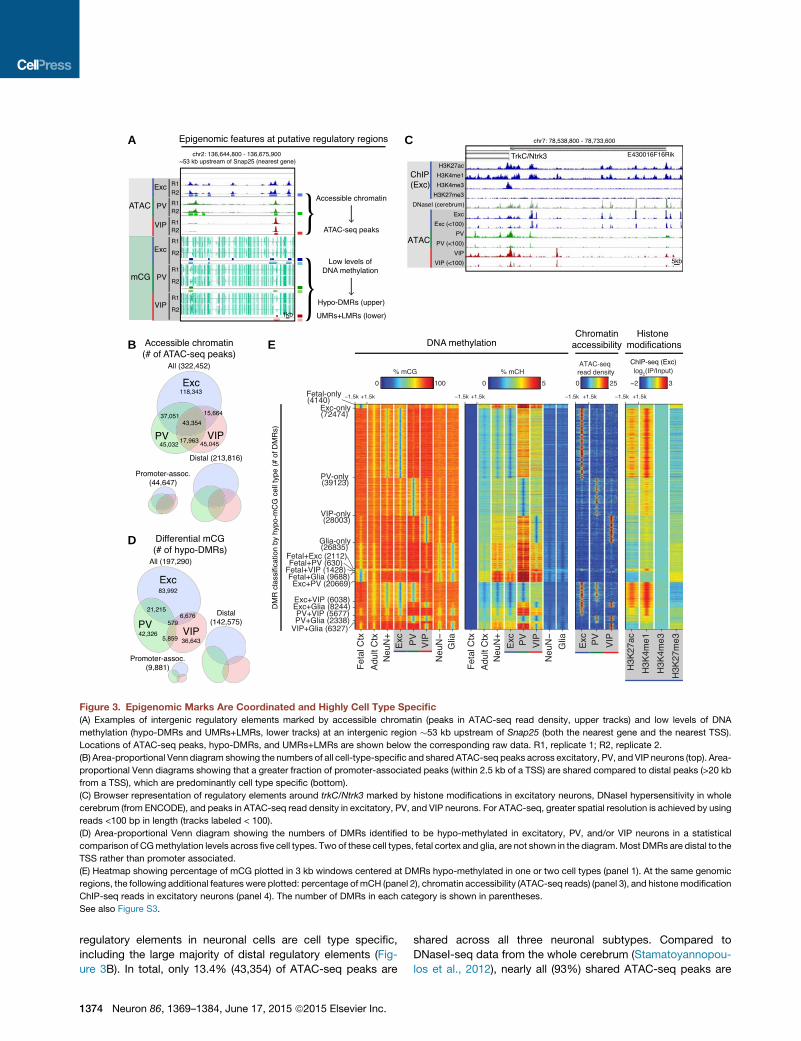
Figure 3. Epigenomic Marks Are Coordinated and Highly Cell Type Specific
(A) Examples of intergenic regulatory elements marked by accessible chromatin (peaks in ATAC-seq read density, upper tracks) and low levels of DNA
methylation (hypo-DMRs and UMRs+LMRs, lower tracks) at an intergenic region �53 kb upstream of Snap25 (both the nearest gene and the nearest TSS).
Locations of ATAC-seq peaks, hypo-DMRs, and UMRs+LMRs are shown below the corresponding raw data. R1, replicate 1; R2, replicate 2.
(B) Area-proportional Venn diagram showing the numbers of all cell-type-specific and shared ATAC-seq peaks across excitatory, PV, and VIP neurons (top). Area-
proportional Venn diagrams showing that a greater fraction of promoter-associated peaks (within 2.5 kb of a TSS) are shared compared to distal peaks (>20 kb
from a TSS), which are predominantly cell type specific (bottom).
(C) Browser representation of regulatory elements around trkC/Ntrk3 marked by histone modifications in excitatory neurons, DNaseI hypersensitivity in whole
cerebrum (from ENCODE), and peaks in ATAC-seq read density in excitatory, PV, and VIP neurons. For ATAC-seq, greater spatial resolution is achieved by using
reads <100 bp in length (tracks labeled < 100).
(D) Area-proportional Venn diagram showing the numbers of DMRs identified to be hypo-methylated in excitatory, PV, and/or VIP neurons in a statistical
comparison of CGmethylation levels across five cell types. Two of these cell types, fetal cortex and glia, are not shown in the diagram.Most DMRs are distal to the
TSS rather than promoter associated.
(E) Heatmap showing percentage of mCG plotted in 3 kb windows centered at DMRs hypo-methylated in one or two cell types (panel 1). At the same genomic
regions, the following additional features were plotted: percentage of mCH (panel 2), chromatin accessibility (ATAC-seq reads) (panel 3), and histonemodification
ChIP-seq reads in excitatory neurons (panel 4). The number of DMRs in each category is shown in parentheses.
See also Figure S3.
regulatory elements in neuronal cells are cell type specific,
including the large majority of distal regulatory elements (Fig-
ure 3B). In total, only 13.4% (43,354) of ATAC-seq peaks are
1374 Neuron 86, 1369–1384, June 17, 2015 ª2015 Elsevier Inc.
shared across all three neuronal subtypes. Compared to
DNaseI-seq data from the whole cerebrum (Stamatoyannopou-
los et al., 2012), nearly all (93%) shared ATAC-seq peaks are
also detected as cerebrum DNaseI-seq peaks (Figure 3C). In
striking contrast, 62% of VIP-specific, 52% of PV-specific, and
31% of excitatory-specific ATAC-seq peaks are missed in the
DNaseI-seq data, highlighting the advantage of INTACT profiling
over whole-tissue analysis for identifying regulatory regions,
particularly those unique to sparse cell types.
We next determined regions that differ in their levels of CG
methylation across five cell populations: INTACT-purified excit-
atory, PV, and VIP neurons, plus fetal embryonic day 13 (E13)
frontal cortex and adult S100b+ glia from Lister et al. (2013).
We expected that including purified neurons would facilitate
identification of differentially methylated regions (DMRs). Using
a conservative statistical approach (Lister et al., 2013), we iden-
tified 251,301 DMRs with a median length of 275 bp (Table S3).
Masking sequence variants across mouse strains did not sub-
stantially alter the DMR calling (see Supplemental Experimental
Procedures). 112,462 of these DMRs are hypo-methylated
(hypo-DMRs) in excitatory neurons. In keeping with our expecta-
tion, substitution of a mixed neuronal sample (NeuN+) with com-
parable sequencing coverage for the excitatory neuron sample
results in 77,417 (68.8%) hypo-DMRs in NeuN+ neurons, despite
the prevalence of excitatory neurons in this sample. The
increased detection of DMRs using INTACT-purified excitatory
neurons again demonstrates the power of cell-type-specific
profiling for comprehensive identification of regulatory regions.
To identify hypo-methylated regions that may not be differen-
tially methylated across cell types, we segmented each methyl-
ome into unmethylated regions (UMRs) and low-methylated
regions (LMRs) (Burger et al., 2013) (Table S3).
As expected from previous studies (Stadler et al., 2011), the
majority of UMRs are located at promoters (66.3%–74.2%within
2.5 kb of a TSS), whereas most LMRs are potential distal regula-
tory elements (4.9%–6.2%within 2.5 kb of a TSS). For DMRs, the
vast majority (93.8%) are also located more than 2.5 kb away
from a TSS. Across DMRs that show hypo-methylation in at least
one INTACT sample (Figure 3D), between 36,643 and 83,992 are
hypo-methylated in a single neuron subtype. Recapitulating the
division of ATAC-seq peaks (Figure 3B), excitatory neurons have
the highest number of hypo-DMRs (Figure 3D), and remarkably,
most are not shared with PV or VIP neurons. Taken together,
these data extend previous profiling experiments in the brain,
first by identifying hundreds of thousands of putative regulatory
regions across three neuron subtypes, and then by classifying
them into highly distinct sets in individual subtypes.
Cell-Type Specificity at Activity-Induced TranscriptionFactor Binding SitesBecause regions bound by activity-dependent TFs, as a whole,
show constitutive DNA hypo-methylation (Guo et al., 2011) and
chromatin accessibility (Malik et al., 2014), DMRs and differential
ATAC-seq peaks could point to regulatory regionswith cell-type-
specific responses to induced neuronal activity. Therefore, we
addressed the relationship between DMRs, differential ATAC-
seq peaks, and activity-dependent TF binding in excitatory neu-
rons, reasoning that our overall findings would also be applicable
to the two inhibitory subpopulations that are not easily obtainable
in quantities required for TF ChIP-seq. We examined activity-
dependent TF binding profiles using previously published ChIP-
seq data from cortical cultures largely composed of immature
excitatory neurons (Kim et al., 2010; Malik et al., 2014). The ma-
jority of activity-dependent binding sites for all TFs (58.2%–
83.9%) overlapwith excitatory neuronUMRs+LMRs (Figure S3B,
left). However, only 1.4% of CREB and 10.8% of SRF binding
sites overlap with excitatory neuron-specific hypo-DMRs,
compared to 33.4%–40.3% of AP-1 (FOS, FOSB, JUNB) and
NPAS4 binding sites (p < 2 3 10�38, Fisher’s exact test [FET]).
In particular, activity-dependent binding sites for AP-1 factors
and NPAS4 in cortical cultures are enriched in excitatory hypo-
DMRs and depleted in PV-, VIP-, and glia-specific hypo-DMRs
(Figures S3B and S3C). These results are largely recapitulated
by the ATAC-seq data. Our analysis suggests that excitatory
neuron-specific hypo-DMRs and ATAC-seq peaks overlapping
AP-1 and NPAS4 binding sites are a set of candidate regions
that coordinate activity-dependent responses unique to excit-
atory neurons. Likewise, hypo-DMRs and differential ATAC-seq
peaks in PV and VIP neurons provide a resource for identifying
AP-1 andNPAS4 targets that orchestrate distinct activity-depen-
dent responses in inhibitory neurons (Spiegel et al., 2014).
Neuronal Subtypes Show Coordinated EpigenomicDifferencesEpigenomic marks carry information about cell function, via their
correlation with gene expression and gene regulatory regions, as
well as cell development (Bird, 2002; Hon et al., 2013; Stadler
et al., 2011; Thurman et al., 2012). Therefore, we first assessed
whether the epigenomic marks were well correlated with each
other and then quantified their relationships across cell types
and developmental stages.
Cell-type-specific hypo-methylation in the CG context is coor-
dinated with hypo-methylation in the CH context (Figures 3E, left
two panels, and S3D) and increased chromatin accessibility
(Figure 3E, third panel). Excitatory neuron hypo-DMRs are
also enriched for histone modifications associated with active
enhancers (H3K4me1 and H3K27ac) but not promoters
(H3K4me3) (Figure 3E, right panel). Similarly, ATAC-seq levels
in excitatory neurons are correlated with both H3K4me1 and
H3K27ac at enhancers (Figure S3E) but demarcate TF binding
sites with greater spatial resolution (Figure 3E, third panel versus
right panel). Overlapping features derived from multiple assays
(Figure S3F) provide convergent evidence for identifying candi-
date regulatory regions, and both raw and processed data can
be explored via a web-based browser (http://neomorph.salk.
edu/mm_intact/).
We quantified the epigenomic relationships across cell types
in several ways: by the similarity of DNA methylation patterns
in 500 bp bins genome-wide (Figure S4A) and at ATAC-seq
peaks (Figures 4A and S4B), and by the similarity of Tn5 insertion
densities (Figure 4B) at ATAC-seq peaks. As expected, excit-
atory and NeuN+ neurons are strongly correlated using DNA
methylation signal at both genomic bins and ATAC-seq peaks
(Pearson r �0.9), and hierarchical clustering groups excitatory
neurons with NeuN+ neurons. PV and VIP neurons cluster
together, in line with their functional roles as inhibitory neurons.
In contrast, excitatory and VIP neurons show the lowest similarity
across INTACT-purified cell types. Unexpectedly, CG methyl-
ation levels in fetal brain and in glia correlate more strongly
Neuron 86, 1369–1384, June 17, 2015 ª2015 Elsevier Inc. 1375
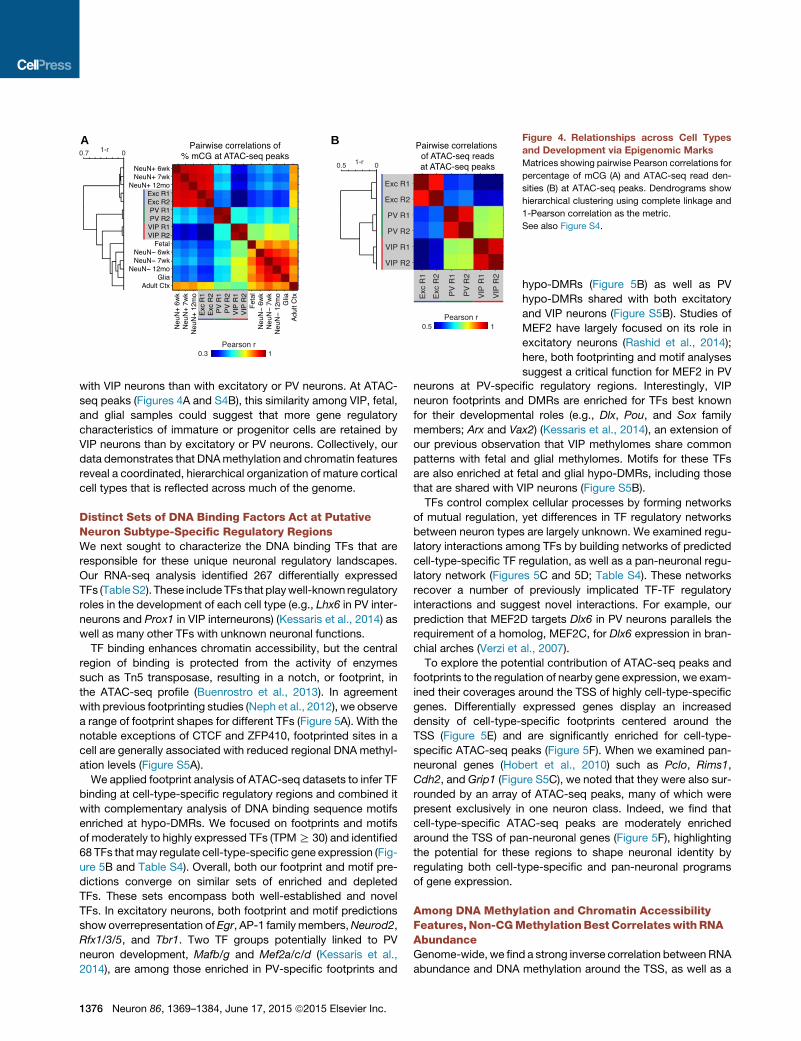
A B Figure 4. Relationships across Cell Types
and Development via Epigenomic Marks
Matrices showing pairwise Pearson correlations for
percentage of mCG (A) and ATAC-seq read den-
sities (B) at ATAC-seq peaks. Dendrograms show
hierarchical clustering using complete linkage and
1-Pearson correlation as the metric.
See also Figure S4.
with VIP neurons than with excitatory or PV neurons. At ATAC-
seq peaks (Figures 4A and S4B), this similarity among VIP, fetal,
and glial samples could suggest that more gene regulatory
characteristics of immature or progenitor cells are retained by
VIP neurons than by excitatory or PV neurons. Collectively, our
data demonstrates that DNAmethylation and chromatin features
reveal a coordinated, hierarchical organization of mature cortical
cell types that is reflected across much of the genome.
Distinct Sets of DNA Binding Factors Act at PutativeNeuron Subtype-Specific Regulatory RegionsWe next sought to characterize the DNA binding TFs that are
responsible for these unique neuronal regulatory landscapes.
Our RNA-seq analysis identified 267 differentially expressed
TFs (TableS2). These includeTFs that playwell-known regulatory
roles in the development of each cell type (e.g., Lhx6 in PV inter-
neurons and Prox1 in VIP interneurons) (Kessaris et al., 2014) as
well as many other TFs with unknown neuronal functions.
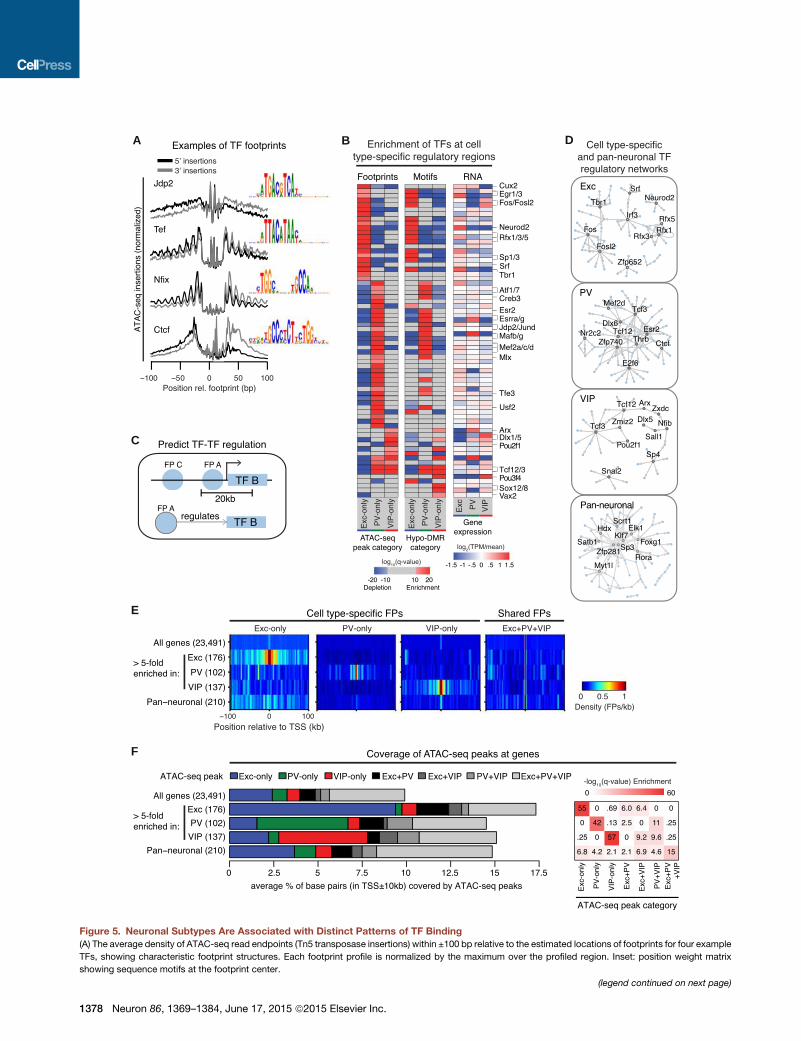
TF binding enhances chromatin accessibility, but the central
region of binding is protected from the activity of enzymes
such as Tn5 transposase, resulting in a notch, or footprint, in
the ATAC-seq profile (Buenrostro et al., 2013). In agreement
with previous footprinting studies (Neph et al., 2012), we observe
a range of footprint shapes for different TFs (Figure 5A). With the
notable exceptions of CTCF and ZFP410, footprinted sites in a
cell are generally associated with reduced regional DNA methyl-
ation levels (Figure S5A).
We applied footprint analysis of ATAC-seq datasets to infer TF
binding at cell-type-specific regulatory regions and combined it
with complementary analysis of DNA binding sequence motifs
enriched at hypo-DMRs. We focused on footprints and motifs
of moderately to highly expressed TFs (TPMR 30) and identified
68 TFs thatmay regulate cell-type-specific gene expression (Fig-
ure 5B and Table S4). Overall, both our footprint and motif pre-
dictions converge on similar sets of enriched and depleted
TFs. These sets encompass both well-established and novel
TFs. In excitatory neurons, both footprint and motif predictions
show overrepresentation ofEgr, AP-1 familymembers,Neurod2,
Rfx1/3/5, and Tbr1. Two TF groups potentially linked to PV
neuron development, Mafb/g and Mef2a/c/d (Kessaris et al.,
2014), are among those enriched in PV-specific footprints and
1376 Neuron 86, 1369–1384, June 17, 2015 ª2015 Elsevier Inc.
hypo-DMRs (Figure 5B) as well as PV
hypo-DMRs shared with both excitatory
and VIP neurons (Figure S5B). Studies of
MEF2 have largely focused on its role in
excitatory neurons (Rashid et al., 2014);
here, both footprinting and motif analyses
suggest a critical function for MEF2 in PV
neurons at PV-specific regulatory regions. Interestingly, VIP
neuron footprints and DMRs are enriched for TFs best known
for their developmental roles (e.g., Dlx, Pou, and Sox family
members; Arx and Vax2) (Kessaris et al., 2014), an extension of
our previous observation that VIP methylomes share common
patterns with fetal and glial methylomes. Motifs for these TFs
are also enriched at fetal and glial hypo-DMRs, including those
that are shared with VIP neurons (Figure S5B).
TFs control complex cellular processes by forming networks
of mutual regulation, yet differences in TF regulatory networks
between neuron types are largely unknown. We examined regu-
latory interactions among TFs by building networks of predicted
cell-type-specific TF regulation, as well as a pan-neuronal regu-
latory network (Figures 5C and 5D; Table S4). These networks
recover a number of previously implicated TF-TF regulatory
interactions and suggest novel interactions. For example, our
prediction that MEF2D targets Dlx6 in PV neurons parallels the
requirement of a homolog, MEF2C, for Dlx6 expression in bran-
chial arches (Verzi et al., 2007).
To explore the potential contribution of ATAC-seq peaks and
footprints to the regulation of nearby gene expression, we exam-
ined their coverages around the TSS of highly cell-type-specific
genes. Differentially expressed genes display an increased
density of cell-type-specific footprints centered around the
TSS (Figure 5E) and are significantly enriched for cell-type-
specific ATAC-seq peaks (Figure 5F). When we examined pan-
neuronal genes (Hobert et al., 2010) such as Pclo, Rims1,
Cdh2, and Grip1 (Figure S5C), we noted that they were also sur-
rounded by an array of ATAC-seq peaks, many of which were
present exclusively in one neuron class. Indeed, we find that
cell-type-specific ATAC-seq peaks are moderately enriched
around the TSS of pan-neuronal genes (Figure 5F), highlighting
the potential for these regions to shape neuronal identity by
regulating both cell-type-specific and pan-neuronal programs
of gene expression.
Among DNA Methylation and Chromatin AccessibilityFeatures, Non-CGMethylationBest CorrelateswithRNAAbundanceGenome-wide, we find a strong inverse correlation between RNA
abundance and DNA methylation around the TSS, as well as a
positive correlation between RNA abundance and ATAC-seq
signals (Figure 6A). For both mCG andmCH, the inverse correla-
tion extends throughout the gene body, with a peak �1–2 kb
downstream of the TSS. At differentially expressed genes,
mCH is significantly more correlated with expression (Spearman
r =�0.50) than mCG (r =�0.34; p = 0.0063, t test using the three
cell types as samples) or ATAC-seq insertion density (r = 0.25;
p = 5.4 3 10�4). A generalized linear model with a sparseness-
promoting regularization (LASSO) using mCG, mCH, and
ATAC-seq features (Table S5) further identifies gene body
mCH as the most informative feature for inferring RNA abun-
dance (Figures S6A and S6B).
Our finding that the strongest correlation between RNA levels
and mCG occurs �1–2 kb downstream of the TSS agrees with
recent findings in medulloblastoma cell lines (Hovestadt et al.,
2014) and in human cardiomyocytes (Gilsbach et al., 2014).
Our results extend this observation to mCH and show that
mCH, an epigenetic modification abundant across diverse clas-
ses of neocortical neurons, is better correlated with gene abun-
dances measured by RNA-seq. Future studies using more direct
measures of gene transcription are warranted to complement
these findings.
Gene Clusters Based on Intragenic Non-CGMethylationShare Gene Expression, Chromatin, and FunctionalOrganizationAs described above, non-CGmethylation within the gene body is
inversely correlated with gene expression. Yet, this epigenomic
feature may display greater divergence across neuron types
than their transcriptional configurations (Figures 2B and 2F),
suggesting that it contains additional information related to
cell-type-specific differences. To explore this idea, we used an
unbiased clustering approach to group genes by their patterns
of intragenic mCH, followed by an integrative analysis of gene
expression, chromatin accessibility, and gene ontology. 23,023
genes were grouped into 25 clusters by their levels of intragenic
mCH, normalized by the level in the flanking region (Figures 6B–
6E and S6C). Approximately half of these genes share similar
patterns of mCH across neurons, including hyper-methylated
genes with low expression levels (clusters 2, 6; 13.5% of genes)
and hypo-methylated genes with moderate to high expression
(clusters 3–5, 7, and 8; 40%). The latter category is not enriched
for differentially expressed genes (Figure 6D) but is enriched
for cell-type-specific ATAC-seq peaks (Figure 6E). By gene
ontology (GO) analysis (Huang et al., 2009) (Table S5), genes in
these clusters tend to be enriched for general cellular processes,
for example, transcription (GO: 0006350) and RNA binding (GO:
0003723).
The remaining half of genes captures the spectrum of intra-
genic CH methylation across neuronal populations by clustering
into groups showing neuron subtype-specific hyper- and hypo-
mCH. Clusters 10–18 (23.6% of genes) are hyper-methylated
at CH sites in one or more cell types and are expressed at rela-
tively low levels. Clusters 19–25 (17.8% of genes) are hypo-
methylated in specific cell types and are generally expressed
at higher levels, with hypo-methylation occurring together with
increased expression (e.g., Cluster 22 enriched for PV > Exc
and VIP genes). These clusters are enriched for both differentially
expressed genes and accessible chromatin. Although genes that
are exclusively expressed in only one or two cell types are group-
ed in clusters 19–25, a subset of pan-neuronal genes that differ in
their expression levels across neuronal subtypes are also group-
ed here (e.g.,Cdh2,Grip1,Bsn). These clusters also contain pan-
neuronal genes that do not meet our threshold for differential
expression (e.g., Anks1b), an example of the ability of intragenic
mCH to parse the neuronal transcriptome into finer patterns.
Several clusters with cell-type-specific hypo-methylation are
enriched for neuronal GO categories, for example, postsynaptic
density (GO: 0014069: 6.7-fold enrichment, q = 0.035, cluster 19)
and synapse (GO: 0045202: 2.6-fold, q = 0.033, cluster 20;
2.9-fold, q = 2.83 10�4, cluster 21). Neuron subtype-specific dif-
ferences in intragenic mCH may be especially relevant in light of
recent evidence that MeCP2 binding to mCA represses tran-
scription of long neuronal genes (Gabel et al., 2015). The enrich-
ment of neuronal GO categories at these clusters suggests that
cell-type-specific expression levels of genes with neuronal func-
tions may partly be a consequence of differences in levels of
intragenic mCH.
Non-CG Methylation Is Lowest at the NucleosomeCenter and Increases at Linker RegionsIn addition to its variations with gene expression, we asked
whether mCH levels also differed relative to chromatin features
such as nucleosome positioning. We estimated nucleosome
locations using ATAC-seq and found that coherently phased
modulation of mCH is evident over approximately 1 kb (�5 nu-
cleosomes), decreasing by up to 9.5% at the nucleosome center
and increasing by 11.1% in neighboring linkers (Figure 6F). mCG
levels display a similar but weaker modulation (<2%) (Fig-
ure S6D). Our results support earlier studies in the CG context
(Teif et al., 2014) and extend the link between nucleosome posi-
tioning and DNA methylation in mammalian cells to the non-CG
context.
Identification of Distinct Classes of LargeHypo-methylated RegionsWe further sought to identify multi-kilobase regions of low DNA
methylation in our datasets. Hypo-DMRs are not randomly
distributed in the genome but instead show a bimodal distribu-
tion of inter-DMR distances (Figure 7A). Closely spaced hypo-
DMRs may represent fragments of larger hypo-methylated
features. Therefore, we merged neuron subtype-specific hypo-
DMRs located within 1 kb of each other and defined those
exceeding 2 kb in length as ‘‘large hypo-DMRs’’ (Figure 7B,
left). We also observed another category of large hypo-methyl-
ated domains that are consistent with previously described
DNA methylation valleys (DMVs) or canyons (Jeong et al.,
2014; Xie et al., 2013) (Figure 7B; see Supplemental Experi-
mental Procedures).
Although both are multi-kilobase hypo-methylated regions,
large hypo-DMRs and DMVs occupy distinct genomic locations
(Figure S7A). Compared to large hypo-DMRs, DMVs have higher
overlap across cell types (Figure S7A) and more extreme lengths
(Figure S7B), extending up to 104 kb compared to large hypo-
DMRs, which extend to 32 kb. Consistent with their higher GC
content (Figure S7C) and lower levels of CG methylation
Neuron 86, 1369–1384, June 17, 2015 ª2015 Elsevier Inc. 1377
A B D
C
E
F
Figure 5. Neuronal Subtypes Are Associated with Distinct Patterns of TF Binding
(A) The average density of ATAC-seq read endpoints (Tn5 transposase insertions) within ±100 bp relative to the estimated locations of footprints for four example
TFs, showing characteristic footprint structures. Each footprint profile is normalized by the maximum over the profiled region. Inset: position weight matrix
showing sequence motifs at the footprint center.
(legend continued on next page)
1378 Neuron 86, 1369–1384, June 17, 2015 ª2015 Elsevier Inc.
(Figure S7D), most DMVs (85%–94%) overlap CpG islands. In
contrast, only 1%–9%of large hypo-DMRs overlap CpG islands.
Furthermore, DMVs straddle the TSS, whereas large hypo-
DMRs are enriched downstream of the TSS (Figure S7E).
To better characterize different classes of hypo-methylated
regions, we took advantage of our histone modification data in
excitatory neurons. Large hypo-DMRs show higher levels of his-
tone modifications associated with active enhancers, H3K27Ac
and H3K4me1, compared to DMRs <2 kb (Figure 7C, left).
Excitatory DMVs display a bimodal distribution for H3K4me3
andH3K27me3andcanbedivided asH3K4me3+ (Figure 7B, left)
versus H3K27me3+ (Figure 7B, right). As expected, H3K27me3+
DMVs are depleted for ATAC-seq reads and overlap genes with
low expression (Figure 7C, middle and right). Large hypo-DMRs
and H3K4me3+, but not H3K27me3+, DMVs are enriched for
differentially expressed genes (Figure 7D). In fact, the bimodal
distribution of H3K4me3 and H3K27me3 levels in DMVs
suggests that these domains can be associated with either
active or repressed genes, and the two histone modifications
partition DMVs into functionally distinct categories (Figures
S7F and S7G).
Hyper-methylation at Cell-Type-Specific TranscriptionFactor Genes Preserves a Trace of Early DevelopmentalExpressionDMVs are highly overlapping across adult cell types and fetal
cortex (Figure S7A), in line with previous evidence (Xie et al.,
2013) suggesting they may be established early during develop-
ment and subsequently maintained. To address whether these
regions are dynamically modified during development, we
compared the boundaries of fetal DMVs between fetal and adult
cells. Genome-wide, 51%–67% of fetal DMVs remain as DMVs
in adult neurons and glia but gain methylcytosines, resulting in
a contraction of DMV length as the brain matures (median
decrease = 747 bp; p < 2 3 10�18, Wilcoxon rank sum).
We further focused our analysis on fetal DMVs overlapping
genes. Fetal DMVs are highly enriched for TF genes (Figure S7G),
and 75 out of 77 fetal DMVs associated with a list of candidate
developmental TFs (Visel et al., 2013) are shorter in at least
one adult cell type (Figure S7H). To identify the DMVs that display
the most significant developmental mCG gains, we compared
mCG levels across fetal and adult cells in the interior of fetal
DMVs; to avoid the possible confound of intragenic DNAmethyl-
ation, we used the DMV interior upstream of the TSS (Figure 7E).
This analysis identified 454 genes (66%; FET, q < 0.01) that
exhibit significantly increased mCG in at least one adult cell
type versus fetal cortex; 210 genes (31%) have more than a
5-fold increase (Table S6).
(B) Heatmaps showing the enrichment (red) and depletion (blue) of footprints in c
relative TF expression level across excitatory, PV, and VIP neurons is also show
(C) Schematic for assessing TF-TF interactions by detecting footprints of one TF (F
farther away (FP C) are not predicted to interact.
(D) Networks of TF interactions predicted by themethod shown in (C) using cell-typ
(E) Heatmaps showing the average density of cell-type-specific and pan-neuron
(F) Barplot showing the average percentage of base pairs within a TSS ± 10 kb wi
(left). Heatmap showing an enrichment of cell-type-specific peaks at both cell-typ
et al. (2010); q from one-sided Wilcoxon rank-sum test with Benjamini-Hochberg
See also Figure S5.
When we examined these 210 genes, we noted that several
code for critical TFs known to shape neuronal subtype identity
and are predominantly expressed in neural progenitor cells and
immature precursors; furthermore, the highest mCG fold change
generally occurs in the cell typewhere the gene is active in devel-
opment but downregulated in the adult (Table S6). For example,
Neurog2 is highly expressed during embryonic development in
the common progenitors of cortical excitatory neurons and
many glial cells, but it is not expressed in these cells in the adult
brain nor at any time during inhibitory neuron development
(Sommer et al., 1996; Wang et al., 2013). Our DNA methylation
data shows that Neurog2 lies within a DMV in all cells except
excitatory neurons and glia, where the region is hyper-methyl-
ated (Figure 7F, left). In contrast,Nkx2-1 is specifically expressed
in the medial ganglionic eminence (MGE), the birthplace of
cortical PV neurons (DeFelipe et al., 2013). Immature cortical
PV neurons switch offNkx2-1 soon after leaving theMGE in order
to direct their migration to the cortex; neurons that maintain
Nkx2-1 expression instead travel to the striatum (Nobrega-Per-
eira et al., 2008). An extended (>15 kb) DMV covers Nkx2-1 in
fetal cortex, excitatory neurons, VIP neurons, and glia, yet this
DMV is only�6.5 kb in PV neurons (Figure 7F, right). Similar find-
ings are seen at DMVs overlapping Dlx2, Pax6, Vax1, and Gsx2
(Figures S7I and S7J).
At these TF loci, the methylomes of adult neurons contain
a signature of past gene expression. In contrast to the rest of
the genome, hyper-methylation, rather than hypo-methylation,
marks the relevant cell-type-specific genes. In contrast to vesti-
gial enhancers (Hon et al., 2013), this epigenetic trace of the
neuron’s development arises from the gain of cell-type-specific
hyper-methylation rather than the retention of hypo-methylation.
We further asked what fraction of this hyper-methylation is a
result of hmC rather than mC. For DMVs at Neurog2 and Pax6,
we find that adult frontal cortex hmCG levels from TAB-seq
(Lister et al., 2013) are approximately 10% of excitatory neuron
MethylC-seq signals at CG sites. Because we lack matched
hmC data from purified excitatory neurons, the precise contribu-
tion of hmCG is difficult to assess, although we believe from this
comparison that the majority of the hyper-methylation originates
frommCG. Furthermore, at non-CG sites in these two DMVs, we
find that essentially all of the observed hyper-methylation origi-
nates frommCH, consistent with evidence that hydroxymethyla-
tion occurs nearly exclusively in the CG context (Yu et al., 2012).
DISCUSSION
This study introduces the INTACT system in mice, the first
method to affinity purify nuclei from genetically defined cell types
ell-type-specific ATAC-seq peaks (left) or motifs in hypo-DMRs (middle). The
n (right). Selected TFs are labeled; the full matrix can be found in Table S4.
P A) in a 20 kbwindow around the TSS of a second TF (TF B); footprints located
e-specific and pan-neuronal footprints. Full networks can be found in Table S4.
al footprints within a TSS ± 100 kb window for each category of genes.
ndow that overlaps each ATAC-seq peak category, for each category of genes
e-specific and pan-neuronal genes (right). Pan-neuronal genes are from Hobert
FDR correction.
Neuron 86, 1369–1384, June 17, 2015 ª2015 Elsevier Inc. 1379
A F
B C D E
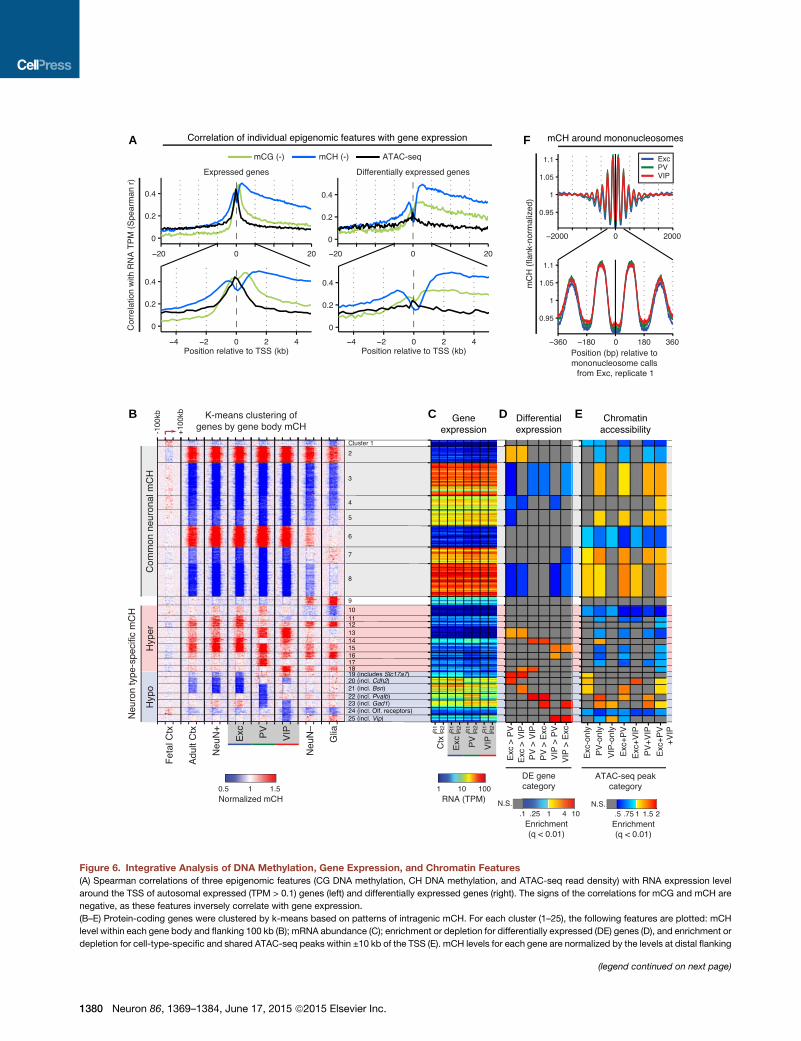
Figure 6. Integrative Analysis of DNA Methylation, Gene Expression, and Chromatin Features
(A) Spearman correlations of three epigenomic features (CG DNA methylation, CH DNA methylation, and ATAC-seq read density) with RNA expression level
around the TSS of autosomal expressed (TPM > 0.1) genes (left) and differentially expressed genes (right). The signs of the correlations for mCG and mCH are
negative, as these features inversely correlate with gene expression.
(B–E) Protein-coding genes were clustered by k-means based on patterns of intragenic mCH. For each cluster (1–25), the following features are plotted: mCH
level within each gene body and flanking 100 kb (B); mRNA abundance (C); enrichment or depletion for differentially expressed (DE) genes (D), and enrichment or
depletion for cell-type-specific and shared ATAC-seq peaks within ±10 kb of the TSS (E). mCH levels for each gene are normalized by the levels at distal flanking
(legend continued on next page)
1380 Neuron 86, 1369–1384, June 17, 2015 ª2015 Elsevier Inc.
in a mammal. INTACT efficiently isolates nuclei from both com-
mon and rare cell types, enabling us to examine the epigenomic
organization of neocortical excitatory, PV, and VIP neurons with
unprecedented cell-type-specific resolution. We find that the
morphological and physiological diversity of neocortical neurons
is paralleled by widespread differences in their underlying epige-
nomes. By using coordinated epigenomic marks to show that
neocortical neurons adopt unique regulatory landscapes, our
data add a new resource to existing catalogs of transcriptional
diversity. We further identify candidate TFs acting at regulatory
regions and demonstrate how epigenomic states of adult cells
capture long-lasting attributes of neuronal identity, including pat-
terns of past gene expression, current gene expression, and po-
tential experience-dependent responses. In particular, we find a
close relationship between intragenic non-CG methylation and
differential gene expression. Furthermore, purified neuronal epi-
genomes reveal distinctive hyper-methylation patterns associ-
ated with developmentally transient expression of critical TFs
that shape neuronal subtype identity.
Affinity Purification of Nuclei Facilitates EpigenomicStudiesINTACT is uniquely suited to investigating cell-type-specific epi-
genomes, an application that can be challenging with other pu-
rification methods. Genome-wide epigenomic assays generally
require tens of thousands tomillions of cells, which limit the utility
of manual sorting for this purpose. Methods that involve cellular
dissociation in the adult brain may be inefficient and induce
stress responses that alter the cellular state. In contrast, INTACT
couples rapid tissue lysis with gentle isolation of sufficient
numbers of cell-type-specific nuclei for epigenomic studies.
Whereas FACS-sorted cells or nuclei may be fragile and difficult
to manipulate, the attachment of magnetic beads to nuclei in
INTACT greatly simplifies buffer exchanges and volume reduc-
tions. Furthermore, unlike FACS or laser capture microdissec-
tion, INTACT requires no specialized instruments. INTACT is
particularly well-suited for isolating rare cell types; cells consti-
tuting 1%–3% of the starting material can be enriched to
>98% purity and subsequently used for MethylC-seq and
ATAC-seq.
In this study, we have focused on cellular diversity in the
healthy mammalian brain. INTACT can also be used to explore
cell-type-specific epigenomics inmousemodels of neurodegen-
eration, schizophrenia, autism, and other neuropsychiatric disor-
ders or adapted for use in non-neuronal tissues. In addition to
epigenomic studies, INTACT is an efficient method for isolating
nuclear RNA from defined cell types that complements existing
strategies for RNA profiling. We note that some degree of non-
specific RNA contamination is intrinsic to affinity purification
strategies, including INTACT. Nevertheless, we have shown
that INTACT expression profiles recover known cell markers
and can be used to discover novel markers.
regions (50–100 kb upstream and downstream of the gene body). For clusters w
TPM, transcripts per million; N.S., not significant (FET, q < 0.01).
(F) mCH levels are higher in the nucleosomal linker region and lower in the nucleo
upstream and downstream of the nucleosome center).
See also Figure S6.
Cell-Type-Specific Developmental Signatures AreEncoded in the Methylomes of Adult CellsMature neuronal diversity arises from a developmental odyssey.
Whereas one class of large hypo-methylated regions (large
hypo-DMRs) reflects the neuron’s current transcriptional state,
a second class (DNA methylation valleys [DMVs]) reveals pat-
terns of past gene expression. We find that a subset of genes
coding for TFs that establish neuronal identity, including
Neurog2, Nkx2-1, Dlx2, Pax6, Vax1, and Gsx2, overlap with
DMVs showing cell-type-specific hyper-methylation. At these
genes, hyper-methylation at DMVs in the adult methylome pro-
vides a record of transient high TF expression during develop-
ment, whereas the same genes are hypo-methylated in other
cell types. We speculate that this pattern might arise if (1) these
DMVs are initially marked by H3K27me3 in neural progenitors
(Xie et al., 2013), (2) H3K27me3 is removed in a particular
neuronal lineage to allow TF expression at the appropriate devel-
opmental time point, and (3) this removal simultaneously
increases the accessibility of the region to DNA methyltrans-
ferases, whereas other cell types maintain an inaccessible
chromatin state throughout development and into adulthood.
Measuring gene expression in defined populations of immature
cells can be challenging as they are intermixed and often do
not express the terminal markers of adult neuronal subtypes.
Our data suggest that developmental TF expression could be
predicted fromDNAmethylation patterns in adult cells, providing
an alternate approach to investigating cell-type-specific devel-
opmental history. Our results highlight this finding at several of
the most critical neuronal TFs; however, future studies using
matched developmental and adult datasets are necessary to
further explore the temporal relationships across DNA methyl-
ation, gene expression, and chromatin.
Genome-wide Analyses Parse Neuronal DiversityNeuronal cell types have been defined based on morphology,
electrophysiology, connectivity, and, more recently, patterns of
geneexpressionand regulation. Traditional approaches for inves-
tigating these features produce datasets of modest size and with
a relatively small number of independent parameters, which limit
the distinctions that can be made among neuronal cell types. As
demonstrated here, genome-wide approaches generate large
and information-rich datasets that reveal complex neuron sub-
type-specific patterns of transcript abundances, DNA methyl-
ation, and chromatin accessibility. Genome-wide information
derived from these datasets can be used to parse neuronal sub-
types into even finer divisions based on patterns of both gene
expression and gene regulation, which in turn can be combined
with transgenic approaches to label new subpopulations of neu-
rons and enable their purification. The synergy between genetic
engineering of experimental organisms, cell-type-specific purifi-
cation, and genome-scale data analysis promises a new and
comprehensiveviewofneuronaldiversity in themammalianbrain.
ith cell-type-specific hypo-methylation, an example gene or gene set is listed.
some core. mCH levels are normalized by the level at flanking regions (1–2 kb
Neuron 86, 1369–1384, June 17, 2015 ª2015 Elsevier Inc. 1381
A B
C D
E F
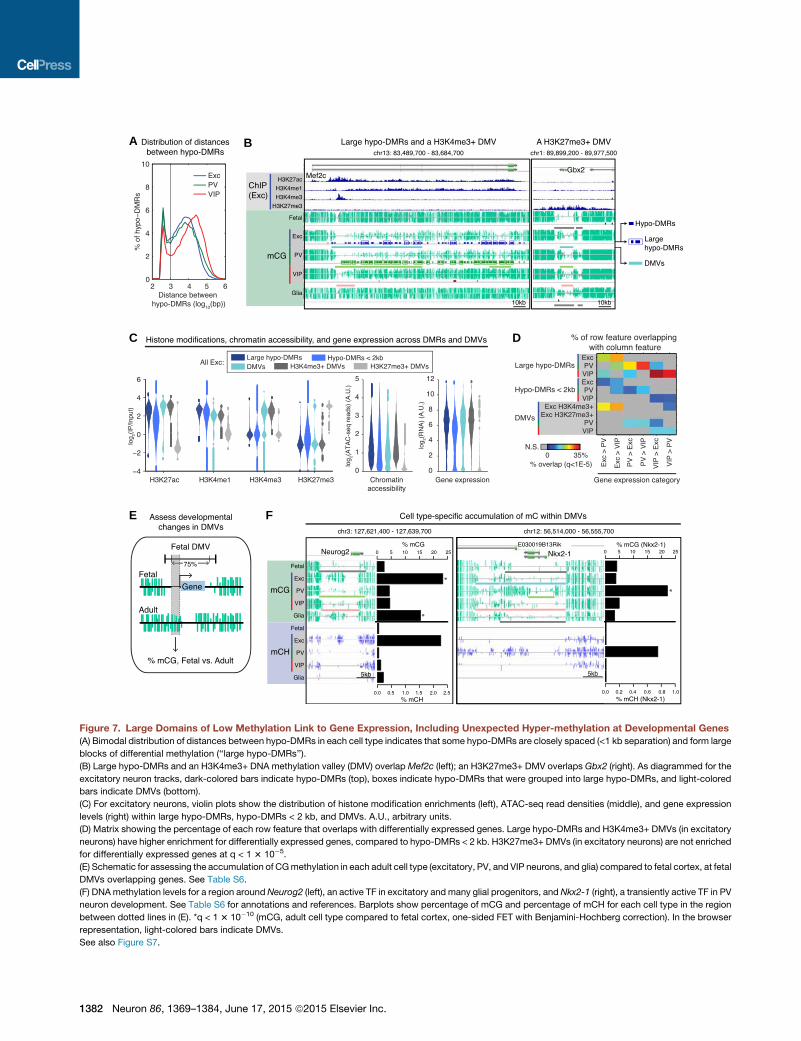
Figure 7. Large Domains of Low Methylation Link to Gene Expression, Including Unexpected Hyper-methylation at Developmental Genes
(A) Bimodal distribution of distances between hypo-DMRs in each cell type indicates that some hypo-DMRs are closely spaced (<1 kb separation) and form large
blocks of differential methylation (‘‘large hypo-DMRs’’).
(B) Large hypo-DMRs and an H3K4me3+ DNA methylation valley (DMV) overlapMef2c (left); an H3K27me3+ DMV overlaps Gbx2 (right). As diagrammed for the
excitatory neuron tracks, dark-colored bars indicate hypo-DMRs (top), boxes indicate hypo-DMRs that were grouped into large hypo-DMRs, and light-colored
bars indicate DMVs (bottom).
(C) For excitatory neurons, violin plots show the distribution of histone modification enrichments (left), ATAC-seq read densities (middle), and gene expression
levels (right) within large hypo-DMRs, hypo-DMRs < 2 kb, and DMVs. A.U., arbitrary units.
(D) Matrix showing the percentage of each row feature that overlaps with differentially expressed genes. Large hypo-DMRs and H3K4me3+ DMVs (in excitatory
neurons) have higher enrichment for differentially expressed genes, compared to hypo-DMRs < 2 kb. H3K27me3+ DMVs (in excitatory neurons) are not enriched
for differentially expressed genes at q < 1 3 10�5.
(E) Schematic for assessing the accumulation of CGmethylation in each adult cell type (excitatory, PV, and VIP neurons, and glia) compared to fetal cortex, at fetal
DMVs overlapping genes. See Table S6.
(F) DNAmethylation levels for a region aroundNeurog2 (left), an active TF in excitatory and many glial progenitors, and Nkx2-1 (right), a transiently active TF in PV
neuron development. See Table S6 for annotations and references. Barplots show percentage of mCG and percentage of mCH for each cell type in the region
between dotted lines in (E). *q < 1 3 10�10 (mCG, adult cell type compared to fetal cortex, one-sided FET with Benjamini-Hochberg correction). In the browser
representation, light-colored bars indicate DMVs.
See also Figure S7.
1382 Neuron 86, 1369–1384, June 17, 2015 ª2015 Elsevier Inc.
EXPERIMENTAL PROCEDURES
Further details can be found in the Supplemental Experimental Procedures.
Mouse INTACT
Animal procedures were conducted in accordancewith the Institutional Animal
Care andUse Committee guidelines of the Johns HopkinsMedical Institutions.
The R26-CAG-LSL-Sun1-sfGFP-Myc knockin mouse was made according to
standard procedures. GFP+/Myc+ nuclei from adult (8–11 weeks) mouse
neocortex were isolated by affinity purification using anti-GFP or anti-Myc
antibodies and protein G-coated magnetic beads.
RNA-Seq Library Generation
Nuclear RNA from INTACT-purified nuclei or whole neocortical nuclei was con-
verted to cDNA and amplified with the Nugen Ovation RNA-seq System V2
(Nugen 7102). Libraries were sequenced using the Illumina HiSeq 2500.
MethylC-Seq Library Generation
Genomic DNA from INTACT-purified nuclei was fragmented, andMethylC-seq
libraries were prepared. Libraries were sequenced using the Illumina HiSeq
2000.
ATAC-Seq Library Generation
50,000 bead-bound nuclei were transposed using Tn5 transposase (Illumina
FC-121-1030) as previously described (Buenrostro et al., 2013). After 9–12 cy-
cles of PCR amplification, libraries were sequenced on an Illumina HiSeq 2500.
ChIP-Seq Library Generation
INTACT-purified excitatory neuron nuclei were digested to mononucleosomes
using micrococcal nuclease, followed by salt extraction of chromatin. After
native ChIP and library construction, libraries were sequenced on an Illumina
HiSeq 2500.
ACCESSION NUMBERS
The accession number for the raw and processed data files reported in this pa-
per is GEO: GSE63137, and the data files are displayed via a web-based
browser (http://neomorph.salk.edu/mm_intact/).
SUPPLEMENTAL INFORMATION
Supplemental Information includes Supplemental Experimental Procedures,
seven figures, and six tables and can be found with this article online at
http://dx.doi.org/10.1016/j.neuron.2015.05.018.
AUTHOR CONTRIBUTIONS
J.N., J.R.E., S.R.E., and T.J.S. designed and supervised the research. A.M. de-
signed and generated the INTACT mouse, developed the affinity purification,
and did nuclei isolations and related experiments. G.L.H. designed the Sun1
tag and constructed RNA-seq libraries. G.L.H. and S.P. constructed ATAC-
seq libraries. A.M. and G.L.H. constructed ChIP-seq libraries. S.P. sequenced
the RNA-seq, ChIP-seq, and ATAC-seq libraries. M.A.U. constructed Meth-
ylC-seq libraries. J.R.N. sequenced and mapped the MethylC-seq libraries.
E.A.M., F.P.D., C.L., A.M., and R.L. analyzed data. A.M., E.A.M., and J.N. pre-
pared the manuscript. F.P.D., C.L., J.R.E., S.R.E., G.L.H., and R.L. revised the
manuscript.
ACKNOWLEDGMENTS
This work was supported by the Howard Hughes Medical Institute (J.R.E.,
S.R.E., J.N., and T.J.S.), 1-U01-MH105985 (J.R.E.), MSTP training grant
(A.M.), and NIH/NINDS R00NS080911 (E.A.M.). J.N. and T.J.S. are Howard
Hughes Medical Institute Investigators. J.R.E. is a Howard Hughes Medical
Institute and Gordon and Betty Moore Investigator. We thank Hao Zhang at
the Johns Hopkins School of Public Health for flow cytometry. We thank Yu-
peng He for comments and suggestions.
Received: January 15, 2015
Revised: April 14, 2015
Accepted: May 7, 2015
Published: June 17 2015
REFERENCES
Amin, N.M., Greco, T.M., Kuchenbrod, L.M., Rigney, M.M., Chung, M.I.,
Wallingford, J.B., Cristea, I.M., and Conlon, F.L. (2014). Proteomic profiling
of cardiac tissue by isolation of nuclei tagged in specific cell types (INTACT).
Development 141, 962–973.
Bird, A. (2002). DNAmethylation patterns and epigenetic memory. Genes Dev.
16, 6–21.
Buenrostro, J.D., Giresi, P.G., Zaba, L.C., Chang, H.Y., and Greenleaf, W.J.
(2013). Transposition of native chromatin for fast and sensitive epigenomic
profiling of open chromatin, DNA-binding proteins and nucleosome position.
Nat. Methods 10, 1213–1218.
Burger, L., Gaidatzis, D., Schubeler, D., and Stadler, M.B. (2013). Identification
of active regulatory regions fromDNAmethylation data. Nucleic Acids Res. 41,
e155.
Deal, R.B., and Henikoff, S. (2010). A simple method for gene expression and
chromatin profiling of individual cell types within a tissue. Dev. Cell 18, 1030–
1040.
DeFelipe, J., Lopez-Cruz, P.L., Benavides-Piccione, R., Bielza, C., Larranaga,
P., Anderson, S., Burkhalter, A., Cauli, B., Fairen, A., Feldmeyer, D., et al.
(2013). New insights into the classification and nomenclature of cortical
GABAergic interneurons. Nat. Rev. Neurosci. 14, 202–216.
Doyle, J.P., Dougherty, J.D., Heiman, M., Schmidt, E.F., Stevens, T.R., Ma, G.,
Bupp, S., Shrestha, P., Shah, R.D., Doughty,M.L., et al. (2008). Application of a
translational profiling approach for the comparative analysis of CNS cell types.
Cell 135, 749–762.
Emmert-Buck, M.R., Bonner, R.F., Smith, P.D., Chuaqui, R.F., Zhuang, Z.,
Goldstein, S.R., Weiss, R.A., and Liotta, L.A. (1996). Laser capture microdis-
section. Science 274, 998–1001.
Gabel, H.W., Kinde, B., Stroud, H., Gilbert, C.S., Harmin, D.A., Kastan, N.R.,
Hemberg, M., Ebert, D.H., and Greenberg, M.E. (2015). Disruption of DNA-
methylation-dependent long gene repression in Rett syndrome. Nature.
http://dx.doi.org/10.1038/nature14319.
Gay, L., Miller, M.R., Ventura, P.B., Devasthali, V., Vue, Z., Thompson, H.L.,
Temple, S., Zong, H., Cleary, M.D., Stankunas, K., and Doe, C.Q. (2013).
Mouse TU tagging: a chemical/genetic intersectional method for purifying
cell type-specific nascent RNA. Genes Dev. 27, 98–115.
Gelman, D.M., and Marın, O. (2010). Generation of interneuron diversity in the
mouse cerebral cortex. Eur. J. Neurosci. 31, 2136–2141.
Gilsbach, R., Preissl, S., Gruning, B.A., Schnick, T., Burger, L., Benes, V.,
Wurch, A., Bonisch, U., Gunther, S., Backofen, R., et al. (2014). Dynamic
DNA methylation orchestrates cardiomyocyte development, maturation and
disease. Nat. Commun. 5, 5288.
Guo, J.U., Ma, D.K., Mo, H., Ball, M.P., Jang, M.H., Bonaguidi, M.A., Balazer,
J.A., Eaves, H.L., Xie, B., Ford, E., et al. (2011). Neuronal activity modifies the
DNA methylation landscape in the adult brain. Nat. Neurosci. 14, 1345–1351.
Guo, J.U., Su, Y., Shin, J.H., Shin, J., Li, H., Xie, B., Zhong, C., Hu, S., Le, T.,
Fan, G., et al. (2014). Distribution, recognition and regulation of non-CpG
methylation in the adult mammalian brain. Nat. Neurosci. 17, 215–222.
Heiman, M., Schaefer, A., Gong, S., Peterson, J.D., Day, M., Ramsey, K.E.,
Suarez-Farinas, M., Schwarz, C., Stephan, D.A., Surmeier, D.J., et al. (2008).
A translational profiling approach for the molecular characterization of CNS
cell types. Cell 135, 738–748.
Heintzman, N.D., Stuart, R.K., Hon, G., Fu, Y., Ching, C.W., Hawkins, R.D.,
Barrera, L.O., Van Calcar, S., Qu, C., Ching, K.A., et al. (2007). Distinct and
Neuron 86, 1369–1384, June 17, 2015 ª2015 Elsevier Inc. 1383
predictive chromatin signatures of transcriptional promoters and enhancers in
the human genome. Nat. Genet. 39, 311–318.
Henry, G.L., Davis, F.P., Picard, S., and Eddy, S.R. (2012). Cell type-specific
genomics of Drosophila neurons. Nucleic Acids Res. 40, 9691–9704.
Hobert, O., Carrera, I., and Stefanakis, N. (2010). The molecular and gene reg-
ulatory signature of a neuron. Trends Neurosci. 33, 435–445.
Hon, G.C., Rajagopal, N., Shen, Y., McCleary, D.F., Yue, F., Dang, M.D., and
Ren, B. (2013). Epigenetic memory at embryonic enhancers identified in DNA
methylation maps from adult mouse tissues. Nat. Genet. 45, 1198–1206.
Hovestadt, V., Jones, D.T., Picelli, S., Wang, W., Kool, M., Northcott, P.A.,
Sultan, M., Stachurski, K., Ryzhova, M., Warnatz, H.J., et al. (2014).
Decoding the regulatory landscape of medulloblastoma using DNA methyl-
ation sequencing. Nature 510, 537–541.
Huang, W., Sherman, B.T., and Lempicki, R.A. (2009). Systematic and integra-
tive analysis of large gene lists using DAVID bioinformatics resources. Nat.
Protoc. 4, 44–57.
Jeong, M., Sun, D., Luo,M., Huang, Y., Challen, G.A., Rodriguez, B., Zhang, X.,
Chavez, L., Wang, H., Hannah, R., et al. (2014). Large conserved domains of
low DNA methylation maintained by Dnmt3a. Nat. Genet. 46, 17–23.
Jiang, Y., Matevossian, A., Huang, H.S., Straubhaar, J., and Akbarian, S.
(2008). Isolation of neuronal chromatin from brain tissue. BMC Neurosci. 9, 42.
Kepecs, A., and Fishell, G. (2014). Interneuron cell types are fit to function.
Nature 505, 318–326.
Kessaris, N., Magno, L., Rubin, A.N., and Oliveira, M.G. (2014). Genetic pro-
grams controlling cortical interneuron fate. Curr. Opin. Neurobiol. 26, 79–87.
Kim, T.K., Hemberg, M., Gray, J.M., Costa, A.M., Bear, D.M., Wu, J., Harmin,
D.A., Laptewicz, M., Barbara-Haley, K., Kuersten, S., et al. (2010). Widespread
transcription at neuronal activity-regulated enhancers. Nature 465, 182–187.
Lister, R., O’Malley, R.C., Tonti-Filippini, J., Gregory, B.D., Berry, C.C., Millar,
A.H., and Ecker, J.R. (2008). Highly integrated single-base resolution maps of
the epigenome in Arabidopsis. Cell 133, 523–536.
Lister, R.,Mukamel, E.A., Nery, J.R., Urich, M., Puddifoot, C.A., Johnson, N.D.,
Lucero, J., Huang, Y., Dwork, A.J., Schultz, M.D., et al. (2013). Global epige-
nomic reconfiguration during mammalian brain development. Science 341,
1237905.
Malik, A.N., Vierbuchen, T., Hemberg, M., Rubin, A.A., Ling, E., Couch, C.H.,
Stroud, H., Spiegel, I., Farh, K.K., Harmin, D.A., and Greenberg, M.E. (2014).
Genome-wide identification and characterization of functional neuronal activ-
ity-dependent enhancers. Nat. Neurosci. 17, 1330–1339.
Maze, I., Shen, L., Zhang, B., Garcia, B.A., Shao, N., Mitchell, A., Sun, H.,
Akbarian, S., Allis, C.D., and Nestler, E.J. (2014). Analytical tools and current
challenges in the modern era of neuroepigenomics. Nat. Neurosci. 17, 1476–
1490.
Mellen, M., Ayata, P., Dewell, S., Kriaucionis, S., and Heintz, N. (2012). MeCP2
binds to 5hmC enriched within active genes and accessible chromatin in the
nervous system. Cell 151, 1417–1430.
Molyneaux, B.J., Arlotta, P., Menezes, J.R., andMacklis, J.D. (2007). Neuronal
subtype specification in the cerebral cortex. Nat. Rev. Neurosci. 8, 427–437.
Molyneaux, B.J., Goff, L.A., Brettler, A.C., Chen, H.H., Brown, J.R., Hrvatin, S.,
Rinn, J.L., and Arlotta, P. (2015). DeCoN: genome-wide analysis of in vivo tran-
scriptional dynamics during pyramidal neuron fate selection in neocortex.
Neuron 85, 275–288.
Neph, S., Vierstra, J., Stergachis, A.B., Reynolds, A.P., Haugen, E., Vernot, B.,
Thurman, R.E., John, S., Sandstrom, R., Johnson, A.K., et al. (2012). An expan-
sive human regulatory lexicon encoded in transcription factor footprints.
Nature 489, 83–90.
Nobrega-Pereira, S., Kessaris, N., Du, T., Kimura, S., Anderson, S.A., and
Marın, O. (2008). Postmitotic Nkx2-1 controls the migration of telencephalic in-
terneurons by direct repression of guidance receptors. Neuron 59, 733–745.
Rashid, A.J., Cole, C.J., and Josselyn, S.A. (2014). Emerging roles for MEF2
transcription factors in memory. Genes Brain Behav. 13, 118–125.
1384 Neuron 86, 1369–1384, June 17, 2015 ª2015 Elsevier Inc.
Rudy, B., Fishell, G., Lee, S., and Hjerling-Leffler, J. (2011). Three groups of
interneurons account for nearly 100% of neocortical GABAergic neurons.
Dev. Neurobiol. 71, 45–61.
Sanz, E., Yang, L., Su, T., Morris, D.R., McKnight, G.S., and Amieux, P.S.
(2009). Cell-type-specific isolation of ribosome-associated mRNA from
complex tissues. Proc. Natl. Acad. Sci. USA 106, 13939–13944.
Saxena, A., Wagatsuma, A., Noro, Y., Kuji, T., Asaka-Oba, A., Watahiki, A.,
Gurnot, C., Fagiolini, M., Hensch, T.K., and Carninci, P. (2012). Trehalose-
enhanced isolation of neuronal sub-types from adult mouse brain.
Biotechniques 52, 381–385.
Sommer, L., Ma, Q., and Anderson, D.J. (1996). neurogenins, a novel family of
atonal-related bHLH transcription factors, are putative mammalian neuronal
determination genes that reveal progenitor cell heterogeneity in the developing
CNS and PNS. Mol. Cell. Neurosci. 8, 221–241.
Spiegel, I., Mardinly, A.R., Gabel, H.W., Bazinet, J.E., Couch, C.H., Tzeng,
C.P., Harmin, D.A., and Greenberg, M.E. (2014). Npas4 regulates excitatory-
inhibitory balance within neural circuits through cell-type-specific gene pro-
grams. Cell 157, 1216–1229.
Stadler, M.B., Murr, R., Burger, L., Ivanek, R., Lienert, F., Scholer, A., van
Nimwegen, E., Wirbelauer, C., Oakeley, E.J., Gaidatzis, D., et al. (2011).
DNA-binding factors shape the mouse methylome at distal regulatory regions.
Nature 480, 490–495.
Stamatoyannopoulos, J.A., Snyder, M., Hardison, R., Ren, B., Gingeras, T.,
Gilbert, D.M., Groudine, M., Bender, M., Kaul, R., Canfield, T., et al.; Mouse
ENCODE Consortium (2012). An encyclopedia of mouse DNA elements
(Mouse ENCODE). Genome Biol. 13, 418.
Steiner, F.A., Talbert, P.B., Kasinathan, S., Deal, R.B., and Henikoff, S. (2012).
Cell-type-specific nuclei purification from whole animals for genome-wide
expression and chromatin profiling. Genome Res. 22, 766–777.
Sugino, K., Hempel, C.M., Miller, M.N., Hattox, A.M., Shapiro, P., Wu, C.,
Huang, Z.J., and Nelson, S.B. (2006). Molecular taxonomy of major neuronal
classes in the adult mouse forebrain. Nat. Neurosci. 9, 99–107.
Sullivan, P.F., Daly, M.J., and O’Donovan, M. (2012). Genetic architectures of
psychiatric disorders: the emerging picture and its implications. Nat. Rev.
Genet. 13, 537–551.
Teif, V.B., Beshnova, D.A., Vainshtein, Y., Marth, C., Mallm, J.P., Hofer, T., and
Rippe, K. (2014). Nucleosome repositioning links DNA (de)methylation and dif-
ferential CTCF binding during stem cell development. Genome Res. 24, 1285–
1295.
Thurman, R.E., Rynes, E., Humbert, R., Vierstra, J., Maurano, M.T., Haugen,
E., Sheffield, N.C., Stergachis, A.B., Wang, H., Vernot, B., et al. (2012). The
accessible chromatin landscape of the human genome. Nature 489, 75–82.
Verzi, M.P., Agarwal, P., Brown, C., McCulley, D.J., Schwarz, J.J., and Black,
B.L. (2007). The transcription factor MEF2C is required for craniofacial devel-
opment. Dev. Cell 12, 645–652.
Visel, A., Taher, L., Girgis, H., May, D., Golonzhka, O., Hoch, R.V., McKinsey,
G.L., Pattabiraman, K., Silberberg, S.N., Blow, M.J., et al. (2013). A high-reso-
lution enhancer atlas of the developing telencephalon. Cell 152, 895–908.
Wang, B., Long, J.E., Flandin, P., Pla, R., Waclaw, R.R., Campbell, K., and
Rubenstein, J.L. (2013). Loss of Gsx1 and Gsx2 function rescues distinct phe-
notypes in Dlx1/2 mutants. J. Comp. Neurol. 521, 1561–1584.
Xie, W., Barr, C.L., Kim, A., Yue, F., Lee, A.Y., Eubanks, J., Dempster, E.L., and
Ren, B. (2012). Base-resolution analyses of sequence and parent-of-origin
dependent DNA methylation in the mouse genome. Cell 148, 816–831.
Xie, W., Schultz, M.D., Lister, R., Hou, Z., Rajagopal, N., Ray, P., Whitaker,
J.W., Tian, S., Hawkins, R.D., Leung, D., et al. (2013). Epigenomic analysis
of multilineage differentiation of human embryonic stem cells. Cell 153,
1134–1148.
Yu, M., Hon, G.C., Szulwach, K.E., Song, C.X., Zhang, L., Kim, A., Li, X., Dai,
Q., Shen, Y., Park, B., et al. (2012). Base-resolution analysis of 5-hydroxyme-
thylcytosine in the mammalian genome. Cell 149, 1368–1380.