met
DESCRIPTION
MET ATPL DGCATRANSCRIPT

Met. Terminologies and Glossary
Synoptic Systems
Type of system Description
Cyclonic Circulation (Cycir)
Atmospheric wind flow in upper levels associated with any low pressure system. The wind flow is counter clockwise in the Northern Hemisphere and clockwise in the Southern Hemisphere.
Anticyclonic circulation
Atmospheric wind flow in upper levels associated with any high pressure system. The wind flow is clockwise in the Northern Hemisphere and counter clockwise in the Southern Hemisphere.
Low pressure Area (LOPAR)/ well marked LOPAR
Area in the atmosphere in which the pressures are lower than those of the surrounding region at the same level and is represented on a synoptic chart by a system of one closed isobar (wind speed on the surface < 17 Knots (Kts) when the system is at sea or one closed isobar in the radius of 3 Deg. from the centre over land).
Depression Intense low pressure system represented on a synoptic chart by two or three closed isobars at 2 hPa interval and wind speed from 17 to 27 Kts at sea and two closed isobars in the radius of 3 Deg. from the centre over land.
Deep Depression Intense low pressure system represented on a synoptic chart by two or three closed isobars at 2 hPa interval and wind speed from 28 to 33 Kts at sea and three to four closed isobars in the radius of 3 Deg. from the centre over land.
Cyclonic Storm Intense low pressure system represented on a synoptic chart by more than four closed isobars at 2 hPa

interval and in which the wind speed on surface level is in between 34 – 47 Kts.
Severe Cyclonic Strom
Intense low pressure system represented on a synoptic chart by more than four closed isobars at 2 hPa interval and in which the wind speed on surface level is in between 48 – 63 Kts.
Very Severe Cyclonic Storm
Intense low pressure system represented on a synoptic chart by more than four closed isobars at 2 hPa interval and in which the wind speed on surface level is in between 64 – 119 Kts.
Super cyclonic storm Intense low pressure system represented on a synoptic chart by more than four closed isobars at 2 hPa interval and in which the wind speed on surface level is 120 Kts. and above.
Western Disturbance Weather disturbances noticed as cyclonic circulation/trough in the mid and lower tropospheric levels or as a low pressure area on the surface, which occur in middle latitude westerlies and originate over the Mediterranean Sea, Caspian Sea and Black Sea and move eastwards across north India.
Western Depression Weather system, which originate over the Mediterranean Sea, Caspian Sea and Black Sea and approach northwest India and is defined by two or more closed isobars on the surface.
Induced low Under the influence of the western disturbance, sometimes a low is developed to the south of the system called as induced low.
Induced cyclonic circulation
Under the influence of the western disturbance, sometimes a cyclonic circulation is developed to the south of the system called as induced cyclonic circulation.
Trough A line or curve along which the atmospheric pressure is

minimum. Pressure increases on both sides of the line or curve.
Trough in westerlies A moving wave perturbation in mid latitude regions which are present throughout the year which move from west to east and entire globe. These systems generally affect the northern parts of India.
Trough in easterlies A moving wave perturbation in the equatorial easterly wave, moving from east to west.
Easterly Waves A shallow trough disturbance in the easterly current of the tropics, more in evidence in the upper level winds than in surface pressure, whose passage westwards is followed by a marked intensification of cloudy, showery weather. The southern peninsular region is affected by easterly waves.
Shear line A line or narrow zone across which there is an abrupt change in the horizontal wind component; a line of maximum horizontal wind shear.
Ridge An elongated area of relatively high atmospheric pressure almost always associated with and most clearly identified as an area of maximum anticyclonic curvature of wind flow.
Wind-discontinuity A line across which there is an abrupt change in wind direction
Troposphere An atmospheric layer in which all significant weather phenomena occur. The troposphere is characterized by decreasing temperature with height. It is the lowest layer of atmosphere, which may extend upto 8km near poles and 18 km near equator.
Lower troposphere level
Part of the troposphere upto 2.1 km above mean Sea level (a.s.l)
Mid troposphere level Part of the troposphere from 2.1 km a.s.l. but below 7.6

km a.s.l
Upper troposphere level
Part of the troposphere from 7.6 km a.s.l to a height upto which temperature decreases with height.

Forecast
Types of forecast Description
Nowcasting A short range forecast having a lead time/validity of 3 to 6 hours
Short range forecasts Forecasts having a lead time / validity period of 1 to 3 days
Medium range forecasts
Forecasts having a lead time /validity period of 4 to 10 days (However, considered 4-10 days in tropics)
Long range /Extended Range forecasts
Forecasts having a lead time /validity period beyond 10 days (However, considered beyond 7 days in tropics). Usually this is being issued for a season. IMD issues Long Range Forecast for southwest Monsoon rainfall and onset date for Kerala, Northeast Monsoon Rainfall and Winter precipitation over Northwest India.
Local Forecast In local forecast, whenever any weather phenomenon is expected, its intensity, frequency and time of occurrence is indicated. In the absence of a weather phenomenon, the local forecast describes anticipated sky conditions. The other parameters for which the local forecast issued include maximum temperature and/or minimum temperature, rainfall, wind and special phenomenon.
It is valid for a radius of 50 km around the station and is updated 4 times in a day.

Seasons
Winter Season
Pre Monsoon Season Southwest Monsoon Season
Northeast Monsoon Season
January – February
March – May
June - September
October - December
Sky Conditions
Reported in terms of Octa wherein the sky is divided into 8 equal parts
Clear sky 0 Octa
Mainly clear 1-2 Octa of sky covered
Partly cloudy 3-4 Octa of sky covered
Generally cloudy 5-7 Octa of sky covered
Cloudy > 7 Octa of sky covered
Weather phenomena
Types Description
One or two spells of rain
In a 24 hrs time, rainfall occurring with a frequency of 1-2 spells.
A few spells of rain In a 24 hrs time, rainfall occurring with a frequency of more than 2 spells but with well defined dry spells in between.
Intermittent rain In a 24 hrs time, rainfall occurring with a frequency more than that defined in “A Few Spells” but is discontinuous and without presenting the character of a shower.
Drizzle Liquid precipitation in the form of water drops of very small size (by convention, with radius of water drops between about 100 and 500 µm).

Rain Liquid precipitation in the form of water drops of radius between about 500 and 2500 µm.
Shower Solid or liquid precipitation from a vertically developed cloud is designated a shower and is distinguished from the precipitation, intermittent or continuous, from layer clouds. Showers are often characterized by short duration and rapid fluctuations of intensity (by convention, with radius of water drops more than2500 µm).
Hail Solid precipitation in the form of balls or pieces of ice (hailstones) with diameters ranging from 5 to 50 mm or even more.
Thunderstorm One or more sudden electrical discharges manifested by a flash of light (Lightning) and a sharp rumbling sound (thunder).
Duststorm An ensemble of particles of dust or sand energetically lifted to great heights by a strong and turbulent wind.
Surface visibility is reduced to low limits; the qualification for a synoptic report is visibility below 1000 m.
Mist Mist is a phenomenon of small droplets suspended in air
Dew Condensation of water vapour on a surface whose temperature is reduced by radiational cooling to below the DEW-POINT of the air in contact with it
Fog Fog is a phenomenon of small droplets suspended in air and the visibility is less than one kilometer
Frost Frost occurs when the temperature of the air in contact with the ground, or at thermometer-screen level, is below the freezing-point of water (‘ground frost’ or ‘air frost’, respectively). The term is also used of the icy deposits which may form on the ground and on objects in such temperature conditions (glaze, hoar-frost).

Haze Haze is traditionally an atmospheric phenomenon where dust, smoke and other dry particles obscure the clarity of the sky.
Smog Smoke and fog together reduce the visibility
Squally weather Squally weather is meant to cover occasional or frequent squalls with rain or persistent type of strong gusty winds (mean wind speed not less than 20 knot) accompanied by rain. Such conditions are associated with low pressure systems or onset and strengthening of monsoon.
Visibility The greatest distance that prominent object can be seen and identified by unaided, normal eyes.
RainfallThe latest practices followed are summarised below:
Spatial Distribution of Rainfall
Distribution No. of Places Description
Isolated One or two Places <25% of area or less gets rainfall
Scattered At a few Places (26–50)% of area gets rainfall
Fairly Widespread At many Places (51–75)% of area gets rainfall
Wide spread At Most place (76–100)% of area gets rainfall
Dry - No station reported rainfall
Intensity of Rainfall
Descriptive Term used Rainfall amount in mms
No Rain 0.0
Very light Rain 0.1- 2.4
Light Rain 2.5 – 7.5
Moderate Rain 7.6 – 35.5

Rather Heavy 35.6 – 64.4
Heavy Rain 64.5 – 124.4
Very Heavy Rain 124.5 – 244.4
Extremely Heavy Rain ≥ 244.5
Exceptionally Heavy Rain When the amount is a value near about the highest recorded rainfall at or near the station for the month or season. However, this term will be used only when the actual rainfall amount exceeds 12 cm.

Weekly/Seasonal Rainfall Distribution on regional scale
Excess Percentage departure of realised rainfall from normal rainfall is + 20% or more.
Normal Percentage departure of realised rainfall from normal rainfall is between - 19 % to + 19 %.
Deficient Percentage departure of realised rainfall from normal rainfall is between – 20 % to - 59 %.
Scanty Percentage departure of realised rainfall from normal rainfall is between – 60 % to - 99 %.
No rain Percentage departure of realised rainfall from normal rainfall is– 100 %
Rainfall distribution on All India scale
Normal percentage departure of realised rainfall is within ± 10 % of the Long Period Average
Below Normal percentage departure of realised rainfall is < -10% of the Long Period Average
Above Normal percentage departure of realised rainfall is > 10% of the Long Period Average
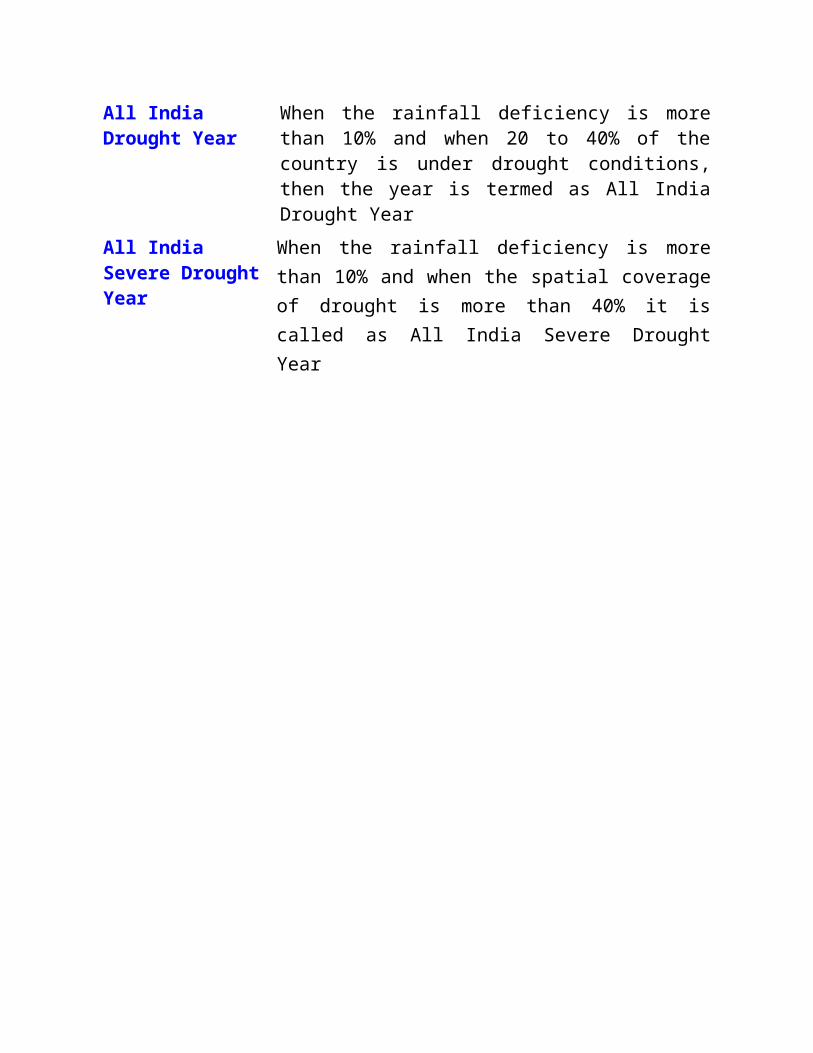
All India Drought Year
When the rainfall deficiency is more than 10% and when 20 to 40% of the country is under drought conditions, then the year is termed as All India Drought Year
All India Severe Drought Year
When the rainfall deficiency is more than 10% and when the spatial coverage of drought is more than 40% it is called as All India Severe Drought Year

Monsoon
"MONSOON" has originated from the Arabic word “MAUSIM” which means season. It is most often applied to the seasonal reversals of the wind direction along the shores of the Indian Ocean, especially in the Arabian Sea, that blow from the southwest during one half of the year and from the northeast during the other half.
Onset & Advance of Monsoon
The guidelines followed for declaring the onset of monsoon over Kerala and its further advance over the country are enlisted below:
Onset over Kerala
a) Rainfall
If after 10th May, 60% of the available 14 stations enlisted*, viz. Minicoy, Amini,Thiruvananthapuram, Punalur, Kollam, Allapuzha, Kottayam, Kochi, Thrissur, Kozhikode, Thalassery,Kannur, Kasargode and Mangalore report rainfall of 2.5 mm or more for two consecutive days, the onset over Kerala be declared on the 2nd day, provided the following criteria are also in concurrence.
b) Wind field
Depth of westerlies should be maintained upto 600 hPa, in the box equator to Lat. 10ºN and Long. 55ºE to 80ºE. The zonal wind speed over the area bounded by Lat. 5-10ºN, Long. 70-80ºE should be of the order of 15 – 20 Kts. at 925 hPa. The source of data can be RSMC wind analysis/satellite derived winds.
3. Outgoing Longwave Radiation (OLR)
INSAT derived OLR value should be below 200 wm-2 in the box confined by Lat. 5-10ºN and Long. 70-75ºE.

Further Advance of Monsoon over the Country
a) Further advance is declared based on the occurrence of rainfall over parts/sectors of the sub-divisions and maintaining the spatial continuity of the northern limit of monsoon, further advance is declared.
The following auxiliary features are also looked into:
b) Along the west coast, position of maximum cloud zone, as inferred from the satellite imageries is taken into account.
c) The satellite water vapour imageries are monitored to assess the extent of moisture incursion.
Northern Limit of Monsoon (NLM)
Southwest monsoon normally sets in over Kerala around 1st June. It advances northwards, usually in surges, and covers the entire country around 15th July. The NLM is the northern most limit of monsoon upto which it has advanced on any given day.
Withdrawal of SW Monsoon
a) Withdrawal from extreme north-western parts of the country is not attempted before 1st September.
a) After 1st September:
The following major synoptic features are considered for the first withdrawal from the western parts of NW India.
i) Cessation of rainfall activity over the area for continuous 5 days.ii) Establishment of anticyclone in the lower troposphere (850 hPa and
below)iii) Considerable reduction in moisture content as inferred from satellite
water vapour imageries and tephigrams.

Further Withdrawal from the Country
i) Further withdrawal from the country is declared, keeping the spatial continuity, reduction in moisture as seen in the water vapour imageries and prevalence of dry weather for 5 days.
ii) SW monsoon is from the southern peninsula and hence from the
entire country only after 1st October, when the circulation pattern indicates a change over from the southwesterly wind regime.
Criteria for Declaring Onset of Northeast Monsoon
For declaring onset of Northeast Monsoon following criteria are considered:
(1) Withdrawal of south west Monsoon upto 15º N.(2) Onset of persistent surface easterlies over Tamil Nadu coast.(3) Depth of easterlies upto 850 hpa over Tamil Nadu coast.(4) Fairly widespread rainfall over the coastal Tamil Nadu and adjoining areas.(5) Onset is not to be declared before 10th October even, if the conditions
described above exist.
Activity/ strength of Northeast MonsoonThe monsoon activity over a subdivision is described as below.
Weak Monsoon:
Rainfall less than half of the normal.
Normal Monsoon:
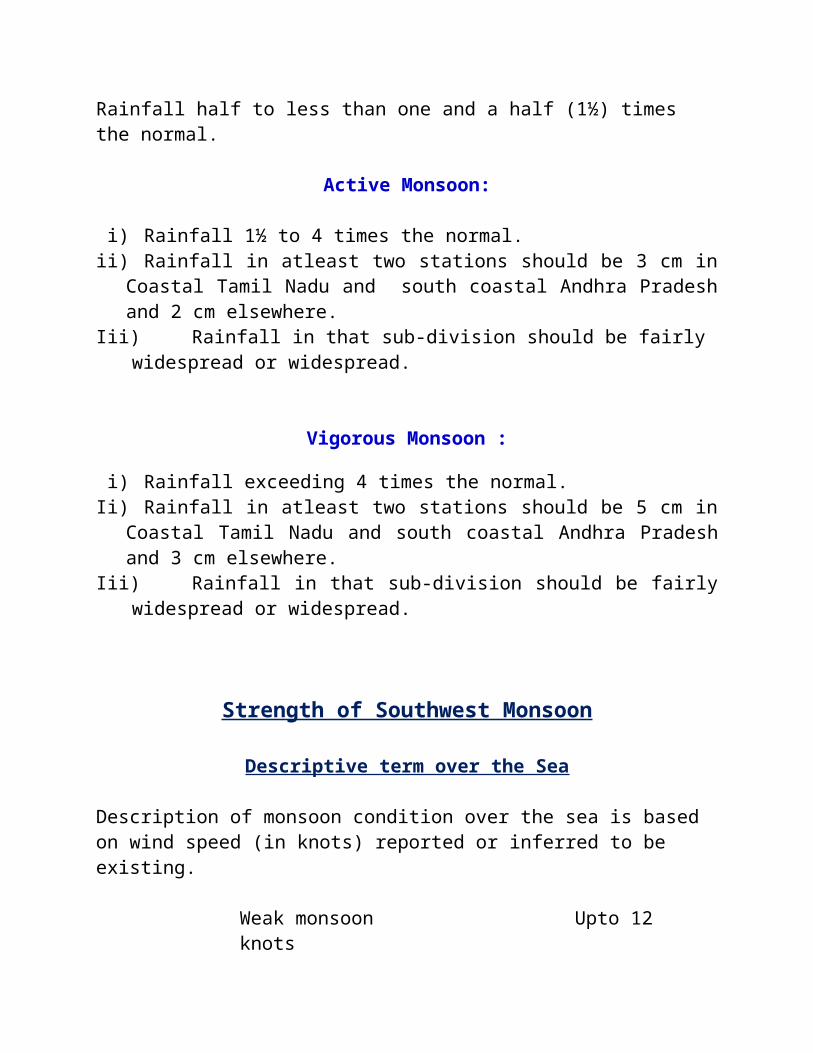
Rainfall half to less than one and a half (1½) times the normal.
Active Monsoon:
i) Rainfall 1½ to 4 times the normal.ii) Rainfall in atleast two stations should be 3 cm in Coastal Tamil Nadu
and south coastal Andhra Pradesh and 2 cm elsewhere.Iii) Rainfall in that sub-division should be fairly widespread or widespread.
Vigorous Monsoon :
i) Rainfall exceeding 4 times the normal.Ii) Rainfall in atleast two stations should be 5 cm in Coastal Tamil Nadu
and south coastal Andhra Pradesh and 3 cm elsewhere.Iii) Rainfall in that sub-division should be fairly widespread or widespread.
Strength of Southwest Monsoon
Descriptive term over the Sea
Description of monsoon condition over the sea is based on wind speed (in knots) reported or inferred to be existing.
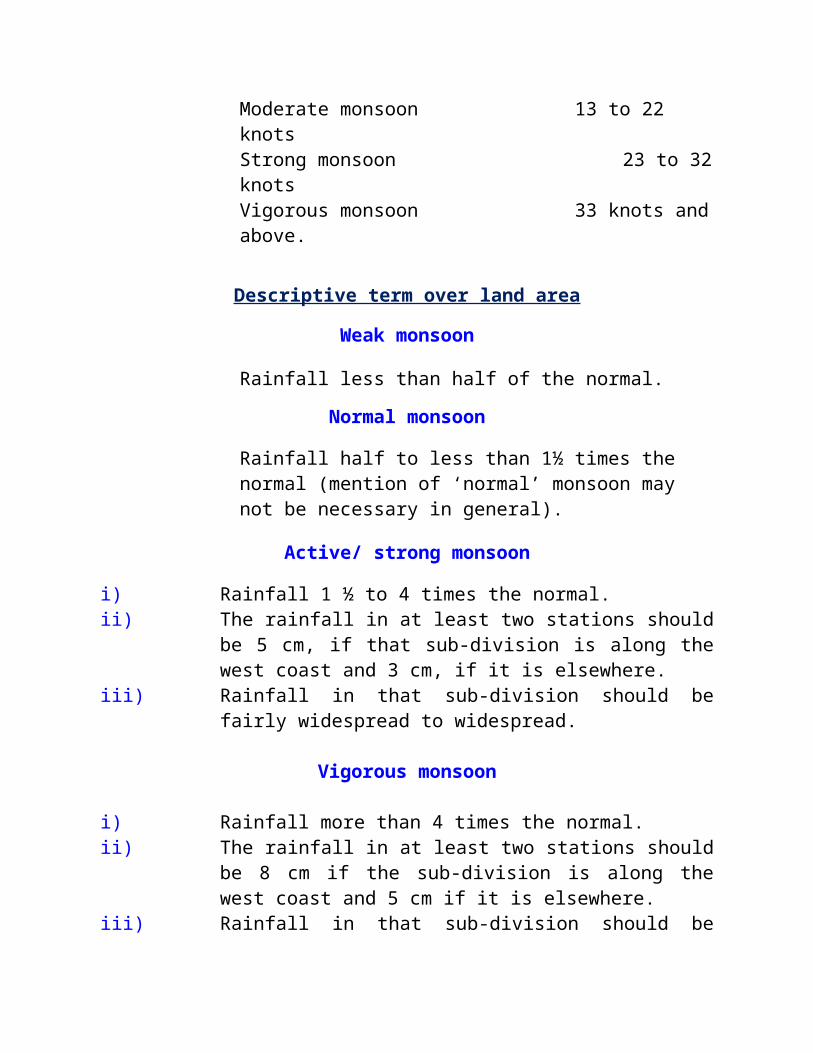
Weak monsoon Upto 12 knotsModerate monsoon 13 to 22 knotsStrong monsoon 23 to 32 knotsVigorous monsoon 33 knots and above.
Descriptive term over land area
Weak monsoon
Rainfall less than half of the normal.
Normal monsoon
Rainfall half to less than 1½ times the normal (mention of ‘normal’ monsoon may not be necessary in general).
Active/ strong monsoon
i) Rainfall 1 ½ to 4 times the normal.ii) The rainfall in at least two stations should be 5 cm, if that
sub-division is along the west coast and 3 cm, if it is elsewhere.
iii) Rainfall in that sub-division should be fairly widespread to

widespread.
Vigorous monsoon
i) Rainfall more than 4 times the normal.ii) The rainfall in at least two stations should be 8 cm if the
sub-division is along the west coast and 5 cm if it is elsewhere.
iii) Rainfall in that sub-division should be fairly widespread or widespread
Subdued Monsoon activity
1. Whenever, a country wide dry spell continues for more than 3 days and is expected to continue for atleast 2 more days, the description of monsoon is given as ‘weak or subdued monsoon for the country as a whole.
2. Information on prolonged dry spells/ subdued activity over the Met. Subdivisions are also included in the bulletins issued by Regional Meteorological Centres and Meteorological Centres, if such a spell is persisting for 2 or more days and is expected to continue.
3. Monsoon activity for a sub-division might be considered subdued if the rainfall realised is less than ½ the normal.
Temperature
Description of 24 hrs temperature changes. Maximum temperature
(a) When the normal maximum temperature of a station is 40º C or below.
Nomenclature Past 24 hours change
Little change -1º C to 1º CRise/ fall 2º C

Appreciable rise/ fall 3º C to 4º CMarked rise/ fall 5º
C to 6º CLarge rise/ fall 7º C or more
(b) When the normal maximum temperature of a station is more than 40º C.
Nomenclature Past 24 hours change
Little change -1o C to 1 o CRise/ fall 2º CMarked rise/ fall 3º C to 4º CLarge rise/ fall 5º C or more
Minimum temperature
(a) When the normal minimum temperature of a station is 10º C or more.
Nomenclature Past 24 hours change
Little change 1º C to -1º CFall/ rise 2º CAppreciable fall/ rise 3º C to 4º CMarked fall/ rise 5º C to 6º CLarge fall/ rise 7º C or less
(b) When the normal minimum temperature of a station is less than 10º C.
Nomenclature Past 24 hours change
Little change 1º C to -1º CFall/ rise 2º CMarked fall/ rise 3º C to 4º CLarge fall/ rise 5º C or less
Criteria for Heat Wave:
Heat wave need not be considered till maximum temperature of a station reaches at least 40º C for Plains and at least 30º C for Hilly regions.

a) When normal maximum temperature of a station is less than or equal to 40º C
Heat Wave Departure from normal is 5º C to 6º CSevere Heat Wave Departure from normal is 7º C or more
b) When normal maximum temperature of a station is more than 40º C
Heat Wave Departure from normal is 4º C to 5º CSevere Heat Wave Departure from normal is 6º C or more
a) When actual maximum temperature remains 45ºC or more irrespective of normal maximum temperature, heat wave should be declared.
Hot day
In the northern plains of the country, dust in suspension occurs in many years for several days, bringing minimum temperature much higher than normal and keeping the maximum temperature around or slightly above normal. Sometimes increase in humidity also adds to this discomfort. Nights do not get cooled and become uncomfortable. To cover this situation, hot day concept has been introduced as given below:
Whenever, the maximum temperature remains 40ºC or more and minimum temperature is 5º C or more above normal, it may be defined as Hot Day, provided it is not satisfying the heat wave criteria given above.
Criteria for describing Hot Day for coastal stations
When maximum temperature departure is 5º C or more from normal, Hot Day may be described irrespective of the threshold value of 40º C. If the threshold value of 40º C is reached Heat Wave may be declared.

When a station satisfies both the Heat Wave and Hot Day criteria, then Heat Wave should be given higher priority and be declared.
Hot Wind
Hot wind reduces moisture causing dehydration and a prolonged exposure may prove to be fatal.
The phenomena of Loo over the plains of northwest India is very well known. It is also described in the Weather bulletins and appropriate warnings are being issued at present.
Criteria for Cold Wave
Wind chill factor plays an important role and brings down the actual minimum temperature depending upon the wind speed. The actual minimum temperature of a station is reduced to “wind chill effective minimum temperature (WCTn)” based on wind chill factor (Reference : WMO No. 331/ Tech note No. 123 on “The assessment of human bio-climate. A limited review of physical parameters, 1972).
For declaring “Cold Wave” and “Cold Day” WCTn is used.
If WCTn is 10°C or less, then only the conditions for cold wave are considered.
a) When normal minimum temperature is equal to 10°C or more.
Cold Wave : Departure from normal is -5°C to -6°C.Severe Cold Wave : Departure from normal is -7°C or less
a) When normal minimum temperature is less than 10°C.
Cold Wave : Departure from normal is -4°C to -5°C.Severe Cold Wave : Departure from normal is -6°C or less.
When WCTn is 0°C or less, Cold Wave is declared irrespective of normal minimum temperature of the station. However, this criteria is not applicable for those stations whose normal minimum temperature is below 0°C.
Cold Wave conditions for coastal stations
For coastal stations the threshold value of minimum temperature of 10ºC is rarely reached. However, the local people feel discomfort due to wind chill factor which reduces the minimum temperature by a few degrees depending upon the wind speed. The “Cold Day” concept is used following the criteria given below:
Criteria for describing “Cold Day” for coastal stations
i) Actual minimum temperature of a station is reduced to WCTn.ii) This WCTn is used to declare “Cold Wave” or “Cold Day”.iii) When minimum temperature departure is -5ºC or less over a station,
“Cold Day” is described irrespective of threshold value of 10ºCiv) However, when a threshold of 10ºC is reached “Cold Wave” is
declared.v) When a station satisfies both the Cold Wave and Cold Day criteria,
then Cold Wave has a higher priority and has to be declared.
Heat wave/ Cold Wave and hot Day/ Cold Day are area specific phenomena. Therefore they are described for a Met. Sub-division or a part thereof, when at least two stations satisfy the criteria
Winds
Wind Air in motion is called wind which is haracterized by direction and speed. The direction of the wind is the direction from which the wind approaches the station (Example Northerly wind – Wind approaching the station from North)
Gales A gale is a very strong wind (34 knots or more)
Squall A sudden increase of wind speed by atleast 3 stages on the Beaufort Scale, the speed rising to force 6 or more, and lasting for atleast one minute is called a squall
Gust A rapid increase in the strength of the wind relative to the mean strength at the time. The wind speed should be at least 17 knots or more
Nomenclature for different parts of the day
Early hours of (date) 0000 – 0400 hrs, ISTEarly morning 0400 – 0600 hrs. ISTMorning 0400 – 0800 hrs. ISTForenoon 0800 – 1200 hrs. ISTAround noon 1100 – 1300 hrs. ISTAfternoon 1200 – 1600 hrs. ISTEvening 1600 – 2000 hrs. ISTNight 2000 – 2400 hrs. IST
Terminology used for state of Sea
Descriptive term Height inMetres
Wind speed in knots (kmph)
Beaufort scale
Calm ( glassy) 0 0 0
Calm (rippled) 0 - 0.1 1 - 3 ( 2 - 6) 1
Smooth (waveless) 0.1 - 0.5 4 - 10 ( 7 - 19 ) 2 - 3
Slight 0.5 - 1.25 11 - 16 (20 - 30 ) 4
Moderate 1.25 - 2.5 17 - 21 ( 31 - 39) 5
Rough 2.5 - 4.0 22 - 27 (41 - 50) 6
Very rough 4.0 - 6.0 28 - 33 (52 - 61) 7
High 6.0 - 9.0 34 - 40 (63 - 74) 8
Very high 9.0 - 14.0 41 - 63 (76 - 117) 9 - 11
Phenomenal Over 14 64 or above(119 or above)
12
The Dvorak technique
The Dvorak technique is a method using enhanced Infrared and/or visible satellite imagery to quantitatively estimate the intensity of a tropical system. Cloud patterns in satellite imagery normally show an indication of

cyclogenesis before the storm reaches tropical storm intensity. Indications of continued development and/or weakening can also be found in the cloud features. Using these features, the pattern formed by the clouds of a tropical cyclone, expected systematic development, and a series of rules, an intensity analysis and forecast can be made. This information is then standardized into an intensity code.
“T” classification of Cyclonic Storm
T. Number
/ C.I. Number
Wind speed
in knots
Wind speed
in kmph
D p Classification of cyclonic disturbance
Wind criteria in knots
Wind criteria in
kmph
T1.0 Low <17 <31
T1.5 25 46.3 3 Depression 17-27 31-49
T2.0 30 55.6 4.5 Deep Depression
28-33 50-61
T2.5 35 64.9 6.1 Cyclonic Storm 34-47 62-88
T3.0 45 83.4 10.0
T3.5 55 101.9 15.0 Severe Cyclonic Storm
48-63 89-117
T4.0 65 120.5 20.9 Very Severe Cyclonic Storm
64-119 119-221
T4.5 77 142.7 29.4
T5.0 90 166.8 40.2
T5.5 102 189.0 51.6
T6.0 115 213.1 65.6
T6.5 127 235.4 80.0 Super Cyclonic Storm
120 and above
222 and aboveT7.0 140 259.5 97.2
T7.5 155 287.3 119.1
T8.0 170 315.1 143.3