mesa exam 5 sleep data documentation guide · mesa exam 5 sleep data documentation guide version...
TRANSCRIPT
1
MESA EXAM 5 SLEEP DATA DOCUMENTATION GUIDE
Version 3.0: August 29, 2014,
Purpose: The following document provides an overview to help guide analysis, interpret findings and assist with manuscript preparation. Further details are provided in study Manuals of Procedures and can be retrieved at the MESA web site and later at: sleepdata.org. The following are summarized:
I. MESA Sleep Protocol Overview: Overview of how the Sleep Exam interfaced with MESA Exam 5 and protocol, equipment and questionnaires used for the MESA Sleep protocol.
II. MESA Sleep Participation and Sleep Data Received: Provides the numbers of participants who were studied with polysomnography, actigraphy and sleep questionnaires and provides comparisons of sleep participants to non-participants using both Exam 5 and Exam 2 data to address representativeness of the Sleep participants to other MESA participants. The quality metrics for the sleep data are provided in this section.
III. PSG Scoring and Reliability: Provides an overview of the PSG scoring rules and scoring reliability. IV. Polysomnography Data Guide: Using Quality Filters: Provides an overview of how signal and study quality codes can be used to
identify subsets of data that meet various study hypotheses. V. Polysmnography Variables: Provides recommended list of “popular” PSG variables and provides distributions to help with
transformations of non-normally distributed variables VI. Actigraphy Scoring and Reliability: Provides an overview of actigraphy scoring rules and scoring reliability. VII. Actigraphy Variables: Provides recommended list of “popular” actigraphy variables and information on actigraphy quality codes.
2
I. MESA Sleep Protocol Overview:
MESA Overview: The Multi-Ethnic Study of Atherosclerosis (MESA) is a multi-center prospective study of 6814 ethnically diverse men and women aged 45-84 from six communities in the United States. MESA was designed to investigate the prevalence and progression of subclinical cardiovascular disease (CVD) as well as to identify CVD risk factors predicting development of clinically overt CVD in an ethnically diverse population. All MESA participants were invited to participate in the MESA Sleep ancillary study at MESA Exam 5 (2010-2013). The purpose of MESA Sleep is to obtain quantitative measures of sleep and sleep-disordered breathing (SDB) to better characterize specific sleep traits and sleep disorders and their CVD risk associations across ethnic groups, as well as to determine the association of sleep indices with incident CVD. In-home overnight polysomnography (PSG), 7 day actigraphy, and sleep questionnaire data were collected in all Exam 5 MESA participants who agreed to Sleep Exam participation.
Ia. MESA Sleep Study Objectives:
1. Collect data on sleep indices using standardized in-home PSG, 7 day wrist actigraphy measurements and supplemental sleep questionnaires in at least 2000 individuals participating in MESA EXAM 5.
2. Perform routine and specialized scoring of these physiological records, and link these data to the rich cross-sectional and prior longitudinal covariate data available in MESA
3. Quantify the associations of SDB, sleep duration, sleep fragmentation, slow wave sleep (SWS) and sleep timing/rhythms with CVD risk factors, subclinical CVD, and clinical CVD through linkage of sleep data with the existing MESA data.
4. Identify ethnic, gender and socio-economic status (SES) differences in the distribution of measures of sleep disturbances and evaluate the extent to which such differences explain ethnic/race and gender differences in subclinical and clinical CVD.
Ib. Description of MESA EXAM 5
The Core MESA EXAM 5 occurred from April 2010 to February 2012, 10 years after the initial exam. Similar to the prior follow-up exams, EXAM 5 collected interval medical history, anthropometrics, blood pressure readings, fasting venipuncture, spot urine collection, nutrition and physical activity surveys, smoking history, ankle/arm index, retinal photography, and ECG. In addition, cardiac MRI was repeated in participants who underwent cardiac MRI at exam 1, and cognitive function testing was newly performed in all MESA EXAM 5 participants. Randomly selected participants were invited to participate in the MESA AIR ancillary study (70% of the MESA cohort), which performed cardiac CT imaging for measurement of CAC and carotid ultrasound for IMT measurement. Additionally, ongoing bi-annual telephone interviews for events surveillance will be continued through 2015.
Ic. Sleep Exam Design
ALL MESA Exam 5 participants other than those reporting regular use of oral devices, nocturnal oxygen, or nightly CPAP were invited to participate in the MESA sleep exam. Sleep Exams were scheduled to occur after the MESA Core exam.
3
The MESA sleep visit was conducted in the participants’ homes in early evening and consisted of home-PSG set up and instruction on completion of an expanded sleep questionnaire, a 7 day sleep diary, and actigraphy for the subsequent 7 days including the night of the PSG. Staff members conducting the sleep exams underwent standardized data collection training and certification.
Id. Actigraphy Acquisition
Actigraphy was performed using the Actiwatch Spectrum wrist actigraph (Philips Respironics, Murrysville, PA) worn on the participant’s non-dominant wrist. Output was sent to the Sleep Reading Center at Brigham and Women’s Hospital where records were scored with use of the sleep diary. Major summary variables generated included total sleep duration, sleep efficiency, and the number and duration of awakenings per night. A minimum of 3 days of data with > 50% reliable data were required for a “passed” study. Studies with fewer than 4 weekdays and 1 weekend day of acceptable data were repeated when possible.
Ie. Polysomnography Acquisition
In-home polysomnography (PSG) was conducted using the Compumedics Somte System (Compumedics LTd., Abbostville, Australia. The sensors and recording montage consisted of cortical electroencephalograms (central C4-M1, occipital Oz-Cz, and frontal Fz-Czleads), bilateral electrooculograms, chin EMG, thoracic and abdominal respiratory inductance plethysmography (by auto-calibrating inductance bands); airflow (by nasal-oral thermocouple and pressure recording from a nasal cannula); ECG; leg movements, and finger pulse oximetry. In addition to connection of sensors and electrodes, trained staff members completed signal calibrations and checked impedance. Nocturnal recordings were transmitted to the centralized reading center at Brigham and Women’s Hospital and data were scored by trained technicians using current guidelines.
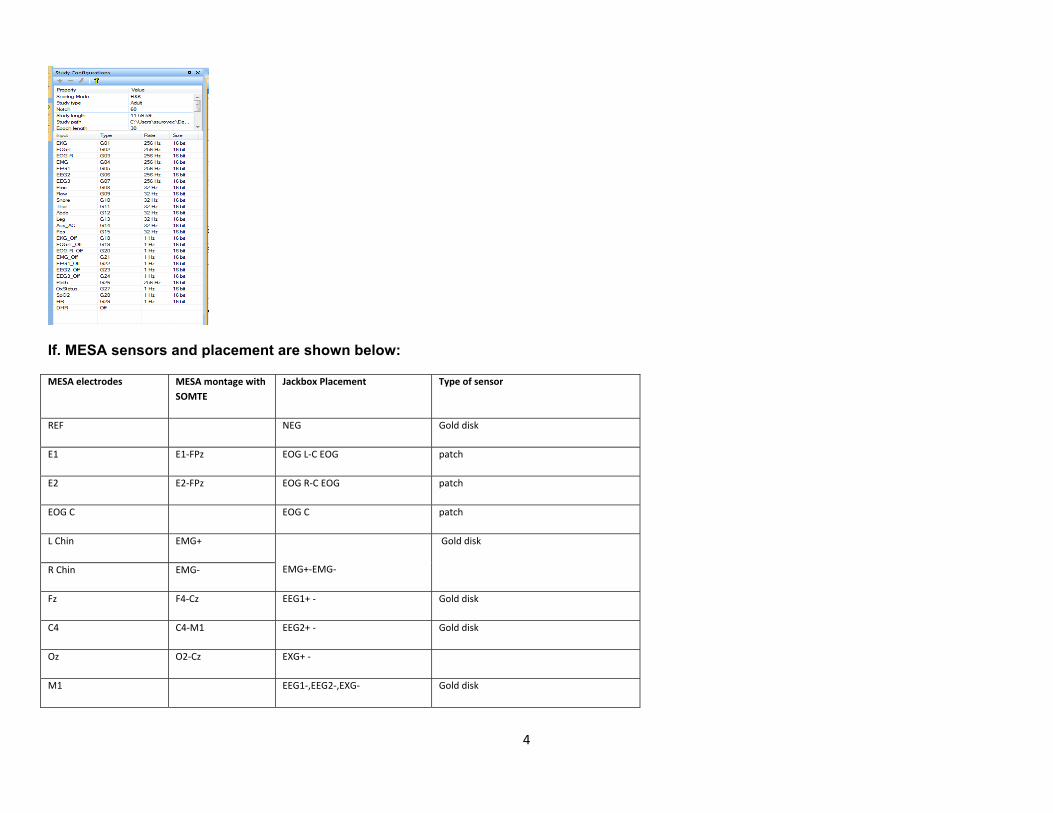
The recording montage (sampling frequency) is shown below:
4
If. MESA sensors and placement are shown below:
MESA electrodes MESA montage with SOMTE
Jackbox Placement Type of sensor
REF NEG Gold disk
E1 E1‐FPz EOG L‐C EOG patch
E2 E2‐FPz EOG R‐C EOG patch
EOG C EOG C patch
L Chin EMG+
EMG+‐EMG‐
Gold disk
R Chin EMG‐
Fz F4‐Cz EEG1+ ‐ Gold disk
C4 C4‐M1 EEG2+ ‐ Gold disk
Oz O2‐Cz EXG+ ‐
M1 EEG1‐,EEG2‐,EXG‐ Gold disk
5
LECG
ECG
ECG‐ Patch
R ECG ECG+ patch
HR From XPOD From XPOD From XPOD
Lleg
Lleg‐Rleg
Limb Single piezo, tied Rleg
Airflow Airflow AUX ThermiSense
Cannula Cannula Transducer port Cannula
Chest Chest THO Compumedics Reuseable Inductive Belts for Summit IP/Somte Systems
ABD ABD ABD Compumedics Reuseable Inductive Belts for Summit IP/Somte Systems
XPOD XPOD Oximeter port Nonin J 8000
From XPOD no
From XPOD Pleth From XPOD From XPOD
Built in position Position Built in Built in
Ig. Sleep Diaries and Questionnaires
The sleep diary collected self-reported information on bed and wake times, sleep onset, wakes after sleep onset, naps, sleep quality, actigraphy removal, and other unusual events during the day or night.
The MESA sleep questionnaire administered during the sleep visit included the validated questions from: 1) the Sleep Hearth Health Study (SHHS) Sleep Habits Questionnaire, which provides a broad range of information on sleep disordered breathing (SDB), sleep patterns and duration, and symptoms of sleep disturbances and daytime consequences. 2) the Women’s Health Initiative (WHI) Insomnia Rating Scale, which ask subjects to rate how frequently they experience difficulty with sleep initiation and maintenance over the past four weeks. 3) the Epworth Sleepiness Score (ESS), the most commonly used tool to assess daytime sleepiness. The ESS asks the subject to rate his/her likelihood of falling asleep in 8 different
6
situations 4) the International Restless Legs Screening Questionnaire, a 4 question instrument designed to screen for restless legs syndrome, and 5) the Horne-Ostberg Sleep Questionnaire, which assesses an individuals’ phase of entrainment. In total there were 23 listed questions, and a research assistant reviewed the questionnaire for completeness. The questionnaire was divided as follows: Questions 1-3 asked about wake, sleep, and nap times. Questions 4-11, regarding sleep habits, included validated questions from the WHI Insomnia Index and the SHHS Sleep Habits Questionnaire. Question 12 consisted of the ESS. Questions 13-14, related to snoring and sleep disordered breathing, also came from the SHHS questionnaire. Question 15 consisted of the International Restless Legs Screening Questionnaire. The remaining questions, 16-23, adapted from the SHHS Sleep Habits questionnaire and a modified Horne-Ostberg Sleep Questionnaire, were related to sleep disorders and disturbances including snoring, SDB, circadian disorders and their daytime consequences.
Ih. Questionnaire SCORING:
1) The Women’s Health Initiative Insomnia Rating Scale (WHIIRS) is a 5 item questionnaire intended to assess sleep latency, sleep maintenance insomnia, early morning awakening, and sleep quality. Each question may be scored on a 5 point scale (from 0-4). The MESA questionnaire questions 4-7 and 11 correspond to the WHIIRS. They are scored in the exact manner as the WHIIRS, such that an answer of “no, not in the past 4 weeks” equals zero points, “yes, less than once a week” is 1 point, “Yes, 1 or 2 times a week” is 2 points, “yes, 3 or 4 times a week” is 3 points, and “yes, 5 or more times a week” is 4 points for the first four questions. For the fifth question, “very sound or restful” sleep is zero points and each category above that is 1, 2, 3 and 4 points (so “very restless” is 4 points). The score for each question is then added for a summary score that may range from 0 to 20. The higher the score, the more severe the insomnia, but a score of greater than or equal to 9 is considered clinically significant insomnia.
2) The Epworth Sleepiness Score (ESS) is an 8 item questionnaire designed to measure general sleepiness. Each question is rated on a 4 point scale (0-3) with a summary score ranging from 0-24. A score of 9 or 10 and above is considered abnormal. MESA questionnaire item 12 corresponds to the ESS exactly and the scoring was done in an identical fashion, such that if someone responds with “would never doze” they are assigned zero points, “slight doze chance” they are assigned 1 point, “moderate doze chance” with 2 points, and finally “high doze chance” with 3 points.
3) The Morningness-Eveningness Questionnaire (MEQ) is a 19 item questionnaire designed to assess morningness and eveningness. Each question is rated on a 4 or 5 point scale based on the answer selected. In order to score the survey one simply adds the points from each question together. The summary score may range from 16 to 86. Scores of 16-41 indicate “evening types,” scores of 42-58 indicate “intermediate types” and scores or 59 and above indicate “morning types.” The scores can be further classified as follows:
16-30 31-41 42-58 59-69 70-86
Definite evening Moderate evening
intermediate Moderate morning
Definite morning

7
Questions 16-20 from the MESA questionnaire correspond to the MEQ. Each answer has a sum value attached to it generally ranging from 1-5. We maintained the same scales for these five questions with one exception: for the MESA question 20 (corresponds to MEQ question 19) one additional choice was added: “neither a morning nor an evening type.” This is an intermediate answer and was given an intermediate score ranking (approximately equivalent to the median/mean of the other points for that particular question). In order to obtain a summary score we simply added the points from each question as is done with the MEQ. The summary score may range from 4-25 with the following breakdown of the scores:
4-8 9-12 13-15 16-19 20-25
Definite evening Moderate evening
intermediate Moderate morning
Definite morning
1) Ancoli-Israel S, Chesson A, and Quan SF for the Americna Academy of Sleep Medicine. The AASM Manual for the Scoring of Sleep and Associated Events: Rules, Terminology and Techinical Specifications, 1st ed.: Wstchester, Illinois; American Academyu of Sleep Medicine, 2007.
2) Quan SF, Howard BV, Iber C, et al. The Sleep Heart Health Study: Design, rationale, and methods. Sleep. 1997;20:1077–85. 3) Levine DW, Kaplan RM, Kripke DF, Bowen DJ, Naughton MJ, Shumaker SA. Factor structure and measurement invariance of the Women's Health
Initiative Insomnia Rating Scale. Psychol Assess. 2003 Jun;15(2):123-36. 4) Johns MW. A new method for measuring daytime sleepiness: the Epworth Sleepiness Scale. Sleep 1991; 50-55. 5) Walters AS, LeBrocq C, Dhar A, Hening W, Rosen R, Allen RP, Trenkwalder C. Validation of the International Restless Legs Syndrome Study Group
rating scale for restless legs syndrome. The International Restless Legs Syndrome Study Group. Sleep Med. 2003 Mar;4(2):121-32. 6) Horne, J.A.; Östberg, O. (1976). A self-assessment questionnaire to determine morningness-eveningness in human circadian rhythms". Int J Chronobiol 4
(2): 97–110. 7) Taillard, Jacques; et al. (2004). "Validation of Horne and Ostberg Morningness-Eveningness Questionnaire in a Middle-Aged Population of French
Workers". Journal of Biological Rhythms 19 (1): 76–86.
8
II. MESA Sleep Participation and Sleep Data Received IIa. Sleep Data Received The following describes participants in MESA-Sleep. As shown below, of the 4,077 participants approached, 147 (6.5%) were ineligible and 141 participants lived too far to participate. Of the remaining 3,789 participants, 2,261 participated in the sleep exam (59.8%). STATUS N Total Number Approached 4,077 Sleep Data Received 2,261* Had both Sleep Quest. & RC data 2,217 Sleep Quest. – No RC data 23 RC Data – No Sleep Quest 21 PSGs done (passed) 2,166
(2,060) Actigraphy done 2,211
(2,156) 1,826 Both Actigraphy & PSG 1,976 No Sleep Data 1,816 Ineligible 147
Deceased 19 Uses CPAP 13 Nursing home 93 Dental device 7 Medical reason 4 Other reason 5
Refused 1,305 Too busy, no time 85 Not Interested 846 Privacy concerns 23 Don’t like equipment 112 Multiple cancellations 40 Medical reason 18 No reason given 101 Other reason 80
Reason not Specified 219 Coded as Pending 4 Live too far away 141
*3 sleep studies were performed on MESA ppts who did not undergo MESA Core exam
9
IIb. Sleep Data Quality Polysomnography 2,166 PSGs were performed. Of these, 4.9% failed minimal study quality (5.1% Wake Forest, 3.9% Columbia, 2.2% JHU, 3.5% Minn, 2.0% Northwestern, and 12.1% UCLA). Of the assed studies, 80% were judged to be in the very good to outstanding quality range as defined below: PSG Study Quality: Outstanding. All channels good for > 6 hours and entire sleep time. Excellent. At least one EEG channel, one EOG channel, EMG, oximetry, all respiratory channels usable for > 5 hours and > 75% of the sleep time. Very good. At least one EEG channel, oximetry, airflow and either chest or abdomen usable for > 5 hours and > 50% of the sleep time Good. At least one respiratory channel (airflow or either band), oximetry and one EEG usable for > 5 hours and > 50% of the sleep time Fair. At least one respiratory channel, oximetry and one EEG usable for > 3 hours or study scored sleep-wake only (because of the EEG artifact). Failed. Less than 3 hours useable data. Actigraphy Of the 2,211 participants attempted studies, with 2,156 participants with passed” studies (97%). Of these, 1,976 participants had both acceptable PSGs and actigraphy studies (1,826 with studies which occurred concurrently) and 180 had only acceptable actigraphy studies. Quality of actigraphy studies was graded as: 42% good-outstanding; 27% fair; and 33% poor. Of the passed studies, there was an average of 6.9 (0.54) days of acceptable data, 5.0 (0.42) days of weekday data and 2.0 (0.27) days of weekend data. Actigraphy Study Quality: Outstanding. All nights have reliable sleep latency and overnight data associated with it. All data markers (Sleep Diary, Event Marker, and Light Levels) are consistent with data. Excellent. ≥ 75% of nights have reliable sleep latency and overnight data associated with it. At least 2 data markers (Sleep Diary, Event Marker, or Light Levels) are consistent with data Very Good. ≥ 75% of nights have reliable sleep latency and overnight data associated with it. Less than 2 data markers (Sleep Diary, Event Marker, or Light Levels) are consistent with data Good. ≥ 50% of nights have reliable sleep latency and overnight data associated with it. At least 2 data markers (Sleep Diary, Event Marker, or Light Levels) are consistent with data Fair. ≥ 50% of nights have reliable sleep latency and overnight data associated with it. Less than 2 data markers (Sleep Diary, Event Marker, or Light Level) are consistent with data Poor. ≤ 50% of nights have reliable sleep latency and overnight data associated with it.
10
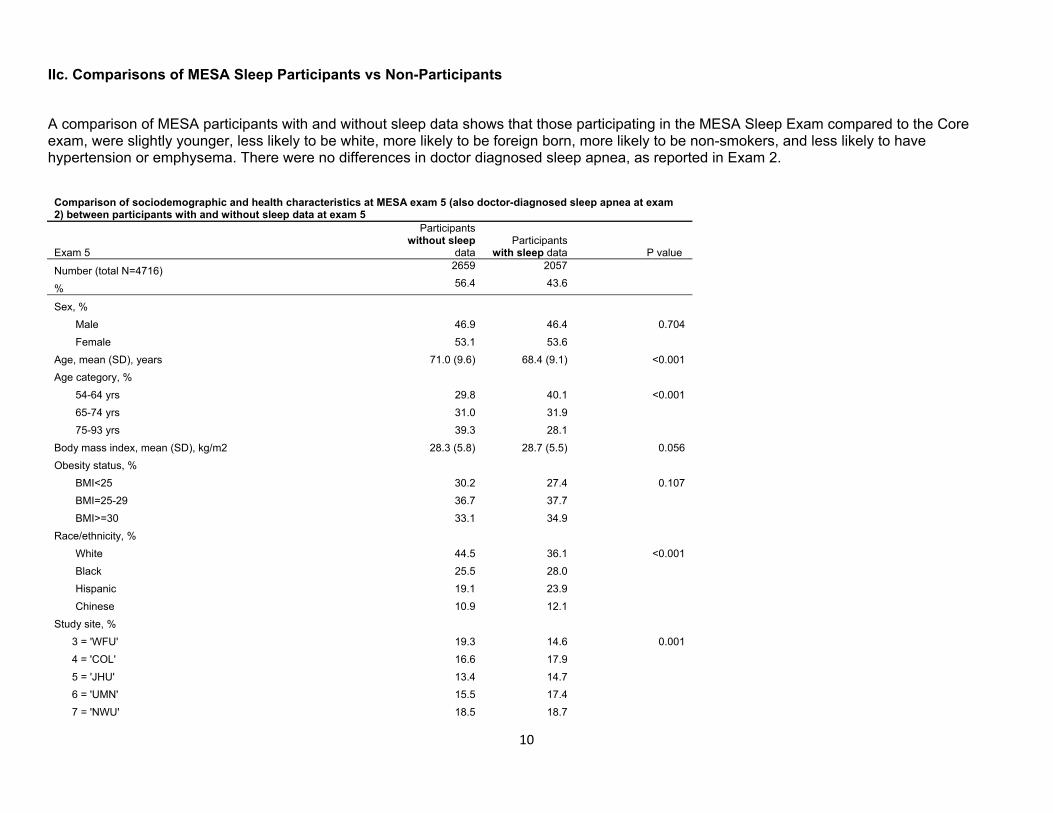
IIc. Comparisons of MESA Sleep Participants vs Non-Participants
A comparison of MESA participants with and without sleep data shows that those participating in the MESA Sleep Exam compared to the Core exam, were slightly younger, less likely to be white, more likely to be foreign born, more likely to be non-smokers, and less likely to have hypertension or emphysema. There were no differences in doctor diagnosed sleep apnea, as reported in Exam 2.
Comparison of sociodemographic and health characteristics at MESA exam 5 (also doctor-diagnosed sleep apnea at exam 2) between participants with and without sleep data at exam 5
Exam 5
Participants without sleep
data Participants
with sleep data P value
Number (total N=4716) 2659 2057
% 56.4 43.6
Sex, % Male 46.9 46.4 0.704 Female 53.1 53.6
Age, mean (SD), years 71.0 (9.6) 68.4 (9.1) <0.001 Age category, %
54-64 yrs 29.8 40.1 <0.001 65-74 yrs 31.0 31.9 75-93 yrs 39.3 28.1
Body mass index, mean (SD), kg/m2 28.3 (5.8) 28.7 (5.5) 0.056 Obesity status, %
BMI<25 30.2 27.4 0.107 BMI=25-29 36.7 37.7 BMI>=30 33.1 34.9
Race/ethnicity, % White 44.5 36.1 <0.001 Black 25.5 28.0 Hispanic 19.1 23.9 Chinese 10.9 12.1
Study site, % 3 = 'WFU' 19.3 14.6 0.001 4 = 'COL' 16.6 17.9 5 = 'JHU' 13.4 14.7 6 = 'UMN' 15.5 17.4 7 = 'NWU' 18.5 18.7
11
8 = 'UCLA' 16.7 16.7 Country of birth, %
US-born 72.9 65.5 <0.001 Foreign-born 27.1 34.5
Education, % <High school 13.7 15.1 0.119 High school 18.3 16.3 >High school 68.0 68.6
Smoking status, % Never 51.1 55.1 0.026 Former smoker 41.2 38.4 Current smoker 7.6 6.6
Cigarette smoking, % Never 43.5 47.2 0.025 Former smoker 48.1 45.7 Current smoker 8.4 7.1
Alcohol drinking, % No 57.0 56.8 0.873 Yes 43.0 43.2
Hypertension (JNC VI (1997) CRITERIA) , % No 38.0 43.3 <0.001 Yes 62.1 56.7
Diabetes (2003 ADA FASTING CRITERIA) , % Normal 59.0 59.8 0.851 Impaired Fasting Glucose 20.9 20.3 Untreated and treated diabetes 20.2 19.9
Heart attack (Myocardial infarction) , % No 97.9 98.0 0.715 Yes 2.2 2.0
Self-reported asthma, % No 96.6 96.3 0.170 Yes 3.1 3.7 Don't know 0.2 0.1
Self-reported emphysema/chronic obstructive pulmonary disease (COPD) , %
No 97.0 98.2 0.028 Yes 2.5 1.6
12
Don't know 0.5 0.2 Self-reported doctor-diagnosed sleep apnea at exam 2, %
No 95.2 95.8 0.530 Yes 3.7 3.1
Don't know 1.2 1.1 Note: t-test for continuous variables and Chi-square test for categorical variables.
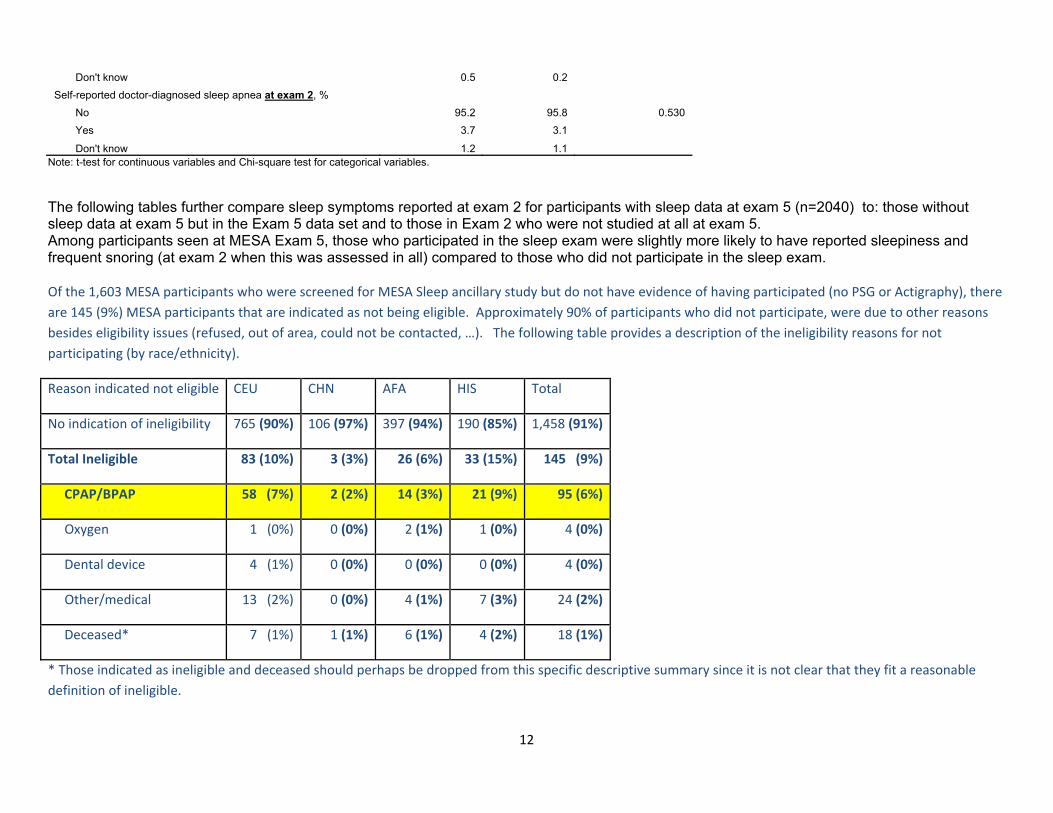
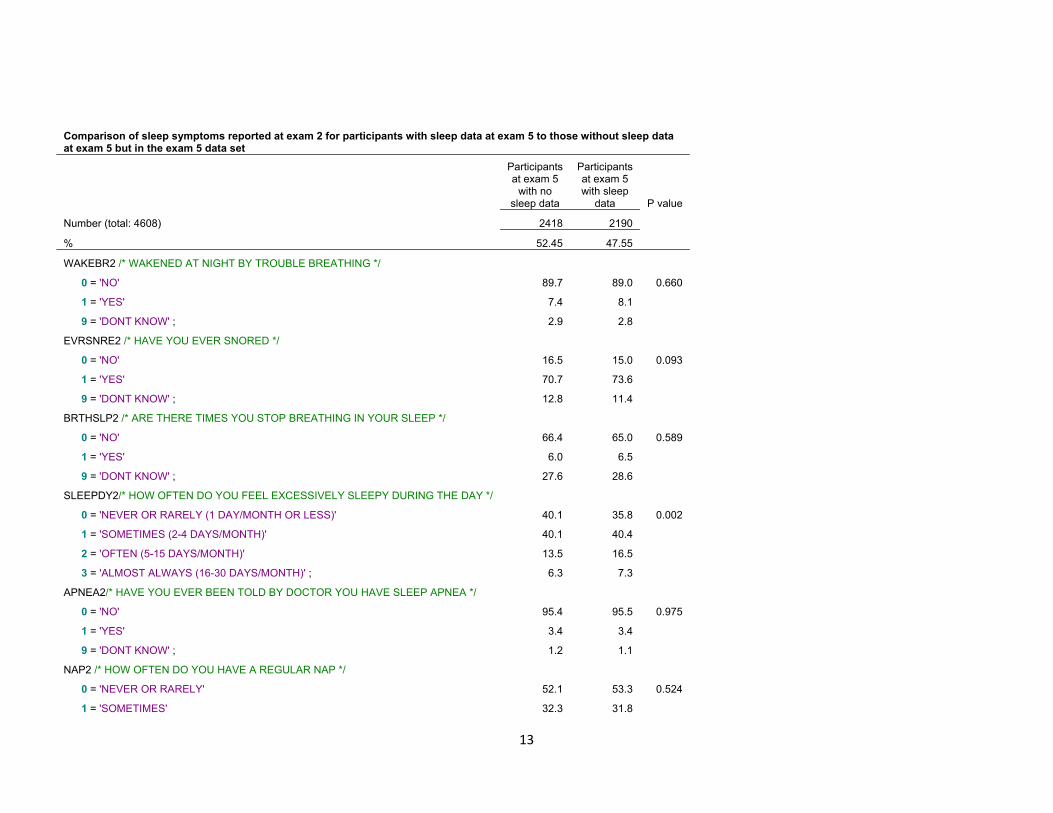
The following tables further compare sleep symptoms reported at exam 2 for participants with sleep data at exam 5 (n=2040) to: those without sleep data at exam 5 but in the Exam 5 data set and to those in Exam 2 who were not studied at all at exam 5. Among participants seen at MESA Exam 5, those who participated in the sleep exam were slightly more likely to have reported sleepiness and frequent snoring (at exam 2 when this was assessed in all) compared to those who did not participate in the sleep exam. Of the 1,603 MESA participants who were screened for MESA Sleep ancillary study but do not have evidence of having participated (no PSG or Actigraphy), there are 145 (9%) MESA participants that are indicated as not being eligible. Approximately 90% of participants who did not participate, were due to other reasons besides eligibility issues (refused, out of area, could not be contacted, …). The following table provides a description of the ineligibility reasons for not participating (by race/ethnicity).
Reason indicated not eligible CEU CHN AFA HIS Total
No indication of ineligibility 765 (90%) 106 (97%) 397 (94%) 190 (85%) 1,458 (91%)
Total Ineligible 83 (10%) 3 (3%) 26 (6%) 33 (15%) 145 (9%)
CPAP/BPAP 58 (7%) 2 (2%) 14 (3%) 21 (9%) 95 (6%)
Oxygen 1 (0%) 0 (0%) 2 (1%) 1 (0%) 4 (0%)
Dental device 4 (1%) 0 (0%) 0 (0%) 0 (0%) 4 (0%)
Other/medical 13 (2%) 0 (0%) 4 (1%) 7 (3%) 24 (2%)
Deceased* 7 (1%) 1 (1%) 6 (1%) 4 (2%) 18 (1%)
* Those indicated as ineligible and deceased should perhaps be dropped from this specific descriptive summary since it is not clear that they fit a reasonable definition of ineligible.
13
Comparison of sleep symptoms reported at exam 2 for participants with sleep data at exam 5 to those without sleep data at exam 5 but in the exam 5 data set
Participants at exam 5
with no sleep data
Participants at exam 5 with sleep
data P value
Number (total: 4608) 2418 2190
% 52.45 47.55
WAKEBR2 /* WAKENED AT NIGHT BY TROUBLE BREATHING */
0 = 'NO' 89.7 89.0 0.660
1 = 'YES' 7.4 8.1
9 = 'DONT KNOW' ; 2.9 2.8
EVRSNRE2 /* HAVE YOU EVER SNORED */
0 = 'NO' 16.5 15.0 0.093
1 = 'YES' 70.7 73.6
9 = 'DONT KNOW' ; 12.8 11.4
BRTHSLP2 /* ARE THERE TIMES YOU STOP BREATHING IN YOUR SLEEP */
0 = 'NO' 66.4 65.0 0.589
1 = 'YES' 6.0 6.5
9 = 'DONT KNOW' ; 27.6 28.6
SLEEPDY2/* HOW OFTEN DO YOU FEEL EXCESSIVELY SLEEPY DURING THE DAY */
0 = 'NEVER OR RARELY (1 DAY/MONTH OR LESS)' 40.1 35.8 0.002
1 = 'SOMETIMES (2-4 DAYS/MONTH)' 40.1 40.4
2 = 'OFTEN (5-15 DAYS/MONTH)' 13.5 16.5
3 = 'ALMOST ALWAYS (16-30 DAYS/MONTH)' ; 6.3 7.3
APNEA2/* HAVE YOU EVER BEEN TOLD BY DOCTOR YOU HAVE SLEEP APNEA */
0 = 'NO' 95.4 95.5 0.975
1 = 'YES' 3.4 3.4
9 = 'DONT KNOW' ; 1.2 1.1
NAP2 /* HOW OFTEN DO YOU HAVE A REGULAR NAP */
0 = 'NEVER OR RARELY' 52.1 53.3 0.524
1 = 'SOMETIMES' 32.3 31.8

14
2 = 'OFTEN' 8.9 7.8
3 = 'EVERY DAY OR ALMOST EVERY DAY' ; 6.7 7.1
NPSLP2 /* I DO NOT GET ENOUGH SLEEP AT NIGHT */
0 = 'NO' 84.0 83.6 0.750
1 = 'YES' ; 16.1 16.4
NPILL2 /* I NAP DUE TO AN ILLNESS OR MEDICAL REASONS */
0 = 'NO' 97.6 97.8 0.650
1 = 'YES' ; 2.4 2.2
NPRFSH2/* I NAP BECAUSE IT MAKES ME FEEL REFRESHED IN GENERAL */
0 = 'NO' 68.9 71.1 0.091
1 = 'YES' ; 31.1 28.9
NPOTH2 /* I NAP FOR OTHER REASONS */
0 = 'NO' 91.9 91.0 0.280
1 = 'YES' ; 8.1 9.0
SNRFRQ2 /* HOW OFTEN DO YOU SNORE */
0 = 'DO NOT SNORE ANYMORE' 19.8 17.8 0.006
1 = 'SOMETIMES (UP TO 2 NIGHTS A WEEK)' 16.1 16.1
2 = 'FREQUENTLY (3-5 NIGHTS A WEEK)' 9.0 10.7
3 = 'ALWAYS OR ALMOST ALWAYS (6-7 NIGHTS A WEEK)' ; 13.0 15.9
9 = 'DON' ; 42.1 39.4
SNRLOUD2 /* HOW LOUD IS YOUR SNORING */
0 = 'DO NOT SNORE ANYMORE' 17.1 15.5 0.015
1 = 'ONLY SLIGHTLY LOUDER THAN HEAVY BREATHING' 18.9 20.8
2 = 'ABOUT AS LOUD AS TALKING' 17.2 16.6
3 = 'LOUDER THAN TALKING' 5.1 6.4
4 = 'EXTREMELY LOUD - CAN BE HEARD THROUGH A CLOSED DOOR' 2.9 4.2
9 = 'DON' ; 38.8 36.5
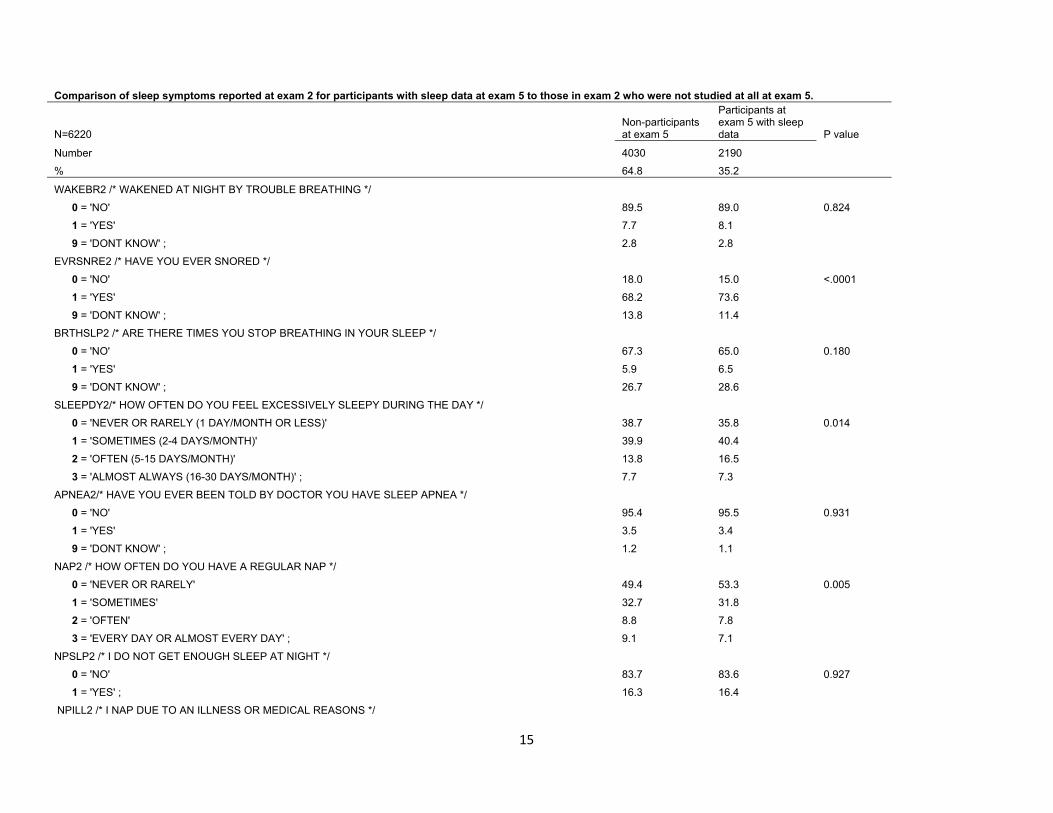
MESA EXAM 2 Participants not seen at MESA EXAM 5 vs MESA EXAM 5 Sleep Participants Comparing MESA Exam 5 Sleep participants to MESA participants seen at Exam 2 who did not participate in ANY MESA Exam 5 component, MESA Sleep Exam participants were more likely to report snoring and sleepiness compared at exam 2 compared.
15
Comparison of sleep symptoms reported at exam 2 for participants with sleep data at exam 5 to those in exam 2 who were not studied at all at exam 5.
Non-participants at exam 5
Participants at exam 5 with sleep data N=6220 P value
Number 4030 2190 % 64.8 35.2
WAKEBR2 /* WAKENED AT NIGHT BY TROUBLE BREATHING */ 0 = 'NO' 89.5 89.0 0.824 1 = 'YES' 7.7 8.1 9 = 'DONT KNOW' ; 2.8 2.8 EVRSNRE2 /* HAVE YOU EVER SNORED */ 0 = 'NO' 18.0 15.0 <.0001 1 = 'YES' 68.2 73.6 9 = 'DONT KNOW' ; 13.8 11.4 BRTHSLP2 /* ARE THERE TIMES YOU STOP BREATHING IN YOUR SLEEP */ 0 = 'NO' 67.3 65.0 0.180 1 = 'YES' 5.9 6.5 9 = 'DONT KNOW' ; 26.7 28.6 SLEEPDY2/* HOW OFTEN DO YOU FEEL EXCESSIVELY SLEEPY DURING THE DAY */ 0 = 'NEVER OR RARELY (1 DAY/MONTH OR LESS)' 38.7 35.8 0.014 1 = 'SOMETIMES (2-4 DAYS/MONTH)' 39.9 40.4 2 = 'OFTEN (5-15 DAYS/MONTH)' 13.8 16.5 3 = 'ALMOST ALWAYS (16-30 DAYS/MONTH)' ; 7.7 7.3 APNEA2/* HAVE YOU EVER BEEN TOLD BY DOCTOR YOU HAVE SLEEP APNEA */ 0 = 'NO' 95.4 95.5 0.931 1 = 'YES' 3.5 3.4 9 = 'DONT KNOW' ; 1.2 1.1 NAP2 /* HOW OFTEN DO YOU HAVE A REGULAR NAP */ 0 = 'NEVER OR RARELY' 49.4 53.3 0.005 1 = 'SOMETIMES' 32.7 31.8 2 = 'OFTEN' 8.8 7.8 3 = 'EVERY DAY OR ALMOST EVERY DAY' ; 9.1 7.1 NPSLP2 /* I DO NOT GET ENOUGH SLEEP AT NIGHT */ 0 = 'NO' 83.7 83.6 0.927 1 = 'YES' ; 16.3 16.4 NPILL2 /* I NAP DUE TO AN ILLNESS OR MEDICAL REASONS */
16
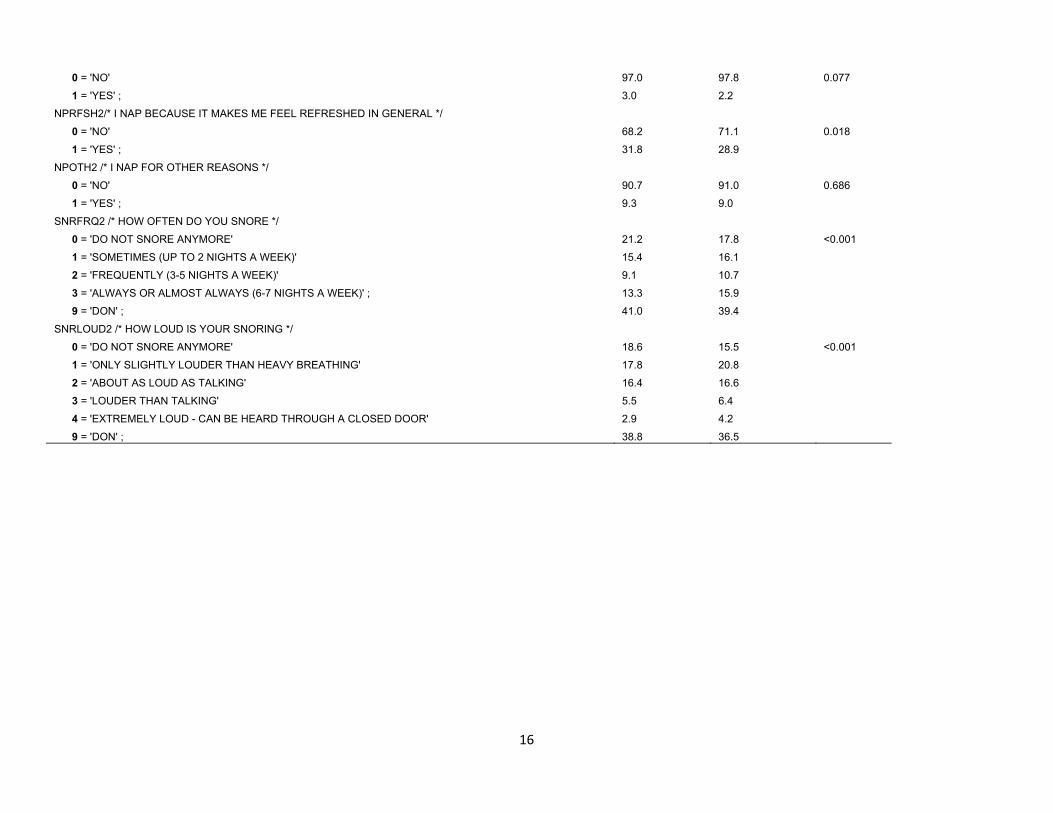
0 = 'NO' 97.0 97.8 0.077 1 = 'YES' ; 3.0 2.2 NPRFSH2/* I NAP BECAUSE IT MAKES ME FEEL REFRESHED IN GENERAL */ 0 = 'NO' 68.2 71.1 0.018 1 = 'YES' ; 31.8 28.9 NPOTH2 /* I NAP FOR OTHER REASONS */ 0 = 'NO' 90.7 91.0 0.686 1 = 'YES' ; 9.3 9.0 SNRFRQ2 /* HOW OFTEN DO YOU SNORE */ 0 = 'DO NOT SNORE ANYMORE' 21.2 17.8 <0.001 1 = 'SOMETIMES (UP TO 2 NIGHTS A WEEK)' 15.4 16.1 2 = 'FREQUENTLY (3-5 NIGHTS A WEEK)' 9.1 10.7 3 = 'ALWAYS OR ALMOST ALWAYS (6-7 NIGHTS A WEEK)' ; 13.3 15.9 9 = 'DON' ; 41.0 39.4 SNRLOUD2 /* HOW LOUD IS YOUR SNORING */ 0 = 'DO NOT SNORE ANYMORE' 18.6 15.5 <0.001 1 = 'ONLY SLIGHTLY LOUDER THAN HEAVY BREATHING' 17.8 20.8 2 = 'ABOUT AS LOUD AS TALKING' 16.4 16.6 3 = 'LOUDER THAN TALKING' 5.5 6.4 4 = 'EXTREMELY LOUD - CAN BE HEARD THROUGH A CLOSED DOOR' 2.9 4.2 9 = 'DON' ; 38.8 36.5
17
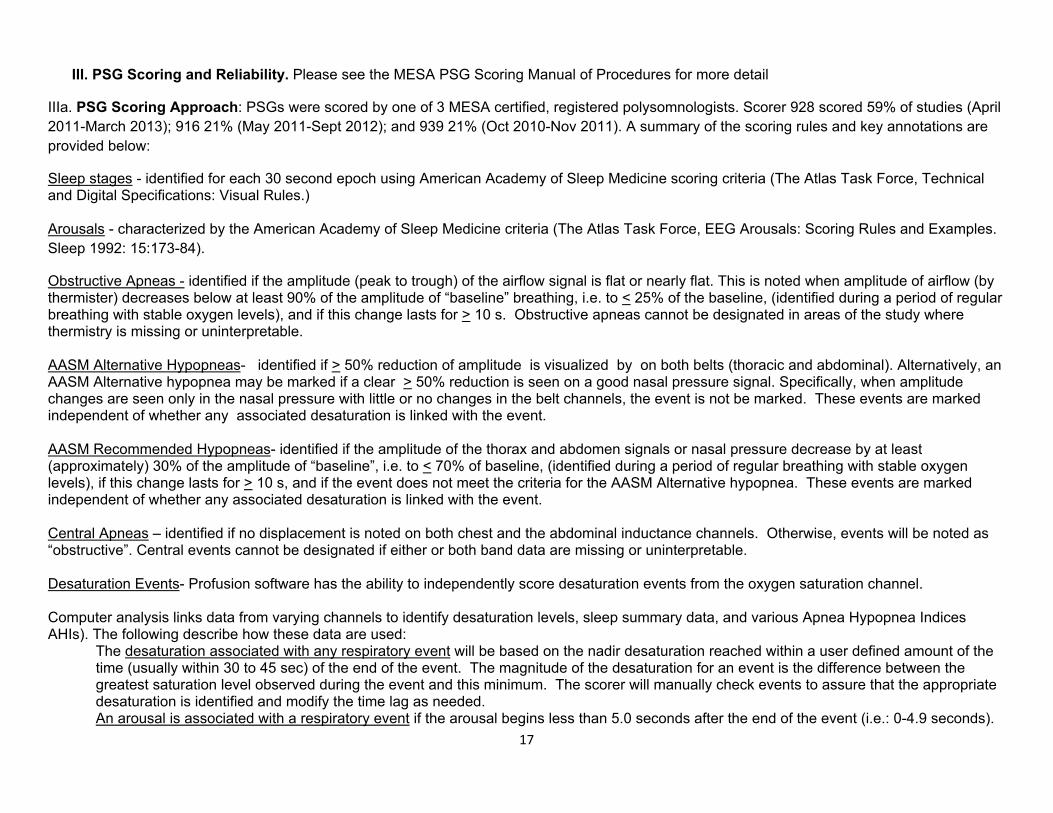
III. PSG Scoring and Reliability. Please see the MESA PSG Scoring Manual of Procedures for more detail
IIIa. PSG Scoring Approach: PSGs were scored by one of 3 MESA certified, registered polysomnologists. Scorer 928 scored 59% of studies (April 2011-March 2013); 916 21% (May 2011-Sept 2012); and 939 21% (Oct 2010-Nov 2011). A summary of the scoring rules and key annotations are provided below:
Sleep stages - identified for each 30 second epoch using American Academy of Sleep Medicine scoring criteria (The Atlas Task Force, Technical and Digital Specifications: Visual Rules.) Arousals - characterized by the American Academy of Sleep Medicine criteria (The Atlas Task Force, EEG Arousals: Scoring Rules and Examples. Sleep 1992: 15:173-84).
Obstructive Apneas - identified if the amplitude (peak to trough) of the airflow signal is flat or nearly flat. This is noted when amplitude of airflow (by thermister) decreases below at least 90% of the amplitude of “baseline” breathing, i.e. to < 25% of the baseline, (identified during a period of regular breathing with stable oxygen levels), and if this change lasts for > 10 s. Obstructive apneas cannot be designated in areas of the study where thermistry is missing or uninterpretable. AASM Alternative Hypopneas- identified if > 50% reduction of amplitude is visualized by on both belts (thoracic and abdominal). Alternatively, an AASM Alternative hypopnea may be marked if a clear > 50% reduction is seen on a good nasal pressure signal. Specifically, when amplitude changes are seen only in the nasal pressure with little or no changes in the belt channels, the event is not be marked. These events are marked independent of whether any associated desaturation is linked with the event. AASM Recommended Hypopneas- identified if the amplitude of the thorax and abdomen signals or nasal pressure decrease by at least (approximately) 30% of the amplitude of “baseline”, i.e. to < 70% of baseline, (identified during a period of regular breathing with stable oxygen levels), if this change lasts for > 10 s, and if the event does not meet the criteria for the AASM Alternative hypopnea. These events are marked independent of whether any associated desaturation is linked with the event. Central Apneas – identified if no displacement is noted on both chest and the abdominal inductance channels. Otherwise, events will be noted as “obstructive”. Central events cannot be designated if either or both band data are missing or uninterpretable. Desaturation Events- Profusion software has the ability to independently score desaturation events from the oxygen saturation channel. Computer analysis links data from varying channels to identify desaturation levels, sleep summary data, and various Apnea Hypopnea Indices AHIs). The following describe how these data are used:
The desaturation associated with any respiratory event will be based on the nadir desaturation reached within a user defined amount of the time (usually within 30 to 45 sec) of the end of the event. The magnitude of the desaturation for an event is the difference between the greatest saturation level observed during the event and this minimum. The scorer will manually check events to assure that the appropriate desaturation is identified and modify the time lag as needed. An arousal is associated with a respiratory event if the arousal begins less than 5.0 seconds after the end of the event (i.e.: 0-4.9 seconds).

18
Periodic Limb Movements- identified by a series of four or more consecutive movements lasting 0.5 to 10.0 seconds with an intermovement interval of 5 to 90 seconds. Leg movements that are exclusively associated with the termination of respiratory events are not be considered in the PLMI. Summary of Key PSG Variables (See Data Dictionary for variable names that associate with each definition and Section V for specific variable names) AHI (Apnea Hypopnea Index) is defined as the number of respiratory events (apneas and hypopneas) per hour of the sleep. Events will be included in different indices according to level of associated desaturation and/or arousal: All events (regardless of desaturation or arousal) Summary AHI values, based on events associated with > 2%, > 3%, > 4%, and
> 5% desaturation levels. Summary AHI values based on events associated with > 2%, 3%, 4%, and 5% desaturation levels or associated arousal. Summary AHI values based on events associated with arousal regardless of desaturation. Summary events only based on events meeting obstructive apnea and AASM hypopnea criteria. Time in apnea or hypopnea: Percent sleep time in apnea (obstructive or central, with at least a 3% desaturation +/- arousal). Percent sleep time in hypopnea (with at least a 3% desaturation +/- arousal). Oxygen Desaturation Profile: Percent sleep time in desaturation (<95%, <90%, <85%, <80%, <75%). Number of desaturations/hour of sleep (unlinked with respiratory events) of 2%, 3%, 4%, 5%. Average of oxygen desaturation nadirs linked to each respiratory event Average of oxygen desaturation nadirs noted from independent desaturation event markings. Sleep Architecture: Time and percent of sleep time in each sleep stage (combine Stages 3 and 4). Arousal index. Number/hour of upward stage (from deeper to lighter) shifts; wake shifts. Sleep efficiency.(sleep time/time in bed – lights off to end of study) Sleep latency (lights off to sleep onset); REM latency I (defined as time from onset of sleep to first REM). IIIb. PSG Scoring Reliability
Scorers underwent MESA-rule based training and certification prior to beginning MESA scoring and participated in regular reliability exercises that included rescoring a “standard” data set of 20 studies over the course of MESA. Both inter- and intras-corer reliability were assessed.
19
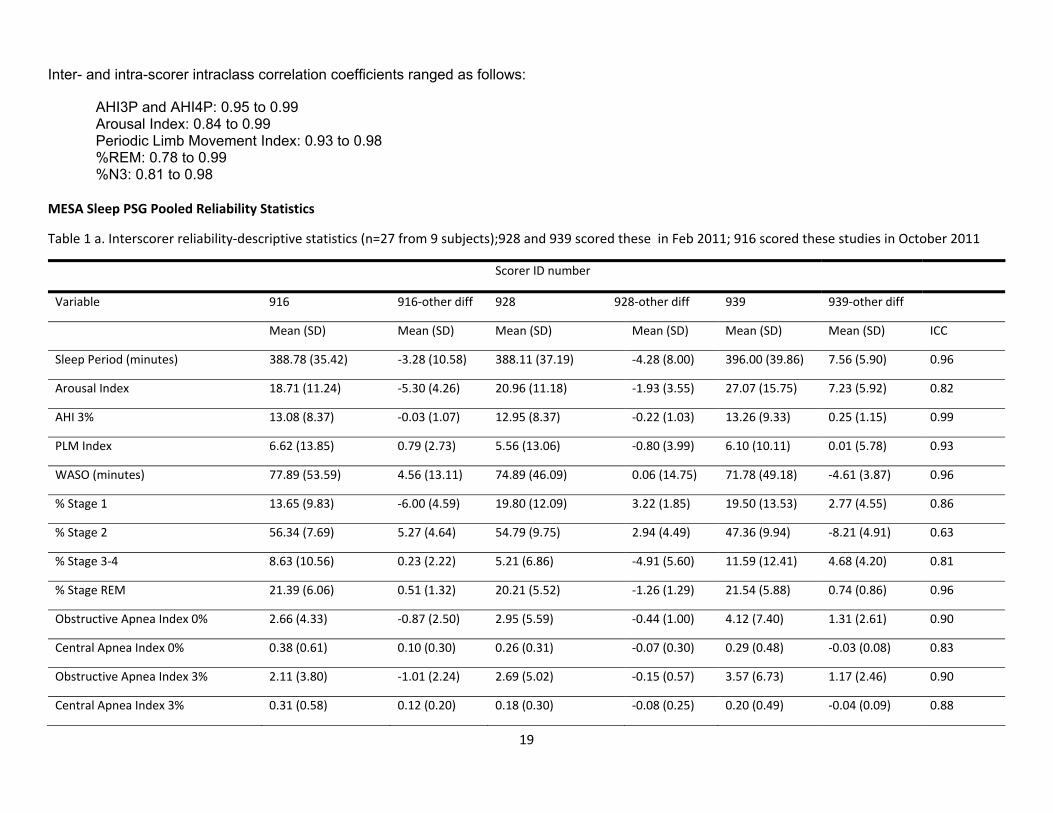
Inter- and intra-scorer intraclass correlation coefficients ranged as follows:
AHI3P and AHI4P: 0.95 to 0.99 Arousal Index: 0.84 to 0.99 Periodic Limb Movement Index: 0.93 to 0.98 %REM: 0.78 to 0.99 %N3: 0.81 to 0.98
MESA Sleep PSG Pooled Reliability Statistics
Table 1 a. Interscorer reliability‐descriptive statistics (n=27 from 9 subjects);928 and 939 scored these in Feb 2011; 916 scored these studies in October 2011
Scorer ID number
Variable 916 916‐other diff 928 928‐other diff 939 939‐other diff
Mean (SD) Mean (SD) Mean (SD) Mean (SD) Mean (SD) Mean (SD) ICC
Sleep Period (minutes) 388.78 (35.42) ‐3.28 (10.58) 388.11 (37.19) ‐4.28 (8.00) 396.00 (39.86) 7.56 (5.90) 0.96
Arousal Index 18.71 (11.24) ‐5.30 (4.26) 20.96 (11.18) ‐1.93 (3.55) 27.07 (15.75) 7.23 (5.92) 0.82
AHI 3% 13.08 (8.37) ‐0.03 (1.07) 12.95 (8.37) ‐0.22 (1.03) 13.26 (9.33) 0.25 (1.15) 0.99
PLM Index 6.62 (13.85) 0.79 (2.73) 5.56 (13.06) ‐0.80 (3.99) 6.10 (10.11) 0.01 (5.78) 0.93
WASO (minutes) 77.89 (53.59) 4.56 (13.11) 74.89 (46.09) 0.06 (14.75) 71.78 (49.18) ‐4.61 (3.87) 0.96
% Stage 1 13.65 (9.83) ‐6.00 (4.59) 19.80 (12.09) 3.22 (1.85) 19.50 (13.53) 2.77 (4.55) 0.86
% Stage 2 56.34 (7.69) 5.27 (4.64) 54.79 (9.75) 2.94 (4.49) 47.36 (9.94) ‐8.21 (4.91) 0.63
% Stage 3‐4 8.63 (10.56) 0.23 (2.22) 5.21 (6.86) ‐4.91 (5.60) 11.59 (12.41) 4.68 (4.20) 0.81
% Stage REM 21.39 (6.06) 0.51 (1.32) 20.21 (5.52) ‐1.26 (1.29) 21.54 (5.88) 0.74 (0.86) 0.96
Obstructive Apnea Index 0% 2.66 (4.33) ‐0.87 (2.50) 2.95 (5.59) ‐0.44 (1.00) 4.12 (7.40) 1.31 (2.61) 0.90
Central Apnea Index 0% 0.38 (0.61) 0.10 (0.30) 0.26 (0.31) ‐0.07 (0.30) 0.29 (0.48) ‐0.03 (0.08) 0.83
Obstructive Apnea Index 3% 2.11 (3.80) ‐1.01 (2.24) 2.69 (5.02) ‐0.15 (0.57) 3.57 (6.73) 1.17 (2.46) 0.90
Central Apnea Index 3% 0.31 (0.58) 0.12 (0.20) 0.18 (0.30) ‐0.08 (0.25) 0.20 (0.49) ‐0.04 (0.09) 0.88
20
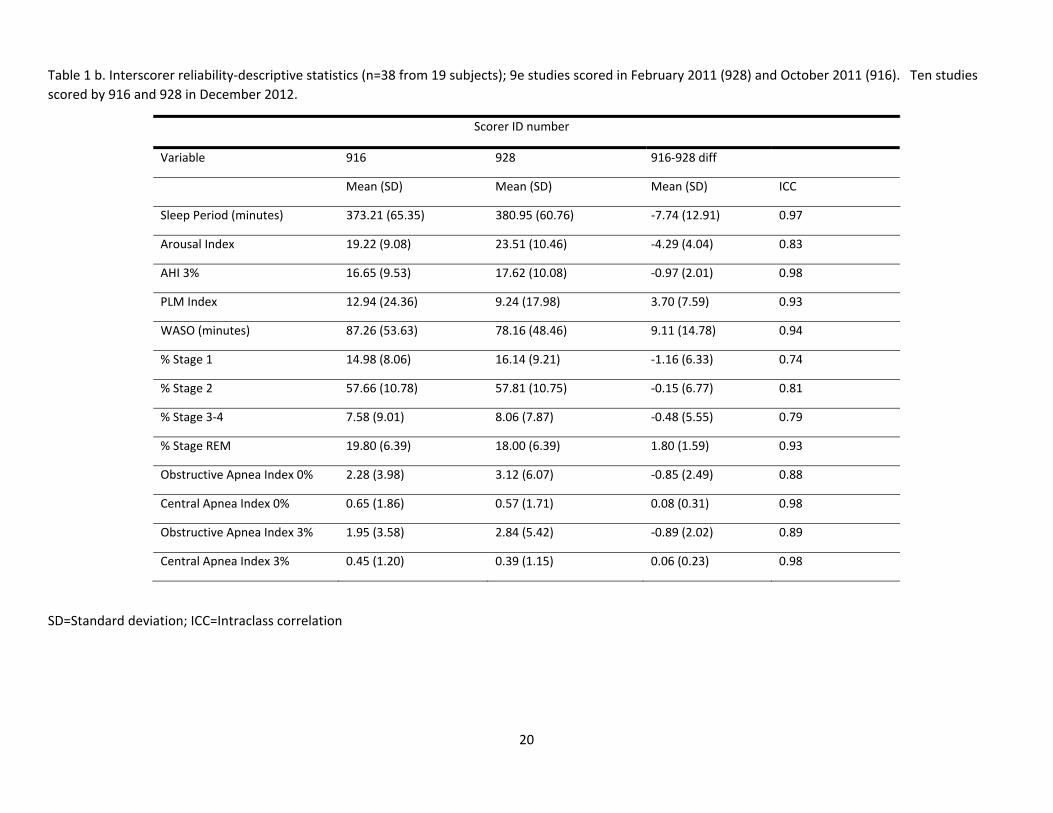
Table 1 b. Interscorer reliability‐descriptive statistics (n=38 from 19 subjects); 9e studies scored in February 2011 (928) and October 2011 (916). Ten studies scored by 916 and 928 in December 2012.
Scorer ID number
Variable 916 928 916‐928 diff
Mean (SD) Mean (SD) Mean (SD) ICC
Sleep Period (minutes) 373.21 (65.35) 380.95 (60.76) ‐7.74 (12.91) 0.97
Arousal Index 19.22 (9.08) 23.51 (10.46) ‐4.29 (4.04) 0.83
AHI 3% 16.65 (9.53) 17.62 (10.08) ‐0.97 (2.01) 0.98
PLM Index 12.94 (24.36) 9.24 (17.98) 3.70 (7.59) 0.93
WASO (minutes) 87.26 (53.63) 78.16 (48.46) 9.11 (14.78) 0.94
% Stage 1 14.98 (8.06) 16.14 (9.21) ‐1.16 (6.33) 0.74
% Stage 2 57.66 (10.78) 57.81 (10.75) ‐0.15 (6.77) 0.81
% Stage 3‐4 7.58 (9.01) 8.06 (7.87) ‐0.48 (5.55) 0.79
% Stage REM 19.80 (6.39) 18.00 (6.39) 1.80 (1.59) 0.93
Obstructive Apnea Index 0% 2.28 (3.98) 3.12 (6.07) ‐0.85 (2.49) 0.88
Central Apnea Index 0% 0.65 (1.86) 0.57 (1.71) 0.08 (0.31) 0.98
Obstructive Apnea Index 3% 1.95 (3.58) 2.84 (5.42) ‐0.89 (2.02) 0.89
Central Apnea Index 3% 0.45 (1.20) 0.39 (1.15) 0.06 (0.23) 0.98
SD=Standard deviation; ICC=Intraclass correlation
21
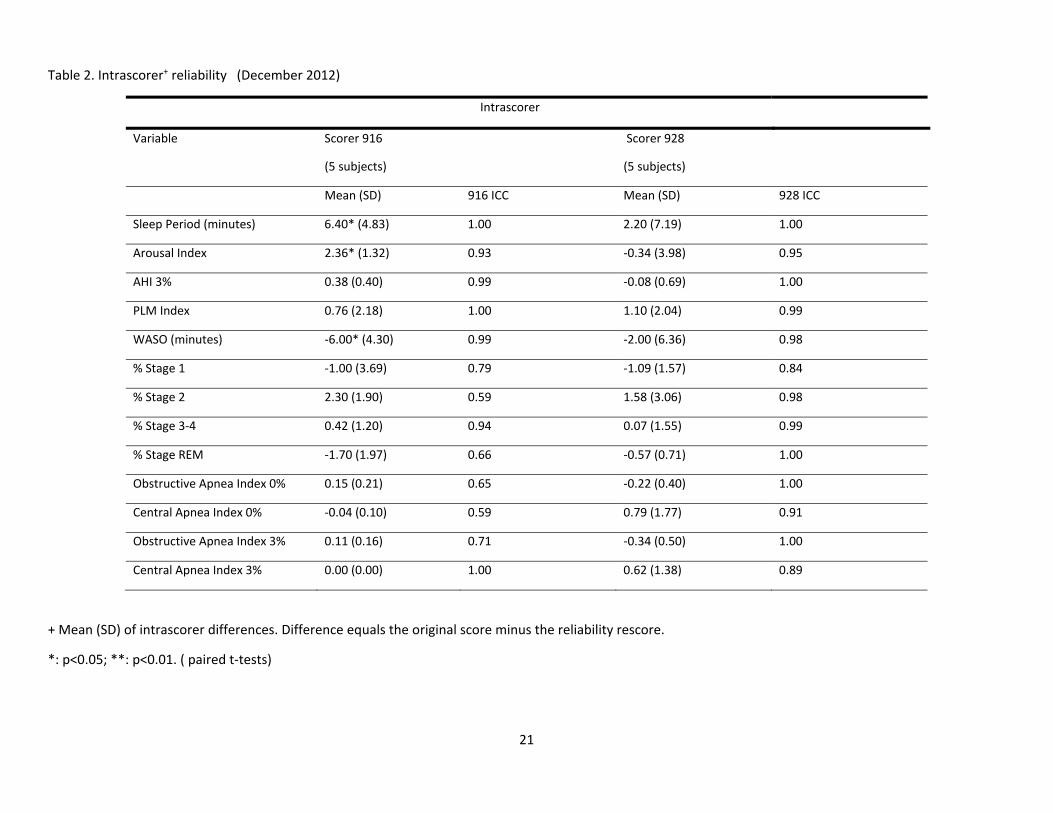
Table 2. Intrascorer+ reliability (December 2012)
Intrascorer
Variable Scorer 916
(5 subjects)
Scorer 928
(5 subjects)
Mean (SD) 916 ICC Mean (SD) 928 ICC
Sleep Period (minutes) 6.40* (4.83) 1.00 2.20 (7.19) 1.00
Arousal Index 2.36* (1.32) 0.93 ‐0.34 (3.98) 0.95
AHI 3% 0.38 (0.40) 0.99 ‐0.08 (0.69) 1.00
PLM Index 0.76 (2.18) 1.00 1.10 (2.04) 0.99
WASO (minutes) ‐6.00* (4.30) 0.99 ‐2.00 (6.36) 0.98
% Stage 1 ‐1.00 (3.69) 0.79 ‐1.09 (1.57) 0.84
% Stage 2 2.30 (1.90) 0.59 1.58 (3.06) 0.98
% Stage 3‐4 0.42 (1.20) 0.94 0.07 (1.55) 0.99
% Stage REM ‐1.70 (1.97) 0.66 ‐0.57 (0.71) 1.00
Obstructive Apnea Index 0% 0.15 (0.21) 0.65 ‐0.22 (0.40) 1.00
Central Apnea Index 0% ‐0.04 (0.10) 0.59 0.79 (1.77) 0.91
Obstructive Apnea Index 3% 0.11 (0.16) 0.71 ‐0.34 (0.50) 1.00
Central Apnea Index 3% 0.00 (0.00) 1.00 0.62 (1.38) 0.89
+ Mean (SD) of intrascorer differences. Difference equals the original score minus the reliability rescore.
*: p<0.05; **: p<0.01. ( paired t‐tests)
22
IV. Polysomnography Data Guide: Using Quality Filters
Each PSG was reviewed and scored centrally at the Sleep Reading Center with grades being given to individual signals and to the overall study quality. In addition, the scoring staff indicated if certain variables may be less reliable than others due to poor signal quality for scoring certain types of respiratory events, staging, or arousals. The Scoring manual describes in more detail the criteria involved in these scoring notes. A total of 2166 PSGs were received at the Reading Center from October of 2010 through March of 2013. There were 106 studies that failed to meet minimum criteria for passing and were not scored. A total of 2060 studies were scored but some datasets may only contain data for 2057 sleep studies. There were three participants (all from JHU) who had PSGs done but ended up not completing the MESA Exam 5. These studies (5012805, 5014123, and 019559) will be excluded from datasets that require Exam 5 data. The variables contained in the full PSG data dictionary include study quality variables obtained from the QS form and Derived Variables using the raw data to calculate key variables of interest for investigators. Many indexes have already been calculated and are available as noted in the data dictionary. A limited number of key variables have been filtered. These hard coded filters were applied to prevent invalid data from appearing in the dataset. Hard Filters Hard Filters are used to identify problem studies and/or fields where it is “invalid” to provide a raw or derived variable because of missing signal or very poor quality signal data. Listed below are descriptions of when data were eliminated from the data set due to an inability to generate specific metrics.
Data relating to specific staging variables and arousal variables will be missing when the EEG is insufficient in quality to allow distinction of stages. This will be flagged by the code slewake=1. Studies scored as “sleep wake” have all sleep stages scored using a default of “Stage 2” and no arousals are scored. There were 22 studies coded as “slewake” and staging and arousal data were removed from appropriate variables for these studies.
If time in REM = 0 (timerem) all calculations based on REM sleep time will be missing.
If lights off (lighoff) = sleep onset (scslpon) indicating participant was asleep at start of recording, or no accurate time of bed can be
determined, then sleep latency (slplatp) will be missing. QS Form – Overall Quality/Signal Quality/Scoring Notes
The QS Form was designed to provide quality code information, recognizing that the PSG studies may contribute data of different quality for specific analyses, and acknowledging that not all studies will provide “reliable” data for all measures due to loss of signals or equipment problems. The quality codes available on this form can be used as filters which can be applied when an area of analysis relates to some specific PSG/Sleep topic such as: sleep stages, respiratory index, arousals, and sleep latency. In general our approach has been to do minimal filtering of variables allowing the user to select and apply filters that best suit their needs.
23
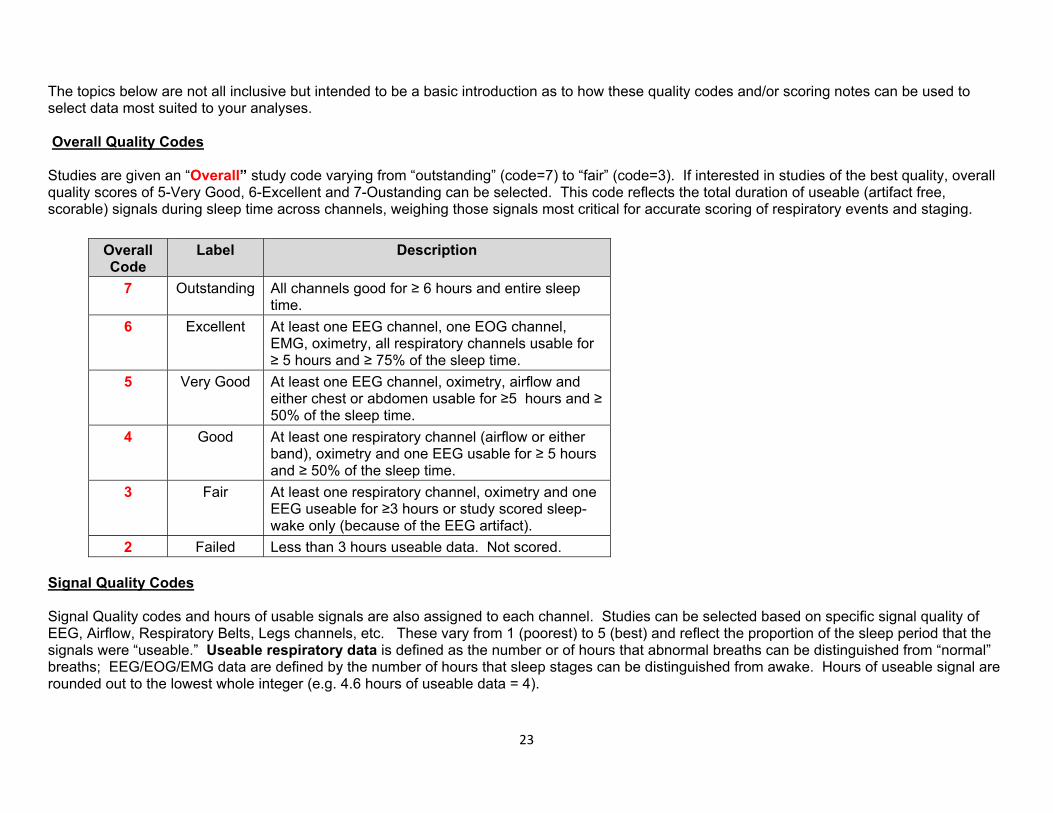
The topics below are not all inclusive but intended to be a basic introduction as to how these quality codes and/or scoring notes can be used to select data most suited to your analyses. Overall Quality Codes Studies are given an “Overall” study code varying from “outstanding” (code=7) to “fair” (code=3). If interested in studies of the best quality, overall quality scores of 5-Very Good, 6-Excellent and 7-Oustanding can be selected. This code reflects the total duration of useable (artifact free, scorable) signals during sleep time across channels, weighing those signals most critical for accurate scoring of respiratory events and staging.
Overall Code
Label Description
7 Outstanding All channels good for ≥ 6 hours and entire sleep time.
6 Excellent At least one EEG channel, one EOG channel, EMG, oximetry, all respiratory channels usable for ≥ 5 hours and ≥ 75% of the sleep time.
5 Very Good At least one EEG channel, oximetry, airflow and either chest or abdomen usable for ≥5 hours and ≥ 50% of the sleep time.
4 Good At least one respiratory channel (airflow or either band), oximetry and one EEG usable for ≥ 5 hours and ≥ 50% of the sleep time.
3 Fair At least one respiratory channel, oximetry and one EEG useable for ≥3 hours or study scored sleep-wake only (because of the EEG artifact).
2 Failed Less than 3 hours useable data. Not scored. Signal Quality Codes Signal Quality codes and hours of usable signals are also assigned to each channel. Studies can be selected based on specific signal quality of EEG, Airflow, Respiratory Belts, Legs channels, etc. These vary from 1 (poorest) to 5 (best) and reflect the proportion of the sleep period that the signals were “useable.” Useable respiratory data is defined as the number or of hours that abnormal breaths can be distinguished from “normal” breaths; EEG/EOG/EMG data are defined by the number of hours that sleep stages can be distinguished from awake. Hours of useable signal are rounded out to the lowest whole integer (e.g. 4.6 hours of useable data = 4).
24
Channels
Hours of usable signal
Signal quality
E1 (EOGL) e1dur que1 1 2 3 4 5
E2 (EOGR) e2dur que2 1 2 3 4 5
Chin ( Lchin-Cchin) chindur quchin 1 2 3 4 5
Fz-Cz fzm1dur qufzm1 1 2 3 4 5
Cz-Oz c4dur quc4 1 2 3 4 5 C4-M1 o2m1dur quo2m1 1 2 3 4 5
ECG (R ECG-L ECG) ecgdur quecg 1 2 3 4 5
Limb (Lleg- Rleg) limbdur qulimb 1 2 3 4 5
Airflow airdur quair 1 2 3 4 5
Cannula Flow xflowdur quxflow 1 2 3 4 5
Chest chestdur quChest 1 2 3 4 5
Abdo abdodur quAbdo 1 2 3 4 5
SpO2 oximdur quOxim 1 2 3 4 5
Pleth plethdur qupleth 1 2 3 4 5
CannulaSnore casndur qucasn 1 2 3 4 5
Scoring Notes The scoring notes section of the QS Form can be used to provide additional quality information about studies that posed specific problems with staging or arousals that may not have been identified by QA grades. These notes also indicate if the total sleep period was not captured due to signal loss or other recording issues such as the participant being asleep when the recording turned on or was still sleeping when the recording shut down. Using the Quality Codes and Scoring notes as Filters Examples of how these quality codes and scoring notes can be used as filters for some of the key sleep variables are given below. Potential Use Filter that can be applied to
restrict Description
Identify studies where sleep latency or sleep duration measures are of interest
RecBeAw=0 LosBeg=0 LosEnd=0 LosOther=0.
These variables identify studies where participant was asleep before recording began, study ended in sleep, or signal loss shortened time of sleep period. A “0” code indicates full night of sleep captured.
Code for signals quality:
5 = Entire sleep time (>95%)
4 = 75‐94% of sleep time
25
(1494 of 2060 full night) Identify studies where sleep stages are most reliably scored
WakSlePr = 0 Stg1Stg2Pr = 0 Stg2Stg3Pr = 0 RemNRemPr = 0
These variables identify studies where the scorer felt that underlying signals made accurate distinction for specific sleep transitions suboptimal. Note that these studies were staged and the staging data may be used although it is possible there is some misclassification. WakSlePr (sleep-wake transitions) – 222 coded 1 Stg1Stg2Pr (stage1-2 transitions) – 153 coded 1 Stg2Stg3Pr (stage2-3 transitions) – 548 coded 1 RemNRemPr (stage rem-nrem transitions) – 401 coded 1
Identify studies where arousals are most reliably scored
ArUnrel =0 RemArUnrel = 0
ArUnrel identifies studies where underlying artifact of background EEG made distinguishing arousals difficult (474 coded 1) RemArUnrel identifies studies where EMG signal problems made scoring arousals in REM difficult (333 coded 1) These restricting filters can also be used for RDI/AHI variables that count events linked to arousals.
Identify studies where distinguishing respiratory event subtypes is of greatest reliability
QuAir = 3, 4, 5 Quxflow = 3, 4, 5 QuAbdo = 3, 4, 5 QuChest = 3, 4, 5 R RespEvPr =0 ApnHypPr =0.
The “Qu—“ grades use a scale of 1 to 5 which are applied to each signal to grade the proportion of sleep time that the signal was easily scorable and mostly artifact free. Signals with grades 1 or 2 mean that the signal was of poor quality for as much as 50% of the sleep period. Since apneas require a good thermistry signal, the QuAir =1 or =2 identifies studies where apnea vs hypopnea distinction is unreliable. Since central apneas require visualization of effort on two bands, the QuAbdo and QuChest =1 or =2 identifies studies where central events may be poorly distinguished from obstructives. RespEvPr (136) and ApnHypPr (576) also provide information on the overall ability of the scorer to detect respiratory evens and to distinguish Apnea vs Hypopnea events, respectively.
Interest in reliable oxygen saturation
QuOxim 4-5 (2014 studies) QuOxim 3 ( 39 studies) QuOxim 2 ( 6 studies) QuOxim 1 ( 1 studies)
QuOxim values of 1 or 2 identifies oximetry data that were poor for as much as 50% of sleep time. Only seven studies were noted to have oximetry quality of 2 or 1.
Interest in Positional dependency
Posn=0 (reliable) If interested in positional dependency select studies with Posn=0. Posn=1 (6 studies) indicates position sensor not working or unreliable based on scorer assessment and/or technician comments.

26
V. Key Polysomnography Variables
Va. Approach to choosing PSG Variables: There are numerous derivations made using PSG data. When approaching analysis, one needs to decide what exposures/domains are most relevant to the hypothesis; which variables are best understood clinically; which are most reliably measured. Then one needs to decide whether interest is in analysis of a continuously measured variable, dichotomy, or categorical. The following provides a general guideline. However, approaches will vary according to specific analytical plan and hypothesis.
Frequency of Respiratory Disturbances (Apnea (central or obstructive) and Hypopneas)
The Apnea Hypopnea Index (AHI), referred to in the older literature as RDI (Respiratory Disturbance Index) is the chief metric used to quantify sleep apnea. It is simply a count, averaged over sleep hours, of apneas (total or near total cessations in breathing) and hypopneas (partial reductions in breathing), or apneas alone. Numerous variations of this index can be derived by only counting hypopneas with threshold levels of desaturation (most commonly either >= 3% or >=4%) or also allowing associated cortical arousals to “flag” a hypopnea (ie, not requiring associated desaturation). One could also derive indices that are purely using obstructive events (obstructive apneas plus hypopneas) or all events (also including central apneas). Recommended indices (see definitions in table):
AHI4P: This corresponds to current definitions used by Medicare for reimbursement and includes all apneas plus hypopneas with a >=4% desaturation. If clinical cutoffs rather than distributional ones are used, recommend <5; 5-15; 15-30; and >30. For mild to moderate OSA: >15; for severe OSA>30. Sometimes referred to as “Medicare definition”
AHI3PA: This is a more inclusive definition that requires less desaturation and also allows events to be identified on the basis of an associated arousal. Although the mean is higher, the same clinical cutoffs are used (clinically).
AHI4PA: This is similar to the AHI4P definition, but also includes hypopneas with 4% desaturation OR arousal.
RDI3P/RDI4P: These definitions require all events- central apneas, obstructive apneas and hypopneas to be linked to a 3% (RDI3P) or 4% (RDI4P) desaturation and are the same definitions as used in most Sleep Heart Health Study papers.
OAHI4P: This is similar to the AHI4P but does not include central apneas. When the interest is with obstructive sleep apnea without an influence of central events, this measure should be considered.
CAI0: Central Apnea Index: This includes all central apneas. It can be used with central sleep apnea or Cheyne Stokes Breathing is of interest. More severe central sleep apnea can be indexed by requiring events with 4% desaturation (CAI4). Levels of > 5 are considered abnormal.
Sleep Efficiency
27
Slp_eff: Sleep efficiency: refers to ability to stay asleep during the sleep period. Sleep Efficiency is a sum of sleep latency (time after “lights off” to sleep onset) plus wake after sleep onset. In unattended settings like MESA, sleep latency can be difficult to estimate (from questionnaire) so sleep maintenance efficiency (slp_maint_eff) may be a more accurate measure of problems with sleep continuity in MESA.
Sleep Architecture
Sleep architecture refers to the distribution of sleep stages and arousal frequency. These can be measured with percentage time in each sleep stage (times34p; timses1p; times2p; timeremp) and the Arousal Index (see below). Decreased slow wave sleep (times34p) and rem sleep (timesremp) and increased arousal index are markers for “lighter” sleep and have been implicated in hypertension, cardiac disease or cognitive/mood problems.
Periodic Limb Movements: Measure the frequency per hour of periodic leg movements. Avgplm provides a count of all PLMs/hr sleep and avgplma gives a count per hr of sleep of leg movements with arousals. Most literature indicates that leg movements with arousals are more strongly associated with hypertension and disrupted sleep than are the overall PLM index (PLMI). An overall PLMI >5 is considered abnormal although very common in the elderly; therefore a PLMI > 15 often used as a dichotomy. A PLMI with arousal is less frequent, so a threshold of 5 may be reasonable to use in MESA to identify increase in PLMS that disrupt sleep.
Vb. Transformations of Skewed Variables
A number of key sleep-related variables are highly skewed, and are often log transformed for analysis. The following provides distributions for key PSG variables:
Quartiles for Key PSG variables Q2 Q3 Q4 Variable 0% 25% 50% 75% 100%
ahi4pa AHI: All obstructive apneas, all central apneas, and hypopneas with a >=4% desat or arousal/hour of sleep (Also referred to as “AASM AHI”) 0.00 7.10 14.51 27.39 104.25
ahi4p AHI: All obstructive apneas, all central apneas, and hypopneas with a >=4% desat/hrsleep (Also referred to as “Medicare AHI”) 0.00 3.22 8.80 19.48 102.91
pctlt90 Calculated ‐ pct sleep time < 90% desat 0.00 0.04 0.62 3.24 99.90
avgsat Calculated ‐ avg SaO2 in sleep 76.60 93.37 94.77 95.53 98.02
minsat PSG Report: Calculated ‐ min SaO2 in sleep 40.00 80.00 85.00 89.00 96.00
timeremp Calculated ‐ pct sleep time in REM 0.00 13.80 18.30 22.40 58.60
28
times34p Calculated – pct sleep time stage 3‐4 (N3) 0.00 2.04 8.12 15.50 51.30
timest1p Calculated – pct sleep time stage 1 (N1) 0.47 8.33 12.10 17.80 79.30
timest2p Calculated – pct sleep time stage 2 (N2) 18.70 51.40 58.10 64.30 90.90
slp_eff Calculated ‐ sleep efficiency %: % sleep period spent asleep 9.02 68.67 78.16 85.34 98.38
slptime PSG QS: Sleep Time (minutes) 32.00 312.00 368.00 416.00 601.00
slp_maint_eff PSG: Sleep Maintenance Efficiency: % sleep time asleep after sleep onset 10.60 73.33 82.21 89.17 98.96
rdi3p Calculated – central and obstructive apneas, plus hypopnea, each with >= 3% desaturation/hr sleep 0.00 5.90 13.77 27.48 110.78
rdi3pa Calculated – central and obstructive apneas, plus hypopnea, each with >= 3% or desaturation or arousal/hr sleep 0.00 9.26 17.98 32.79 111.62
rdi4p Calculated – central and obstructive apneas, plus hypopnea, each with >= 4% desaturation/hr sleep 0.00 2.66 7.75 18.36 102.24
rdi4pa Calculated – central and obstructive apneas, plus hypopnea, each with >= 4% desaturation or arousal/hr sleep 0.00 6.80 14.02 26.39 103.91
rdinr3p Calculated – central and obstructive apneas, plus hypopnea, each with >= 3% desaturation/hr Non‐Rem sleep 0.00 3.40 9.69 24.57 113.76
rdinr4p Calculated – central and obstructive apneas, plus hypopnea, each with >= 4% desaturation/hr Non sleep 0.00 1.29 4.75 15.32 104.77
rdirem3p Calculated – central and obstructive apneas, plus hypopnea, each with >= 3% desaturation/hr REM sleep 0.00 10.35 25.25 45.71 122.34
rdirem4p Calculated – central and obstructive apneas, plus hypopnea, each with >= 4% desaturation/hr REM sleep 0.00 4.19 15.67 35.77 120.00
cai0p Calculated – all central apneas/hr sleep (regardless of desat) (Central Apnea Index) 0.00 0.00 0.00 0.29 49.63
cai4p Calculated ‐ central apneas with a >= 4% desat/hr sleep (Central Apnea Index‐4%) 0.00 0.00 0.00 0.14 48.34
Oahi3 Calculated – All obstructive apnea (all desats) plus Hypopnea >= 3% desat)/hr sleep 0.00 6.09 13.89 27.32 111.12
oahi3pa Calculated ‐ All obstructive apnea (all desats) plus Hypopnea >= 3% desat or arousal)/hr sleep
0.00 9.24 17.72 32.32 111.79
oahi4pa Calculated ‐ All obstructive apnea (all desats) plus Hypopnea >= 4% desat or arousal)/hr sleep
0.00 6.89 14.13 26.56 104.08
ai_all Calculated – arousals/hr sleep (Arousal Index) 1.75 13.81 19.81 28.02 97.72
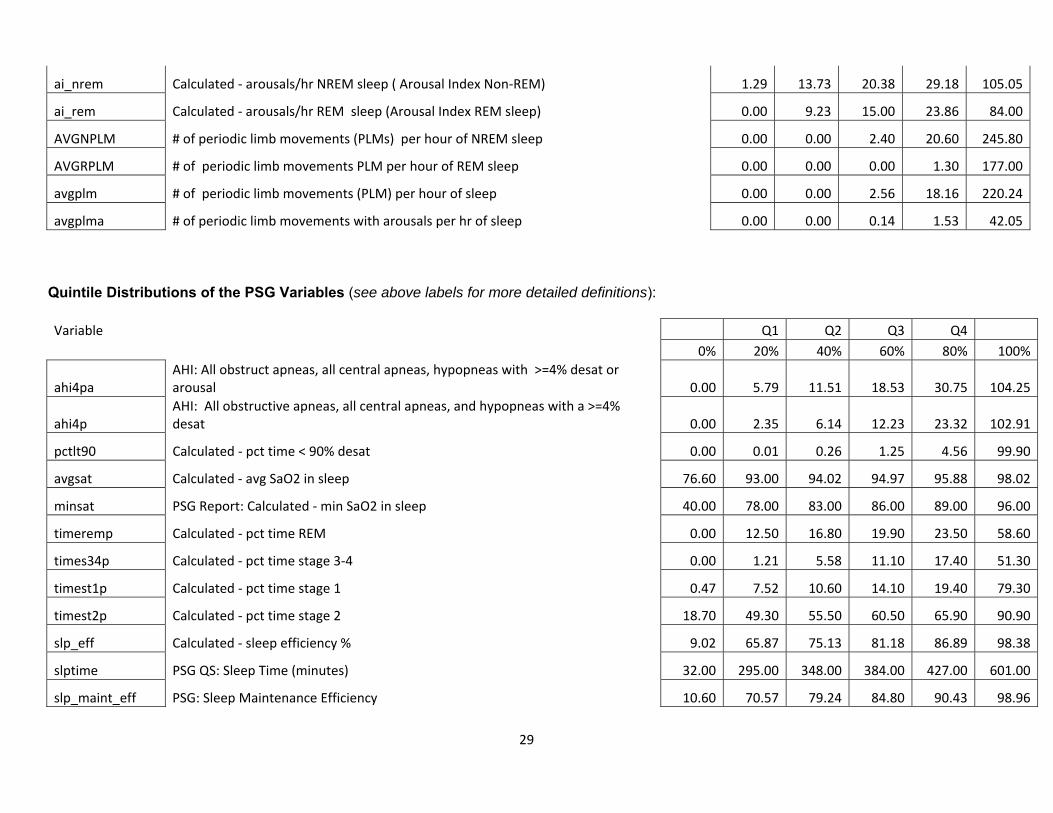
29
ai_nrem Calculated ‐ arousals/hr NREM sleep ( Arousal Index Non‐REM) 1.29 13.73 20.38 29.18 105.05
ai_rem Calculated ‐ arousals/hr REM sleep (Arousal Index REM sleep) 0.00 9.23 15.00 23.86 84.00
AVGNPLM # of periodic limb movements (PLMs) per hour of NREM sleep 0.00 0.00 2.40 20.60 245.80
AVGRPLM # of periodic limb movements PLM per hour of REM sleep 0.00 0.00 0.00 1.30 177.00
avgplm # of periodic limb movements (PLM) per hour of sleep 0.00 0.00 2.56 18.16 220.24
avgplma # of periodic limb movements with arousals per hr of sleep 0.00 0.00 0.14 1.53 42.05
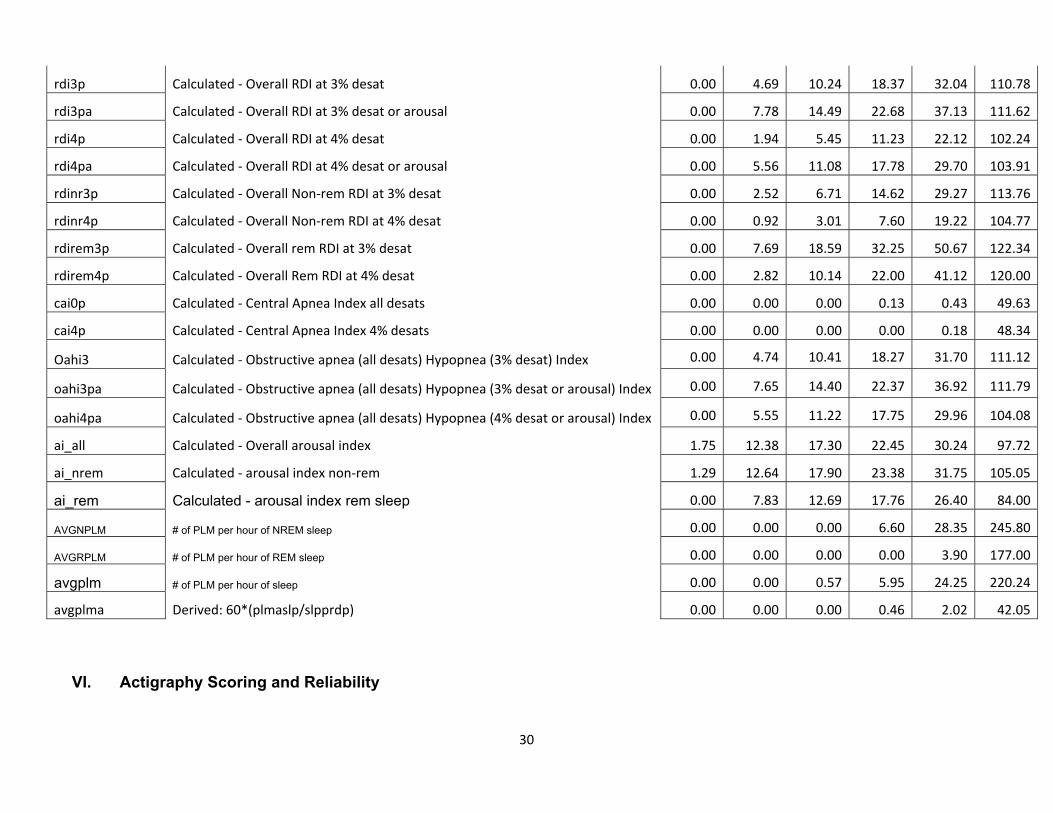
Quintile Distributions of the PSG Variables (see above labels for more detailed definitions): Variable Q1 Q2 Q3 Q4
0% 20% 40% 60% 80% 100%
ahi4pa AHI: All obstruct apneas, all central apneas, hypopneas with >=4% desat or arousal 0.00 5.79 11.51 18.53 30.75 104.25
ahi4p AHI: All obstructive apneas, all central apneas, and hypopneas with a >=4% desat 0.00 2.35 6.14 12.23 23.32 102.91
pctlt90 Calculated ‐ pct time < 90% desat 0.00 0.01 0.26 1.25 4.56 99.90
avgsat Calculated ‐ avg SaO2 in sleep 76.60 93.00 94.02 94.97 95.88 98.02
minsat PSG Report: Calculated ‐ min SaO2 in sleep 40.00 78.00 83.00 86.00 89.00 96.00
timeremp Calculated ‐ pct time REM 0.00 12.50 16.80 19.90 23.50 58.60
times34p Calculated ‐ pct time stage 3‐4 0.00 1.21 5.58 11.10 17.40 51.30
timest1p Calculated ‐ pct time stage 1 0.47 7.52 10.60 14.10 19.40 79.30
timest2p Calculated ‐ pct time stage 2 18.70 49.30 55.50 60.50 65.90 90.90
slp_eff Calculated ‐ sleep efficiency % 9.02 65.87 75.13 81.18 86.89 98.38
slptime PSG QS: Sleep Time (minutes) 32.00 295.00 348.00 384.00 427.00 601.00
slp_maint_eff PSG: Sleep Maintenance Efficiency 10.60 70.57 79.24 84.80 90.43 98.96
30
rdi3p Calculated ‐ Overall RDI at 3% desat 0.00 4.69 10.24 18.37 32.04 110.78
rdi3pa Calculated ‐ Overall RDI at 3% desat or arousal 0.00 7.78 14.49 22.68 37.13 111.62
rdi4p Calculated ‐ Overall RDI at 4% desat 0.00 1.94 5.45 11.23 22.12 102.24
rdi4pa Calculated ‐ Overall RDI at 4% desat or arousal 0.00 5.56 11.08 17.78 29.70 103.91
rdinr3p Calculated ‐ Overall Non‐rem RDI at 3% desat 0.00 2.52 6.71 14.62 29.27 113.76
rdinr4p Calculated ‐ Overall Non‐rem RDI at 4% desat 0.00 0.92 3.01 7.60 19.22 104.77
rdirem3p Calculated ‐ Overall rem RDI at 3% desat 0.00 7.69 18.59 32.25 50.67 122.34
rdirem4p Calculated ‐ Overall Rem RDI at 4% desat 0.00 2.82 10.14 22.00 41.12 120.00
cai0p Calculated ‐ Central Apnea Index all desats 0.00 0.00 0.00 0.13 0.43 49.63
cai4p Calculated ‐ Central Apnea Index 4% desats 0.00 0.00 0.00 0.00 0.18 48.34
Oahi3 Calculated ‐ Obstructive apnea (all desats) Hypopnea (3% desat) Index 0.00 4.74 10.41 18.27 31.70 111.12
oahi3pa Calculated ‐ Obstructive apnea (all desats) Hypopnea (3% desat or arousal) Index 0.00 7.65 14.40 22.37 36.92 111.79
oahi4pa Calculated ‐ Obstructive apnea (all desats) Hypopnea (4% desat or arousal) Index 0.00 5.55 11.22 17.75 29.96 104.08
ai_all Calculated ‐ Overall arousal index 1.75 12.38 17.30 22.45 30.24 97.72
ai_nrem Calculated ‐ arousal index non‐rem 1.29 12.64 17.90 23.38 31.75 105.05
ai_rem Calculated - arousal index rem sleep 0.00 7.83 12.69 17.76 26.40 84.00
AVGNPLM # of PLM per hour of NREM sleep 0.00 0.00 0.00 6.60 28.35 245.80
AVGRPLM # of PLM per hour of REM sleep 0.00 0.00 0.00 0.00 3.90 177.00
avgplm # of PLM per hour of sleep 0.00 0.00 0.57 5.95 24.25 220.24
avgplma Derived: 60*(plmaslp/slpprdp) 0.00 0.00 0.00 0.46 2.02 42.05
VI. Actigraphy Scoring and Reliability
31
See the MESA Actigraphy Scoring Manual and MESA Actigraphy Collection Manual for details.
Studies were scored if containing 4 weekdays and 1 weekend days of acceptable data. Records were judged for acceptability and scored by a certified technician using an event marker, self-completed sleep diary information and data on light and “wrist off” to annotate the records. Summary data on average weekly sleep duration and sleep maintenance efficiency were generated.
First, the sleep period is marked manually. Start of the “rest” period is identified when the event marker indicated sleep onset; or if not available or consistent with the observed activity counts, then based on a sleep diary indication of sleep onset; or if not available or consistent based on decline in recorded light levels. If none of these markers occurred within 15 minutes of decline in activity counts, then sleep onset is identified solely on the basis of the automated weighted average of activity counts (see below). Similarly, the sleep interval end time is determined by locating where the activity count significantly increased and was again compared to the event marker, sleep journal wake time, and light level increase for reliability.
After identifying the rest period, the actigraphic data are automatically scored in 30 second epochs as sleep or wake using the Actiware-Sleep® v. 5.59 analysis software (Mini Mitter Co., Inc.). This device uses a validated algorithm in which activity counts recorded during the measured epoch are analyzed in relationship to the level of activity in the surrounding 2-min time period (i.e. ±2 min) to yield the final activity count for each epoch (Oakley NR. Validation with polysomnography of the Sleepwatch sleep/wake scoring algorithm used by the Actiwatch activity monitoring system. Technical Report to Mini Mitter Co., Inc.. 1997). The weighted activity value is constructed based on 9 epochs (the epoch of interest as well as 4 preceding/following). The sleep/wake determination is then made based on this value for each individual epoch (< 40 = sleep, >=40 = wake). Sleep onset is determined based on “5 minutes of immobile time” (9/10 epochs with activity counts <2). Sleep offset is identified as the last epoch within the rest interval that met the activity criterion for sleep by the weighted activity algorithm. . To determine the reliability of sleep interval start time, the time at which the activity count significantly drops off was located. This activity drop off time was compared to the event marker, sleep journal bed time, and light level decrease. If at least 2 of the 3 associated markers were within 15 minutes of the activity count drop off, it was considered reliable. If the event marker was reliable, it was used as the sleep interval start time. If not, the sleep journal time was used. If the event marker and sleep journal were unreliable, the time the light levels decreased was used. If no associated markers were reliable, the time of the activity count drop off was used as the sleep interval start time.
Reliability
Two scorers scored MESA actigraphy studies. Intra-scorer reliability (scorer 941 assessed between 2011 and 2012; n=19) for average sleep duration, sleep efficiency, and WASO were 0.91, 0.97, and 0.91. Excluding one severe outlier, the interscorer reliability for these 3 variables were: 0.90 0.96, and 0.91.
32
VII. Actigraphy Data Guide
The following describes some of the key quality and result variables derived from the MESA Sleep actigraphy data collection and data scoring. Each actigraphy study was reviewed and scored centrally at the Sleep Reading Center, with grades being given to individual signals and to the overall study quality. More data about the actigraphy device itself and the data collection procedures used in MESA Sleep may be found in the Manual of Procedures.
In this document, variable names that exist in the MESA Sleep dataset are noted with a special styling, e.g. variable-name. The quality variables below are often used to filter studies of a higher quality for specific analyses and the key result variables described in this document represent the data that are likely to be of primary interest to most investigators. The full set of variables are described in the MESA Sleep data dictionary.
VIIa. Study Quality Variables Overall study quality was graded by the scorer and is captured in the actquality5 variable. This variable was assessed on the following scale:
2. Poor – ≤ 50% of nights have reliable sleep latency and overnight data associated with it. 3. Fair – ≥ 50% of nights have reliable sleep latency and overnight data associated with it. Less than 2 data markers (Sleep Diary, Event
Marker, or Light Level) are consistent with data. 4. Good – ≥ 50% of nights have reliable sleep latency and overnight data associated with it. At least 2 data markers (Sleep Diary, Event
Marker, or Light Levels) are consistent with data. 5. Very Good – ≥ 75% of nights have reliable sleep latency and overnight data associated with it. Less than 2 data markers (Sleep Diary, Event
Marker, or Light Levels) are consistent with data. 6. Excellent – ≥ 75% of nights have reliable sleep latency and overnight data associated with it. At least 2 data markers (Sleep Diary, Event
Marker, or Light Levels) are consistent with data. 7. Outstanding – All nights have reliable sleep latency and overnight data associated with it. All data markers (Sleep Diary, Event Marker, and
Light Levels) are consistent with data.
The overall study quality grade was highly dependent on the completeness and quality of the self-reported sleep diary, so low scores for actquality5 do not necessarily reflect on the quality of the raw actigraphy data. All scored data may be used in primary analyses with consideration of using the codes to identify the highest quality studies for sensitivity studies.
VIIb. Key Result Variables Following variables are ones identified to be of key interest in most analysis of actigraphy data.
Note: As of June 2014, a new set of actigraphy variables were released that should take precedence over the previously released variables. In most instances, the values for these key concepts will be the same for the old and new variables. The new variables were generated directly from the epoch‐by‐epoch actigraphy
33
data and were further broken down by weekday days (M‐F), weekend days (Saturday‐Sunday), workdays (self‐report), non‐workdays (self‐report), and reliable days (see above).
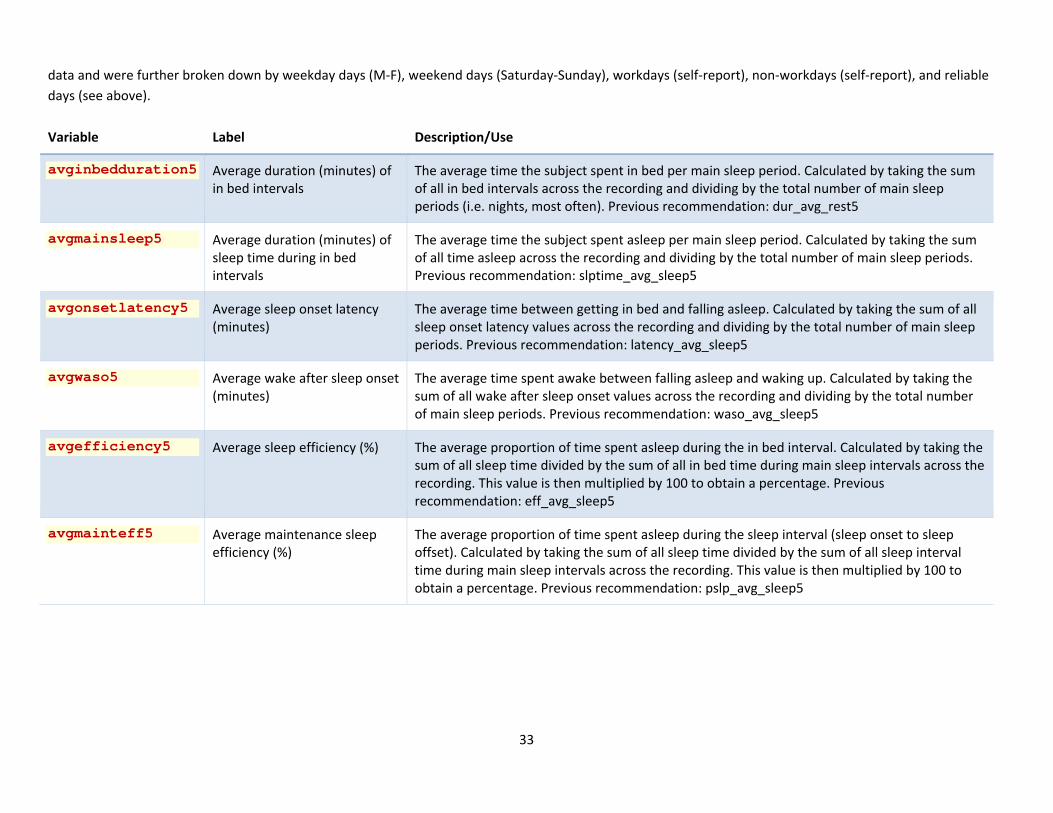
Variable Label Description/Use
avginbedduration5 Average duration (minutes) of in bed intervals
The average time the subject spent in bed per main sleep period. Calculated by taking the sum of all in bed intervals across the recording and dividing by the total number of main sleep periods (i.e. nights, most often). Previous recommendation: dur_avg_rest5
avgmainsleep5 Average duration (minutes) of sleep time during in bed intervals
The average time the subject spent asleep per main sleep period. Calculated by taking the sum of all time asleep across the recording and dividing by the total number of main sleep periods. Previous recommendation: slptime_avg_sleep5
avgonsetlatency5 Average sleep onset latency (minutes)
The average time between getting in bed and falling asleep. Calculated by taking the sum of all sleep onset latency values across the recording and dividing by the total number of main sleep periods. Previous recommendation: latency_avg_sleep5
avgwaso5 Average wake after sleep onset (minutes)
The average time spent awake between falling asleep and waking up. Calculated by taking the sum of all wake after sleep onset values across the recording and dividing by the total number of main sleep periods. Previous recommendation: waso_avg_sleep5
avgefficiency5 Average sleep efficiency (%) The average proportion of time spent asleep during the in bed interval. Calculated by taking the sum of all sleep time divided by the sum of all in bed time during main sleep intervals across the recording. This value is then multiplied by 100 to obtain a percentage. Previous recommendation: eff_avg_sleep5
avgmainteff5 Average maintenance sleep efficiency (%)
The average proportion of time spent asleep during the sleep interval (sleep onset to sleep offset). Calculated by taking the sum of all sleep time divided by the sum of all sleep interval time during main sleep intervals across the recording. This value is then multiplied by 100 to obtain a percentage. Previous recommendation: pslp_avg_sleep5
34
SAMPLE PARAGRAPHS FOR METHODS SECTIONS
At MESA Exam 5 (2010-2013), MESA participants other than those reporting regular use of oral devices, nocturnal oxygen, or nightly positive airway pressure devices were invited to participate in the MESA Sleep Ancillary Study, which consisted of polysomnography (PSG), 7-day wrist actigraphy, and sleep questionnaire data collected during an in-home examination. Of 4,077 participants approached, 147 (6.5%) were ineligible and 141 participants lived too far away to participate. Of the remaining 3,789 participants, 2,261 participated in the sleep exam (59.7%). In total, 2,060 participants had successful PSG data, 2,156 had actigraphy data, and 2,240 participants completed sleep questionnaires. Compared to participants in MESA Exam 5 who did not undergo the sleep exam, participants in the sleep exam were slightly younger (68.4 vs 71.0 yrs), less likely to be white (36.1% vs 44.5%), less likely to be smokers (7.1% vs. 8.4%), and less likely to have COPD (1.6% vs 2.5%). However, they were comparable in regards to gender, BMI, physician diagnosed sleep apnea, asthma, diabetes, and prior myocardial infarction.
PSG: Participants underwent a single night, unattended 15 channel polysomography at home using a portable monitor (Somté PSG, Computmedics Ltd., Abbotsford, Victoria, Australia), using methods adapted from the Sleep Heart Health Study.27 Recorded channels included electroencephalograms (Fz, Cz, Oz, C4, M1), bilateral electrooculograms, electrocardiogram, chin electromyogram, thoracic and abdominal respiratory inductance plethysmography, airflow (via oral/nasal thermistor and nasal pressure transducer), oxyhemoglobin saturation (finger pulse oximetry), leg movements, and body position. Studies were scored at a centralized sleep reading center (BWH) by registered polysomnologists using American Academy of Sleep Medicine guidelines. Data were transmitted to the central reading center for scoring. Apneas were defined as nearly flat flow lasting at least ten seconds; hypopnea was defined as reduction in flow of > 50% for at least ten seconds plus SpO2 desaturation of ≥3% or >= 4% (depending on paper or an arousal (depending on paper. Inter‐ and intra‐scorer reliability was assessed; correlation coefficients for AHI exceeded 0.95 and other measures generally exceeding 0.90.
Refs: Redline S, Sanders MH, Lind BK, et al. Methods for obtaining and analyzing unattended polysomnography data for a multicenter study. Sleep Heart Health Research Group. Sleep 1998;21:759‐67. Iber C A‐IS, Chesson A, and Quan SF for the American Academy of Sleep Medicine. . The AASM Manual for the Scoring of Sleep and Associated Events: Rules, Terminology and Technical Specifications, 1st ed.: . Westchester, Illinois;: American Academy of Sleep Medicine; 2007
Actigraphy: Subjects were asked to wear an actigraphy device (Actiwatch Spectrum; Philips Respironics, PA) on the non-dominant wrist for seven consecutive days, while completing a sleep diary over the same period. A minimum of four weekdays and one weekend day were required for analysis. Data were scored at a central reading center (BWH). The sleep period was manually identified based on information from a self-actuated event marker, sleep diary, and light sensor. The actigraphy data were processed in 30 second epochs to classify sleep or wake periods using the Actiware-Sleep® v. 5.59 analysis software (Mini Mitter Co., Inc.) and a validated algorithm which weight the activity counts in relationship to the level of activity in the surrounding 2-min time periods to yield weighted values of activity counts. (Oakley NR. Validation with polysomnography of the Sleepwatch sleep/wake scoring algorithm used by the Actiwatch activity monitoring system. Technical Report to Mini Mitter Co., Inc.. 1997). Sleep onset was determined based on 5 minutes of immobile time and sleep offset as the last epoch within the rest
35
interval that met the activity criterion for sleep by the weighted activity algorithm. Intra-scorer reliability for average sleep duration, sleep efficiency, and WASO were 0.91, 0.97, and 0.91.