merseyrail overall journey satisfaction 95 94 92 90 90 91 · % 95 % 94 % +1 vs autumn 2018 overall...
TRANSCRIPT

NATIONAL RAIL PASSENGER SURVEYSATISFACTION AT A GLANCEMerseyrail Autumn 2019
91%Overall satisfaction in Autumn 2019
86% 95% 94%+1vs Autumn 2018
Overall Satisfaction = Very Satisfied +Fairly Satisfied
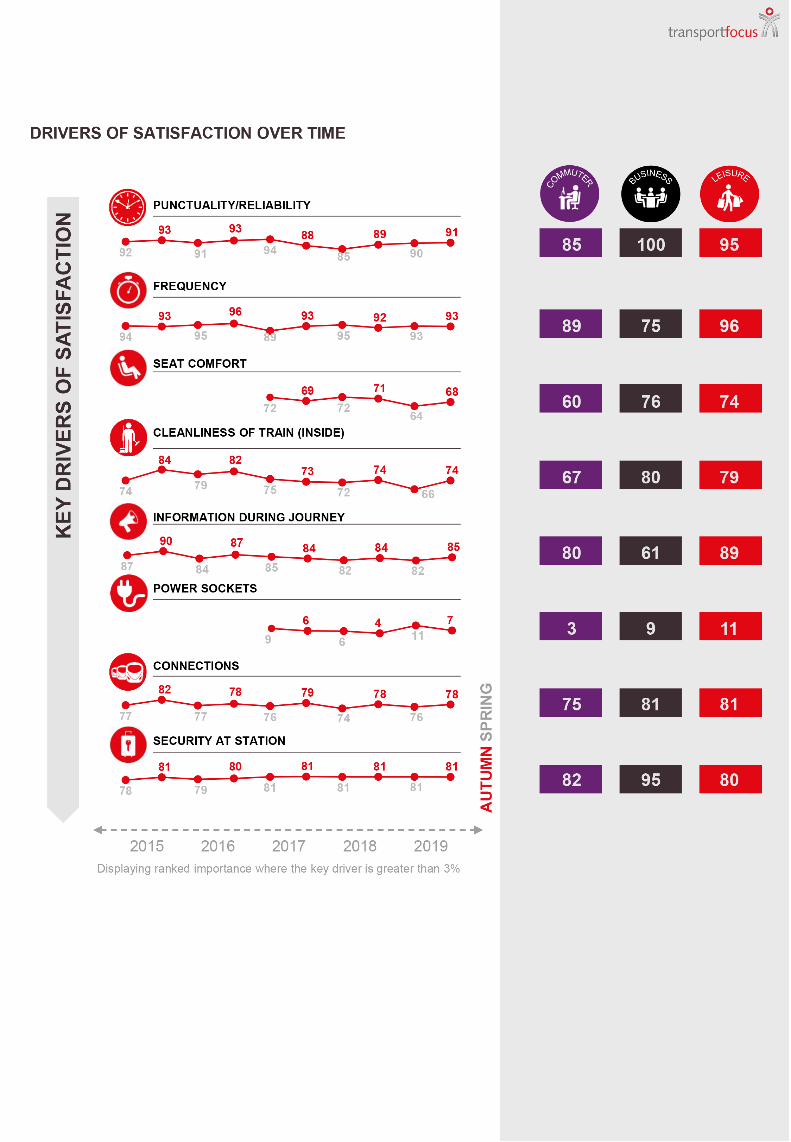
DRIVERS OF SATISFACTION
Some factors have a greater influence on whether a passenger is satisfied with the overall journey than others. The size of the circle denotes relative importance of the top six drivers of satisfaction, so the biggest is the most important driver.
82% 84%
This survey covers 946 Merseyrail passengers
PUNCTUALITY/ RELIABILITY
91%
FREQUENCY
93%
SEAT COMFORT
68%
INFORMATION DURING
JOURNEY
85%
CLEANLINESS OF TRAIN (INSIDE)
74%
POWER SOCKETS
7%
% SATISFIED
OVERALL JOURNEY SATISFACTION
AU
TUM
NSP
RIN
G
91 93 9095 94
89 92 90 90 91
2015 2016 2017 2018 2019
Note: Compared to Autumn 18, percentages in green show significant improvements in satisfaction, whilst percentages in red show significant declines in satisfaction.