merger remedies at the european commission · significant: barriers to entry, collusion, and...
TRANSCRIPT
Munich Personal RePEc Archive
Merger Remedies at the European
Commission: A Multinomial Logit
Analysis
Bougette, Patrice and Turolla, Stéphane
LAMETA
September 2006
Online at https://mpra.ub.uni-muenchen.de/2461/
MPRA Paper No. 2461, posted 04 Apr 2007 UTC

Merger Remedies at the European Commission: A
Multinomial Logit Analysis
Patrice Bougette∗ Stéphane Turolla†
LAMETA Working Paper 2006-08
Abstract
This paper aims to build and empirically evaluate a discrete choice modelof merger remedies as a basis for policy analysis. The database consists of 229merger cases accepted in Phase I or Phase II of the European merger process be-tween 1990 and 2005. We focus on the following question: Which merging firms’characteristics lead the European Commission to decide whether to require con-ditional acceptance? Although a lot of empirical studies have been carried outthese last years, ours is distinguished by at least two original features. First,we explore determinanting factors of the Commission’s decisions with a neuralnetwork model differentiating cases accepted with or without remedies (eitherstructural or behavioral). Secondly, we implement three multinomial logit mod-els. We find that variables related to high market power lead more frequentlyto a remedy outcome, whatever the phase. Innovative industries such as energy,transportation and communications positively affect the probability of a behav-ioral remedy. Lastly, former Competition Commissioner Mario Monti’s policyappears to be pro-remedy, i.e. seeking concessions from merging parties.
Keywords: Merger Remedies – Antitrust – European Commission – Discrete Choice Mod-
els – Self-Organizing Maps.
JEL Classification: K21, L40, D78.
∗Corresponding author. LAMETA and University Montpellier I – Department of Economics.Contact : Avenue de la mer – Site de Richter – C.S. 79606 – 34960 Montpellier cedex 2 – France.Email: [email protected]
†LASER and University Montpellier I – Department of Economics. Email:[email protected]
1

Introduction
In October 2005 the Antitrust Section of the European Commission (EC) publisheda long-awaited study that assessed the efficiency of merger remedies between 1996-2000, i.e. commitments imposed on the merging firms to get the operation accepted.1
This study follows the one made by the U.S. antitrust agency – the FTC – that hadstressed problems with divestitures.2 Actually when a merger raises some anticompet-itive concerns, the authority has the possibility of proposing conditional acceptance,i.e. the authority imposes commitments on merging parties as a condition to acceptthe merger. This means is called a remedy which has been traditionally distinguishedinto two basic forms: One addresses the market structure (structural remedies), theother the merged firm’s behavior (behavioral remedies). Structural remedies generallyinvolve assets divestitures (physical or intangible assets) by the merging firms. Also,new competitors can be created through the sale or licensing of assets if an existingcompetitor for some reason doesn’t purchase divested assets. A behavioral remedyusually entails injunctive provisions that would manage or regulate the merged firm’spost-merger business conduct. In some cases – often in high-tech markets – the com-petition concern may require both structural and conduct relief.3
The European report suggested that merger remedies had permitted more concen-trations to be accepted but highlighted a series of flaws in their design and implemen-tation.4 The analysis was based on interviews with merging parties, competitors andtrustees. Moreover, the European agency has to face recent questioning about thevalidity of its merger control. Often stigmatized for its tough decisions, the EC hasbeen questioned by three annulments of its merger prohibitions by the Court of FirstInstance.5 Thus, it seems appropriate to look into the motives of the EC’s criteria.Does the authority decide in accordance with general economic principles and IO the-ory? Or does it adopt more of a case-by-case approach? In either case, the interestingquestion is the following: Do merging firms have the possibility of planning a betterstrategy that avoids high litigation costs or a devastating effect on their brand image?We’ll see the answer is not straightforward.
Here we target a more technical analysis of factors that can influence the EC’sdecision-making process when facing an anticompetitive concern. As Monti (2003),former Competition Commissioner at the EC, claimed that “the vast majority of thecompetition concerns that had arisen in merger cases had been addressed by means ofdivestitures”, researchers and practitioners had to cover the issue in deeper detail.
In order to estimate the relationship between merger remedy decisions and market
1Merger Remedies Study, DG COMP, European Commission, October 2005. See Kopke (2005)for a summary.
2A Study of the Commission’s Divestiture Process, Federal Trade Commission, 1999.3See Motta (2004).4For instance, the scope of the divested business, the viability of the purchaser, and strategic
behaviors between sellers and purchasers can raise serious concerns about the efficiency of someremedies.
5The famous Airtours/First Choice, TetraLaval/Sidel and Schneider/Legrand merger cases.
2

structure variables, as well as political variables, we built a database including 229merger cases accepted in Phase I or in Phase II between 1990 and 2005.6 In orderto explore the database in detail, we first use Kohonen’s maps issued from neuralnetworks research. Then, we present main results of three multinomial logit (MNL)models.
The paper is organized as follows. Section 1 provides an overview of how economistshave tried to evaluate the accuracy of antitrust agency decisions. Section 2 containsthe description of the model and the database we built. Lastly, Section 3 reports theresults.
1 How to measure antitrust agency’s efficiency
In determining whether a proposed transaction is likely to substantially lessen compe-tition, the antitrust agency has to address a number of economic issues, particularlythe well-known tradeoff between market power and efficiency gain and the protec-tion of consumers’ interests.7 This section overviews the main variables used by theauthority when it faces a merger proposal.
Actually the first attempt at assessing the efficiency of a competition authority wasPosner’s seminal work (1970). He studied the correlation between business cycles andthe number of cases filed to the Department of Justice (DOJ). He found some signif-icant positively-correlated variables such as the GDP and the authority budget; theonly negatively-correlated variable was the “war period”.8 Posner’s work encouragedfurther empirical research and gave birth to a large number of studies.
1.1 Different approaches to assessing an antitrust authority
� Cost-benefit analysis. The prolific empirical literature on antitrust began withthe cost/benefit approach, which was first carried out by Long et al. (1973), Asch(1975), and Siegfried (1975). They were interested in quantifying welfare variationslinked to antitrust regulation. Profit industries were classified by estimating the clas-sic deadweight loss (Harbeger, 1954) due to market power. Costs mainly includedlitigation costs initiated by the government. They all used a basic model to assess
6Thus, the period covers the beginning of the new merger regulation passed in 2004. See, forinstance, Lyons (2004) for further details about the procedure.
7As Competition Commissioner for the EU Ms. Neelie Kroes says “Our aim is simple: to protectcompetition in the market as a means of enhancing consumer welfare and ensuring an efficient allo-cation of resources”. European Competition Policy – Delivering Better Markets and Better Choices.European Consumer and Competition Day, London, Sept. 5, 2005.
8The main limit of this study concerns its descriptive analysis. The author simply comparedproportions and didn’t use any statistical tests. In addition, no trend analysis or autocorrelationdetection was implemented at all. In fact, the possibility of collecting more data and using moresophisticated methods that weren’t available at that time would have permitted to extract – in amuch more convincing way – the main determinants of the DOJ activity.
3
the monopolist’s deadweight loss. For instance, Long et al. used DOJ data over theperiod 1945-1970. The authors performed a linear regression between filed cases andwelfare losses, profit rates, outputs, and concentration ratios. They also dealt withdetermining the impact of concentration on the market. Results showed that whenconcentration rose, more cases were being filed against the given industry. However,the number of cases didn’t increase at the same rate as market concentration, and evenmay have decreased above a certain threshold. Despite the large number of studies,this cost/benefit approach suffered from one major flaw: Assessing the monopolist’sdeadweight loss was rather inconvenient. The methodology failed to provide strongevidence. Nevertheless, one of Long’s appealing results is that cases filed to the DOJdo not fit those Harbeger’s model would provide. In other words, ceteris paribus, casesfiled to the DOJ are not the ones that lead to higher welfare losses. This result is inthe same vein of the public choice school; antitrust policy goal is not linked to theeconomist’s conception of social welfare (McChesney et Shughart II, 1995).
� The discrete choice approach. More recently econometrics and discrete choicemodeling marked another milestone in antitrust methodology. More sophisticatedmodels allow one to take into account a large range of economic variables and to testtheir significance. Coate et al. (1992) estimated a probit model of 70 FTC mergercases between 1982 and 1987.9 Three variables of the U.S. Merger Guidelines appearedsignificant: barriers to entry, collusion, and efficiency gains. They showed efficiencyconsiderations over the period didn’t affect the authority’s decision to accept or block amerger. They also found that political pressure from Congress was a significant factor.Khemani and Shapiro’s work (1993) was close but looked at Canadian data. Marketshares and concentration were the more important factors that explained authority’sdecisions in terms of concentration. Barriers to entry and foreign competition remainedless significant. Weir (1992, 1993) studied the UK’s merger decisions using a probitmodel, too. He found that post-merger market shares didn’t influence the decision-making process but made antitrust competition less likely to accept hostile takeovers.
� Event study approach. Lastly, event studies from the financial literature havebeen carried out with antitrust data.10 Event studies are based on the market efficiencyhypothesis (Fama, 1970), i.e. stock prices reflect complete information about businessactivity. A market model (Capital Asset Pricing Model) is estimated to study stockprice reactions to merger announcements. In that type of model, stock price is pro-portional to market returns. According to Brady et Feinberg (2000)11, merger controlhas a direct impact on individual company stock. With the same methodology, Aktaset al. (2004) analyzed market responses to the EC announcements. They showed thatthe market clearly reacted to the Commission’s decisions and that the probability ofits intervention was not linked to acquirer’s nationality. However, if the authorityintervenes, the market anticipates a more costly operation when the acquirer is a non-European firm. Another example is Duso et al. (2003) who used event study analysis
9The first paper using discrete choice modeling to assess an authority is Barton’s (1979) whichimplemented a logit model to estimate the logics of Federal Communication Commission’s decisions.
10For further readings on event study analysis, see MacKinlay (1997).11Their sample includes 27 firms from the Financial Times magazine.
4

of stock data to evaluate European merger control in terms of political economy. Theyfound that the protection of consumer surplus was not the only motive of the EC :The institutional and political environment did matter. Still, their data suggestedthat the Commission’s decisions were not sensitive to firms’ interests. Instead, resultssuggested that other factors – such as country and industry effects, as well as marketdefinition and procedural aspects – did play significant roles. To sum up, a lot of workhas been done with stock data from merging parties’ competitors. Yet, we shouldinterpret results with care because if the situation was so simple antitrust authoritieswould just look at stock exchange instead of carrying out a long and costly marketanalysis.
This brief survey reveals that competition authorities are not always guided byeconomic principles. Although it is well established that barriers to entry and marketpower are decision variables, other elements like political influences seem to interacttoo. We need to further investigate in order to stress which elements out of theeconomic sphere could be relevant for the European merger control.
1.2 The starting point of the study
Our paper follows three recent studies of European antitrust authorities’ decisions:Bergman et al. (2005), Schinkel et al. (2006), and finally Duso et al. (2006). First,Bergman et al. deal with 96 merger cases between 1990 and 2004 (after sampling andremoving incomplete data). The dependant variable is the type of decision. Contraryto our analysis, they study accepted and rejected merger decisions with logit modeling.They find that the probabilities of a Phase II request and of a prohibition of the mergerincrease with the parties’ market shares. The probability also depends on barriers toentry and facilitating practices of collusion. No political influence affects the decisionmaking process.12 Barriers to entry appear to be strongly significant (at 1 % level).Sectors are relevant too (water and construction).
Schinkel et al. (2006) focus on antitrust cases (no merger cases). Their maincontribution consists of an econometric analysis of EC’s appeals decisions between1964 and 2002. Their data cover all antitrust decisions by the EC up till 2002. In afirst descriptive step, they investigate the EC fining policy and find that the Europeanagency imposes highest fines to horizontal cases. This category has experienced the“the fastest rise in average as well as sum of total fines”. In a second step, they use abinary probit model show that the notified case in which abuse of dominance plays arole are more likely to result in infringement. Commissioners matter, too. Secondly,they observe that the probability of going into appeal (for infringement cases) doesdepend on the level of fines imposed on the parties: the higher the fine the higher theprobability of appeal. Lastly, unsurprisingly the number of parties also increases thelikelihood of appeal.
12The authors assess political influence on the authority’s decision-making with dummy variablessuch as commissioners and countries of origin. Janin et Menoni (2005) use French merger data andreach the same conclusions. Political factors have a low influence on French authority’s final decisions.
5

Duso et al. (2006) use an event study to analyze the competitive outcome ofmerger remedies. Their sample includes 168 concentrations between 1990 and 2002.Two specific days are relevant in their analysis: (i) the announcement day, i.e. stockprices provide information about whether the merger is likely to create anticompetitiveconcerns; (ii) the day when the EC makes its decision, i.e. stock prices reflect theoutcome of the bargaining process between the agency and the parties. First, theauthors assess the weighted average abnormal returns of all firms (insiders/outsiders),which give a measure of merger profitability. Then, using regression techniques theyestimate the degree of effectiveness of an antitrust action. Their results show thatmerger remedies are not always appropriately imposed. Also, they conclude that themarket can predict remedies’ effectiveness when applied in Phase I. However, theyfind that remedies appear to be less effective in Phase II maybe due to the increasedmerging firms’ bargaining power during at the last stage of the merger review.
Two elements distinguish this paper. First, to our knowledge, except for Dusoet al. (2006) in a context of an event study analysis, this is the only econometricwork that differentiates structural and behavioral remedies. And our database coversfifteen years, i.e. the whole period of the first merger regulation and one year of thenew reform. The other originalities are an appealing data analysis and the choice of amultinomial logit model.
2 Modeling the merger remedy process
2.1 Model specification
Discrete choice models have been largely used in various research areas: transportation,economics, marketing, behavioral sciences, etc.13 They have proved their efficiency inestimating individual choice probabilities with a set of mutually exclusive alternatives.These models are usually consistent with random utility theory, i.e. individuals aresupposed to choose the alternative associated with the maximum utility.
In modeling remedies in the European merger control, we use a multinomial logitmodel (MNL). We first assume that the authority can choose from a set of alternatives:structural remedies, behavioral remedies, both remedies or neither of them. At thei-th merger proposal, it receives utility from each alternative j such as
Uij = βxij + ǫij (1)
where x represents a vector of covariates, such as merging firms’ characteristics (marketshares, location etc.) and various market indicators (sector, barriers to entry, etc.).β is the respective coefficient vector. The authority will choose an alternative thatmaximizes utility. When there are m choices, the probability of choice j is
13For a review of discrete choice models, see Train (2003). A classic econometric textbook isprovided by Greene (2003).
6

Pr(yi = j) = Pr(Uij > Uik), ∀ j 6= k, j = 1, 2, . . . , k, . . . m. (2)
The dependent variable in our analysis is the type of acceptance made by theantitrust authority when faced with a merger proposal. “Phase I without remedy”(y = 0) is treated as a reference category. If we assume that all ǫij of the m choicesare independent, identically distributed with type I extreme value (Gumbel) distribu-tion, McFadden (1973) has shown that the multinomial logit model has a closed-formsolution. The maximum likelihood estimation of the model is straightforward. Theprobability of choosing an alternative j among m can be written such as
Pr(yi = j) =exiβj
1 +∑m
k=1exiβk
, ∀ j = 1, 2, . . . ,m . (3)
The marginal effects, which are partial derivatives of probabilities Pj with respectto the set of characteristics, are calculated from multinomial logit results following theequation below:
∂Pj
∂xi
= Pj
(
βj −
m∑
k=1
Pkβk
)
, ∀ j = 1, 2, . . . ,m . (4)
The sign and magnitude of this marginal variable have no direct relationship withany specific coefficient (Greene, 2003). Elasticities of probabilities can also be com-puted.
ηj =∂Pj
∂xi
xi
Pj
= xi
(
βj −
m∑
k=1
Pkβk
)
, ∀ j = 1, 2, . . . ,m . (5)
The restriction of choosing a MNL is that we do not take into account the lengthof the merger procedure. Imposing a remedy in Phase I or in Phase II is the same insuch setting. The MNL is based on a strong hypothesis: the ratio of the probabilitiesof any two alternatives is independent from the choice set. This property is calledthe “independence of irrelevant alternatives” (IIA), which may be a limitation in somepractical applications. Here, our data successfully passed the Hausman and McFaddentest, which was not surprising due to the type of data.
2.2 Database
Between 1990 and 2005, the EC receives 2,961 merger notifications. In respect to ourinitial objective – studying merger remedies – we focus only on accepted cases (bothphases with and without remedies). Phase I remedies concern Art. 6.2 of the ECMerger Regulation whereas Phase II remedies concern Art. 8.2.
7

Our database consists of 229 accepted merger cases between February 1991 andDecember 2005 (see table 1). Data were mostly collected from the EC’s online re-sources14. The sample doesn’t account for most cases unconditionally accepted inPhase I (Art. 6.1(b)) because they were not available15. These cases largely corre-spond to merger decisions which don’t raise serious doubts about their compatibilitywith the common market. We only obtained 15 merger reports from this category16.
Table 1: Case population and net sample (1990-2005)
Population Sample
Number of notified cases 2,961Number of refused cases 211(withdrawn, referred or blocked)Number of accepted cases 2,750 229
Phase I Acceptanceaccepted without remedy 2,513 15accepted with remedies 134 115Total Phase I 2,647 130
Phase II Acceptanceaccepted without remedy 28 27accepted with remedies 75 72Total Phase II 103 99
Out of 2,961 proper merger notifications, 83% were accepted in Phase I. Overall,the authority imposed 209 remedies (134 + 75). The number of remedies increasedover the period. On one hand, the Commission tends to impose remedies more oftenin Phase I, which shows a faster analysis when low-cost remedies are available. Onthe other hand, when the case is more complex, Phase II investigations start and the“stop the clock” option enables merging parties to get more time to propose adaptedremedies.
Detailed information was not available for 22 of the remedies. Consequently, thesample consists of 130 cases in Phase I and 99 cases in Phase II. Overall, 54% ofremedies in Phase I were structural, 31% were behavioral, and 15% mixed both typesof remedies (see table 2). The conditioning of merger project with assets’ divesti-ture prevails in Phase I. When we look at Phase II remedies, 36% were structural,25% were behavioral, and 39% mixed both types of remedies. Surprisingly, a mix ofboth types is most represented in Phase II. A reason may be that the complexity of
14See http://europa.eu.int/comm/competition/mergers/cases/.15The European Commission Web site doesn’t even list the cases.16Actually these 15 cases contain slight commitments but we didn’t consider them as remedies
because they were only “[. . . ] restrictions directly related and necessary to the implementation of theconcentration” (Art. 6.1(b)).
8

Table 2: Types of remedies analyzed (1990-2005)
Structural Behavorial Both Total
Phase I 62 36 17 115(percentage of Phase I) (54%) (31%) (15%)
Phase II 26 18 28 72(percentage of Phase II) (36%) (25%) (39%)
Total 88 54 45 187
Phase II cases usually requires a more sophisticated remedy package to ensure thatthe anticompetitive concern is resolved.
We only deal with one relevant market per case. The choice of that market de-pends on the potential anticompetitive concern. Each time we choose the narrowestmarket where competition could be hurt the most (Bergman et al.). Due to secretbusiness considerations, market shares are not easily available.17 Thus, we use 25%range dummy variables to collect them. We also create dummy variables to codefirms’ location (see table 3) and sector information (see table 4). Also, the mergedentity’s worldwide turnover is reported from either EC decisions or business press.The appendix lists every regressor variable and details the coding scheme.
3 Results
First we implement a neural data analysis in Section 3.1. Then, results from themultinomial logit model are provided in Section 3.2.
3.1 Mapping the choice of a remedy
Here Self-Organized Maps (SOM) provide a preliminary analysis of the data. SOMs– a type of artificial neural network (ANN) – offer an original data analysis.18 Moreprecisely, we use one specific type of SOM, Kohonen’s maps, which are used to performtasks such as data exploration, classification, forecasting and optimization (Kohonen,2000). Properties of Kohonen’s maps are twofold. First, the dimensionality numberof data is shrunk, as it is in projection methods (principal components analysis), andinput data are projected onto a discrete space where topological aspects of observa-tions space are preserved. Secondly, similar inputs are represented by one prototype
17Actually market delineation or market share estimations are not completely objective and maybe argued between merging parties and the competition authority.
18ANNs simulate the activity of the human brain. Detailed discussion about ANNs is beyond thescope of this paper, but curious readers are invited to read Haykin (1999).
9
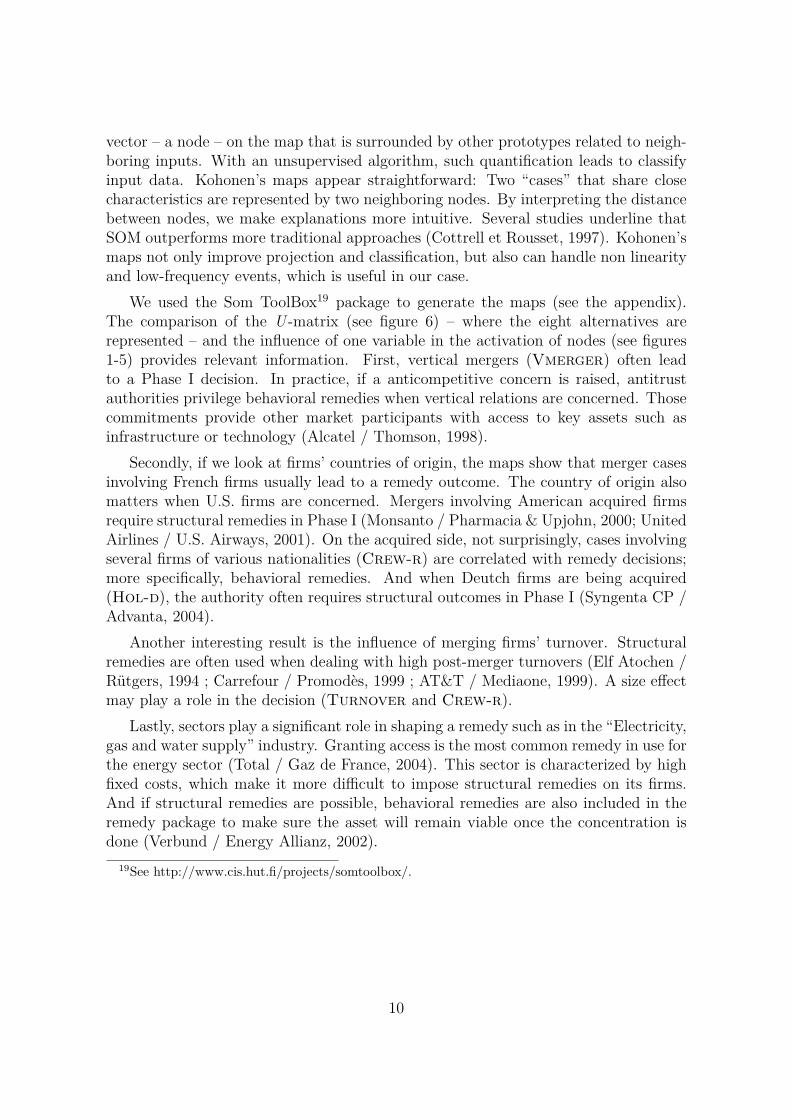
vector – a node – on the map that is surrounded by other prototypes related to neigh-boring inputs. With an unsupervised algorithm, such quantification leads to classifyinput data. Kohonen’s maps appear straightforward: Two “cases” that share closecharacteristics are represented by two neighboring nodes. By interpreting the distancebetween nodes, we make explanations more intuitive. Several studies underline thatSOM outperforms more traditional approaches (Cottrell et Rousset, 1997). Kohonen’smaps not only improve projection and classification, but also can handle non linearityand low-frequency events, which is useful in our case.
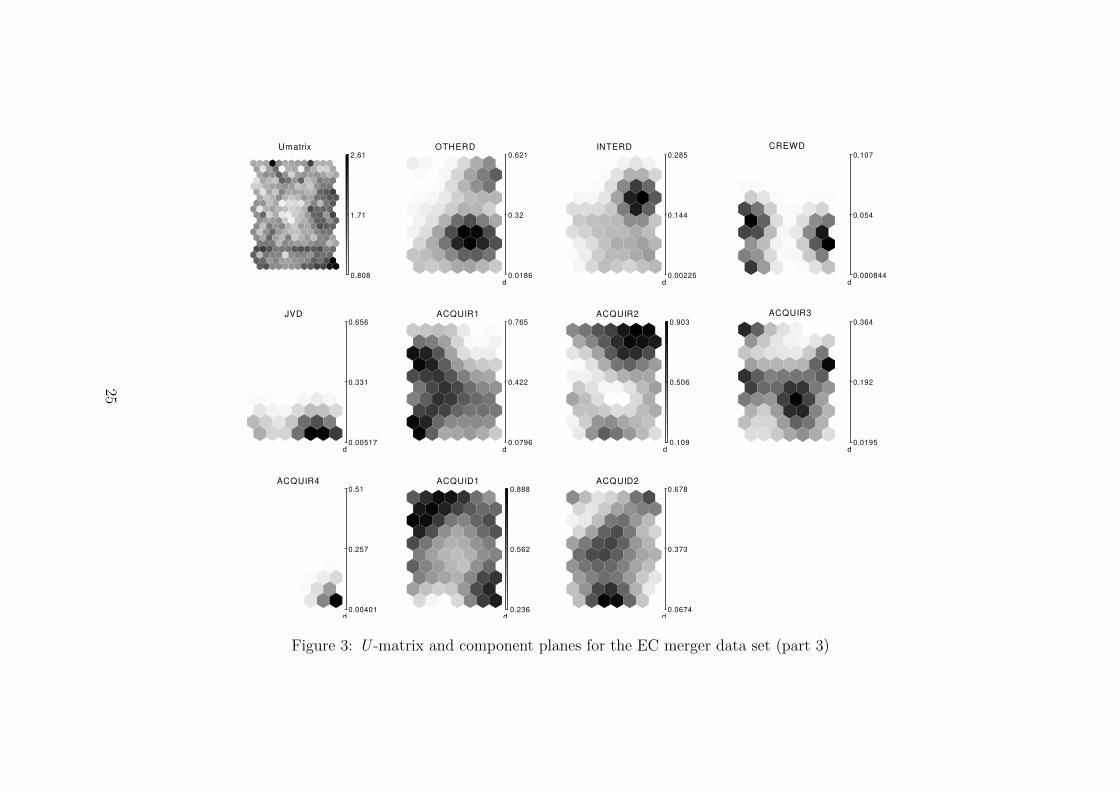
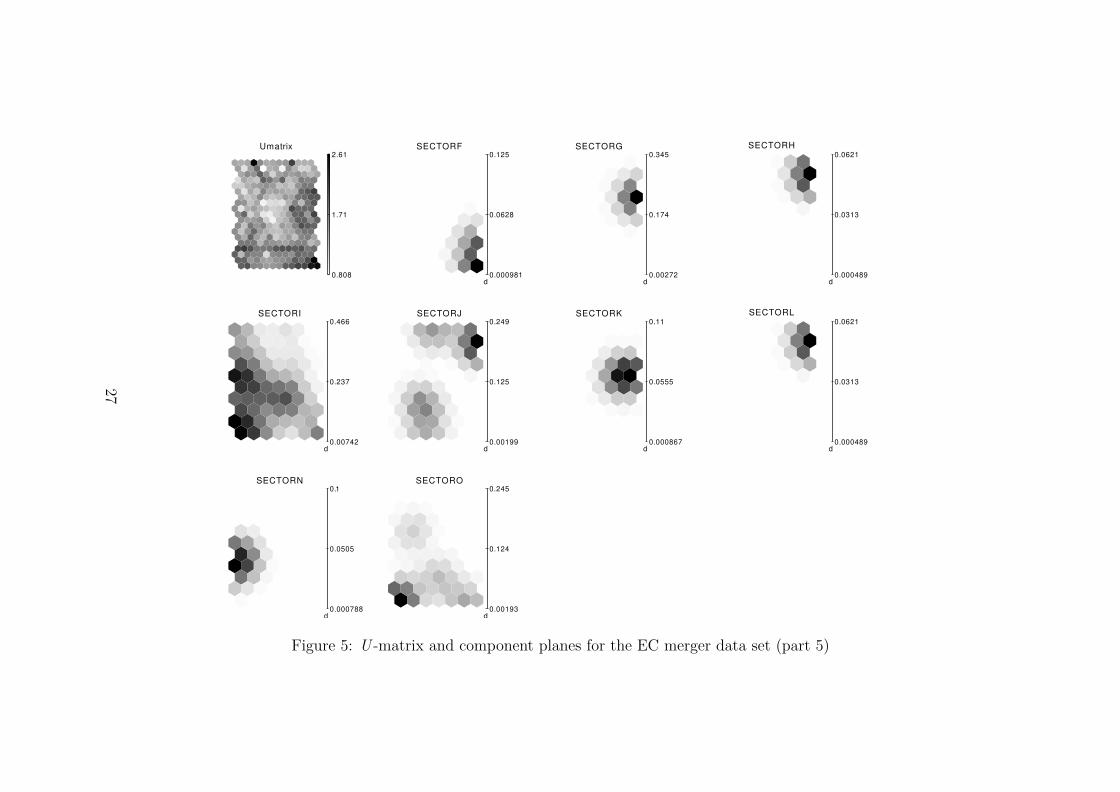
We used the Som ToolBox19 package to generate the maps (see the appendix).The comparison of the U -matrix (see figure 6) – where the eight alternatives arerepresented – and the influence of one variable in the activation of nodes (see figures1-5) provides relevant information. First, vertical mergers (Vmerger) often leadto a Phase I decision. In practice, if a anticompetitive concern is raised, antitrustauthorities privilege behavioral remedies when vertical relations are concerned. Thosecommitments provide other market participants with access to key assets such asinfrastructure or technology (Alcatel / Thomson, 1998).
Secondly, if we look at firms’ countries of origin, the maps show that merger casesinvolving French firms usually lead to a remedy outcome. The country of origin alsomatters when U.S. firms are concerned. Mergers involving American acquired firmsrequire structural remedies in Phase I (Monsanto / Pharmacia & Upjohn, 2000; UnitedAirlines / U.S. Airways, 2001). On the acquired side, not surprisingly, cases involvingseveral firms of various nationalities (Crew-r) are correlated with remedy decisions;more specifically, behavioral remedies. And when Deutch firms are being acquired(Hol-d), the authority often requires structural outcomes in Phase I (Syngenta CP /Advanta, 2004).
Another interesting result is the influence of merging firms’ turnover. Structuralremedies are often used when dealing with high post-merger turnovers (Elf Atochen /Rütgers, 1994 ; Carrefour / Promodès, 1999 ; AT&T / Mediaone, 1999). A size effectmay play a role in the decision (Turnover and Crew-r).
Lastly, sectors play a significant role in shaping a remedy such as in the “Electricity,gas and water supply” industry. Granting access is the most common remedy in use forthe energy sector (Total / Gaz de France, 2004). This sector is characterized by highfixed costs, which make it more difficult to impose structural remedies on its firms.And if structural remedies are possible, behavioral remedies are also included in theremedy package to make sure the asset will remain viable once the concentration isdone (Verbund / Energy Allianz, 2002).
19See http://www.cis.hut.fi/projects/somtoolbox/.
10

3.2 The multinomial logit model
Tables 5, 7 and 9 present the estimated coefficients of the three MNL models20 based onthe general specification presented in equation (3). The models could not be computedwith the whole set of regressors because of multicolinearity with dummy variables.The previous neuronal analysis and significant coefficients helped us screen a morerestrained set of reasonable variables.
As Greene underlines, “the coefficients in this model are difficult to interpret” (2003,p. 722). Consequently, we adopt the following methodology. We first estimate themodels and select one by looking at three criteria: regressor significance, percentage ofcorrect predictions, and the pseudo R2. We then compute elasticities of probabilitiesusing the formula in (3) and comment on their sign and magnitude to find the maindeterminants of each alternative. Tables 6, 8 and 10 report the elasticities.
3.2.1 Model #1: Conditioning a merger
In the first model, we use a four-alternative specification of the empirical model, basedon the differences between conditional acceptances or no remedies and discriminationby phase. Market power variables only appear significant for acquired firms. Lowand medium market shares of acquired firms positively determine remedy decisions inPhase I (Acquid1, Acquid2). Size effect variables don’t appear to be good predictorsfor this model because neither post-merger turnover (Turnover) nor world leader(Worldleader) variables are below a 10% significance level.
The influence of “political variables” is less standard in earlier studies but more inthe line of recent commentaries in the media. Former European Antitrust chief MarioMonti appears strongly significant at the 1% level. His work had an important role inthe choice of a conditional acceptance in Phase I (Monti).21 Unlike Bergman et al.(2005), we found that his role as the head of the Antitrust Section undoubtedly affectedmerger decisions. Although his influence was largely stressed in the media, it was notfound in previous empirical works. A focus on remedies seems to unveil his impact,whereas the simple modelization of the acceptance/rejection process hadn’t underlinedit. Surprisingly, the French nationality of the acquirer firm (Fra-r) is another politicalvariable that is correlated with remedy decisions in Phase I (Hoechst / Rhône Poulenc,1999; Masterfood / Royal Canin, 2002; Alcan / Pechiney, 2003). Lastly, Germanyturns out to be significant, too. The German nationality of the acquirer (Ger-r)positively influences a Phase II decision (with or without remedies).
Market variables are also significant and present expected signs. As several studiesshow, barriers to entry – significant at least at the 5% level – are one indicator ofa remedy outcome (Entry). Precisely, barriers to entry in the relevant market are
20All estimations were carried out using Limdep software.21In the press, Monti was dubbed as “Super Mario” when he blocked several mergers such as the
GE/Honeywell case (see, for instance, “Super Mario: EU’s Antitrust Czar isn’t Afraid to Say No”,Wall Street Journal. October 2, 2000) or when he investigated Microsoft bundling practices.
11
more likely to condition a merger in Phase II. Another interesting result is that agroup of firms being acquired positively influences the authority’s acceptance withoutany remedies (Crew-d).
If we now look at the various industry sectors, elasticities show that transporta-tion and communications sectors positively impact the probabilities of acceptance inPhase I (Sectori). Next, mergers taking place in the retail trade sector also correlatewith Phase I decisions, but without any remedies (Sectorg).
The goodness-of-fit of this model seems good enough. The overall level of correctlyclassified decisions is more than 57%.
3.2.2 Model #2: The full merger process
Our database allows us to refine the previous model by discriminating remedies inthree alternatives: structural, behavioral, and both. Thus, model #2 consists of eightalternatives (Phase I / Phase II, No remedy / Structural / Behavioral / Both remedies).First of all, elasticities of probabilities indicate that a change in barriers to entrypositively affects the probability of a behavioral remedy in Phase II. Actually, as soonas concerns about entry are raised, the merger is always accepted with commitmentsfrom the merging parties.
Results also indicate that a merger in communications or transportation industries(Sectori) is likely to be accepted in Phase I (with any or access remedies). Theapproach stresses the importance of high technology markets in designing behavioralremedies (licences, industrial property rights). Imposing divestitures on an innovativefirm is sometimes counterproductive because merger efficiencies matter.
In regards to market shares, the acquired firm’s shares are still relevant, mostlyin Phase I (Acquid1, Acquid2). Also, high market shares of acquirers negativelyimpact behavioral remedies (clearer for Acquir2 than Acquir3). When facing largeacquirers, structural remedies are likely to be preferred to access remedies. That resultdiffers from the model #1 result.
Compared to the first model, Fra-r, Monti and Sectori play the same rolein Phase I. Plus, the model performs well by correctly predicting the importance ofstructural relief as highlighted in the “Merger Remedy Study” (op. cit.). The pseudo R2
for matching remedy choice, adjusted for degrees of freedom, is .15, and the parameterestimates are reasonable. The percentage of correct prediction is 30%. The value israther low because we use eight alternatives. The model correctly predicts the choiceof structural and behavioral remedies in Phase I but cannot predict mixed remedies,in either Phase I or in Phase II of the merger process.
3.2.3 Model #3: Integrating mixed remedies
Because of prediction problems encountered with alternative “both remedies” in model#2, we adopt a different model specification. We reclassify remedies in two groups in-
12

stead. As behavioral remedies are often included in divestitures packages, we integratethe mixed alternatives (structural and behavioral) into the structural ones.
In many respects results are similar to model #2 results. Hmerger is mostlysignificant at the 1% level. As shown in table 10, a horizontal merger has a positiveeffect on the probability of acceptance without any remedies. Entry still contributesto a remedy decision in Phase II (rather bahavioral).
Next, the choice of a structural remedy in Phase I is relatively unresponsive tochanges in high market shares (Acquir2, Acquir3). That contrasts with its strongresponse to low market shares such as Acquid1. This is not surprising because mergersof high market share firms are more likely to be cleared in Phase II investigations.
As in model #2, the probability of a structural remedy in Phase I significantlyincreases if the acquired company is French (Fra-r). Few French cases were acceptedin Phase II of the merger process. More often, commitments are negotiated beforehand.
Lastly, former Competition Commissioner Mario Monti still has the same role inthis last model: He may encourage remedy decisions in Phase I in order to shortenthe decision-making process or to save authority’s resources (Monti).
We have partially reached the expected objective for model #3. Compared tomodel #2, the percentage of correct predictions rose by 7 percentage points. Butwe still encounter prediction problems as soon as an alternative includes behavioralrelief. This type of remedy would be difficult to predict through our political or marketvariables. We would like to emphasize to our reader that our priority is to highlightsome characteristics that cause the European agency to require conditional acceptance.
Several hypotheses can be proposed to figure out the low predictive power of ourmodels. First, we faced a sampling problem. The acceptance without remedy inPhase I was underrepresented. We couldn’t overcome the bias with our lack of infor-mation. A sampling choice method was not carried out because we lacked so muchinformation. And the use of a MNL may be not an optimal choice if we consider thesequential aspect of the merger process.22 A modelization with nested choices couldhave been more appropriate. Nonetheless, the absence of post-merger data relativeto the choice of a given remedy kept us from selecting this structure. Finally, weshouldn’t forget that the choice of regressors is important and the lack of informationabout quantitative post-merger data and welfare effects cannot be ignored.
Conclusion
The paper investigates the use of merger remedies by the EC. After an overview of themain studies that have assessed antitrust agencies’ efficiency, we built a new databasefor 1990-2005 and analyzed the determinants of remedies with a multinomial logitmodelization.
22We computed a non-linear version of the MNL (Box-Cox transformation) without any morepowerful outcomes.
13
In accordance with industrial and antitrust economic theory, we found that vari-ables related to high market power led more frequently to a remedy outcome, whateverthe phase. Of particular interest were the characteristics of acquired firms. The marketpower of the acquired firm determines the decision to launch Phase II investigationsthat often end up with a structural remedy.
The approach stresses the importance of a size effect in the decision-making process:Variables that reflect merging parties’ size encourage the Commission to opt for aremedy outcome. Actually, firms with a high turnover are likely to be forced to divesta part of their business as a condition to merge. Although this result didn’t appearwith MNL modelization, the result of Kohonen’s maps enables us to highlight thisaspect. Also, mergers involving several acquirers end up being conditioned with anaccess remedy to the rival firms.
Three sector variables influence the authority: energy, communications and retailtrade. High-tech or know-how intensive sectors, such as energy and communications,often invoke remedy decisions due to the concentration of the sector (economies ofscale). Access remedies are the most used in those two sectors to make sure intellectualproperty rights (IPRs) won’t foreclose competitors. The retail trade sector positivelyaffects an outright acceptance.
Results also support that Mario Monti had an effect on the shape of the remedydecisions. This is something new. So far, several studies couldn’t have detected hisinfluence on a merger being accepted or blocked. It is noteworthy that the remedyapproach sheds some new light on the issue. Countries of origin also reinforce thepolitical aspect of the decisions since U.S. and French acquirers lead to a mergerdecision with commitments.
All things considered, the paper stresses the main criteria of conditioning a merger.However, the predictive power of the models is not high enough to handle all typesof merger outcomes. This work is a guideline and complement to more descriptiveanalyses such as the one released by the European Commission last October. A case-by-case basis is still necessary despite the understaffed antitrust authority. Furtherresearch could evaluate the cost of a remedy. This new information would permit amore complex modelization of the merger process.
Aknowledgements
The authors would like to thank Christian Montet, Thierry Blayac, Aurélie Bonein,Jean-Pascal Guironnet, and Christine Laubenstein for helpful comments and sugges-tions. All errors and omissions remain ours.
14

References
[1] Aktas N., de Bodt E., and Roll R. (2004), “Market Response to Euro-pean Regulation of Business Combinations”, Journal of Financial & QuantitativeAnalysis, 39(4), 731-757.
[2] Asch P. (1975), “The Determinants and Effects of Antitrust Activity”, Journalof Law and Economics, 18(2), 575-581.
[3] Barton M.F. (1979), “Conditional Logit Analysis of FCC Decision-Making”,Bell Journal of Economics, 10(2), 399-411.
[4] Bergman M.A., Jakobsson M., and Razo C. (2005), “An Econometric Anal-ysis of the European Commission’s Merger Decisions”, International Journal ofIndustrial Organization, 23(9-10), 717-737.
[5] Brady U. and Feinberg R.M. (2000), “An Examination of Stock-Price Effectsof EU Merger Control Policy”, International Journal of Industrial Organization,18(6), 885-900.
[6] Coate M.B., Higgins R.S., and McChesney F.S. (1990), “Bureaucracy andPolitics in FTC Merger Challenges”, Journal of Law and Economics, 33(2), 463-482.
[7] Cottrell M. and Rousset P. (1997), “A Powerful Tool for Analysing andRepresenting Multidimensional Quantitative and Qualitative Data”, in Proceed-ings of IWANN ’97, Berlin: Springer Verlag, 861-871.
[8] Duso T., Gugler K., and Yurtoglu B.B. (2006), “EU Merger Remedies:A Preliminary Empirical Assessment”, Working paper, GESY Discussion Papern◦ 81, January 2006.
[9] Duso T., Neven D.J., and Röller L.-H. (2003), “The Political Economy ofEuropean Merger Control: Evidence using Stock Market Data”, CIC Working Pa-pers FS IV 02-34, Wissenschaftszentrum Berlin (WZB). Forthcoming in Journalof Law and Economics.
[10] European Commission (2004), “Council Regulation (EC) n◦ 139/2004 of 20January 2004 on the Control of Concentrations between Undertakings”, OfficialJournal L 24, 29.01.2004, 1-22.
[11] European Commission (2005), Merger Remedies Study, October 2005.
[12] Fama E.F. (1970), “Efficient Capital Markets: A Review of Theory and Empir-ical Work”, Journal of Finance, 25(2), 383-417.
[13] Greene W.H. (2003), Econometric analysis, 5th ed., New York: Prentice-Hall.
15

[14] Harberger A.C. (1954), “Monopoly and Resource Allocation”, American Eco-nomic Review, 44(2), 77-87.
[15] Haykin S. (1999), Neural Networks: A Comprehensive Foundation, 2nd ed., NewJersey: Prentice Hall.
[16] Janin L. and Menoni B. (2005), “Le contrôle des concentrations en France :analyse empirique des avis du Conseil de la concurrence”, Working paper n◦2005-37, CREST et EUREQua.
[17] Khemani R.S. and Shapiro D.M. (1993), “An Empirical Analysis of CanadianMerger Policy”, Journal of Industrial Economics, 41(2), 161-177.
[18] Kohonen T. (2000), Self-Organizing Maps, 3rd ed., Berlin: Springer.
[19] Kopke A. (2005), “Merger Remedies Study”, Competition Policy Newsletter, 3,3-5.
[20] Long W.F., Schramm R., and Tollison R.D. (1973), “The Economic Deter-minants of Antitrust Activity”, Journal of Law and Economics, 16(2), 351-364.
[21] Lyons B.R. (2004), “Reform of European Merger Policy”, Review of Interna-tional Economics, 12(2), 246-261.
[22] MacKinlay A.C. (1997), “Event Studies in Economics and Finance”, Journalof Economic Literature, 35(1), 13-39.
[23] McChesney F.S. and Shughart W.F., II (1995), The Causes and Conse-quences of Antitrust: The Public-Choice Perspective, Chicago: The University ofChicago Press.
[24] McFadden D. (1973), “Conditional Logit Analysis of Qualitative Choice Be-havior” in Frontiers in Econometrics. P. Zarembka (ed). New York: Academic,105-142.
[25] Monti M. (2003), “The Commission Notice on Merger Remedies – One YearAfter” in Merger Remedies in U.S. and E.U. Competition Law. F. Lévêque etH.A. Shelanski eds. London: Edward Elgar, 3-12.
[26] Motta M. (2004), Competition Policy: Theory and Practice, Cambridge: Cam-bridge University Press.
[27] Posner R.A. (1970), “A Statistical Study of Antitrust Enforcement”, Journalof Law and Economics, 13(2), 365-419.
[28] Schinkel M.P., Carree M., and Günster A. (2006), “European AntitrustPolicy: An Analysis of Commission Decisions during 1964-2002”, Working Paper,33st EARIE Conference, Amsterdam.
16
[29] Siegfried J. (1975), “The Determinants of Antitrust Activity”, Journal of Lawand Economics, 18(2), 559-574.
[30] Train K. (2003), Discrete Choice Methods with Simulation, Cambridge, Mass.:Cambridge University Press.
[31] Weir C.M (1992), “Monopolies and Merger Commission, Merger Reports andthe Public Interest: A Probit Analysis”, Applied Economics, 24, 27-32.
[32] Weir C.M (1993), “Merger Policy and Compandition: An Analysis of the Mo-nopolies and Merger Commission’s Decision”, Applied Economics, 25, 57-66.
17

Appendix
Regressors used in the model
Most of regressors are dummy variables.
Acquid1: 1 if the acquired firm’s market share range is [0, 25%[, 0 else.Acquid2: 1 if the acquired firm’s market share range is [25%, 50%[, 0 else.Acquid3: 1 if the acquired firm’s market share range is [50%, 75%[, 0 else.Acquid4: 1 if the acquired firm’s market share range is [75%, 100%[, 0 else.Acquir1: 1 if the acquirer’s market share range is [0, 25% [, 0 else.Acquir2: 1 if the acquirer firm’s market share range is [25%, 50%[, 0 else.Acquir3: 1 if the acquirer firm’s market share range is [50%, 75%[, 0 else.Acquir4: 1 if the acquirer firm’s market share range is [75%, 100%[, 0 else.Crew-d: 1 if the acquired consists of several firms, 0 else. This variable can reflect some bargainingpower.Crew-r: 1 if the acquirer consists of several firms, 0 else. This variable can reflect some bargainingpower.Entry: 1 if entry considerations are claimed, 0 else.Fra-d: 1 if the acquired firm’s headquarters are located in France, 0 else.Fra-r: 1 if the acquirer’s headquarters are located in France, 0 else.Ger-d: 1 if the acquired firm’s headquarters are located in Germany, 0 else.Ger-d: 1 if the acquirer’s headquarters are located in Germany, 0 else.Hmerger: 1 for a horizontal merger, 0 else.Hol-d: 1 if the acquired firm’s headquarters are located in the Netherlands, 0 else.Hol-r: 1 if the acquirer’s headquarters are located in the Netherlands, 0 else.Inter-d: 1 if the acquired firm’s is an international holding, 0 else.Inter-r: 1 if the acquirer is an international holding, 0 else.Jvmerger: 1 for a joint venture, 0 else.Monti: 1 if Mario Monti was the European Competition Commissioner, 0 else.Other-d: 1 if the acquired firm’s headquarters are located in another European country, 0 else.Other-r: 1 if the acquirer’s are located in another European country before, 0 else.Scan-d: 1 if the acquirer’s headquarters are located in Scandinavia, 0 else.Scan-r: 1 if the acquirer’s headquarters are located in Scandinavia (including Denmark, Sweden,Norway and Finland), 0 else.Sectora to Sectoro: 17 dummy variables that describe activity sectors. We used the Europeancommission’s classification (Nace codes, see table 4). We removed Sector H, Sector M, Sector P, andSector Q since no cases entered those categories.Turnover: this is the worldwide turnover of the merged entity (expressed in $ billions).Uk-d: 1 if the acquired firm’s headquarters are located in the United Kingdom, 0 else.Uk-r: 1 if the acquirer’s headquarters are located in the United Kingdom, 0 else.Us-d: 1 if the acquired firm’s headquarters are located in the United States, 0 else.Us-r: 1 if the acquirer’s headquarters are located in the United States, 0 else.Vmerger: 1 for a vertical merger, 0 else.World: 1 if the merger involves a world leader firm, 0 else.
18

Table 3: Merging firms’ countries of origin
Acquirer firms Acquired firms
FRANCE 17.2% 11.9%GERMANY 18.0% 20.8%INTERNATIONAL 7.2% 5.8%THE NETHERLANDS 7.2% 8.4%OTHER EUROPEAN COUNTRIES 12.4% 18.6%SCANDINAVIA 10.4% 8.8%U.K. 10.4% 12.8%U.S. 17.2% 12.8%
Table 4: Merging firms’ sectors
NACE Code Sector Frequency Percentage
Sector A Agriculture, hunting and forestry 3 1.31%Sector B Fishing - -Sector C Mining and quarrying 4 1.75%Sector D Manufacturing 142 62.01%Sector E Electricity, gas and water supply 14 6.11%Sector F Construction 2 0.87%Sector G Wholesale and retail trade 4 1.75%Sector H Hotels and restaurants 1 0.44%Sector I Transport, storage and communication 39 17.03%Sector J Financial intermediation 9 3.93%Sector K Real estate, renting and business activities 2 0.87%Sector L Public administration and defence 1 0.44%Sector M Education - -Sector N Health and social work 2 0.87%Sector O Other community, social and personal service activities 6 2.62%Sector P Activities of households - -Sector Q Extra-territorial organizations and bodies - -TOTAL 229 1
19
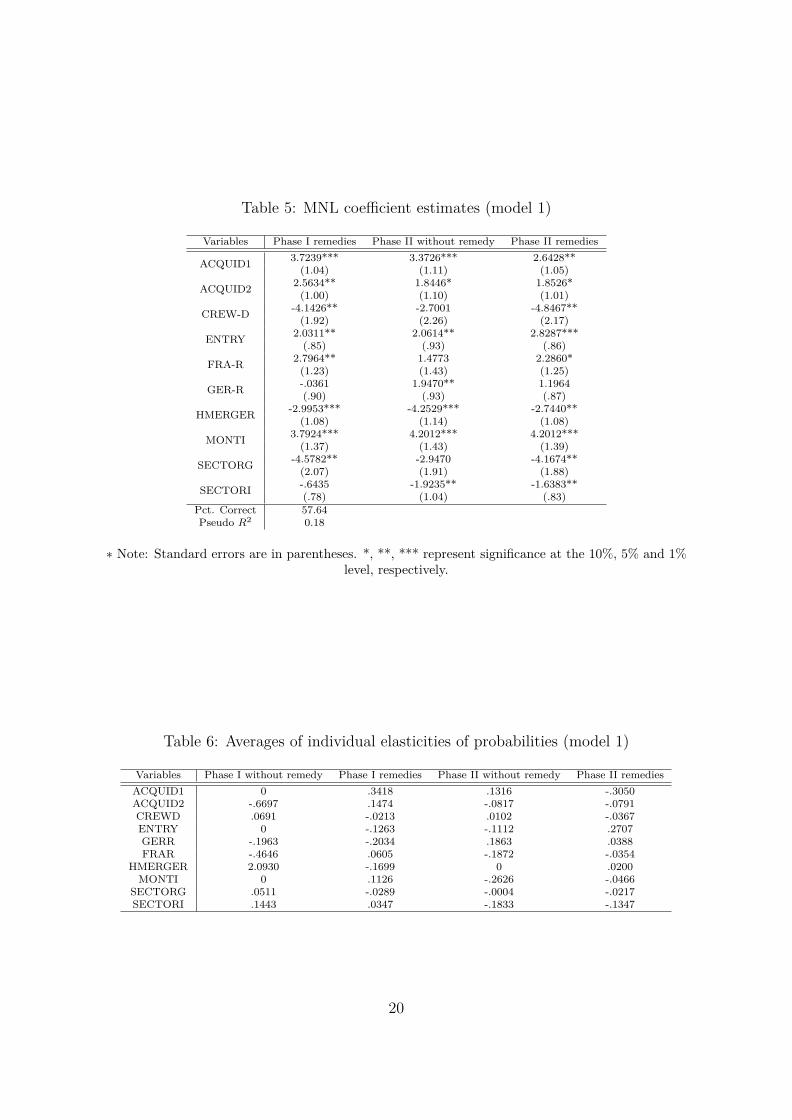
Table 5: MNL coefficient estimates (model 1)
Variables Phase I remedies Phase II without remedy Phase II remedies
ACQUID13.7239*** 3.3726*** 2.6428**
(1.04) (1.11) (1.05)
ACQUID22.5634** 1.8446* 1.8526*
(1.00) (1.10) (1.01)
CREW-D-4.1426** -2.7001 -4.8467**
(1.92) (2.26) (2.17)
ENTRY2.0311** 2.0614** 2.8287***
(.85) (.93) (.86)
FRA-R2.7964** 1.4773 2.2860*
(1.23) (1.43) (1.25)
GER-R-.0361 1.9470** 1.1964(.90) (.93) (.87)
HMERGER-2.9953*** -4.2529*** -2.7440**
(1.08) (1.14) (1.08)
MONTI3.7924*** 4.2012*** 4.2012***
(1.37) (1.43) (1.39)
SECTORG-4.5782** -2.9470 -4.1674**
(2.07) (1.91) (1.88)
SECTORI-.6435 -1.9235** -1.6383**(.78) (1.04) (.83)
Pct. Correct 57.64Pseudo R2 0.18
∗ Note: Standard errors are in parentheses. *, **, *** represent significance at the 10%, 5% and 1%level, respectively.
Table 6: Averages of individual elasticities of probabilities (model 1)
Variables Phase I without remedy Phase I remedies Phase II without remedy Phase II remedies
ACQUID1 0 .3418 .1316 -.3050ACQUID2 -.6697 .1474 -.0817 -.0791CREWD .0691 -.0213 .0102 -.0367ENTRY 0 -.1263 -.1112 .2707GERR -.1963 -.2034 .1863 .0388FRAR -.4646 .0605 -.1872 -.0354
HMERGER 2.0930 -.1699 0 .0200MONTI 0 .1126 -.2626 -.0466
SECTORG .0511 -.0289 -.0004 -.0217SECTORI .1443 .0347 -.1833 -.1347
20
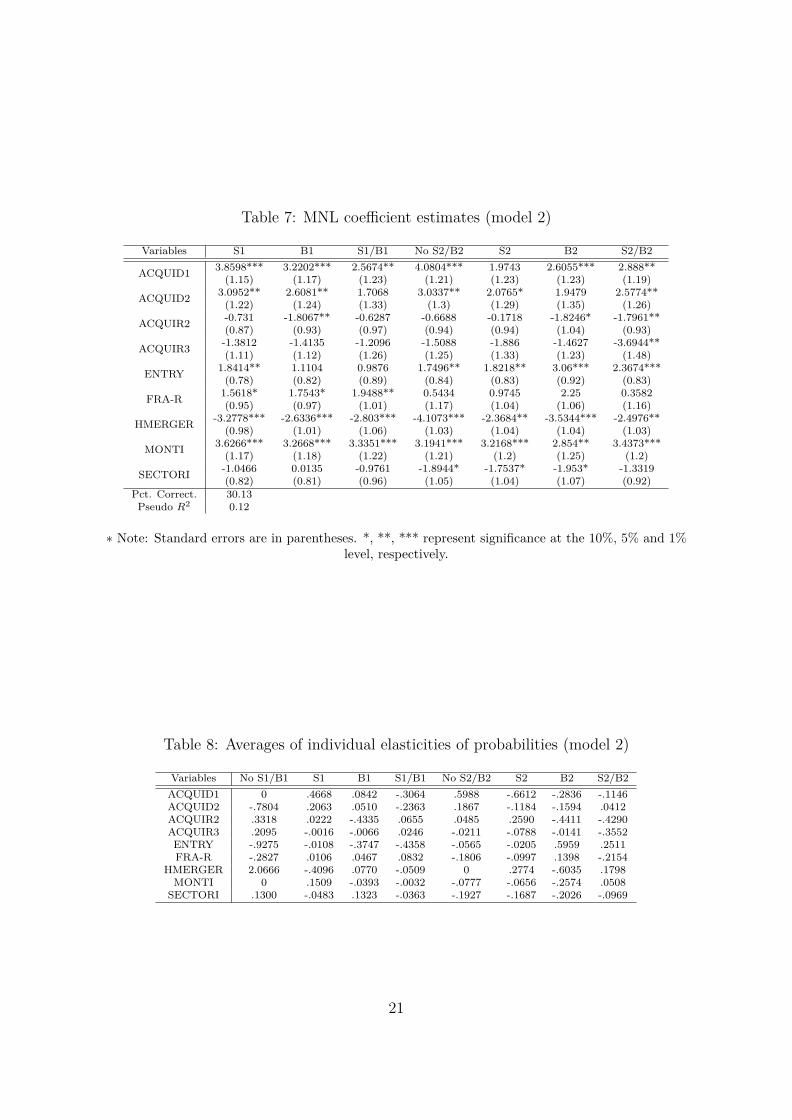
Table 7: MNL coefficient estimates (model 2)
Variables S1 B1 S1/B1 No S2/B2 S2 B2 S2/B2
ACQUID13.8598*** 3.2202*** 2.5674** 4.0804*** 1.9743 2.6055*** 2.888**
(1.15) (1.17) (1.23) (1.21) (1.23) (1.23) (1.19)
ACQUID23.0952** 2.6081** 1.7068 3.0337** 2.0765* 1.9479 2.5774**
(1.22) (1.24) (1.33) (1.3) (1.29) (1.35) (1.26)
ACQUIR2-0.731 -1.8067** -0.6287 -0.6688 -0.1718 -1.8246* -1.7961**(0.87) (0.93) (0.97) (0.94) (0.94) (1.04) (0.93)
ACQUIR3-1.3812 -1.4135 -1.2096 -1.5088 -1.886 -1.4627 -3.6944**(1.11) (1.12) (1.26) (1.25) (1.33) (1.23) (1.48)
ENTRY1.8414** 1.1104 0.9876 1.7496** 1.8218** 3.06*** 2.3674***
(0.78) (0.82) (0.89) (0.84) (0.83) (0.92) (0.83)
FRA-R1.5618* 1.7543* 1.9488** 0.5434 0.9745 2.25 0.3582(0.95) (0.97) (1.01) (1.17) (1.04) (1.06) (1.16)
HMERGER-3.2778*** -2.6336*** -2.803*** -4.1073*** -2.3684** -3.5344*** -2.4976**
(0.98) (1.01) (1.06) (1.03) (1.04) (1.04) (1.03)
MONTI3.6266*** 3.2668*** 3.3351*** 3.1941*** 3.2168*** 2.854** 3.4373***
(1.17) (1.18) (1.22) (1.21) (1.2) (1.25) (1.2)
SECTORI-1.0466 0.0135 -0.9761 -1.8944* -1.7537* -1.953* -1.3319(0.82) (0.81) (0.96) (1.05) (1.04) (1.07) (0.92)
Pct. Correct. 30.13Pseudo R2 0.12
∗ Note: Standard errors are in parentheses. *, **, *** represent significance at the 10%, 5% and 1%level, respectively.
Table 8: Averages of individual elasticities of probabilities (model 2)
Variables No S1/B1 S1 B1 S1/B1 No S2/B2 S2 B2 S2/B2
ACQUID1 0 .4668 .0842 -.3064 .5988 -.6612 -.2836 -.1146ACQUID2 -.7804 .2063 .0510 -.2363 .1867 -.1184 -.1594 .0412ACQUIR2 .3318 .0222 -.4335 .0655 .0485 .2590 -.4411 -.4290ACQUIR3 .2095 -.0016 -.0066 .0246 -.0211 -.0788 -.0141 -.3552ENTRY -.9275 -.0108 -.3747 -.4358 -.0565 -.0205 .5959 .2511FRA-R -.2827 .0106 .0467 .0832 -.1806 -.0997 .1398 -.2154
HMERGER 2.0666 -.4096 .0770 -.0509 0 .2774 -.6035 .1798MONTI 0 .1509 -.0393 -.0032 -.0777 -.0656 -.2574 .0508
SECTORI .1300 -.0483 .1323 -.0363 -.1927 -.1687 -.2026 -.0969
21
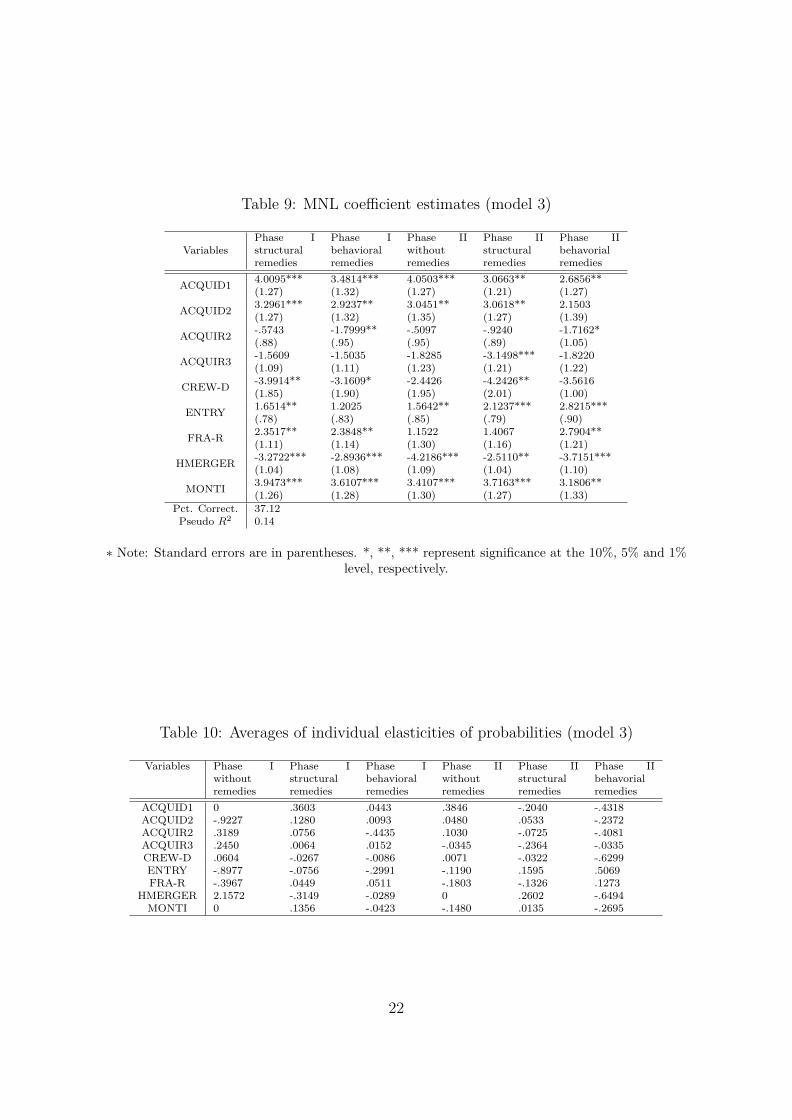
Table 9: MNL coefficient estimates (model 3)
VariablesPhase Istructuralremedies
Phase Ibehavioralremedies
Phase IIwithoutremedies
Phase IIstructuralremedies
Phase IIbehavorialremedies
ACQUID14.0095*** 3.4814*** 4.0503*** 3.0663** 2.6856**(1.27) (1.32) (1.27) (1.21) (1.27)
ACQUID23.2961*** 2.9237** 3.0451** 3.0618** 2.1503(1.27) (1.32) (1.35) (1.27) (1.39)
ACQUIR2-.5743 -1.7999** -.5097 -.9240 -1.7162*(.88) (.95) (.95) (.89) (1.05)
ACQUIR3-1.5609 -1.5035 -1.8285 -3.1498*** -1.8220(1.09) (1.11) (1.23) (1.21) (1.22)
CREW-D-3.9914** -3.1609* -2.4426 -4.2426** -3.5616(1.85) (1.90) (1.95) (2.01) (1.00)
ENTRY1.6514** 1.2025 1.5642** 2.1237*** 2.8215***(.78) (.83) (.85) (.79) (.90)
FRA-R2.3517** 2.3848** 1.1522 1.4067 2.7904**(1.11) (1.14) (1.30) (1.16) (1.21)
HMERGER-3.2722*** -2.8936*** -4.2186*** -2.5110** -3.7151***(1.04) (1.08) (1.09) (1.04) (1.10)
MONTI3.9473*** 3.6107*** 3.4107*** 3.7163*** 3.1806**(1.26) (1.28) (1.30) (1.27) (1.33)
Pct. Correct. 37.12Pseudo R2 0.14
∗ Note: Standard errors are in parentheses. *, **, *** represent significance at the 10%, 5% and 1%level, respectively.
Table 10: Averages of individual elasticities of probabilities (model 3)
Variables Phase Iwithoutremedies
Phase Istructuralremedies
Phase Ibehavioralremedies
Phase IIwithoutremedies
Phase IIstructuralremedies
Phase IIbehavorialremedies
ACQUID1 0 .3603 .0443 .3846 -.2040 -.4318ACQUID2 -.9227 .1280 .0093 .0480 .0533 -.2372ACQUIR2 .3189 .0756 -.4435 .1030 -.0725 -.4081ACQUIR3 .2450 .0064 .0152 -.0345 -.2364 -.0335CREW-D .0604 -.0267 -.0086 .0071 -.0322 -.6299ENTRY -.8977 -.0756 -.2991 -.1190 .1595 .5069FRA-R -.3967 .0449 .0511 -.1803 -.1326 .1273
HMERGER 2.1572 -.3149 -.0289 0 .2602 -.6494MONTI 0 .1356 -.0423 -.1480 .0135 -.2695
22

Umatrix
0.808
1.71
2.61
d 0.0381
0.508
0.978
HMERGER
d 0.00377
0.223
0.442
VMERGER
d 0.00699
0.442
0.877
JVMERGER
d 0.000497
0.0318
0.0631
VMERGERH
d 0.00743
0.456
0.904
USR
d 0.00403
0.24
0.475
UKR
d 0.0124
0.353
0.693
GERR
d 0.00444
0.284
0.564
HOLR
d 0.00711
0.305
0.604
FRAR
Figure 1: U -matrix and component planes for the EC merger data set (part 1)
23

Umatrix
0.808
1.71
2.61
d 0.00626
0.357
0.707
SCANR
d 0.00711
0.323
0.639
OTHERR
d 0.00322
0.205
0.406
INTERR
d 0.00554
0.354
0.703
CREWR
d 0.0062
0.397
0.787
USD
d 0.0165
0.238
0.46
UKD
d 0.0226
0.319
0.615
GERD
d 0.00581
0.372
0.738
HOLD
d 0.00483
0.308
0.61
FRAD
d 0.00557
0.356
0.707
SCAND
Figure 2: U -matrix and component planes for the EC merger data set (part 2)
24
Umatrix
0.808
1.71
2.61
d 0.0186
0.32
0.621
OTHERD
d 0.00225
0.144
0.285
INTERD
d 0.000844
0.054
0.107
CREWD
d 0.00517
0.331
0.656
JVD
d 0.0796
0.422
0.765
ACQUIR1
d 0.109
0.506
0.903
ACQUIR2
d 0.0195
0.192
0.364
ACQUIR3
d 0.00401
0.257
0.51
ACQUIR4
d 0.236
0.562
0.888
ACQUID1
d 0.0674
0.373
0.678
ACQUID2
Figure 3: U -matrix and component planes for the EC merger data set (part 3)
25

Umatrix
0.808
1.71
2.61
d 0.00134
0.0859
0.17
ACQUID3
d 0.00193
0.123
0.245
ACQUID4
d 28.8
905
1780
TURNOVER
d 0.21
0.491
0.773
ENTRY
d 0.0193
0.305
0.591
WORLD
d 0.34
0.554
0.768
MONTI
d 0.00075
0.048
0.0953
SECTORA
d 0.00179
0.115
0.227
SECTORC
d 0.11
0.488
0.866
SECTORD
d 0.00502
0.321
0.638
SECTORE
Figure 4: U -matrix and component planes for the EC merger data set (part 4)
26
Umatrix
0.808
1.71
2.61
d 0.000981
0.0628
0.125
SECTORF
d 0.00272
0.174
0.345
SECTORG
d 0.000489
0.0313
0.0621
SECTORH
d 0.00742
0.237
0.466
SECTORI
d 0.00199
0.125
0.249
SECTORJ
d 0.000867
0.0555
0.11
SECTORK
d 0.000489
0.0313
0.0621
SECTORL
d 0.000788
0.0505
0.1
SECTORN
d 0.00193
0.124
0.245
SECTORO
Figure 5: U -matrix and component planes for the EC merger data set (part 5)
27

S1
S1
SB2
S1
NC1
S1
S1
B1
S1
S2
NC2
B2
S1
S1
B1
SB1
B1
B1
SB2
NC2
B1
S1
B1
B1
B1
S1
S1
S1
B1
NC1
NC2
S2
B1
SB1
B2
NC2
B2
SB2
NC2
B1
B1
S1
NC2
S1
NC2
S1
SB2
NC2
B2
S2
S2
S1
S1
NC1
B1
S1
SB2
B2
B1
B2
Figure 6: U -matrix for the EC merger data set
28