men and women in karnataka 2013-14des.kar.nic.in/sites/report on men and women in karnataka...des...
TRANSCRIPT
DES NO/09/2014
GOVERNMENT OF KARNATAKA
Men and Women in Karnataka
2013-14
September 2014
Publication, Training and Co-ordination Division
Directorate of Economics & Statistics,
Bangalore
PREFACE
The Directorate of Economics and Statistics has brought out the Annual
Publication of “Men and Women in Karnataka for the year 2013-14”. The
publication is intended to provide a bird’s eye view of the present status of
Women. This publication is prepared by collecting the information on various
statistical indicators which are available in different published sources. I am
confident that planners, administrators, research scholars and other stakeholders
working in the area of women’s empowerment would find this document a
useful tool for improving the status of women in Karnataka.
I wish to express my sincere gratitude to the Departments/Organizations of
Central and State Government who have extended their whole hearted co-
operation in furnishing the required data, on the basis of which the report has
been brought out on time.
This is the report which should be brought out within 30th September 2014 as
per the department Results Frame Work Documents (RFDs). I congratulate the
officers and staff of the Publication, Training and Co-ordination Division, who
are responsible to bring out our Publication within the targeted date.
Suggestions for improvement of this Publication are most welcome.
Sd-
K.Lakshmipathy Director
Bangalore Date:11-09-2014.
SL.
NO.
CHAPTER PAGE NO.
1 Introduction 1-3
2 Rights and Privileges of women in India 4-6
3 Special initiatives for women 7-8
4 Demography and Vital Statistics 9-11
5 Child Development 12-16
6 Early Marriage 17-18
7 Child Labour 19-21
8 Health and Nutrition 22-24
9 Education 25-26
10 Women and Economy 27-30
11 Support services to women 31-36
12 Crime against women and children 37-38
13 Political participation of women and women in
decision making 38A
14 Tables 39-99
TABLE
NO.
SUBJECT PAGE
NO.
1 Population and Percentage share of female Population, Literacy Rate
and Density : 2011 Census
39
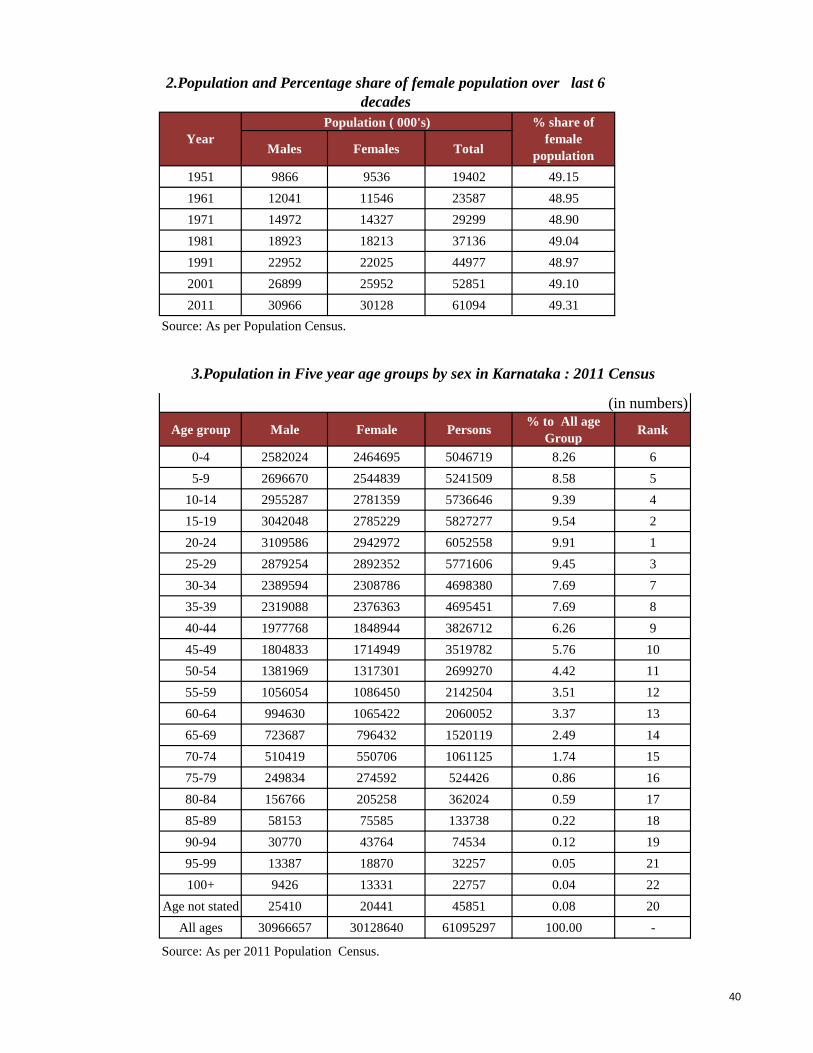
2 Population and Percentage share of female Population over last
6 decades
40
3 Population in Five year age groups by sex in Karnataka : 2011 Census 40
4 Scheduled Castes (SC) Population in five year age groups by sex in
Karnataka
41
5 Scheduled Tribes (ST) Population in five year age groups by sex in
Karnataka
41
6 Sex Ratio (Number of Female per 1000 Males) 42
7 Child Population (0-6 Years) 2001 and 2011 43
8 Sex Ratio (0-6 age group) 44
9 Birth rate, Death rate and Infant Mortality rate – Karnataka from 1970
to 2012
45
10 Life expectancy at birth 46-46a
11 Total Fertility Rate 47
12 Age Specific Fertility Rates by Level of Education of Women 48
13 Percentage distribution of Population by sex, marital status and age
group : 2012
49
14 Age Specific Marital Fertility Rates : 2012 50
15 Age Specific Fertility Rate : 2012 50
16 Age Specific Death Rate : 2012 51
17 Birth Rate and Death Rate : 2011 52
18 Registered Number of Births, Deaths, Still Births in Karnataka 53
19 Percentage of Live Births by order of Birth in Karnataka : 2012 53
20 Working Women’s Hostels sanctioned, women benefited, No.of day
care centers : 2013-14
54
21 Physical and Financial Progress for Supplementary Nutrition
Programme & Kishori shakti Yojana : 2013-14
55
22 No.of Beneficiaries under Bhagyalakshmi Scheme 56
22(a) Details of Child Labours Mainstreamed 56a
23 Class wise Enrolment from 2000-2001 to 2013-14 57
24 Drop-out at Different Stages of School Education in Karnataka from
2000-2001 to 2013-14
58
25 Percentage of Women aware of HIV/AIDS : 2013-14 59
26 Literacy rates by sex in rural and urban areas (Percentage) : 2011 60-60a
27 Enrolment in all management schools in Karnataka : 2013-14 61
28 No.of Bicycles distributed for VIII Standard Students : 2013-14 62
29 No.of Teachers and Female Teachers Ratio in all Management Schools
in Karnataka (Lower, Upper Primary Schools & High Schools : 2013-14
63
30 District-wise Gender Parity Index : 2013-14 64
31 The Student Strength in Pre-University : 2013-14 and Number of
students attended and passed II PUC examination during March 2014
65-66
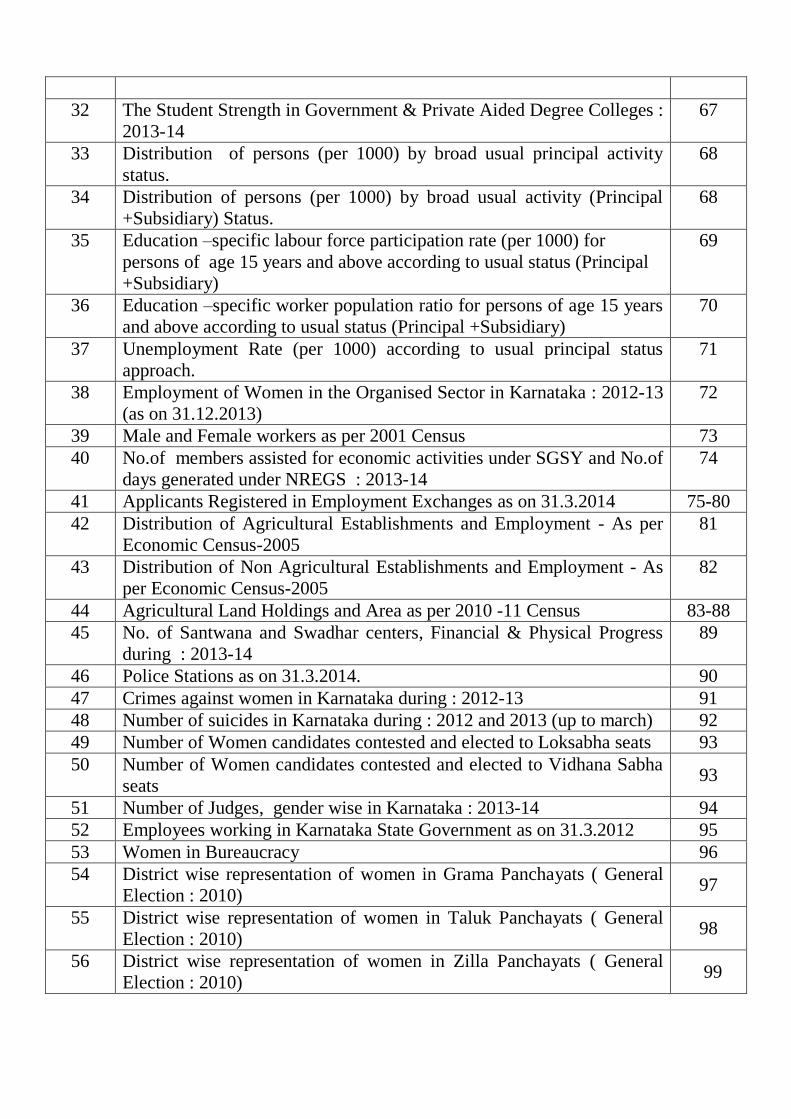
32 The Student Strength in Government & Private Aided Degree Colleges :
2013-14
67
33 Distribution of persons (per 1000) by broad usual principal activity
status.
68
34 Distribution of persons (per 1000) by broad usual activity (Principal
+Subsidiary) Status.
68
35 Education –specific labour force participation rate (per 1000) for
persons of age 15 years and above according to usual status (Principal
+Subsidiary)
69
36 Education –specific worker population ratio for persons of age 15 years
and above according to usual status (Principal +Subsidiary)
70
37 Unemployment Rate (per 1000) according to usual principal status
approach.
71
38 Employment of Women in the Organised Sector in Karnataka : 2012-13
(as on 31.12.2013)
72
39 Male and Female workers as per 2001 Census 73
40 No.of members assisted for economic activities under SGSY and No.of
days generated under NREGS : 2013-14
74
41 Applicants Registered in Employment Exchanges as on 31.3.2014 75-80
42 Distribution of Agricultural Establishments and Employment - As per
Economic Census-2005
81
43 Distribution of Non Agricultural Establishments and Employment - As
per Economic Census-2005
82
44 Agricultural Land Holdings and Area as per 2010 -11 Census 83-88
45 No. of Santwana and Swadhar centers, Financial & Physical Progress
during : 2013-14
89
46 Police Stations as on 31.3.2014. 90
47 Crimes against women in Karnataka during : 2012-13 91
48 Number of suicides in Karnataka during : 2012 and 2013 (up to march) 92
49 Number of Women candidates contested and elected to Loksabha seats 93
50 Number of Women candidates contested and elected to Vidhana Sabha
seats 93
51 Number of Judges, gender wise in Karnataka : 2013-14 94
52 Employees working in Karnataka State Government as on 31.3.2012 95
53 Women in Bureaucracy 96
54 District wise representation of women in Grama Panchayats ( General
Election : 2010) 97
55 District wise representation of women in Taluk Panchayats ( General
Election : 2010) 98
56 District wise representation of women in Zilla Panchayats ( General
Election : 2010) 99

EXPLANATORY NOTES
Sex Ratio
Sex Ratio is the ratio of females to males in given population, usually
expressed as the number of females for every 1000 males.
Labour force
Labour force is defined as the total persons working (or employed) and
seeking or available for work (or unemployed)
Work force
Persons engaged in any gainful activity are considered as workers
(or employed). They are the persons assigned any one or more of the nine
activity categories under the first broad activity category i.e. “Working or
employed”
Employed and Unemployed
According to usual status approach, (with a reference period of 365 days)
adopted by National Sample Survey Organization (NSSO) a person is
considered as working or employed if He / She is engaged relatively for a
longer time, during the reference period of last 365 days in any one or more of
the work activities. He / She is considered as seeking or available for work or
unemployed if he/she is not working but is either seeking or available for work
for a relatively longer period of the specified reference period.
Suicide rate
Suicide rate is defined as the number of suicides per lakh population.
Total Fertility rate
Total fertility rate is defined as the average number of children that would
be born to a woman if she experiences the current fertility pattern through her
reproductive span (15-49 years).
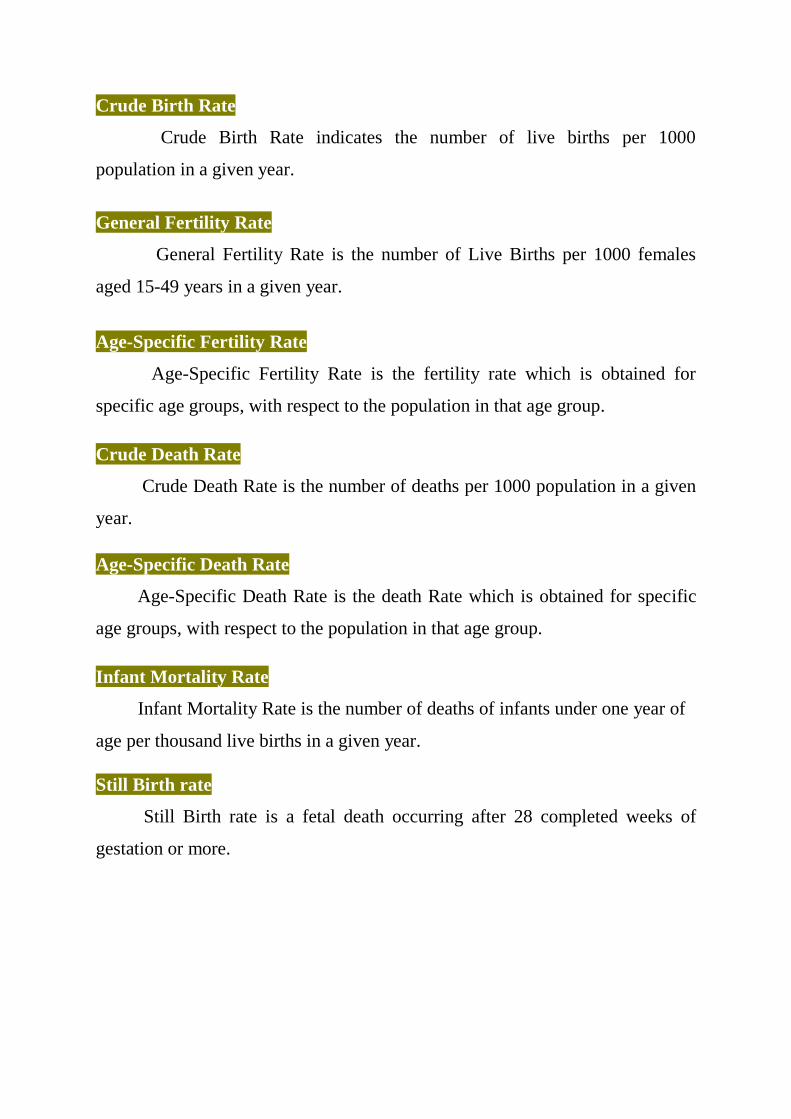
Crude Birth Rate
Crude Birth Rate indicates the number of live births per 1000
population in a given year.
General Fertility Rate
General Fertility Rate is the number of Live Births per 1000 females
aged 15-49 years in a given year.
Age-Specific Fertility Rate
Age-Specific Fertility Rate is the fertility rate which is obtained for
specific age groups, with respect to the population in that age group.
Crude Death Rate
Crude Death Rate is the number of deaths per 1000 population in a given
year.
Age-Specific Death Rate
Age-Specific Death Rate is the death Rate which is obtained for specific
age groups, with respect to the population in that age group.
Infant Mortality Rate
Infant Mortality Rate is the number of deaths of infants under one year of
age per thousand live births in a given year.
Still Birth rate
Still Birth rate is a fetal death occurring after 28 completed weeks of
gestation or more.

1
CHAPTER 1
INTRODUCTION
1.1 Women and men do not play identical roles in any society; nor do they have
equal access to education, work, career opportunities and economic resources.
This means that political and economic leadership is also unequally shared,
which leads to gender disparities in the enjoyment of benefits from economic
and social development. In recent decades, advocates of women's rights have
drawn attention to these facts and the need to consider them in policy and
programme formulation.
1.2 A gender issue is an issue or concern determined by gender based and/or sex
based differences between women and men. Gender issues are all aspects and
concerns with how women and men inter-relate, their differences in access to
and use of resources, their activities and how they react to changes,
interventions and policies.
1.3 The principle of gender equality is enshrined in the Indian Constitution in its
Preamble, Fundamental Rights, Fundamental Duties and Directive Principles.
The Constitution not only grants equality to women, but also empowers the
State to adopt measures of positive discrimination in favour of women. Within
the framework of a democratic policy, our laws, development policies, Plans
and programmes have aimed at women‟s advancement in different spheres.
From the Fifth Five Year Plan (1974-78) onwards there has been a marked shift
in the approach to women‟s issues from welfare to development. In recent
years, the empowerment of women has been recognized as the central issue in
determining the status of women.

2
1.4 The National Commission for Women was set up by an Act of Parliament in
1990 to safeguard the rights and legal entitlements of women. The 73rd
and 74th
Amendments (1993) to the Constitution of India have provided for reservation
of seats in the local bodies of Panchayats and Municipalities for women, laying
a strong foundation for their participation in decision making at the local levels.
The women‟s movement and a wide-spread network of non-Government
Organizations which have strong grass-roots presence and deep insight into
women‟s concerns have contributed in inspiring initiatives for the
empowerment of women.
1.5 Gender disparity manifests itself in various forms, the most obvious being
the trend of continuously declining sex ratio in the population in the last few
decades. Social stereotyping and violence at the domestic and social levels are
some of the other manifestations. Discrimination against girl children,
adolescent girls and women persists in parts of the country.
1.6 Social development indices viz., nutrition, health and education are being
recognized as important pre-requisites for development of human resources of
the country. The nutritional status of vulnerable section of the community i.e.,
children, pregnant women, lactating mother and adolescent girls is considered
as an important indicator for national development
1.7 The status of women is a key factor for determining the development of any
society. In the area of gender and development, the Commonwealth has given a
blue print for action to all their Member Countries. States to transform the
Commonwealth vision for women into reality. Efforts will surely bring about a
day when women and men will take equal position in all walks of life.
3
1.8 Gender based Budgeting is nowadays felt essential for the upliftment of
women socially and economically. Gender budgeting is to create separate
budget for males and females. Attempts should be made to segregate the budget
by gender and to assess gender distribution of resource benefits. It will
highlight the different needs of male and female warranting differential
allocation of expenditure.
4
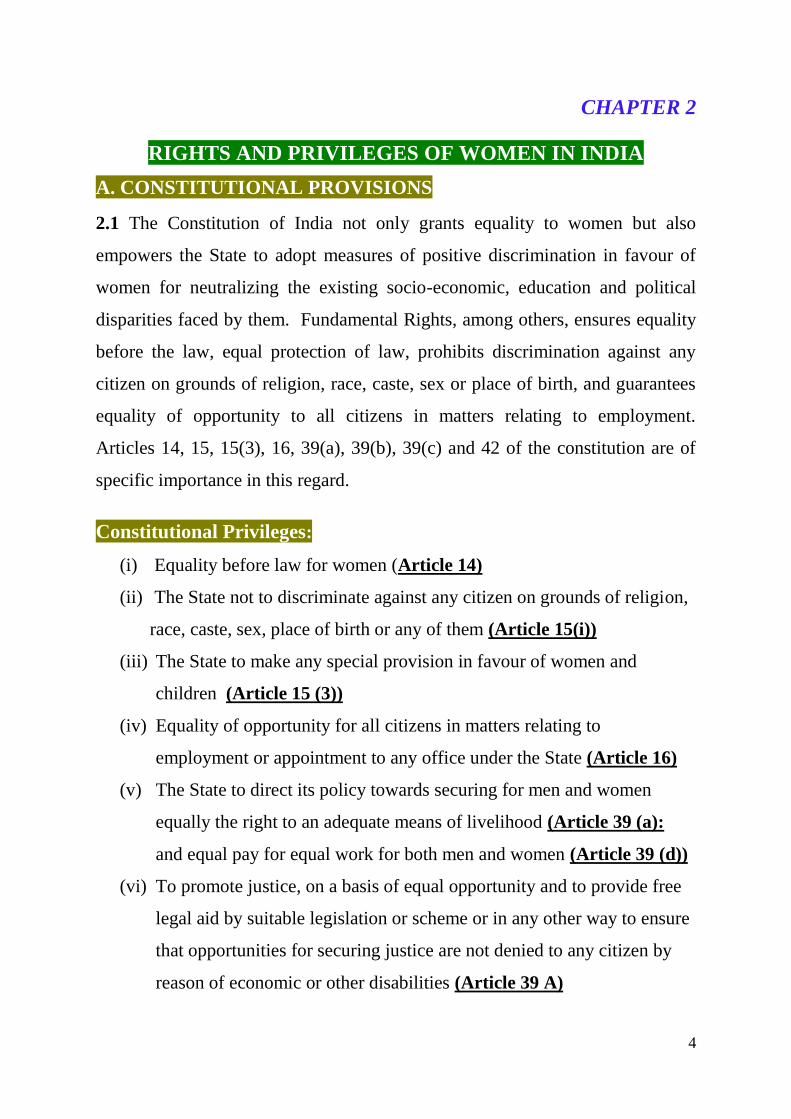
CHAPTER 2
RIGHTS AND PRIVILEGES OF WOMEN IN INDIA
A. CONSTITUTIONAL PROVISIONS
2.1 The Constitution of India not only grants equality to women but also
empowers the State to adopt measures of positive discrimination in favour of
women for neutralizing the existing socio-economic, education and political
disparities faced by them. Fundamental Rights, among others, ensures equality
before the law, equal protection of law, prohibits discrimination against any
citizen on grounds of religion, race, caste, sex or place of birth, and guarantees
equality of opportunity to all citizens in matters relating to employment.
Articles 14, 15, 15(3), 16, 39(a), 39(b), 39(c) and 42 of the constitution are of
specific importance in this regard.
Constitutional Privileges:
(i) Equality before law for women (Article 14)
(ii) The State not to discriminate against any citizen on grounds of religion,
race, caste, sex, place of birth or any of them (Article 15(i))
(iii) The State to make any special provision in favour of women and
children (Article 15 (3))
(iv) Equality of opportunity for all citizens in matters relating to
employment or appointment to any office under the State (Article 16)
(v) The State to direct its policy towards securing for men and women
equally the right to an adequate means of livelihood (Article 39 (a):
and equal pay for equal work for both men and women (Article 39 (d))
(vi) To promote justice, on a basis of equal opportunity and to provide free
legal aid by suitable legislation or scheme or in any other way to ensure
that opportunities for securing justice are not denied to any citizen by
reason of economic or other disabilities (Article 39 A)

5
(vii) The State to make provision for securing just and humane conditions
of work and for maternity relief (Article 42)
(viii) The State to promote with special care for the educational and
economic interests of the weaker sections of the people and to protect
them from social injustice and all forms of exploitation (Article 46)
(ix) The State to raise the level of nutrition and the standard of living of its
people and the improvement of public health (Article 47)
(x) To promote harmony and the spirit of common brotherhood amongst
all the people of India and to renounce practices derogatory to the
dignity of women (Articles 51 (A) (e) )
(xi) Not less than one-third (including the number of seats reserved for
women belonging to the Scheduled Castes and the Scheduled Tribes)
of the total number of seats to be filled by direct election in every
panchayat to be reserved for women and such seats to be allotted by
rotation to different constituencies in a panchayat (Article 243 D(3)
(xii) Not less than one third of the total number of offices of Chairpersons
in the Panchayats at each level to be reserved for women (Article 243
D(4)
(xiii) Not less than one-third (including the number of seats reserved for
women belonging to the Scheduled Castes and the Scheduled Tribes)
of the total number of seats to be filled by direct election in every
Municipality reserved for women and such seats to be allotted by
rotation to different constituencies in a Municipality (Article 243
T(3))
(xiv) Reservation of offices of Chairpersons in Municipalities for the
scheduled Castes, the Scheduled Tribes and Women in such manner as
the legislature of a State may by law provide (Article 243 T (4))
6
B. LEGISLATIVE PROVISIONS
2.2 To uphold the Constitutional mandate, the State has enacted various
legislative measures intended to ensure equal rights, to counter social
discrimination and various forms of violence and atrocities and to provide
support services especially to working women .
2.3 Important social legislations relating to women are:
(i) The Maternity Benefit Act, 1961;
(ii) The Medical Termination of Pregnancy Act, 1971;
(iii) The Dowry Prohibition Act, 1961;
(iv) The Karnataka Marriage Act, 1976
(v) The Immoral Traffic (Prevention) Act, 1956;
(vi) The Indecent Representation of Women(Prohibition)Act, 1986;
(vii) The Commission of Sati (Prevention) Act, 1987;
(viii) Equal right for women in parental property (Amendment ) Bill
2004
(xi) Protection of Women from Domestic Violence Act 2005
7
CHAPTER 3
SPECIAL INITIATIVES FOR WOMEN
3.1 National Commission for Women:
In January 1992, the Government set-up this statutory body with a specific
mandate to study and monitor all matters relating to the constitutional and
legal safeguards provided for women and review the existing legislation to
suggest amendments wherever necessary etc.,
3.2 Reservation for Women in Local Self-Government
The 72nd and 73rd
Constitution Amendment Acts passed in 1992 by
Parliament ensures one-third of the total seats for women in all elected
offices in local bodies whether in rural areas or urban areas.
3.3 The National Plan of Action for the Girl Child (1991 –2000)
The Plan of Action is to ensure survival, protection and development of the
girl child with the ultimate objective of building up a better future for the
girl child.
3.4 National Policy for the Empowerment of Women, 2001
The Department of Women and Child Development in the Ministry of
Human Resource Development has prepared a “National Policy for the
Empowerment of Women” in the year 2001. The goal of this policy is to
bring about the advancement, development and empowerment of women.
3.5 National Social Assistance Programmme (NSAP):
This programme comprises of Indira Gandhi National Old Age Pension
Scheme, Indira Gandhi National Widow Pension Scheme, Indira Gandhi
National Disabled Pension Scheme and National Family Benefit scheme.

8
i) Indira Gandhi National Old age Pension Scheme:
Government of India has reduced the age limit of the beneficiaries from 65
years to 60 years. Rs. 200 per month will be paid to the beneficiaries aged
between 60 to 64 years, Rs.500 per month to the beneficiaries aged
between 65 to 80 years, of which Rs.300 per month is paid by GOI and
Rs.300 is paid by GOK. Rs.750 per month will be paid to the beneficiaries
aged above 80 years belonging to BPL household, of which Rs.500 per
month is paid by GOI and Rs.250 is paid by GOK.
ii) National Family Benefits Scheme
To help the families below poverty line during the time of distress caused
due to death of principal bread earner aged between 18 to 59 years of the
family. Rs.20,000 (one time payment) is paid to the family.
iii) Indira Gandhi National Widow Pension Scheme
In the case of widows aged above 18-39 years belonging to BPL
households, pension Rs. 500 will be paid by GOK. For beneficiaries aged
between 40-79 years, Rs.500 per month is paid, of which Rs.200 by GOK
& Rs.300 by GOI will be paid till she remarries or her income limit crosses
Rs.12,000 (rural areas) and Rs. 17,000 (urban areas) per annum or till her
death.
iv) Indira Gandhi Disabled Pension Scheme (PHP):
Rs. 500 per month is contributed by GOK to those persons aged between 0
to 17 years belonging to BPL household and Rs. 500 per month is paid to
beneficiaries aged between 18 to 79 years, of which Rs.200 from GOK &
Rs.300 from GOI. Above 75% disability, Rs. 1200 is paid to beneficiaries
from GOK.
9
CHAPTER 4
DEMOGRAPHY AND VITAL STATISTICS
4.1 It is a widely known fact that women live longer than men. At the same
time it is also a fact that there are less number of women than men. The sex
ratio having declined continuously tends to move up since 1991. Details on
population and percentage share of female population, life expectancy rate and
density as per 2011 census are given in Table 1 and 2. Details on population in
five year age groups by sex are given in Table 3, and details on Scheduled
Castes and Scheduled Tribes population in five year age groups in Karnataka
are given in Table 4 & 5 respectively. The number of females per 1000 males
as per 2011 census is 973 and as per 2001 census it was 965, hence there is
slight increase in the number of females. The details are given in Table 6.
4.2 The Child Population in the age group (0-6 years) as per Census of India
2001 and 2011 are given in Table 7. In comparison to 2001 child population
census figure with that of 2011 there is an overall total decline in both male
and female child population. The sex ratio in 0-6 age group has declined
sharply from 960 in 1991 to 946 in 2001 and again there was a slight raise from
946 in 2001 to 948 as per 2011 Census. The details are given in table No.8.
4.3 During the year 2012, combined birth rate is 18.5, combined death rate is
7.1 and combined infant mortality rate is 32. Details of Birth rate, Death rate
and Infant Mortality rate from 1971 to 2012 are given in Table 9.
4.4 As per Human Development Report of 2005 the Life Expectancy at Birth
during 1991-92 in Karnataka was 62.1, whereas it was 65.8 in 2001-02. District
wise life expectancy at birth for the years 1991-92 and 2001-02 is given in
Table 10.
10
4.5 The Total Fertility Rate (TFR) declined from 3.9 in 1991 to 2.4 in 2001. The
decline in Total Fertility Rate is due to improved contraceptives, increased
knowledge and acceptance of contraceptives, and reduced child
mortality. Economic reasons for the decline in fertility rates include high rates
of urbanization, increase in the cost of living, increased education of women has
raised their earning power and increased the "opportunity cost" of child bearing
and child rearing, and rapid technological change has raised the rate of return to
human capital and education. High rates of return to human capital and
education has raised the incentives of parents to invest in their children's
education and to substitute quality for quantity in family size decisions. The
district wise details of total fertility rate are given in Table 11. The general
fertility rate is 38.5 and the total fertility rate is 2.2 among illiterate women and
the corresponding rates are 74.6 and 1.9 for literate women. The fertility
indicators by level of education for the year 2012 are given in Table 12.
4.6 The Percentage distribution of population by sex, marital status of all ages
during 2012 was 38.3 in respect of never married women, 49.4 in respect of
married women and 12.4 in respect of widowed/divorced and separated women
and the details are given in Table 13.
4.7 Total marital fertility rate is 3.7 and 3.8 in Rural and 3.5 in Urban. The
Age specific marital fertility rate and age specific fertility rate, for the year
2012, are given in table 14 and 15.
4.8 All ages crude Death rate is 7.1 in total, where as it is 7.8 in male & 6.4 in
female. Age specific death rates for male & female is given in table 16.
4.9 Districtwise Birth rate and Death rate for the year 2011 are given
in table 17.
4.10 During the year 2011, in Karnataka the registered number of live births
was 11.09 lakhs, still birth was 6940, deaths was 3.85 lakhs and maternal death
11
was 1029. Live births, still births, birth rate, Deaths, Death rate, Infant death
are given in table 18.
4.11 Percentage of live births by order of birth for the year 2012, for 5th
birth
order was 1.7 in rural areas and 0.7 in urban areas, the details are given in the
table 19.
12
CHAPTER 5
CHILD DEVELOPMENT
As per the 2011 census Karnataka has a total population of 61.09
millions of which children in the age group 0-6 constitute 11.72. The
programmes, policies and schemes of the department are aimed at a holistic
development of children in terms of tackling by declining sex ratio, infant
mortality, health and nutrition issues, early childhood education, protection of
rights of children, prevention of child abuse and exploitation, provision of care
and protection etc.
5.1 Day Care Centers (Creches)
Creches directly benefit children in the pre-school age by providing pre-
school education, supplementary nutrition and opportunities for psychosocial
development and recreation. They also indirectly benefit mothers by giving
them an opportunity to join the workforce, as creche workers look after the
children, while mothers are at work. The numbers of day care centers in
Karnataka for the year 2013-14 are 87 and district wise information is given in
Table 20.
5.2 Integrated Child Development Services (ICDS)
The Integrated Child Development Service (ICDS) is a centrally sponsored
flagship programme, which provides package of services viz., supplementary
nutrition, immunization, health check-up, referral services, health and nutrition
education for mothers and non-formal pre-school education for 3-6 years
children. Eligible beneficiaries covered under the scheme are children below
six years of age, pregnant women, nursing mothers and adolescent girls. The
package of services is provided to the beneficiaries through the Anganwadi
Centers managed by an Anganwadi Worker and Helper at the Village Level and
13
also in Urban Slums. At present 61187 Anganwadi Centres and 3331 mini
anganwadis are functioning in 204 ICDS projects covering all 176 Taluks and
10 urban areas. During 2013-14, under this scheme, 56.21 lakhs beneficiaries
have been benefited.
5.3 Supplementary Nutrition Programme:
Supplementary nutrition is given to the beneficiaries under ICDS programme
with an objective to provide 500 calories of energy and 12–15 grams of protein,
as a supplement to their normal intake as envisaged in the scheme guidelines.
Supplementary nutrition is given for 300 days in a year at a cost of Rs. 6.00 per
beneficiary per day for normal children and Rs. 5.00 per beneficiary per day for
pregnant and nursing mothers and severely malnourished children and
adolescent girls. Beneficiaries are provided with local food for all the 6 days in
a week. Children in the age group of 3 -6 years are provided ready to local food
is provided for 6 days. An expenditure of Rs. 84,632.89 lakhs was incurred
during the year 2013-14. From 2005-06 the Government of India is sharing
50% of the cost on supplementary nutrition and 50% share is borne by State
Government. The district wise details are given in table 21.
5.4 Rajiv Gandhi Scheme for Empowerment of Adolescent Girls
–„SABALA‟
Government of India formulated a new scheme called „Rajiv Gandhi‟ scheme
for Empowerment of Adolescent Girls –„SABALA‟ merging „KISHORI
SHAKTI YOJANA‟ (KSY) and NUTRITION PROGRAMME FOR
ADOLESCENT GIRLS (NPAG). The new scheme „SABALA‟ is implemented
on pilot basis in 9 districts namely Gulbarga, Kolar, Dharwad, Chickmagalur,
Bangalore Rural, Bellary, Bijapur, Kodagu and Uttara Kannada. In the
remaining 21 District Kishori Shakti Yojana operational component (iii)
Vocational Training is being provided under the scheme. The scheme aims at
covering Adolescent Girls in the age group of 11 to 18 years. Rs. 108.30 lakhs
14
for Non-nutrition component has been allocated in the year 2013-14 & out of
Rs. 108.30 lakhs provided in 2013-14, an expenditure of Rs. 108.30 lakh has
been incurred. Physical and Financial progress for supplementary nutrition
programme and Kishori Shakti Yojaya for the year 2013-14 is given in Table
No.21.
5.5 Bhagyalakshmi
As per 2011 census, the sex ratio in Karnataka is 973 females to 1000 males.
Though this is better than the national average. There are several socio
economic reasons for the „high preference for a male pregnancy‟ that is seen to
be present in society at large which adversely affects the girl child's access to
nutrition, health care, education and overall development. The State
Government has great concern for the girl child and to change society's attitudes
towards her, and promote birth of girl children in the below poverty line
families, a new welfare scheme called “Bhagyalakshmi‟ was launched during
the year 2006-07 and the scheme was slightly modified in August 2008. This
scheme is restricted to two girls in BPL families. This benefit will not be
available unless the father or mother of the beneficiary girl has undergone
terminal family planning methods so that the total number of children of the
BPL family does not exceed three in the said family. The girl child is enrolled
after due verification by the department and each beneficiary is given an amount
of Rs.10,000.00, which is deposited in her name in fixed deposit and for
children‟s born on or after 01-08-2008, an amount of Rs.19,300.00 will be
deposited with the financial institution in the name of the first girl beneficiary
and Rs. 18,350.00 in name of the second girl beneficiary of the same family.
The amount deposited in the financial institution will be maximized and paid
along with interest to the beneficiary on her attainment of 18 years of age. The
district wise information is given in table 22.
15
5.6 GIRL CHILD
Government of India has declared January 24th
as the Girl Child day with a
focus on the upliftment of the Girl Child. Although the constitution of India
guarantees equality to all citizens, the status of women and girls is not on par
with that of males in some sections of society. The skewed sex ratio in the 0-6
years age group is an indicator of this fact. The Government of India has
launched several schemes and programmes for the welfare of the girl child,
which reduce discrimination against the girl child. Some of these are:-
A. GIRL CHILD SCHEME/ADOLESCENT GIRL SCHEME
1. Integrated Child Development Services (1975)
2. District Primary Education Programme(1994)
3. National Programme of Nutritional support to Primary Education (Mid
Day Meal Scheme) (1995)
4. Reproductive and Child Health Progamme(1996)
5. Balika Samriddhi Yojana (1997)
6. Jan Shikshan Sansthan (1998)
7. Kishori Shakti Yojana (2000)
8. Sarva Shiksha Abhiyan (2002)
B. Legislative Measures
Various legislations have been enacted for the protection of children. These
are:
1. Child Marriage Restraint Act, 1929 (Amended in 1979 & 2006)
2. The Medical Termination of Pregnancy Act, 1971.
3. Child Labour (Regulation and Prohibition) Act, 1986 (Amended in 2006)
4. Infant Milk Substitutes, Feeding Bottles and Infant Food (Regulation of
Production, Supply and Distribution) Act, 1992.
16
5. The Pre-natal Diagnostic Techniques (Regulation and Prevention of
Misuse) Act, 1994.
5.7 Discrimination against girls is evident from indicators such as enrolment
and dropout rates of girls in schools. Dropout rates from 2013-14 are given in
Table 23 and 24.
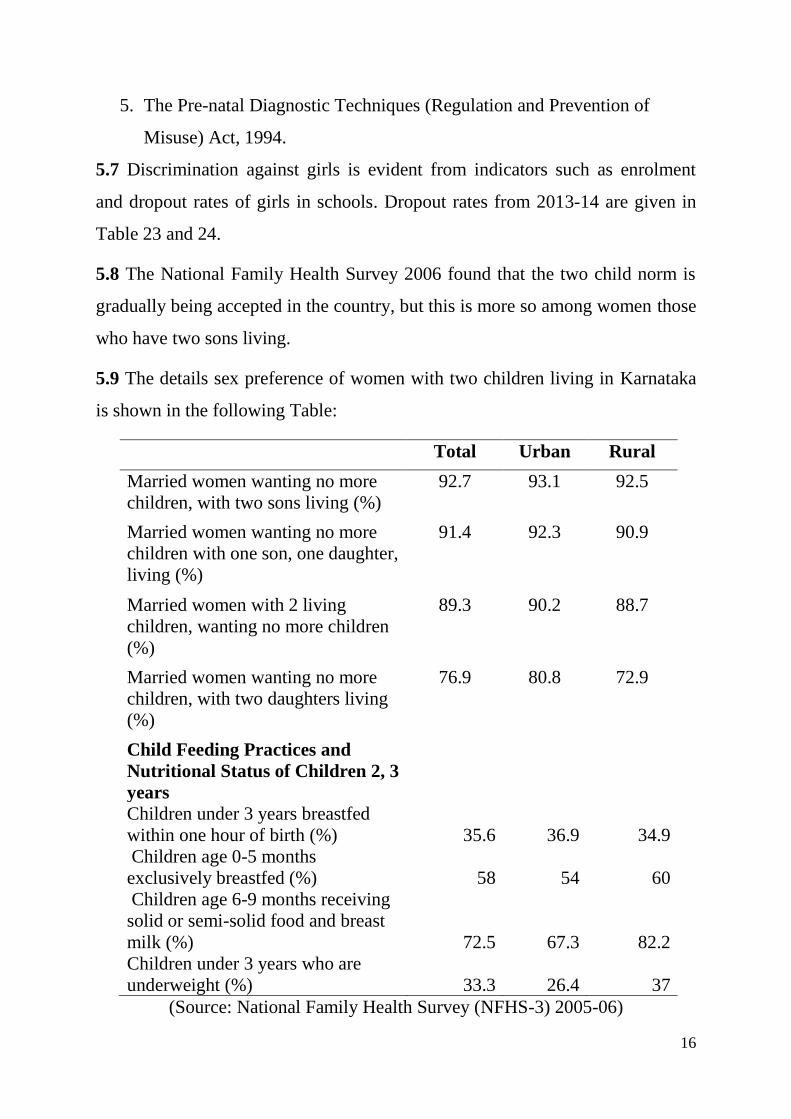
5.8 The National Family Health Survey 2006 found that the two child norm is
gradually being accepted in the country, but this is more so among women those
who have two sons living.
5.9 The details sex preference of women with two children living in Karnataka
is shown in the following Table:
Total Urban Rural
Married women wanting no more
children, with two sons living (%)
92.7 93.1 92.5
Married women wanting no more
children with one son, one daughter,
living (%)
91.4 92.3 90.9
Married women with 2 living
children, wanting no more children
(%)
89.3 90.2 88.7
Married women wanting no more
children, with two daughters living
(%)
76.9 80.8 72.9
Child Feeding Practices and
Nutritional Status of Children 2, 3
years
Children under 3 years breastfed
within one hour of birth (%) 35.6 36.9 34.9
Children age 0-5 months
exclusively breastfed (%) 58 54 60
Children age 6-9 months receiving
solid or semi-solid food and breast
milk (%) 72.5 67.3 82.2
Children under 3 years who are
underweight (%) 33.3 26.4 37
(Source: National Family Health Survey (NFHS-3) 2005-06)
17
CHAPTER 6
EARLY MARRIAGE
6.1 Early marriage is defined as a marriage in which the bride is below 18 years
and the groom is below 21 years. Girls who bear children before they attain
adolescence remain physically under developed and have greater risk of
complications of pregnancy and maternal death. To reduce the incidence of
child marriage, the child marriage Restraint Act, 1929 was passed and amended
in 1979.
6.2 Under this Act, unless there is anything repugnant in the subject or context,
(a) “Child” means a person who, if a male under 21 years of age and if a female
is under 18 years of age, (b) “Child Marriage” means a marriage to which either
of the contracting parties is a child; (c) “Contracting party” to a marriage means
either of the parties whose marriage is or is about to be solemnized; and (d)
“Minor” means a person of either sex who is under 18 years of age.
6.3 Punishment under the Act: Whoever performs conducts or directs any child
marriage shall be punishable with simple imprisonment which may extend to
three months and shall also be liable to fine, unless he proves that he had reason
to believe that the marriage was not a child marriage.
6.4 The Child Marriage Act was amended in 2006 and the guardian who
solemnizes a child marriage can be punished with rigorous imprisonment which
may extend to two years and also be liable to fine which may extend up to rupee
one lakh. However no woman can be imprisoned. Any person who attends a
child marriage can also be penalized under this Act.
6.5 Legislative Measures: To reduce and eliminate the incidence of child
marriage, the following Act has been enacted:

18
6.5.1 Child Marriage Restraint Act, 1929 (Amend in 1979 & 2006)
The incidence of early marriage is recorded as 41.2% in 2006 in Karnataka.
Census of India 2001 found that there were nearly 300,000 married girls who
became mothers before the age of 15 years. Early Motherhood places the
mother and the child at grave health risk.

19
CHAPTER 7
CHILD LABOUR
7.1 Government of India enacted “The Child Labour (Prohibition & Regulation)
Act 1986” to prohibit employment of Children below the age of 14 years in
Hazardous occupation or processes listed in the schedule of the Act. There is
prohibition of Employment of Child Labour in other enactments also as listed
below. Government of Karnataka prohibits employment of Child Labour in
Karnataka Shops and Commercial Establishment Act 1961, which means total
prohibition of Child Labour in all employments. Government of India and
Government of Karnataka laid down policies and programmes for elimination
of Child Labour completely and to declare Karnataka as “A Child Labour free
State”. For this purpose “An action Plan “was prepared during 2001, aim of this
plan is to eliminate Child Labour practice, of Child Labour Mainstreamed is
given in Table-22(a).
7.2 Hon‟ble Supreme Court of India in M.C.Mehta v/s Tamil Nadu and others,
case gave a historical judgment touching all aspects of Child Labour and fixed
responsibility on Deputy Commissioner to carryout this task and official of nine
departments are nominated as “Inspectors” under Child Labour (Prohibition and
Regulation) Act 1986.
7.3 Supreme Court in its judgment issued a direction to set up a Corpus Fund
i.e. Child Labour Rehabilitation Cum Welfare Fund to which every employer
who employs Child Labour in Hazardous Industries should deposit Rs.20,000/-
per child to this fund and the State Government should deposit Rs. 5,000/- per
child if they fail to give employment to an adult member of released Child
Labour‟s Family. The fund so constituted which amounts to Rs. 25,000/-
should be deposited in Nationalised bank in high yielding interest schems, the
20
interest earned should be paid to the family of released child labour till he/she
attains the age of 14 years.
7.4 The penalty amount to be collected from the erring employer who employs
child labour in Hazardous Occupations as per Supreme Court Judgment (i.e
M.C.Mehta v/s Tamil Nadu) is Rs. 20,000 per child.
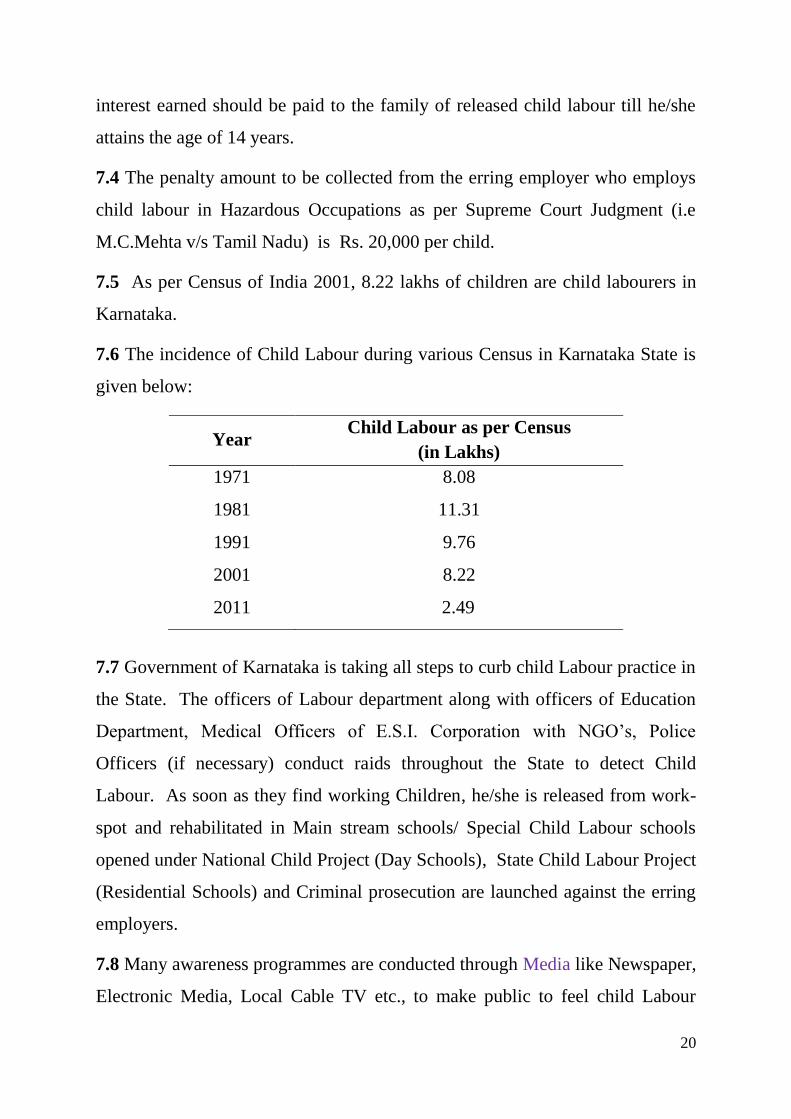
7.5 As per Census of India 2001, 8.22 lakhs of children are child labourers in
Karnataka.
7.6 The incidence of Child Labour during various Census in Karnataka State is
given below:
Year Child Labour as per Census
(in Lakhs)
1971 8.08
1981 11.31
1991 9.76
2001
2011
8.22
2.49
7.7 Government of Karnataka is taking all steps to curb child Labour practice in
the State. The officers of Labour department along with officers of Education
Department, Medical Officers of E.S.I. Corporation with NGO‟s, Police
Officers (if necessary) conduct raids throughout the State to detect Child
Labour. As soon as they find working Children, he/she is released from work-
spot and rehabilitated in Main stream schools/ Special Child Labour schools
opened under National Child Project (Day Schools), State Child Labour Project
(Residential Schools) and Criminal prosecution are launched against the erring
employers.
7.8 Many awareness programmes are conducted through Media like Newspaper,
Electronic Media, Local Cable TV etc., to make public to feel child Labour
21
practice is curse on Society. Every year June 12 is celebrated as “Anti Child
Labour Day” where children of all schools are made to gather at a place,
cultural programmes are arranged by children. Eminent personalities from
sports, film field are invited to the function and they take an oath that nobody
should take the services of child labour in future.
7.9 Enactments which prohibit Child Labour are:
(a) Factories Act 1948
(b) Plantation Labour Act 1951.
(c) Mines Act 1952
(d) Motor Transport Workers Act 1961
(e) Beedi and Cigar Workers Act 1966
(f) Child Labour (Prohibition and Regulation) Act 1986.
22
CHAPTER 8
HEALTH AND NUTRITION
8.1 For a nation‟s progress it is essential that the health and nutrition of women
and girls, mothers of the new generation are adequately cared for. The majority
of women go through life in a state of nutritional stress; they are anemic and
malnourished. Poverty, early marriage, malnutrition and lack of health care
during pregnancy are the major reasons for both maternal and infant mortality.
The average Indian women bear her first child before 22 years and has little
control over her own fertility and reproductive health. In rural side almost 60
percent of girls are married before they are 18; nearly 60 percent of married
girls bear children before they are 19. Almost one third of all babies are born
with low birth weight.
8.2 As per Sample Registration System, the overall Infant mortality rate in
Karnataka which was 89 in 1971 has come down to 32 in 2012. In 2001-02, the
expectation of life at birth for females was 67.0 and 64.5 for males. Details are
shown in Table 9 and Table 10.
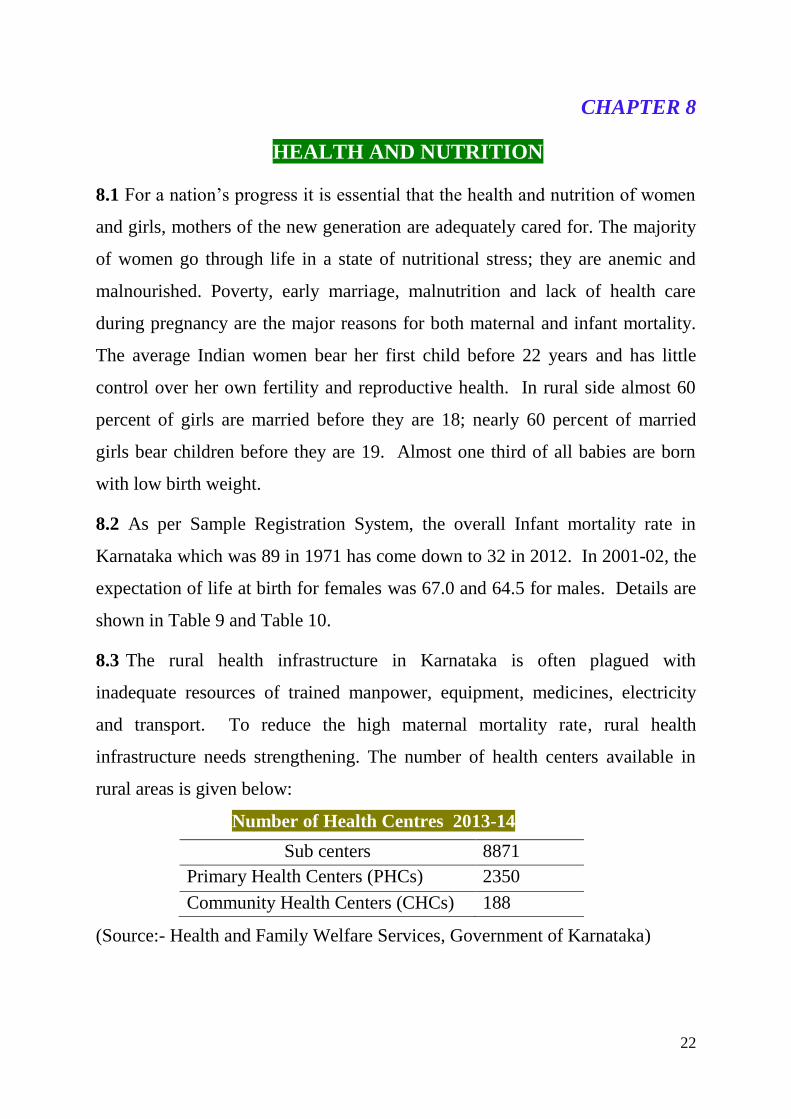
8.3 The rural health infrastructure in Karnataka is often plagued with
inadequate resources of trained manpower, equipment, medicines, electricity
and transport. To reduce the high maternal mortality rate, rural health
infrastructure needs strengthening. The number of health centers available in
rural areas is given below:
Number of Health Centres 2013-14
Sub centers 8871
Primary Health Centers (PHCs) 2350
Community Health Centers (CHCs) 188
(Source:- Health and Family Welfare Services, Government of Karnataka)
23
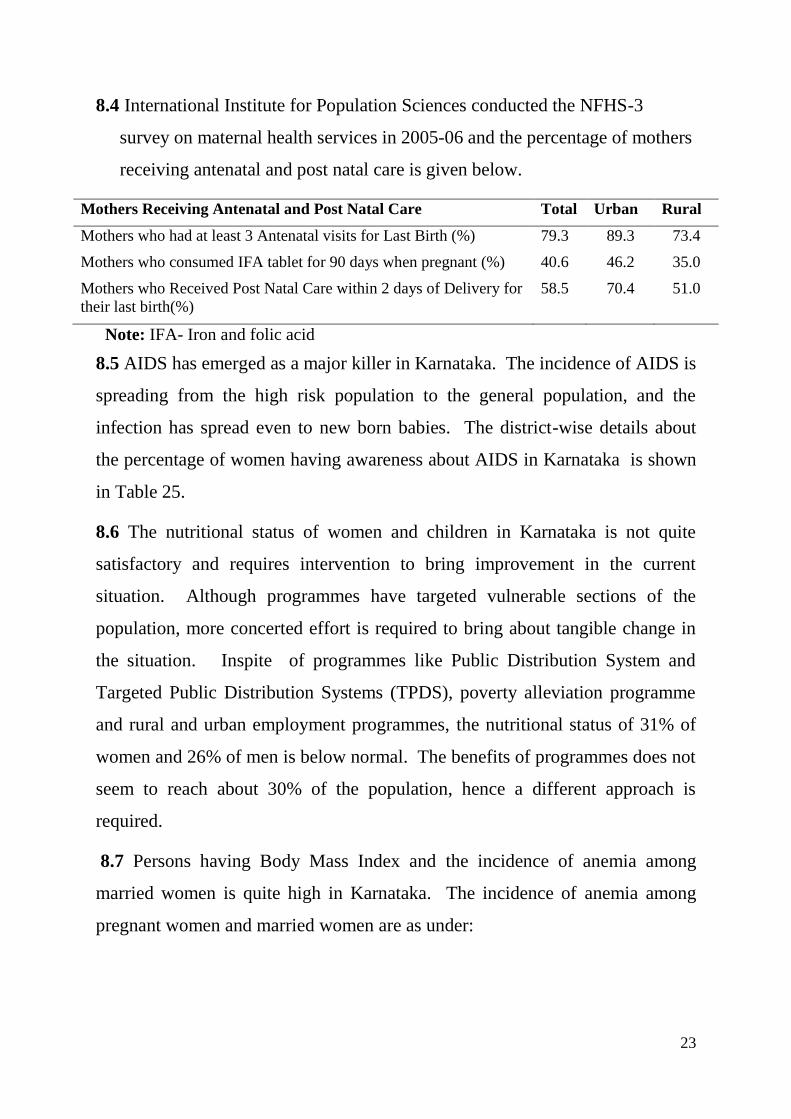
8.4 International Institute for Population Sciences conducted the NFHS-3
survey on maternal health services in 2005-06 and the percentage of mothers
receiving antenatal and post natal care is given below.
Mothers Receiving Antenatal and Post Natal Care Total Urban Rural
Mothers who had at least 3 Antenatal visits for Last Birth (%) 79.3 89.3 73.4
Mothers who consumed IFA tablet for 90 days when pregnant (%) 40.6 46.2 35.0
Mothers who Received Post Natal Care within 2 days of Delivery for
their last birth(%)
58.5 70.4 51.0
Note: IFA- Iron and folic acid
8.5 AIDS has emerged as a major killer in Karnataka. The incidence of AIDS is
spreading from the high risk population to the general population, and the
infection has spread even to new born babies. The district-wise details about
the percentage of women having awareness about AIDS in Karnataka is shown
in Table 25.
8.6 The nutritional status of women and children in Karnataka is not quite
satisfactory and requires intervention to bring improvement in the current
situation. Although programmes have targeted vulnerable sections of the
population, more concerted effort is required to bring about tangible change in
the situation. Inspite of programmes like Public Distribution System and
Targeted Public Distribution Systems (TPDS), poverty alleviation programme
and rural and urban employment programmes, the nutritional status of 31% of
women and 26% of men is below normal. The benefits of programmes does not
seem to reach about 30% of the population, hence a different approach is
required.
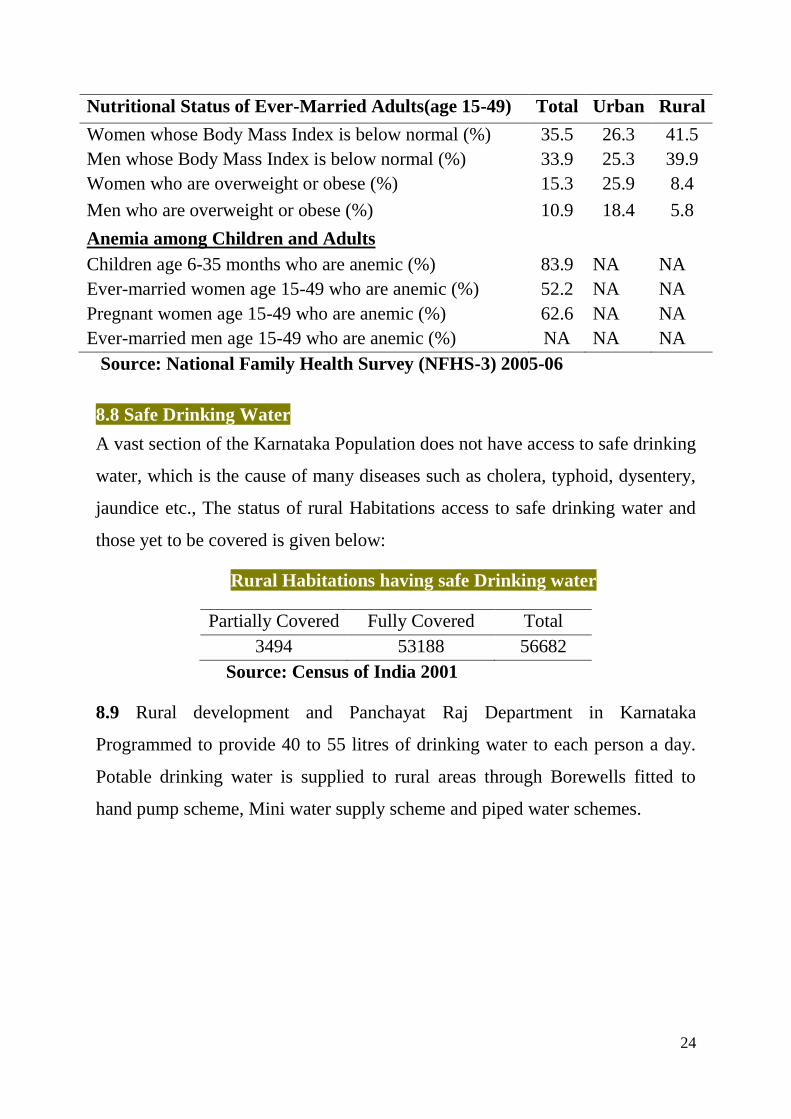
8.7 Persons having Body Mass Index and the incidence of anemia among
married women is quite high in Karnataka. The incidence of anemia among
pregnant women and married women are as under:
24
Nutritional Status of Ever-Married Adults(age 15-49) Total Urban Rural
Women whose Body Mass Index is below normal (%) 35.5 26.3 41.5
Men whose Body Mass Index is below normal (%) 33.9 25.3 39.9
Women who are overweight or obese (%) 15.3 25.9 8.4
Men who are overweight or obese (%) 10.9 18.4 5.8
Anemia among Children and Adults
Children age 6-35 months who are anemic (%) 83.9 NA NA
Ever-married women age 15-49 who are anemic (%) 52.2 NA NA
Pregnant women age 15-49 who are anemic (%) 62.6 NA NA
Ever-married men age 15-49 who are anemic (%) NA NA NA
Source: National Family Health Survey (NFHS-3) 2005-06
8.8 Safe Drinking Water
A vast section of the Karnataka Population does not have access to safe drinking
water, which is the cause of many diseases such as cholera, typhoid, dysentery,
jaundice etc., The status of rural Habitations access to safe drinking water and
those yet to be covered is given below:
Rural Habitations having safe Drinking water
Partially Covered Fully Covered Total
3494 53188 56682
Source: Census of India 2001
8.9 Rural development and Panchayat Raj Department in Karnataka
Programmed to provide 40 to 55 litres of drinking water to each person a day.
Potable drinking water is supplied to rural areas through Borewells fitted to
hand pump scheme, Mini water supply scheme and piped water schemes.
25
CHAPTER 9
EDUCATION
9.1 Education is a critical input in human resources development and is essential
for the country‟s economic growth. A high literacy rate, especially in the case
of women, correlates with improvement in several socio-economic indicators,
namely low birth rate, low Infant Mortality Rate and increase in life expectancy.
The recognition of this fact has created awareness on the need to focus on
improving literacy and universalizing elementary education programme. The
task of providing basic education for all, with concrete plan of action, gained
greater momentum only after the National Policy of Education (NPE) was
adopted in 1986 and revised in 1992.
9.2 India‟s constitution guarantees free primary school education for both boys
and girls up to the age 14. This goal has been repeatedly reconfirmed but
primary education in Karnataka is not universal. Female continue to lag behind
males on the literacy front. Census 2011 indicates that only 68.08 women are
literate as compared to 82.47 for men. As per the NFHS Survey the main
reasons of females never attending schools are „expensive cost of education‟,‟
not interested in studies‟, „education is not considered necessary‟ and „required
for household work‟
9.3 The literacy rate has been going up steadily. The 2011 census revealed that
while the total literacy rate was 75.36 percent, for females it was 68.08. The
literacy rate by sex in rural and urban areas is given in Table 26.
9.4 During 2013-14, The number of girls enrolled in lower primary, higher
primary and high schools are 25,89,196 (48.38), 14,30,060 (48.14) and
8,09,890 (48.07) respectively to the total enrolled. The total percentage
enrolment of girls for lower primary, higher primary, and high schools was

26
48.26 per cent. District wise share of girls enrolment for lower primary, higher
primary & high school for the year 2013-14 is given Table 27.
9.5 The Government of Karnataka has distributed bicycles for government
school and aided school students who are studying in VIII standard to improve
the quality of attendance in high school. The total number of bicycles
distributed during the year 2013-14 were 5,47,689 of which 2,78,058 were
distributed to girl students. The district wise details are given in Table 28.
9.6 The percentage of Female teachers in Bangalore district is the highest
compared to other districts. Percentages of Female teachers in primary, Higher
Primary & High schools are 51.88, 57.75 and 36.49 respectively. District wise
information is given in Table 29.
9.7 Gender parity index for 2013-14 for Lower Primary, Higher Primary &
High School is 0.94, 0.93 and 0.94 respectively and the detail are given in Table
30.
9.8 During 2013-14, number of girls enrolled for first year Pre-University and
Second Year Pre-university are 2,97,334 and 2,55,172 respectively and the
district wise details are given in table 31.
9.9 During 2013-14 the student strength in Government and Private aided
degree colleges were 2,88,771 and 2,31,590 and of which 1,56,845 and
1,22,512 are female the district wise details are given in table 32.

27
CHAPTER 10
WOMEN AND ECONOMY
10.1 Marriage and kinship systems preservers the structures of patriarchy. Most
societies are “Patriarchal” with women moving from their parents to their
husband‟s homes after marriage. Marriage can therefore be thought of as
framework that serves to exchange women between households and marriage
decisions are made with a view forward ensuring that this exchange of women
promises the maximum gain to both households. The man‟s household is the
point of reference while the woman is simply an input into the process for
households controlled by men to generate economic and social returns.
However in some coastal districts of Karnataka, there is also a system of
“Matriarchal” marriages existing.
10.2 As per 2011 census, in urban area, the total population of workers is 69.58
lakhs of which only 24.11 lakhs are females. In rural areas out of 185.02 lakhs,
113.11 lakhs are males and 71.90 lakhs are females. As per report of National
Sample Survey 66th round, Central Sample the worker population ratio of
females in rural sector for principal sector was 1000 while that for males was
1000. In urban areas it is 1000 for females and 1000 for males for which details
are given in Table 33. Details on Education specific status worker population
ratio, educational composition of the usually employed, unemployment rate and
labour force participation rate are given in Tables 34, 35, 36 and 37. According
to Employment and training department, Bangalore the total employment of
women in organized sector as on 31st March 2013 was 7,61,948 of which
2,89,709 were in public and 4,72,239 were in private sector. The district wise
details are given in Table 38.
10.3 Women‟s work is undervalued and unrecognized. Women work longer
hours than men, and carry the major share of household and community work
28
that is unpaid and invisible. There are far fewer women in the paid workforce
than there are men. There are more unemployed women than unemployed men.
10.4 Women generally earn lower wage than men doing the same work. It has
been estimated that women‟s wage rate are, on the average only 75% of men‟s
wage rates and constitute only one fourth of the family income. In no State do
women and men earn equal wages in agriculture. Also, women generally work
in the informal sector where wages are lower and they are not covered by labour
laws. Within organizations, women workers are also engaged in piecework and
subcontracting at exploitative rates.
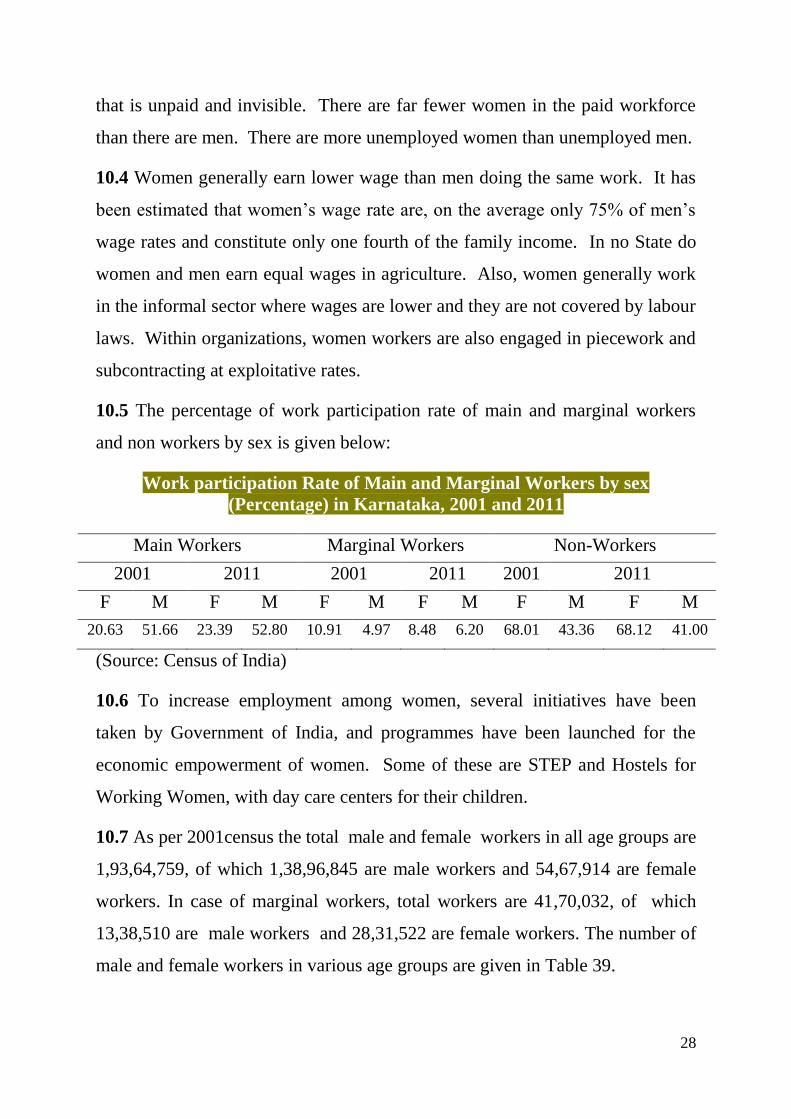
10.5 The percentage of work participation rate of main and marginal workers
and non workers by sex is given below:
Work participation Rate of Main and Marginal Workers by sex
(Percentage) in Karnataka, 2001 and 2011
Main Workers Marginal Workers Non-Workers
2001 2011 2001 2011 2001 2011
F M F M F M F M F M F M
20.63 51.66 23.39 52.80 10.91 4.97 8.48 6.20 68.01 43.36 68.12 41.00
(Source: Census of India)
10.6 To increase employment among women, several initiatives have been
taken by Government of India, and programmes have been launched for the
economic empowerment of women. Some of these are STEP and Hostels for
Working Women, with day care centers for their children.
10.7 As per 2001census the total male and female workers in all age groups are
1,93,64,759, of which 1,38,96,845 are male workers and 54,67,914 are female
workers. In case of marginal workers, total workers are 41,70,032, of which
13,38,510 are male workers and 28,31,522 are female workers. The number of
male and female workers in various age groups are given in Table 39.
29
10.8 Supports to Training and Employment Programme for Women
(STEP)
10.8.1 Support to Training and Employment Programme for Women (STEP)
was launched in 1987 to provide skills and knowledge to poor and asset less
women in traditional occupations such as agriculture, animal husbandry,
dairying, fisheries, handloom, handicrafts, khadi and village industries,
sericulture, social forestry and wasteland development for enhancing their
productivity and income generation. This would enhance and broaden their
employment opportunities including self-employment and development of
entrepreneurship skills. Women in the dairying sector have been receiving
maximum support, keeping in view the nature of demands. This is followed by
handlooms, handicrafts, sericulture and poultry.
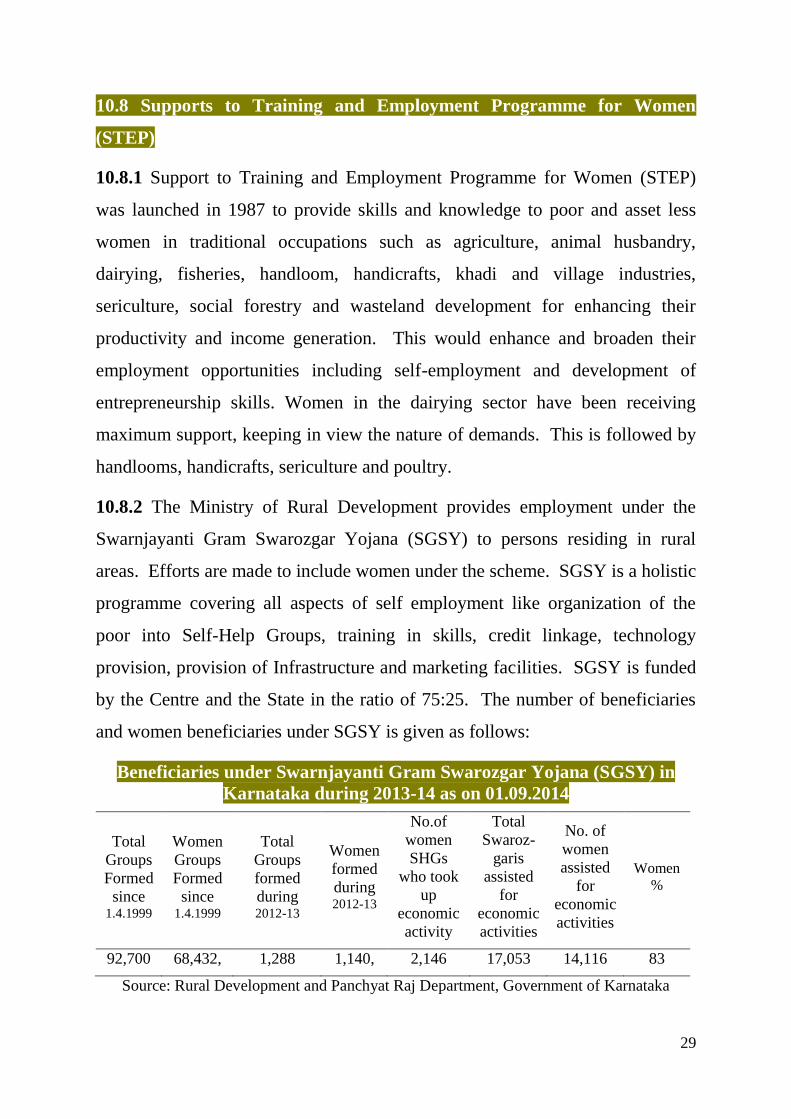
10.8.2 The Ministry of Rural Development provides employment under the
Swarnjayanti Gram Swarozgar Yojana (SGSY) to persons residing in rural
areas. Efforts are made to include women under the scheme. SGSY is a holistic
programme covering all aspects of self employment like organization of the
poor into Self-Help Groups, training in skills, credit linkage, technology
provision, provision of Infrastructure and marketing facilities. SGSY is funded
by the Centre and the State in the ratio of 75:25. The number of beneficiaries
and women beneficiaries under SGSY is given as follows:
Beneficiaries under Swarnjayanti Gram Swarozgar Yojana (SGSY) in
Karnataka during 2013-14 as on 01.09.2014
Total
Groups
Formed
since 1.4.1999
Women
Groups
Formed
since 1.4.1999
Total
Groups
formed
during 2012-13
Women
formed
during 2012-13
No.of
women
SHGs
who took
up
economic
activity
Total
Swaroz-
garis
assisted
for
economic
activities
No. of
women
assisted
for
economic
activities
Women
%
92,700 68,432, 1,288 1,140, 2,146 17,053 14,116 83
Source: Rural Development and Panchyat Raj Department, Government of Karnataka

30
Ministry of Rural Development, New Delhi has restructured SGSY as
NRLM Aajeevika from 2013-14. In Karnataka the scheme is being implement
in the name of “Sanjeevini” through KSRLPS.
The District wise total number of members & women assisted for economic
activities and under NREGS total number of person days generated and number
of person days generated by women are given in table 40.
10.8.3. The public sector consists higher number of women employed in
community, social and personal services, whereas in private sector majority of
employed women are in manufacturing industries. District-wise and
qualification-wise applicants registered in employment exchanges are given
table 41.
10.8.4. According to 5th
Economics census, there were 3.91 lakh agricultural
establishments employing 8.13 lakh persons in Karnataka State of which 3.10
lakhs are Female. Details are given in table 42. In all non – agricultural
establishments which are 21.48 lakh in number, the female employment was
13.84 lakhs for 55.32 lakh total employment, the details are given in table 43.
10.8.5. According to 2010-11 Agricultural Census, total number of agricultural
holders is 78,32,189 having an area of 1,20,61,457 hectares of which women
are 14,86,479 and having an area of 18,98,304 hectares. The district wise
details are given in table 44.
31
CHAPTER 11
SUPPORT SERVICES TO WOMEN
11.1 The Department of Women and Child Development has undertaken several
programmes and assists voluntary organizations providing services to various
groups of women. Working women, Widows, women in distress, and women
from vulnerable backgrounds are in need of special services to create enabling
environment to enhance the self confidence and autonomy of women so that
they can take their rightful place in the mainstream of the nation‟s social,
political and economic life.
11.2 Some of the supportive measures for women initiated by the Government
of Karnataka are given below.
11.2.1 Hostels for working women:
With progressive change in the economic structure, more and more women are
living out of their homes in search of employment in big cities. These women
are exposed to risks due to lack of suitable and safe accommodation. The
Government acknowledged the difficulties faced by such women and decided to
introduce a scheme for construction/expansion of hostels for working women.
Under the scheme for construction/expansion of hostel building for working
women, financial assistance is given to voluntary organizations, local bodies
and cooperative institutions for the construction of hostels for working women
in order to enable women to seek employment and participate in technical
training. The objective of the scheme is to provide cheap and safe hostel
accommodation to working women living out of their homes. The target
beneficiaries are single working women, widows, divorcees, separated women,
and working women whose husbands are out of town. The district wise details
of number of working women hostels and number of women benefited are given
in Table 20.
32
11.2.2 Stree Shakthi
Stree Shakthi Project was launched throughout the State during 2000. The aim
of the project is to empower women economically and socially by organizing
them in self help groups. As on March 2014, 1.40 self help groups(SHGs) have
been formed in the state. 20.16 lakh women members have been organized in
these groups till March 2014 and the members have saved an amount of Rs.
1470.19 crores. A total of 1,25,715 groups have availed bank loans to the
extent of Rs.1477.45 crores to take up various income generating activities.
11.2.3 Santhwana
Women who are victims of various atrocities such as dowry, rape, sexual
harassment, domestic violence etc. are subjected to physical and mental torture
besides having to face social & financial problems. With a view to console these
women and rehabilitate them, the scheme of “Santhwana” was launched during
the year 2000-01. Santhwana Centres are run through NGOs and each centre is
provided with a toll free number 1091. The help line receives call from women
in distress round the clock. Facilities and rehabilitative services are provided to
such women as per the recommendations of the District Level Committee
depending on the merits of the case. There are 169 santwana centers in State in
2013-14. The district wise physical and financial progress is given in table
No. 45.
11.2.4 Swadhar–A Scheme for Women in difficult circumstances:
This is Central sector scheme for providing holistic and integrated services to
women in difficult circumstances such as destitute widows, women prisoners
released from jail and without family support, women survivors of natural
disasters; trafficked women/girls rescored from brothels or other places or
victims of sexual crime, mentally challenged women who are without any
support etc. The package of services made available include provision for food,
33
clothing, shelter, health care, conselling and legal support, social and economic
rehabilitation through education, awareness generation, skill up gradation.
The scheme is implemented through voluntary organizations including
Department of Women and Child Development and Social Welfare, Boards,
State Women‟s Development Corporation, urban bodies etc., provided they
have the required experience and expertise in the rehabilitation of such women.
The scheme also supports a helpline for women in distress, counseling centre,
training centre and medical centre.
33 Swadhar centres are sanctioned by Government of India, of which 34
are functioning in the State. The physical and financial progress are given in
table 45.
11.2.5 Condensed Courses of Education for Adult Women (CCE)
The scheme of Condensed Courses of Education for Adult Women aims at
facilitating social and economic empowerment of women by providing
education and relevant skills. Course can be organized for women in the age
group of 15 years and above. The following courses are conducted under the
scheme;
(a) Two years primary level residential/ Non-residential courses for illiterate,
neo-literates women.
(b) Two years middle level residential courses for women who have studied
up to class V.
(c) Metric/ Secondary level two years residential/ Non-residential courses
for women who have studied up to class VIII or any other standard
equivalent to class of regular school.

34
(d) Metric/Secondary/Equivalent examination, one-year non/residential
courses for failed candidates of condensed course and other
metric/secondary/ equivalent examination for failed candidates
(e) The number of candidates be admitted to these courses is 25.
The schemes are being implemented through voluntary organizations and
educational institution across the country. 100 % financial assistance is being
provided under the scheme as per schematic budget for various courses by
CSWB.
Course Institutions
sanctioned
Amount Released
No. of
Beneficiaries
One year course 8 1,95,564 200
Two years course 2 57,742 100
11.2.6 Family Counseling Centers:
The incidence of dowry death and other atrocities on women and children have
been increasing in the State and this has become a matter of great concern to all,
demanding immediate attention from government and voluntary organizations
to eradicate such social evils. In order to meet the new social changes, the
Central Social Welfare Board set up the Voluntary Action Bureau for guidance
to institutions for running the family counseling centers.
The Voluntary Action Bureau plays a major role in monitoring and expansion
of the Family Counseling Centers by creating public awareness on atrocities
against women by organizing training programmes for Counselors of Family
Counseling Centers.
According to the revised financial norms, A grant of Rs.2.28 lakhs and
Rs.1.92 lakhs per annum is given to the voluntary organization for running
Family counseling Centers in A class and other cities respectively on an 80:20
35
matching basis. Each counselor will get an amount of Rs.7000/-p.m for „A‟
class cities and Rs.5500/- per month in other parts of the State. The budget
includes honorarium of two counselors who are post graduates in Social
Work/Psychology. Recurring expenditure of Rs.25,000/- is given as one-time
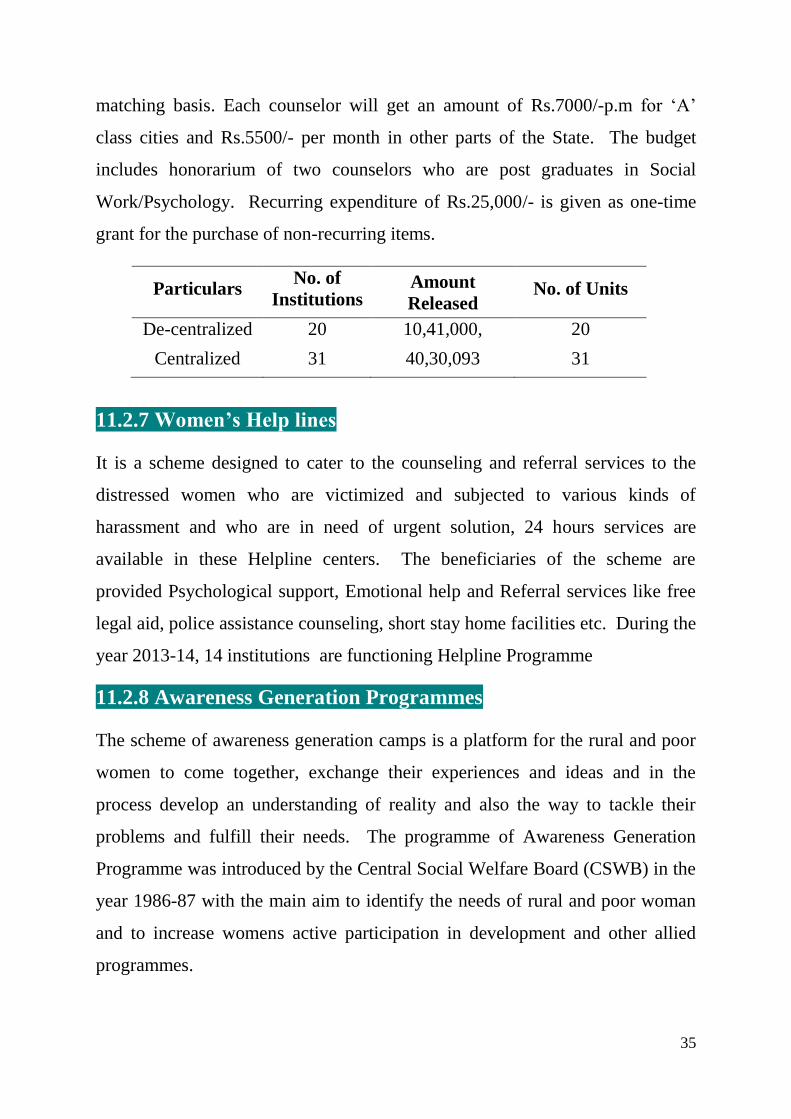
grant for the purchase of non-recurring items.
Particulars No. of
Institutions Amount
Released No. of Units
De-centralized 20 10,41,000, 20
Centralized 31 40,30,093 31
11.2.7 Women‟s Help lines
It is a scheme designed to cater to the counseling and referral services to the
distressed women who are victimized and subjected to various kinds of
harassment and who are in need of urgent solution, 24 hours services are
available in these Helpline centers. The beneficiaries of the scheme are
provided Psychological support, Emotional help and Referral services like free
legal aid, police assistance counseling, short stay home facilities etc. During the
year 2013-14, 14 institutions are functioning Helpline Programme
11.2.8 Awareness Generation Programmes
The scheme of awareness generation camps is a platform for the rural and poor
women to come together, exchange their experiences and ideas and in the
process develop an understanding of reality and also the way to tackle their
problems and fulfill their needs. The programme of Awareness Generation
Programme was introduced by the Central Social Welfare Board (CSWB) in the
year 1986-87 with the main aim to identify the needs of rural and poor woman
and to increase womens active participation in development and other allied
programmes.

36
While conducting these camps, the NGOs take up the issues such as status of
women, women and law, women and health, community health and hygiene
technology for women, environment and the economy. The programme also
enables women to organize themselves and strengthen their participation in
decision making in the family and in society and to deal with social issues
including atrocities on women and children.
Financial assistance to the tune of Rs.10,000 per camp is provided
(During the year 2013-14 allocations not received from Central Social
Welfare Board, NEW DELHI)
No.of
Institutions
Amount
Released
No.of
Camps
No. of
Beneficiaries
De-Centralized Nil Nil Nil Nil
Centralized Nil Nil Nil Nil
Source: Department of Social Welfare Board, Bangalore.

37
CHAPTER 12
CRIME AGAINST WOMEN AND CHILDREN
12.1 Crimes against women have been increasing over the years. As per the data
of 2013-14, total number of police stations in Karnataka are 917 including RIP,
of which women police station are 10 in number. District wise information is
given in table 46. According to State Crime Record Bureau, among the crimes
committed against women, molestation shares the highest number. There were
1030 victims of rape in 2013 when compared with 566 victims in 2012. The
dowry deaths recorded are 277 in 2013 compared to 218 in 2012. Molestation
cases recorded are 3913 in 2013 compared to 2978 in 2012. The district wise
details are given in table 47.
12.2 Punishment for Rape
376. Whoever, except in the cases provided for in sub-section (2),
commits rape, shall be punished with rigorous imprisonment of either
description for a term which shall not be less than seven years, but which may
extend to imprisonment for life, and shall also be liable to fine.
376A. Whoever, commits an offence punishable under sub-section (1) of
sub-section (2) of section 376 and in the course of such commission inflicts an
injury which causes the death of woman or causes the woman to be in a
persistent vegetative state, shall be punished with rigorous imprisonment for a
term which shall not be less than twenty years, but which may extend to
imprisonment for life, which shall mean imprisonment for the remainder of that
person‟s natural life, or with death.
Gang Rape:-
376D. Where a woman is raped by one or more persons constituting a group or
acting in furtherance of a common intention, each of those persons shall be
38
deemed to have committed the offence of rape and shall be punished with
rigorous imprisonments for a term which shall not be less than twenty years, but
which may extend to life which shall mean imprisonment for the remainder of
that person‟s natural life, and with fine.
Provided that such fine shall be just and reasonable to meet the medical
expenses and rehabilitation of the victim:
Provided further that any fine imposed under this section shall be paid to the
victim.
Punishment for repeat offenders.
376E. Whoever has been previously convicted of an offence punishable under
section 376 or section 376A or section 3760 and is subsequently convicted of an
offence punishable under any of the said sections shall be punished with
imprisonment for life which shall mean imprisonment for the remainder of that
person‟s natural life, or with death.
12.3 As per the report received from State for the year 2013 the total
Suicides are 12680, of which 4017 are suicides pertaining to women. District
wise data is given in Table 48.

38a
CHAPTER 13
POLITICAL PARTICIPATION OF WOMEN IN DECISION
MAKING
13.1 The 73rd
and 74th
Amendment to the Constitution ensured that 33 percent
seats for Panchayats in rural areas and urban local bodies are to be reserved for
women. This ensures the direct involvement of women in positions of decision
making. Elected women representatives are slowly bringing about a change in
the rural countryside and urban areas, by bringing social development issues to
the forefront. The representation of women candidates contested and elected in
the Loksabha and Vidhana Sabha seats are given in Table 49 and 50.
13.2 Although women have entered in many male dominated professions, their
representation in the higher classes of society and in positions of decision
making is much below that of men.
13.3 The total number of judges in Karnataka during the year 2013-14 was
847of which the number of women judges recorded was 209, whereas male
judges were 638. Number of judges according to gender wise and district wise
details are given in Table 51.
13.4 The percentage of working women in Karnataka State as on 31.3.2012 is
33.75 and the group wise data is given in the table 52. The number of women
IAS , IPS and IFS officers in Karnataka is given in Table 53.
13.5 The percentage representation of women in the three levels of Panchayat
Raj Institutions Grama Panchayat, Taluk Panchayat and Zilla Panchayat are
43.39%, 55.15% and 53.21% and the district wise details are given in the
Tables 54, 55 & 56 respectively.
TABLES

Male Female Total Male Female Persons Rank
1 Belgaum 2423063 2356598 4779661 49.30 82.2 64.54 73.48 17 356
2 Bagalkote 950111 939641 1889752 49.72 79.23 58.4 68.82 23 288
3 Bijapur 1111022 1066309 2177331 48.97 77.21 56.72 67.15 26 207
4 Bidar 870665 832635 1703300 48.88 79.09 61.55 70.51 19 313
5 Raichur 964511 964301 1928812 49.99 70.47 48.73 59.56 29 228
6 Koppal 699926 689994 1389920 49.64 78.54 57.55 68.09 24 250
7 Gadag 537147 527423 1064570 49.54 84.66 65.44 75.12 14 229
8 Dharwad 937206 909817 1847023 49.26 86.37 73.46 80 7 434
9 Uttara Kannada 726256 710913 1437169 49.47 89.63 78.39 84.06 4 140
10 Haveri 819128 778540 1597668 48.73 84 70.46 77.4 10 331
11 Bellary 1236954 1215641 2452595 49.57 76.64 58.09 67.43 25 290
12 Chitradurga 840843 818613 1659456 49.33 81.37 65.88 73.71 16 197
13 Davanagere 986400 959097 1945497 49.30 82.4 68.91 75.74 12 328
14 Shimoga 877415 875338 1752753 49.94 86.07 74.84 80.45 6 207
15 Udupi 562131 615230 1177361 52.26 91.41 81.58 86.24 3 329
16 Chikmagalur 566622 571339 1137961 50.21 85.41 73.16 79.25 8 158
17 Tumkur 1350594 1328386 2678980 49.59 82.81 67.38 75.14 13 253
18 Bangalore 5022661 4598890 9621551 47.80 91.01 84.01 87.67 2 4381
19 Mandya 905085 900684 1805769 49.88 78.27 62.54 70.4 20 364
20 Hassan 883667 892754 1776421 50.26 83.64 68.6 76.07 11 261
21Dakshina
Kannada1034714 1054935 2089649 50.48 93.13 84.13 88.57 1 430
22 Kodagu 274608 279911 554519 50.48 87.19 78.14 82.61 5 135
23 Mysore 1511600 1489527 3001127 49.63 78.46 67.06 72.79 18 476
24 Chamarajanagar 512231 508560 1020791 49.82 67.93 54.92 61.43 28 181
25 Gulbarga 1301755 1264571 2566326 49.28 74.38 55.09 64.85 27 234
26 Yadgir 590329 583942 1174271 49.73 62.25 41.38 51.83 30 223
27 Kolar 776396 760005 1536401 49.47 81.81 66.84 74.39 15 386
28 Chikkaballapura 636437 618667 1255104 49.29 77.75 61.55 69.76 21 296
29 Bangalore (R) 509172 481751 990923 48.62 84.82 70.63 77.93 9 431
30 Ramanagara 548008 534628 1082636 49.38 76.76 61.5 69.22 22 308
30966657 30128640 61095297 49.31417 82.47 68.08 75.36 - 319
Source: As per 2011 Census.
%
Share of
Female
1.Population and Percentage Share of Female Population, Literacy Rate and Density : 2011
Census
Literacy Rate Density
Per
Sq.Km.
KARNATAKA
Sl.No District
Population
39
Males Females Total
1951 9866 9536 19402 49.15
1961 12041 11546 23587 48.95
1971 14972 14327 29299 48.90
1981 18923 18213 37136 49.04
1991 22952 22025 44977 48.97
2001 26899 25952 52851 49.10
2011 30966 30128 61094 49.31
Age group Male Female Persons% to All age
GroupRank
0-4 2582024 2464695 5046719 8.26 6
5-9 2696670 2544839 5241509 8.58 5
10-14 2955287 2781359 5736646 9.39 4
15-19 3042048 2785229 5827277 9.54 2
20-24 3109586 2942972 6052558 9.91 1
25-29 2879254 2892352 5771606 9.45 3
30-34 2389594 2308786 4698380 7.69 7
35-39 2319088 2376363 4695451 7.69 8
40-44 1977768 1848944 3826712 6.26 9
45-49 1804833 1714949 3519782 5.76 10
50-54 1381969 1317301 2699270 4.42 11
55-59 1056054 1086450 2142504 3.51 12
60-64 994630 1065422 2060052 3.37 13
65-69 723687 796432 1520119 2.49 14
70-74 510419 550706 1061125 1.74 15
75-79 249834 274592 524426 0.86 16
80-84 156766 205258 362024 0.59 17
85-89 58153 75585 133738 0.22 18
90-94 30770 43764 74534 0.12 19
95-99 13387 18870 32257 0.05 21
100+ 9426 13331 22757 0.04 22
Age not stated 25410 20441 45851 0.08 20
All ages 30966657 30128640 61095297 100.00 -
3.Population in Five year age groups by sex in Karnataka : 2011 Census
Source: As per 2011 Population Census.
2.Population and Percentage share of female population over last 6
decades
Population ( 000's) % share of
female
population
Year
Source: As per Population Census.
(in numbers)
40

Male Female Persons% to All age
GroupRank
456465 439850 896315 10.47 3
529613 516400 1046013 12.21 2
584988 545650 1130638 13.20 1
480516 401320 881836 10.30 4
369143 355155 724298 8.46 5
330387 367802 698189 8.15 6
282820 292296 575116 6.72 8
292621 313659 606280 7.08 7
245006 217318 462324 5.40 9
215648 195256 410904 4.80 10
167104 150662 317766 3.71 11
97571 107698 205269 2.40 13
112075 121701 233776 2.73 12
61246 73657 134903 1.58 14
57406 61743 119149 1.39 15
22344 24216 46560 0.54 17
30273 36163 66436 0.78 16
4519 3639 8158 0.10 18
4339745 4224185 8563930 100.00
Male Female Persons% to All age
GroupRank
187095 180032 367127 10.60 3
219876 215983 435859 12.58 2
233167 220542 453709 13.10 1
189575 155256 344831 9.95 4
147762 139746 287508 8.30 5
131589 148007 279596 8.07 6
116845 121074 237919 6.87 8
121124 127560 248684 7.18 7
103637 88684 192321 5.55 9
87122 77720 164842 4.76 10
67549 61145 128694 3.72 11
39203 43435 82638 2.39 13
44848 49064 93912 2.71 12
24012 29898 53910 1.56 14
22216 24725 46941 1.36 15
8251 9697 17948 0.52 17
10637 13795 24432 0.71 16
1730 1385 3115 0.09 18
1756238 1707748 3463986 100.00
Age group
All ages
0-4
5-9
10-14
15-19
20-24
35-39
40-44
45-49
75-79
Age not stated
Age group
70-74
75-79
80+
30-34
70-74
20-24
50-54
55-59
60-64
25-29
30-34
65-69
All ages
0-4
5-9
10-14
15-19
80+
25-29
45-49
40-44
Age not stated
(in Numbers)
(in Numbers)
Source: As per 2001 Population Census.
4. Scheduled Castes Population in Five year age groups by sex in Karnataka : 2001
census
5. Scheduled Tribes Population in Five year age groups by sex in Karnataka : 2001
census
50-54
55-59
60-64
65-69
35-39
41

1901 1911 1921 1931 1941 1951 1961 1971 1981 1991 2001 2011
1 Bagalkote 999 995 974 984 977 997 987 987 997 982 980 989
2 Bangalore 982 958 931 928 922 895 890 886 900 903 908 916
3 Bangalore(R) 996 990 972 970 964 970 960 954 955 945 945 946
4 Ramanagara - - - - - - - - - - 964 976
5 Belgaum 980 9647 957 952 947 956 952 947 957 954 960 973
6 Bellary 968 975 967 970 970 956 960 966 975 966 969 983
7 Bidar 990 979 968 959 949 980 971 963 968 952 949 956
8 Bijapur 996 986 957 962 951 963 967 963 970 948 950 960
9 Chamarajnagar 1024 1015 1007 998 975 978 968 955 956 953 971 993
10 Chikmagalur 907 911 910 886 892 896 903 937 953 977 984 1008
11 Chitradurga 967 968 947 952 937 942 942 946 952 951 955 974
12 Dakshina Kannada 1029 1041 1030 1042 1049 1048 1027 1006 1015 1020 1022 1020
13 Davanagere 971 977 957 949 952 956 948 947 944 942 952 972
14 Dharwad 983 970 956 939 936 858 941 928 938 935 949 971
15 Gadag 995 976 993 981 973 987 981 983 981 969 969 982
16 Gulbarga 974 975 973 970 960 993 989 981 981 962 958 971
17 Yadagiri - - - - - - - - - - 982 989
18 Hassan 1010 1019 998 985 977 970 969 974 987 999 1004 1010
19 Haveri 973 973 942 945 944 938 939 938 937 936 944 950
20 Kodagu 801 799 931 803 827 830 862 910 933 979 996 1019
21 Kolar 968 968 957 955 949 973 968 961 971 965 977 979
22 Chikkaballapur - - - - - - - - - - 966 972
23 Koppal NA NA NA NA NA 968 973 979 989 981 983 986
24 Mandya 1032 1028 999 995 982 990 967 960 960 963 986 995
25 Mysore 1009 1007 989 976 961 966 942 936 948 953 964 985
26 Raichur NA NA NA NA NA 1004 994 982 988 978 983 1000
27 Shimoga 894 897 892 860 869 878 879 919 944 964 978 998
28 Tumkur 985 977 958 962 951 958 956 957 961 959 967 984
29 Udupi 1125 1112 1099 1120 1123 1150 1165 1140 1130 1134 1130 1094
30 Uttara Kannada 925 956 968 952 965 967 946 957 958 966 971 979
983 981 969 965 960 966 959 957 963 960 965 973
6. Sex Ratio (Number of Females per 1000 Males)
KARNATAKA
Sl.
No.District
Decadial Sex Ratio
Source:As per population Census
983981
969965
960
966
959957
963960
965
973
940
945
950
955
960
965
970
975
980
985
1901 1911 1921 1931 1941 1951 1961 1971 1981 1991 2001 2011
SE
X R
AT
IO
YEAR
SEX RATIO (FEMALES PER 1000 MALES)
42

Total Male Female Total Male Female
1 Bagalkote 264872 136564 128308 271908 140551 131357
2 Bangalore 772540 397648 374892 1052837 541656 511181
3 Bangalore(R) 225618 116172 109446 107062 54908 52154
4 Ramanagara - - - 107841 54963 52878
5 Belgaum 624031 324816 299215 626269 323761 302508
6 Bellary 319086 163892 155194 344152 175543 168609
7 Bidar 241517 124401 117116 224442 115550 108892
8 Bijapur 286831 148750 138081 318406 164856 153550
9 Chamarajnagar 114937 58511 56426 100648 51529 49119
10 Chikmagalur 138644 70779 67865 105328 53493 51835
11 Chitradurga 199535 102512 97023 184280 94629 89651
12 Dakshina Kannada 228060 116854 111206 208297 106985 101312
13 Davanagere 240275 123496 116779 217731 111793 105938
14 Dharwad 218262 112335 105927 219942 113127 106815
15 Gadag 137835 70627 67208 132442 68025 64417
16 Gulbarga 536454 276843 259611 365372 188076 177296
17 Yadagiri - - - 190279 97522 92757
18 Hassan 199665 101971 97694 165637 83971 81666
19 Haveri 203712 104119 99593 195317 100369 94948
20 Kodagu 69574 35192 34382 54733 27676 27057
21 Kolar 336469 171728 164741 170423 86845 83578
22 Chikkaballapur - - - 132286 67734 64552
23 Koppal 208004 106499 101505 201654 103016 98638
24 Mandya 205147 106058 99089 172685 89063 83622
25 Mysore 323555 164934 158621 305561 155807 149754
26 Raichur 283068 144097 138971 283733 145468 138265
27 Shimoga 208163 106423 101740 182751 93221 89530
28 Tumkur 308162 158079 150083 265742 135671 130071
29 Udupi 114581 58509 56072 103160 52689 50471
30 Uttara Kannada 173503 89149 84354 150115 76794 73321
7182100 3690958 3491142 7161033 3675291 3485742
Source: As per population Census 2001 & 2011.
Child Population (0-6 years)
2011
7. CHILD POPULATION (0-6 YEARS) 2001 and 2011
KARNATAKA
Sl.
No.
State/
District
Child Population (0-6 years)
2001
43

Sl.No. District 1991 2001 2011 Rank*
1 Bagalkot 960 940 935 28
2 Bangalore 957 943 944 23
3 Bangalore(R) 939 950 16
4 Ramangara 945 962 4
5 Belgaum 955 921 934 29
6 Bellary 956 947 960 7
7 Bidar 962 941 942 26
8 Bijapur 952 928 931 30
9 Chamarajnagar 961 964 953 13
10 Chikmagalur 978 959 969 3
11 Chitradurga 967 946 947 19
12 Dakshina Kannada 962 952 947 19
13 Davanagere 953 946 948 18
14 Dharwad 947 943 944 23
15 Gadag 955 952 947 19
16 Gulbarga 931 943 25
17 Yadagiri 952 951 15
18 Hassan 967 958 973 2
19 Haveri 954 957 946 22
20 Kodagu 957 977 978 1
21 Kolar 965 962 4
22 Chikkaballapur 952 953 13
23 Koppal 961 953 958 10
24 Mandya 959 934 939 27
25 Mysore 967 961 6
26 Raichur 968 950 16
27 Shimoga 964 956 960 7
28 Tumkur 970 949 959 9
29 Udupi 972 958 958 10
30 Uttara Kannada 949 946 955 12
960 946 948 -
Source: As per population Census.
KARNATAKA
8. Sex Ratio (0-6 age group)
Note:*Rank for 2011census
950
959
971
962
44
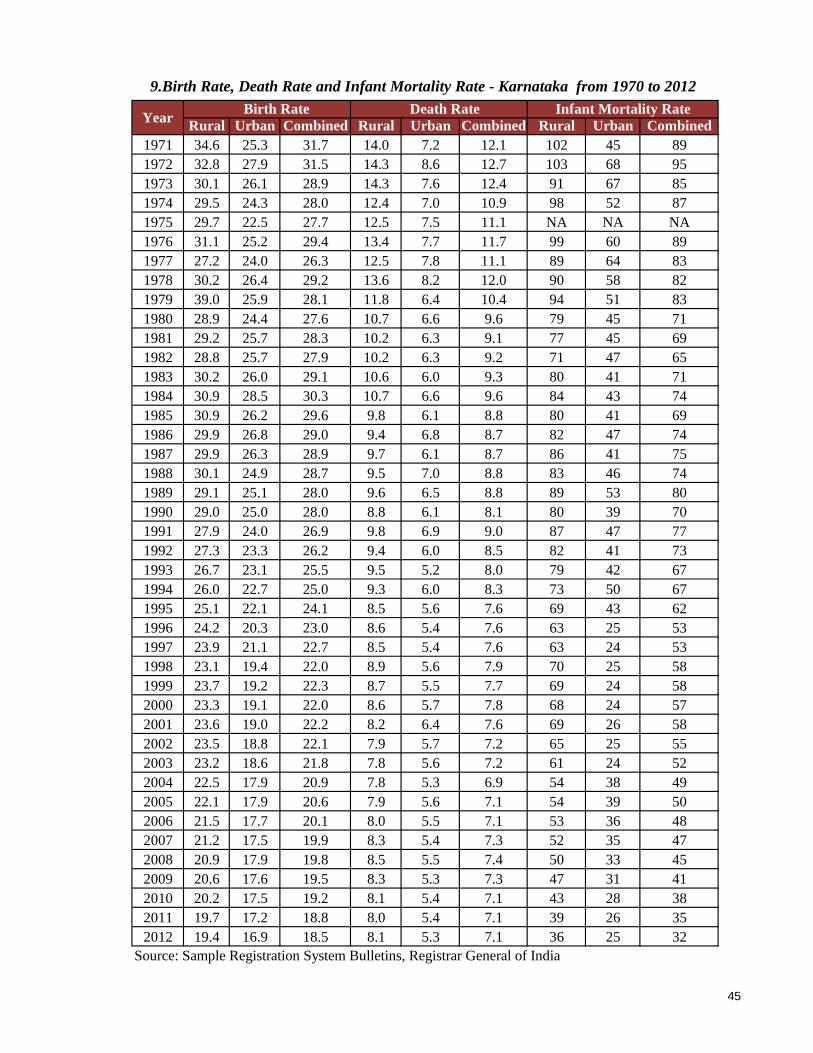
Rural Urban Combined Rural Urban Combined Rural Urban Combined
1971 34.6 25.3 31.7 14.0 7.2 12.1 102 45 89
1972 32.8 27.9 31.5 14.3 8.6 12.7 103 68 95
1973 30.1 26.1 28.9 14.3 7.6 12.4 91 67 85
1974 29.5 24.3 28.0 12.4 7.0 10.9 98 52 87
1975 29.7 22.5 27.7 12.5 7.5 11.1 NA NA NA
1976 31.1 25.2 29.4 13.4 7.7 11.7 99 60 89
1977 27.2 24.0 26.3 12.5 7.8 11.1 89 64 83
1978 30.2 26.4 29.2 13.6 8.2 12.0 90 58 82
1979 39.0 25.9 28.1 11.8 6.4 10.4 94 51 83
1980 28.9 24.4 27.6 10.7 6.6 9.6 79 45 71
1981 29.2 25.7 28.3 10.2 6.3 9.1 77 45 69
1982 28.8 25.7 27.9 10.2 6.3 9.2 71 47 65
1983 30.2 26.0 29.1 10.6 6.0 9.3 80 41 71
1984 30.9 28.5 30.3 10.7 6.6 9.6 84 43 74
1985 30.9 26.2 29.6 9.8 6.1 8.8 80 41 69
1986 29.9 26.8 29.0 9.4 6.8 8.7 82 47 74
1987 29.9 26.3 28.9 9.7 6.1 8.7 86 41 75
1988 30.1 24.9 28.7 9.5 7.0 8.8 83 46 74
1989 29.1 25.1 28.0 9.6 6.5 8.8 89 53 80
1990 29.0 25.0 28.0 8.8 6.1 8.1 80 39 70
1991 27.9 24.0 26.9 9.8 6.9 9.0 87 47 77
1992 27.3 23.3 26.2 9.4 6.0 8.5 82 41 73
1993 26.7 23.1 25.5 9.5 5.2 8.0 79 42 67
1994 26.0 22.7 25.0 9.3 6.0 8.3 73 50 67
1995 25.1 22.1 24.1 8.5 5.6 7.6 69 43 62
1996 24.2 20.3 23.0 8.6 5.4 7.6 63 25 53
1997 23.9 21.1 22.7 8.5 5.4 7.6 63 24 53
1998 23.1 19.4 22.0 8.9 5.6 7.9 70 25 58
1999 23.7 19.2 22.3 8.7 5.5 7.7 69 24 58
2000 23.3 19.1 22.0 8.6 5.7 7.8 68 24 57
2001 23.6 19.0 22.2 8.2 6.4 7.6 69 26 58
2002 23.5 18.8 22.1 7.9 5.7 7.2 65 25 55
2003 23.2 18.6 21.8 7.8 5.6 7.2 61 24 52
2004 22.5 17.9 20.9 7.8 5.3 6.9 54 38 49
2005 22.1 17.9 20.6 7.9 5.6 7.1 54 39 50
2006 21.5 17.7 20.1 8.0 5.5 7.1 53 36 48
2007 21.2 17.5 19.9 8.3 5.4 7.3 52 35 47
2008 20.9 17.9 19.8 8.5 5.5 7.4 50 33 45
2009 20.6 17.6 19.5 8.3 5.3 7.3 47 31 41
2010 20.2 17.5 19.2 8.1 5.4 7.1 43 28 38
2011 19.7 17.2 18.8 8.0 5.4 7.1 39 26 35
2012 19.4 16.9 18.5 8.1 5.3 7.1 36 25 32
Source: Sample Registration System Bulletins, Registrar General of India
9.Birth Rate, Death Rate and Infant Mortality Rate - Karnataka from 1970 to 2012
Year Birth Rate Death Rate Infant Mortality Rate
45

Persons Male Female Persons Male Female
1 Bagalkot 59.0 58.0 60.0 60.8 60.3 61.3
2 Bangalore(R)
3 Ramanagara
4 Bangalore 64.8 63.3 66.3 67.3 65.9 68.7
5 Belgaum 64.4 63.4 65.4 67.7 66.2 69.2
6 Bellary 62.8 61.8 63.7 66.1 64.6 67.6
7 Bidar 61.0 60.0 62.0 63.3 62.3 64.3
8 Bijapur 59.2 58.3 60.0 62.6 61.6 63.6
9 Chamarajnagar 62.5 61.5 63.5 63.5 62.5 64.5
10 Chikmagalur 60.0 59.0 61.1 63.2 62.2 64.2
11 Chitradurga 62.8 61.8 63.8 64.6 63.6 65.6
12 Dakshina Kannada 66.0 64.5 67.5 67.4 65.9 68.5
13 Davanagere 63.0 62.0 64.0 65.8 64.3 67.3
14 Dharwad 59.1 58.2 60.0 61.9 61.4 62.4
15 Gadag 60.0 59.0 61.0 62.7 61.7 63.7
16 Gulbarga
17 Yadagiri
18 Hassan 59.5 58.6 60.3 65.2 63.7 66.7
19 Haveri 59.6 58.5 60.7 62.2 61.2 63.2
20 Kodagu 61.0 60.0 62.0 63.3 62.3 64.3
21 Kolar
22 Chikkaballapur
23 Koppal 60.0 59.0 61.0 63.5 62.5 64.5
24 Mandya 60.9 59.9 61.8 62.9 61.9 63.9
25 Mysore 62.9 61.8 63.9 64.8 62.8 66.3
26 Raichur 60.0 59.5 61.2 63.9 62.9 64.9
27 Shimoga 65.8 64.3 67.3 67.4 65.9 68.9
28 Tumkur 63.0 62.0 64.0 65.3 63.8 66.8
29 Udupi 66.1 64.6 67.6 67.8 66.3 69.3
30 Uttara Kannada 60.9 59.9 61.8 62.9 61.9 63.9
62.1 61.0 63.2 65.8 64.5 67.0
61.9
KARNATAKA
62.9
62
59.5 58.5 60.4
Source: Human Development Report 2005
66.5 65 68
61
63.9
63 64.2 63.2 65.2
10. Life Expectancy at Birth : 1991-92 and 2001-02
Sl No District1991-92 2001-02
64.4 63 65.8
46
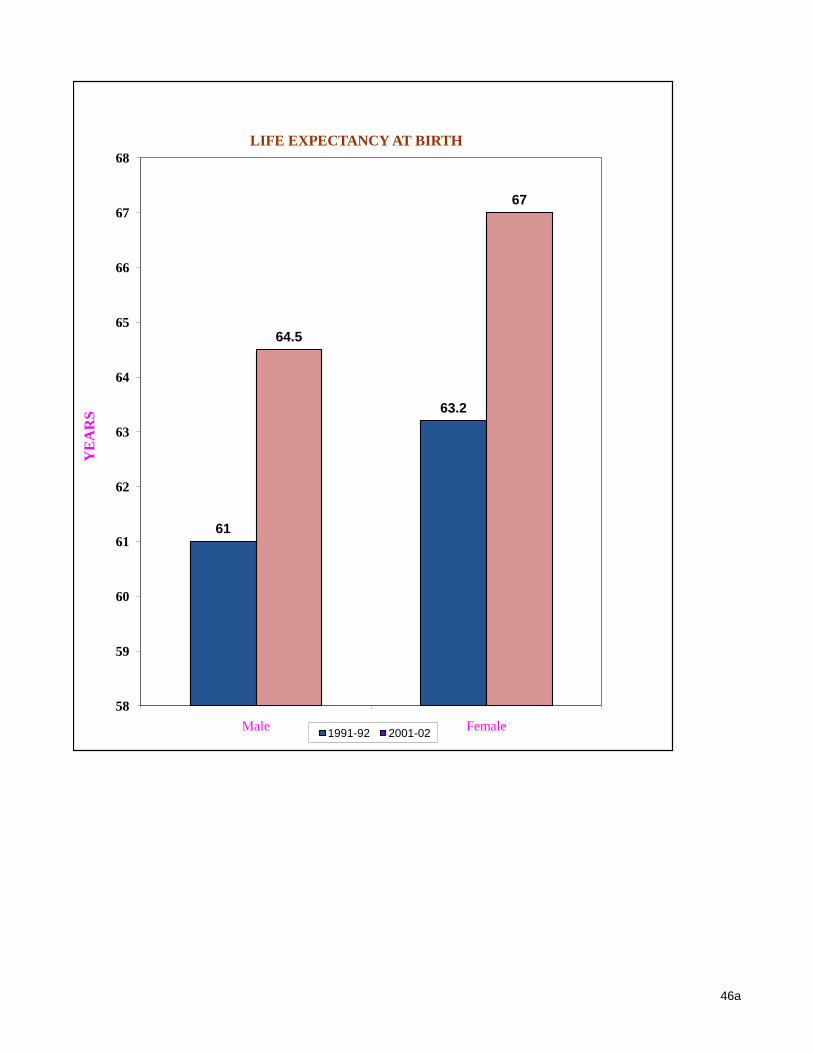
61
63.2
64.5
67
58
59
60
61
62
63
64
65
66
67
68
Male Female
YE
AR
S
LIFE EXPECTANCY AT BIRTH
1991-92 2001-02
46a
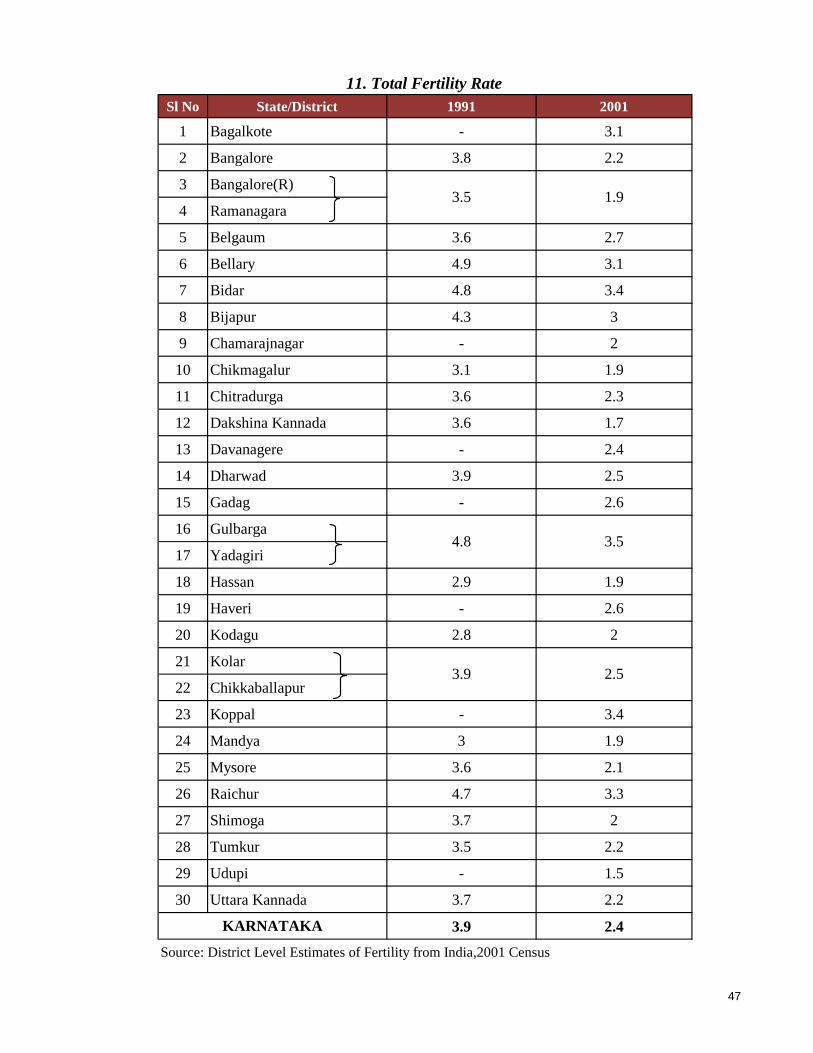
Sl No State/District 1991 2001
1 Bagalkote - 3.1
2 Bangalore 3.8 2.2
3 Bangalore(R)
4 Ramanagara
5 Belgaum 3.6 2.7
6 Bellary 4.9 3.1
7 Bidar 4.8 3.4
8 Bijapur 4.3 3
9 Chamarajnagar - 2
10 Chikmagalur 3.1 1.9
11 Chitradurga 3.6 2.3
12 Dakshina Kannada 3.6 1.7
13 Davanagere - 2.4
14 Dharwad 3.9 2.5
15 Gadag - 2.6
16 Gulbarga
17 Yadagiri
18 Hassan 2.9 1.9
19 Haveri - 2.6
20 Kodagu 2.8 2
21 Kolar
22 Chikkaballapur
23 Koppal - 3.4
24 Mandya 3 1.9
25 Mysore 3.6 2.1
26 Raichur 4.7 3.3
27 Shimoga 3.7 2
28 Tumkur 3.5 2.2
29 Udupi - 1.5
30 Uttara Kannada 3.7 2.2
3.9 2.4
3.9 2.5
11. Total Fertility Rate
KARNATAKA
Source: District Level Estimates of Fertility from India,2001 Census
3.5 1.9
4.8 3.5
47
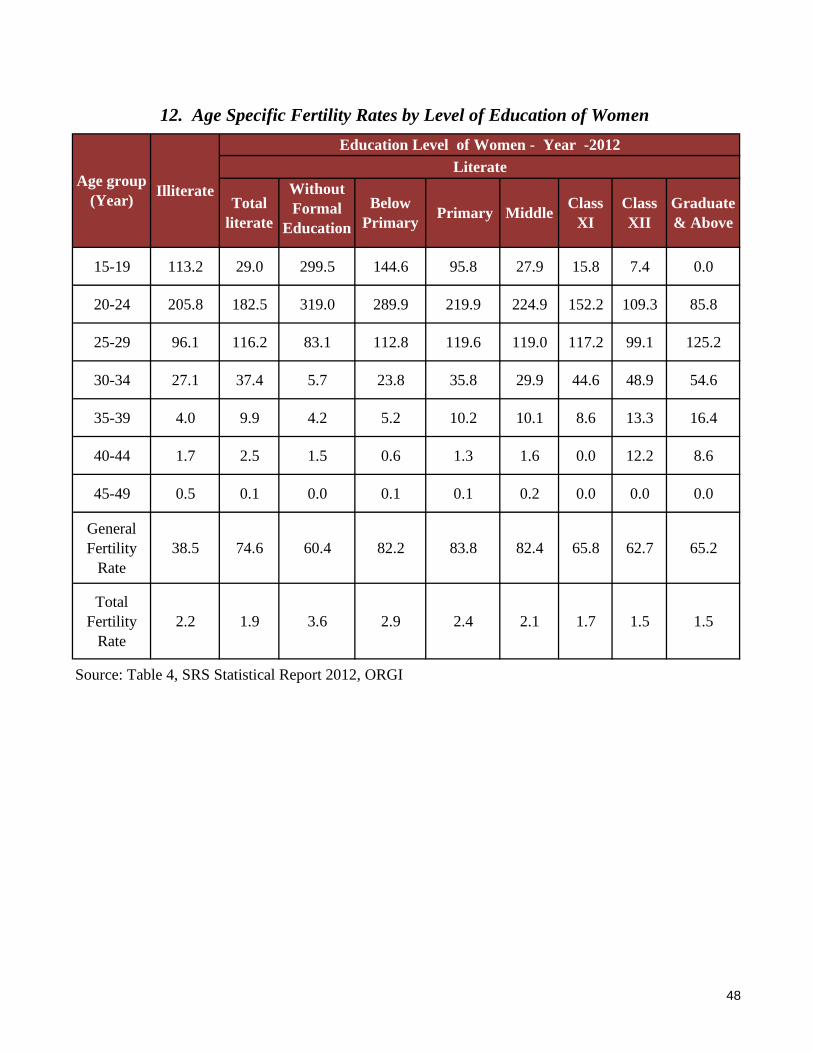
15-19 113.2 29.0 299.5 144.6 95.8 27.9 15.8 7.4 0.0
20-24 205.8 182.5 319.0 289.9 219.9 224.9 152.2 109.3 85.8
25-29 96.1 116.2 83.1 112.8 119.6 119.0 117.2 99.1 125.2
30-34 27.1 37.4 5.7 23.8 35.8 29.9 44.6 48.9 54.6
35-39 4.0 9.9 4.2 5.2 10.2 10.1 8.6 13.3 16.4
40-44 1.7 2.5 1.5 0.6 1.3 1.6 0.0 12.2 8.6
45-49 0.5 0.1 0.0 0.1 0.1 0.2 0.0 0.0 0.0
General
Fertility
Rate
38.5 74.6 60.4 82.2 83.8 82.4 65.8 62.7 65.2
Total
Fertility
Rate
2.2 1.9 3.6 2.9 2.4 2.1 1.7 1.5 1.5
Graduate
& Above
Source: Table 4, SRS Statistical Report 2012, ORGI
12. Age Specific Fertility Rates by Level of Education of Women
Age group
(Year)Illiterate
Education Level of Women - Year -2012
Literate
Total
literate
Without
Formal
Education
Below
Primary Primary Middle
Class
XI
Class
XII
48

Never
MarriedMarried W/D/S Total
Never
MarriedMarried W/D/S Total
Never
MarriedMarried W/D/S Total
<10 Years 16.7 0 0 16.7 17.1 0 0 17.7 16.3 0 0 17.2
10-14 8.8 0 0 8.8 9.2 0 0 9.5 8.4 0 0 8.9
15-19 8.5 0.6 0 9.1 9.3 0.1 0 9.9 7.6 1.1 0 9.4
20-24 6.3 4.0 0 10.3 8.5 1.3 0 10.3 3.9 6.8 0.1 11
25-29 3.0 6.3 0.1 9.4 4.7 4.8 0 9.2 1.3 7.9 0.2 8.8
30-34 1.0 7.2 0.3 8.5 1.6 7.0 0.1 8.4 0.4 7.5 0.5 8.5
35-39 0.3 6.6 0.4 7.3 0.4 6.7 0.1 6.9 0.2 6.5 0.6 6.9
40-44 0.1 6.2 0.5 6.8 0.2 6.5 0.1 6.6 0.1 5.8 0.9 6.9
45-49 0.1 5.0 0.6 5.7 0.1 5.4 0.1 5.6 0.1 4.6 1.1 5.4
50-54 0 4.1 0.7 4.8 0.1 4.9 0.2 4.9 0 3.4 1.2 4.2
55-59 0 3.1 0.8 3.9 0 3.5 0.2 3.6 0 2.8 1.5 4.6
60-64 0 2.3 0.9 3.2 0 2.8 0.2 2.7 0 1.7 1.6 2.6
65-69 0 1.4 0.9 2.3 0 2 0.2 2.1 0 0.8 1.5 2.1
70-74 0 0.8 0.8 1.6 0 1.2 0.2 1.3 0 0.4 1.4 1.6
75-79 0 0.4 0.6 1.0 0 0.6 0.2 0.8 0 0.1 1.0 1.0
80-84 0 0.2 0.3 0.5 0 0.3 0.1 0.4 0 0 0.4 0.5
85+ 0 0.1 0.2 0.3 0 0.1 0.1 0.2 0 0 0.4 0.4
All ages 44.8 48.3 6.9 100 51.2 47.2 1.6 100 38.3 49.4 12.4 100
Note: W/D/S= Widowed,Divorced, Separated
Source: Sample Registration System Statistical Report 2012.
13. Percentage distribution of population by sex,marital status and age group : 2012
Age
group
Total Males Females
49
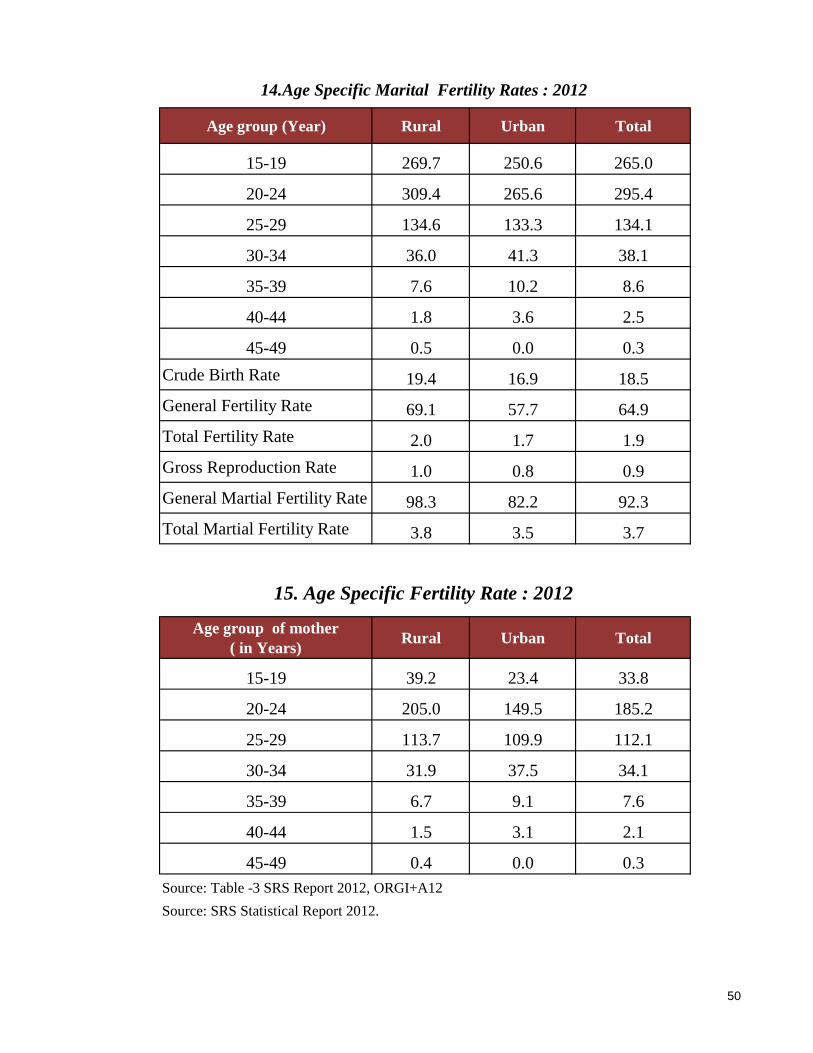
Age group (Year) Rural Urban Total
15-19 269.7 250.6 265.0
20-24 309.4 265.6 295.4
25-29 134.6 133.3 134.1
30-34 36.0 41.3 38.1
35-39 7.6 10.2 8.6
40-44 1.8 3.6 2.5
45-49 0.5 0.0 0.3
Crude Birth Rate 19.4 16.9 18.5
General Fertility Rate 69.1 57.7 64.9
Total Fertility Rate 2.0 1.7 1.9
Gross Reproduction Rate 1.0 0.8 0.9
General Martial Fertility Rate 98.3 82.2 92.3
Total Martial Fertility Rate 3.8 3.5 3.7
Age group of mother
( in Years)Rural Urban Total
15-19 39.2 23.4 33.8
20-24 205.0 149.5 185.2
25-29 113.7 109.9 112.1
30-34 31.9 37.5 34.1
35-39 6.7 9.1 7.6
40-44 1.5 3.1 2.1
45-49 0.4 0.0 0.3
Source: SRS Statistical Report 2012.
14.Age Specific Marital Fertility Rates : 2012
Source: Table -3 SRS Report 2012, ORGI+A12
15. Age Specific Fertility Rate : 2012
50
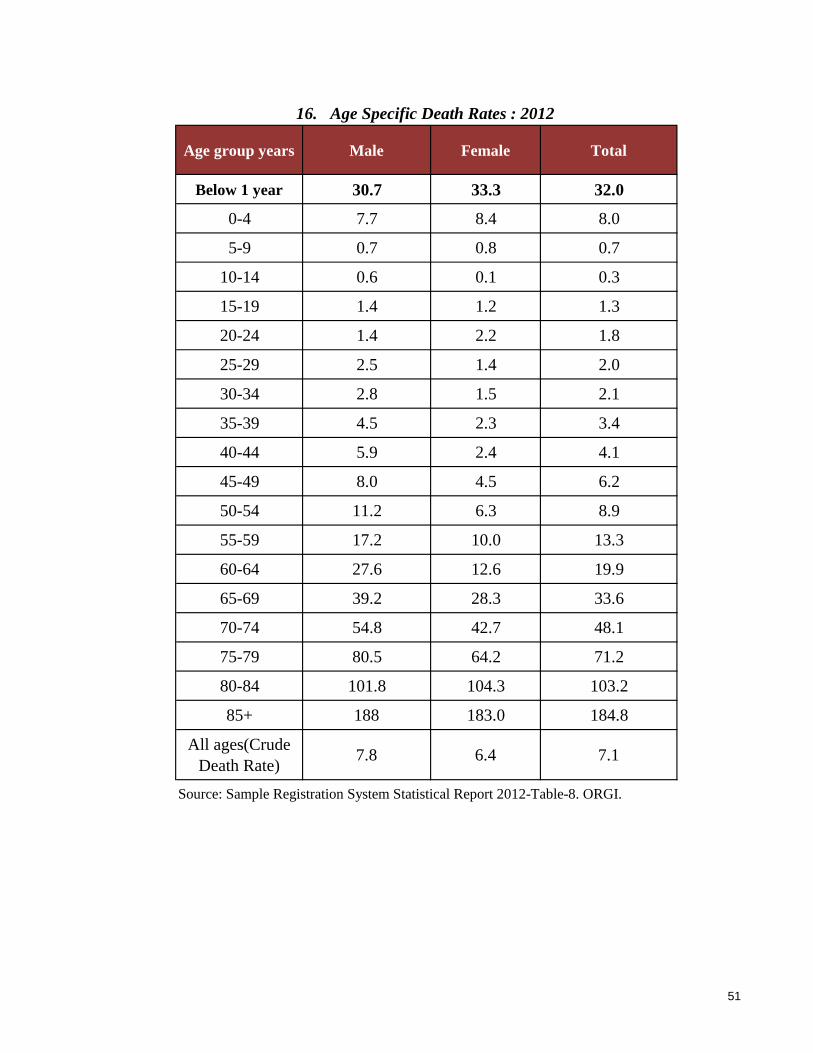
Age group years Male Female Total
Below 1 year 30.7 33.3 32.0
0-4 7.7 8.4 8.0
5-9 0.7 0.8 0.7
10-14 0.6 0.1 0.3
15-19 1.4 1.2 1.3
20-24 1.4 2.2 1.8
25-29 2.5 1.4 2.0
30-34 2.8 1.5 2.1
35-39 4.5 2.3 3.4
40-44 5.9 2.4 4.1
45-49 8.0 4.5 6.2
50-54 11.2 6.3 8.9
55-59 17.2 10.0 13.3
60-64 27.6 12.6 19.9
65-69 39.2 28.3 33.6
70-74 54.8 42.7 48.1
75-79 80.5 64.2 71.2
80-84 101.8 104.3 103.2
85+ 188 183.0 184.8
All ages(Crude
Death Rate)7.8 6.4 7.1
16. Age Specific Death Rates : 2012
Source: Sample Registration System Statistical Report 2012-Table-8. ORGI.
51
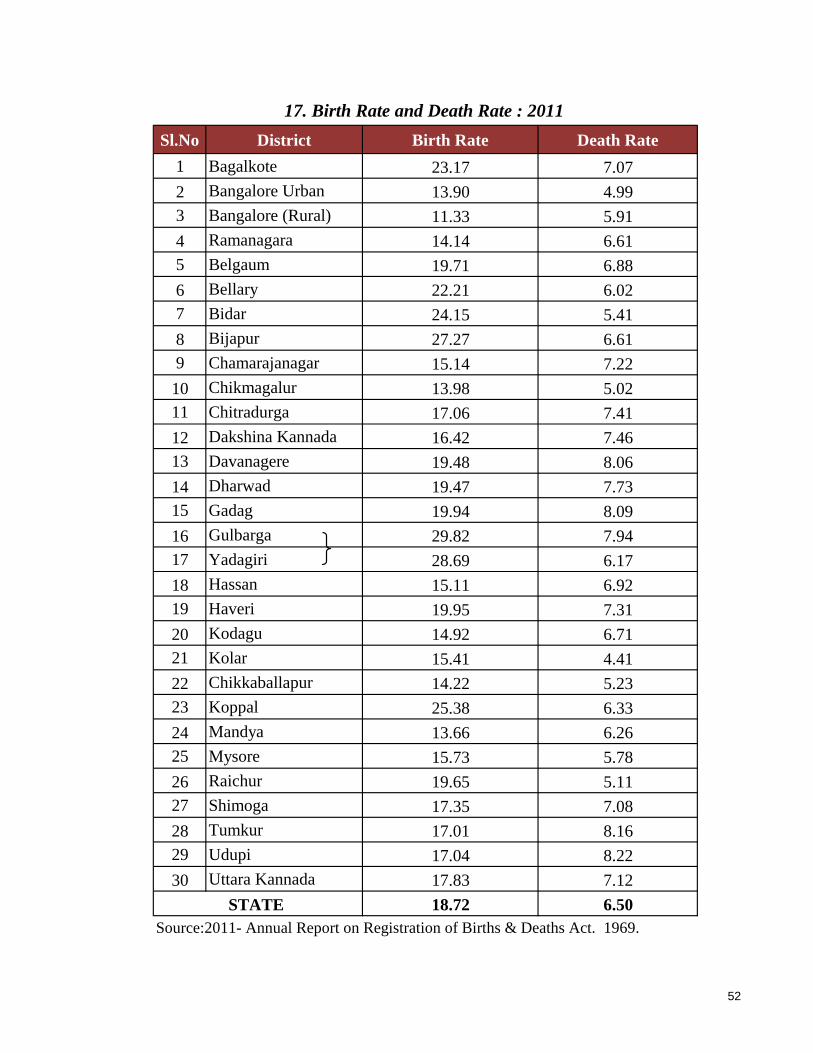
Sl.No District Birth Rate Death Rate
1 Bagalkote 23.17 7.07
2 Bangalore Urban 13.90 4.99
3 Bangalore (Rural) 11.33 5.91
4 Ramanagara 14.14 6.61
5 Belgaum 19.71 6.88
6 Bellary 22.21 6.02
7 Bidar 24.15 5.41
8 Bijapur 27.27 6.61
9 Chamarajanagar 15.14 7.22
10 Chikmagalur 13.98 5.02
11 Chitradurga 17.06 7.41
12 Dakshina Kannada 16.42 7.46
13 Davanagere 19.48 8.06
14 Dharwad 19.47 7.73
15 Gadag 19.94 8.09
16 Gulbarga 29.82 7.94
17 Yadagiri 28.69 6.17
18 Hassan 15.11 6.92
19 Haveri 19.95 7.31
20 Kodagu 14.92 6.71
21 Kolar 15.41 4.41
22 Chikkaballapur 14.22 5.23
23 Koppal 25.38 6.33
24 Mandya 13.66 6.26
25 Mysore 15.73 5.78
26 Raichur 19.65 5.11
27 Shimoga 17.35 7.08
28 Tumkur 17.01 8.16
29 Udupi 17.04 8.22
30 Uttara Kannada 17.83 7.12
18.72 6.50STATE
17. Birth Rate and Death Rate : 2011
Source:2011- Annual Report on Registration of Births & Deaths Act. 1969.
52
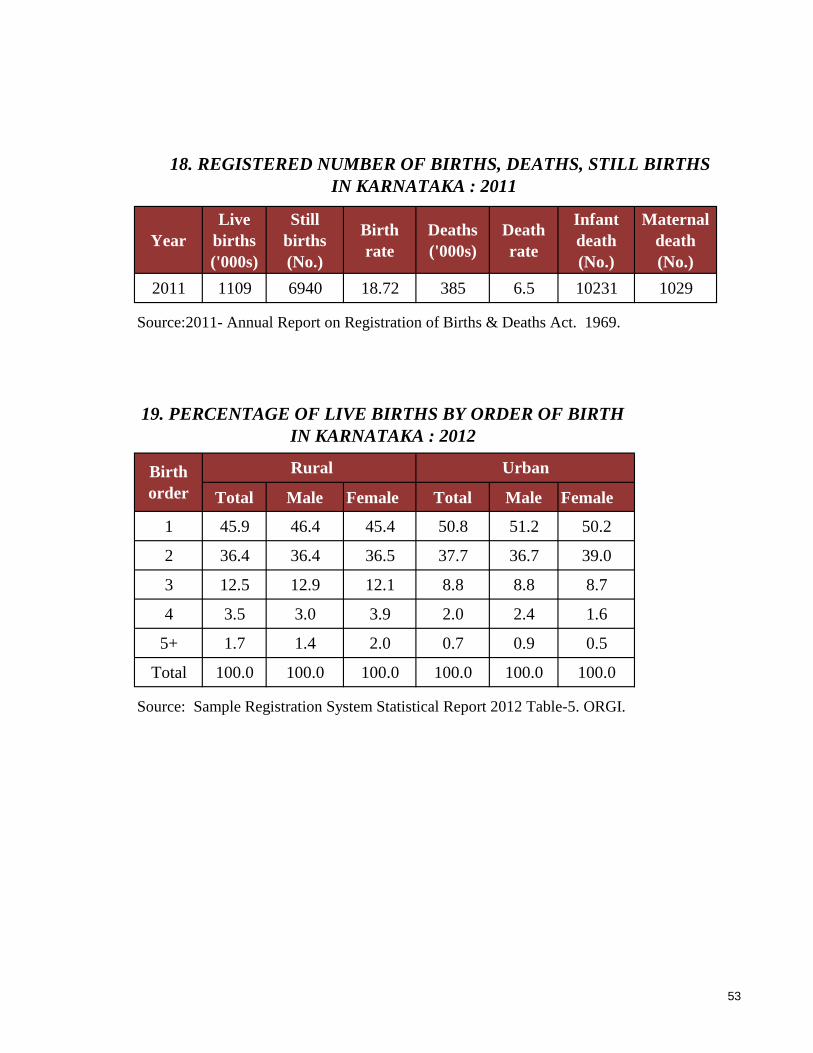
Year
Live
births
('000s)
Still
births
(No.)
Birth
rate
Deaths
('000s)
Death
rate
Infant
death
(No.)
Maternal
death
(No.)
2011 1109 6940 18.72 385 6.5 10231 1029
Total Male Female Total Male Female
1 45.9 46.4 45.4 50.8 51.2 50.2
2 36.4 36.4 36.5 37.7 36.7 39.0
3 12.5 12.9 12.1 8.8 8.8 8.7
4 3.5 3.0 3.9 2.0 2.4 1.6
5+ 1.7 1.4 2.0 0.7 0.9 0.5
Total 100.0 100.0 100.0 100.0 100.0 100.0
18. REGISTERED NUMBER OF BIRTHS, DEATHS, STILL BIRTHS
IN KARNATAKA : 2011
Birth
order
Rural Urban
Source: Sample Registration System Statistical Report 2012 Table-5. ORGI.
Source:2011- Annual Report on Registration of Births & Deaths Act. 1969.
19. PERCENTAGE OF LIVE BIRTHS BY ORDER OF BIRTH
IN KARNATAKA : 2012
53
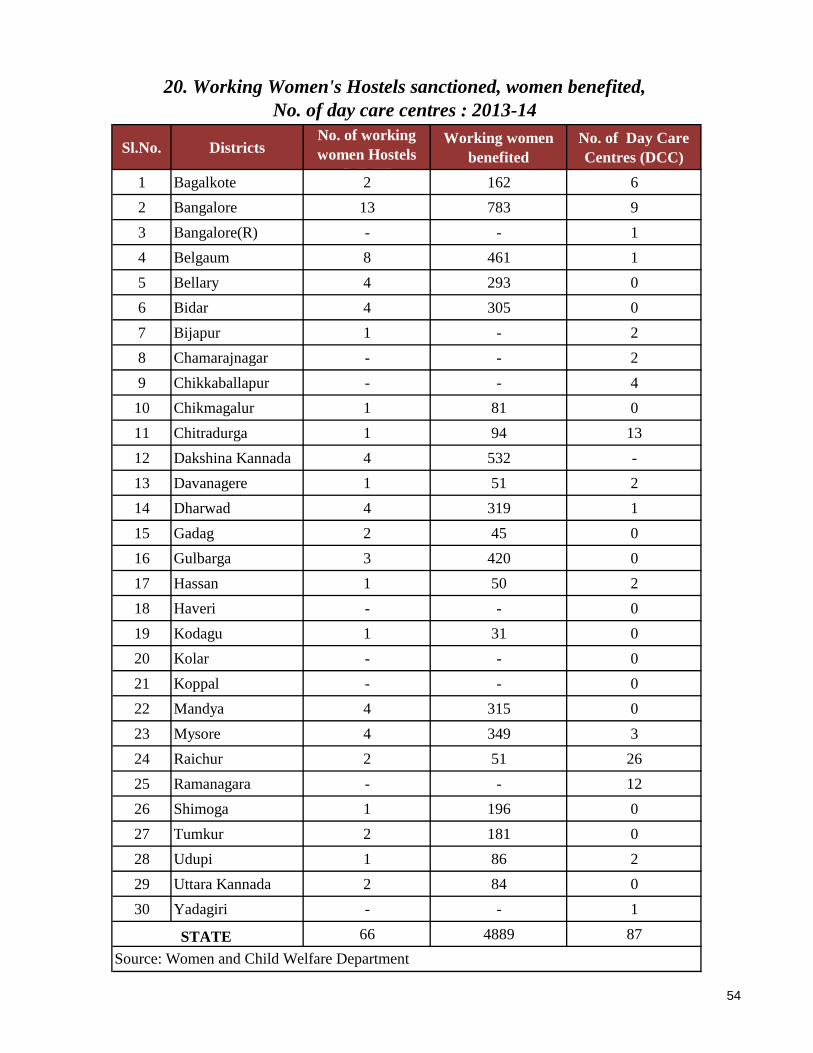
Sl.No. DistrictsNo. of working
women Hostels
(WWH)
Working women
benefited
No. of Day Care
Centres (DCC)
1 Bagalkote 2 162 6
2 Bangalore 13 783 9
3 Bangalore(R) - - 1
4 Belgaum 8 461 1
5 Bellary 4 293 0
6 Bidar 4 305 0
7 Bijapur 1 - 2
8 Chamarajnagar - - 2
9 Chikkaballapur - - 4
10 Chikmagalur 1 81 0
11 Chitradurga 1 94 13
12 Dakshina Kannada 4 532 -
13 Davanagere 1 51 2
14 Dharwad 4 319 1
15 Gadag 2 45 0
16 Gulbarga 3 420 0
17 Hassan 1 50 2
18 Haveri - - 0
19 Kodagu 1 31 0
20 Kolar - - 0
21 Koppal - - 0
22 Mandya 4 315 0
23 Mysore 4 349 3
24 Raichur 2 51 26
25 Ramanagara - - 12
26 Shimoga 1 196 0
27 Tumkur 2 181 0
28 Udupi 1 86 2
29 Uttara Kannada 2 84 0
30 Yadagiri - - 1
66 4889 87
Source: Women and Child Welfare Department
STATE
20. Working Women's Hostels sanctioned, women benefited,
No. of day care centres : 2013-14
54

Physical
(in Nos)
Financial (Rs.in
lakhs)
Amount
ReceivedExpenditure
1 Bagalkote 223891 3167.27 150 2.75 0.82
2 Bangalore 174679 2573.51 80 3.85 0.00
3 Bangalore(R) 90217 1189.33 0 0.00 0.00
4 Ramanagara 74535 1246.46 60 3.30 0.00
5 Belgaum 543797 7780.46 90 4.40 0.00
6 Bellary 376309 6502.18 0 0.00 0.00
7 Bidar 210622 2784.29 261 3.85 2.09
8 Bijapur 267548 3796.94 0 0.00 0.00
9 Chamarajnagar 96931 1538.19 720 2.75 2.20
10 Chikmagalur 115210 1682.79 0 0.00 0.00
11 Chitradurga 169374 2679.72 135 3.85 0.00
12 Dakshina Kannada 131417 1990.49 570 4.95 1.76
13 Davanagere 176850 2254.75 1800 4.40 2.29
14 Dharwad 202759 2739.70 0 0.00 0.00
15 Gadag 116935 2022.97 1216 3.85 0.55
16 Gulbarga 414352 7114.56 0 0.00 0.00
17 Yadagiri 135455 1702.80 423 2.75 0.73
18 Hassan 127470 1900.32 767 3.85 4.08
19 Haveri 178552 2806.93 505 6.60 0.30
20 Kodagu 52232 751.72 0 0.00 0.00
21 Kolar 178811 2974.07 0 0.00 0.00
22 Chikkaballapura 113377 2004.86 1200 4.40 0.00
23 Koppal 186616 1685.20 470 2.75 0.55
24 Mandya 152056 2478.87 722 3.85 3.80
25 Mysore 212837 2895.36 140 2.75 4.41
26 Raichur 288710 4705.34 150 4.40 9.98
27 Shimoga 141959 2417.11 723 7.70 0.00
28 Tumkur 216648 3414.64 1050 3.85 0.00
29 Udupi 81329 1285.54 140 2.47 0.55
30 Uttara Kannada 169541 2546.52 0 0.00 0.00
5621019 84632.89 11372 83.32 34.11
Source: Women and Child Welfare Department
21. Physical and Financial Progress for Supplementary Nutrition Programme and Kishori
shakti Yojana: 2013-14
STATE
Note: Physical (¨sËwPÀ) $ 6 months to 6 years Children, Pregnant & lactating mothers, Adolescent Girls.
Sl. No. District
Supplementary Nutrition
Programme (Progress) No.of Adolescent
Girls (Given
Training)
Kishori shakti Yojana
Financial Progress
(Rs.in lakhs)
55
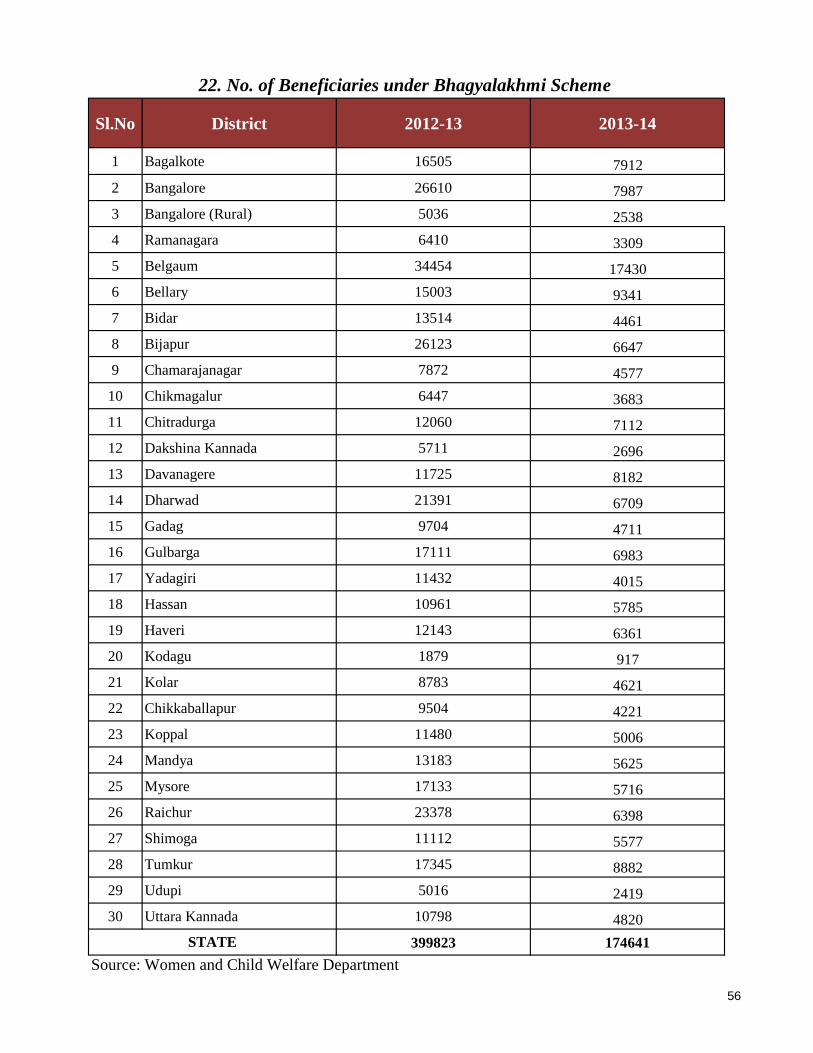
Sl.No District 2012-13 2013-14
1 Bagalkote 16505 7912
2 Bangalore 26610 7987
3 Bangalore (Rural) 5036 2538
4 Ramanagara 6410 3309
5 Belgaum 34454 17430
6 Bellary 15003 9341
7 Bidar 13514 4461
8 Bijapur 26123 6647
9 Chamarajanagar 7872 4577
10 Chikmagalur 6447 3683
11 Chitradurga 12060 7112
12 Dakshina Kannada 5711 2696
13 Davanagere 11725 8182
14 Dharwad 21391 6709
15 Gadag 9704 4711
16 Gulbarga 17111 6983
17 Yadagiri 11432 4015
18 Hassan 10961 5785
19 Haveri 12143 6361
20 Kodagu 1879 917
21 Kolar 8783 4621
22 Chikkaballapur 9504 4221
23 Koppal 11480 5006
24 Mandya 13183 5625
25 Mysore 17133 5716
26 Raichur 23378 6398
27 Shimoga 11112 5577
28 Tumkur 17345 8882
29 Udupi 5016 2419
30 Uttara Kannada 10798 4820
399823 174641
Source: Women and Child Welfare Department
22. No. of Beneficiaries under Bhagyalakhmi Scheme
STATE
56

Boys Girls Boys Girls Boys Girls Boys Girls Boys Girls
1 Bagalkote - - 981 1064 - - - - 311 273
2 Bangalore 189 194 8 11 60 88 98 107 269 326
3 Bangalore (Rural) 119 48 158 62 81 39 70 34 52 22
4 Ramanagara - - - - 40 23 35 29 43 41
5 Belgaum 855 745 - - - - 29 31 40 34
6 Bellary 89 40 169 64 - - 20 3 138 147
7 Bidar 178 85 32 - 35 - 51 - 110 -
8 Bijapur - - - - - - 28 - 39 50
9 Chamarajanagar 56 - 29 7 27 - 97 26 17 -
10 Chikmagalur - - - - - - 1 1 - -
11 Chitradurga 55 14 - - 8 2 25 10 - -
12 Dakshina Kannada - - - - - - - - - -
13 Davanagere - - - - - - - - - -
14 Dharwad 46 30 79 72 - - 1 1 2 2
15 Gadag 6 2 2 3 1 3 4 - 6 2
16 Gulbarga 295 263 - - 182 286 37 59 39 63
17 Yadagiri - - - - - - 320 165 255 137
18 Hassan 11 2 - - - - - - - -
19 Haveri - - - - - - - - - -
20 Kodagu - - - - 2 1 9 2 - -
21 Kolar - - - - - - - - - -
22 Chikkaballapur - - - - - - - - 69 -
23 Koppal 56 64 - - 195 162 647 292 299 205
24 Mandya - - - - 220 80 180 50 110 50
25 Mysore 44 37 22 20 47 46 24 23 12 8
26 Raichur 347 275 508 589 - - 81 17 152 91
27 Shimoga 37 32 28 20 48 31 56 48 39 47
28 Tumkur - - - - - - 188 72 120 25
29 Udupi - - - - - - 2 - 8 -
30 Uttara Kannada - - 2 1 - - - - - -
2383 1831 2018 1913 946 761 2003 970 2130 1523
2012-13 2013-14
22(a). Details of Child Labours Mainstreamed ( In Numbers)
STATE
Source:Labour Department, GOK.
2009-10District
Sl.N
o
2010-11 2011-12
56a

Total
Girls Boys Total Girls Boys Total Girls Boys Total (I-X)
2000-01 3195821 3463202 6659023 1260660 1443587 2704247 496445 625330 1121775 10485045
2001-02 3163286 3424999 6588285 1288766 1455802 2744568 504474 630061 1134535 10467388
2002-03 3209952 3423109 6633061 1320444 1463450 2783894 563589 656748 1220337 10637292
2003-04 2853180 3025247 5878427 1259363 1409336 2668699 472387 560111 1032498 9579624
2004-05 2816824 3003460 5820284 1357882 1525523 2883405 577129 655793 1232922 9936611
2005-06 2790668 2967111 5757779 1383496 1502794 2886290 623501 692374 1315875 9959944
2006-07 2769823 2955183 5725006 1431702 1564940 2996642 718916 797526 1516442 10238090
2007-08 2885736 2710964 5596700 1554686 1441561 2996247 808755 743962 1552447 10145394
2008-09 2682420 2859996 5542416 1441210 1550766 2991976 747660 810049 1557709 10092101
2009-10 2639555 2820488 5460043 1416574 1528585 2945159 783919 845972 1629891 10035093
2010-11 2613045 2801529 5414574 1430580 1536864 2967444 795930 851421 1647351 10029369
2011-12 2609406 2808432 5417838 1447951 1559068 3007019 807814 868371 1676185 10101042
2012-13 2588225 2790256 5378481 1449861 1567247 3017108 800870 865624 1666494 10062083
2013-14 2762510 2589196 5351706 1540468 1430060 2970528 874814 809890 1684704 10006938
23. Class wise Enrolment from 2000-2001 to 2013-14
Year(I-V classes) (VI-VIII classes) (IX-X classes)
Source: Commissioner of Public Instructions, Bangalore
57

Girls Boys Total Girls Boys Total Girls Boys Total
2000-01 13.22 16.42 14.92 25.54 26.64 26.12 34.28 33.75 34.00
2001-02 12.34 14.72 13.6 24.77 26.1 25.47 33.87 33.72 33.79
2002-03 7.62 10.41 9.08 22.33 24.69 23.57 31.04 32.41 31.76
2003-04 15.82 18.13 17.02 28.15 29.88 29.06 29.04 30.11 29.60
2004-05 12.82 13.66 13.26 24 24.78 24.4 32.6 33.35 32.99
2005-06 10.96 12.14 11.57 21.34 22.63 22.01 30.46 31.96 31.25
2006-07 8.11 8.78 8.46 18.01 18.5 18.26 26.37 27.17 26.79
2007-08 7.62 6.52 7.09 14.19 13.32 13.77 24.48 23.63 24.71
2008-09 6.41 7.4 6.92 11.67 12.3 12 22.26 22.93 22.61
2009-10 7.27 7.96 7.63 9.95 10.49 10.23 20.55 20.66 20.61
*2010-11 6.35 6.86 6.62 9.33 9.89 9.62 18.49 18.77 18.64
*2011-12 1.21 1.17 1.19 2.79 3.01 2.9 9.51 6.56 8.11
*2012-13 2.33 2.81 2.56 3.75 4.24 3.98 7.64 7.09 7.38
*2013-14 3.39 2.50 2.96 4.96 5.15 5.05 9.20 7.72 8.49
Source: Commissioner of Public Instructions, Bangalore
24. Drop-out rate at different stages of School Education in Karnataka
from 2000- 2001 to 2013-14
Year(I-V classes) (I-VII/VIII classes) (IX-X classes)*
*Calculated according to Annual Average drop out Rate 2010-11
58

Sl. No. District% of women aware of
HIV/AIDS
1 Bagalkote 83.9
2 Bangalore 97.4
3 Bangalore Rural
4 Ramanagar
5 Belgaum 79.5
6 Bellary 80.2
7 Bidar 79.4
8 Bijapur 87.5
9 Chamarajanagar 80.1
10 Chikmagalur 92.3
11 Chitradurga 89.3
12 Dakshina Kannada 93.8
13 Davanagere 84.8
14 Dharwad 90.3
15 Gadag 85.3
16 Gulbarga
17 Yadgiri
18 Hassan 83.8
19 Haveri 74.7
20 Kodagu 86.9
21 Kolar
22 Chikkaballapur
23 Koppal 62.0
24 Mandya 85.0
25 Mysore 76.2
26 Raichur 76.3
27 Shimoga 90.2
28 Tumkur 82.0
29 Udupi 97.0
30 Uttara Kannada 89.4
25. Percentage of women aware of HIV/AIDS : 2013-14
94.2
71.0
68.4
Note: NA = Not Avabilable.
Source: Karnataka Aids Prevention Society, Bangalore
59

Male Female Persons Male Female Persons Male Female Persons
24.00 5.00 14.00 47.00 23.00 35.00 29.00 9.00 19.00
- - 20.00 - - 44.00 36.00 14.00 25.00
35.00 15.00 25.00 60.00 42.00 51.00 42.00 21.00 32.00
42.00 20.00 31.00 65.00 48.00 57.00 49.00 28.00 38.00
60.00 35.00 48.00 82.00 66.00 74.00 67.00 44.00 56.00
70.47 48.01 59.34 86.65 74.08 80.55 76.12 56.86 66.64
77.61 59.71 68.73 90.04 81.36 85.78 82.47 68.08 75.36
Sl.N
o.District
1 Bagalkote 75.77 52.58 64.20 86.55 70.65 78.58 79.23 58.40 68.82
2 Bangalore 84.54 70.92 78.21 91.66 85.27 88.61 91.01 84.01 87.67
3 Bangalore (R) 83.06 66.80 75.16 89.57 80.95 85.37 84.82 70.63 77.93
4 Ramanagara 73.96 56.36 65.26 85.47 77.51 81.54 76.76 61.50 69.22
5 Belgaum 79.12 59.20 69.28 91.10 79.95 85.56 82.20 64.58 73.48
6 Bellary 72.42 51.02 61.81 83.58 69.62 76.63 76.64 58.09 67.43
7 Bidar 76.28 56.82 66.73 87.42 75.88 81.81 79.09 61.55 70.51
8 Bijapur 74.03 51.10 62.81 87.80 74.79 81.33 77.21 56.72 67.15
9 Chamarajanagar 64.80 51.06 57.95 83.29 73.54 78.39 67.93 54.92 61.43
10 Chikmagalur 83.82 70.15 76.95 91.40 84.51 87.93 85.41 73.16 79.25
11 Chitradurga 79.19 61.91 70.68 90.22 81.55 85.89 81.37 65.88 73.71
12 Dakshina Kannada 90.97 79.83 85.33 95.50 88.83 92.12 93.13 84.13 88.57
13 Davanagere 79.63 63.69 71.77 88.19 79.77 84.02 82.40 68.91 75.74
14 Dharwad 80.98 62.72 72.09 90.49 81.31 85.92 86.37 73.46 80.00
15 Gadag 82.83 60.62 71.86 88.01 73.92 80.94 84.66 65.44 75.12
16 Gulbarga 69.08 46.86 58.09 85.12 71.91 78.61 74.38 55.09 64.85
17 Yadagiri 58.02 36.05 47.05 80.03 63.92 72.01 62.25 41.38 51.83
18 Hassan 81.41 64.29 72.79 91.94 84.81 88.36 83.64 68.60 76.07
19 Haveri 83.05 67.89 75.69 87.39 79.29 83.39 84.00 70.46 77.40
20 Kodagu 85.94 76.37 81.09 94.41 88.58 91.48 87.19 78.14 82.61
21 Kolar 78.11 59.82 69.08 90.05 82.18 86.13 81.81 66.84 74.39
22 Chikkaballapur 75.41 57.10 66.39 86.01 77.06 81.57 77.75 61.55 69.76
23 Koppal 77.12 54.85 66.05 85.48 70.59 78.03 78.54 57.55 68.09
24 Mandya 76.34 59.21 67.78 87.78 78.75 83.24 78.27 62.54 70.40
25 Mysore 70.64 55.78 63.29 89.50 82.67 86.09 78.46 67.06 72.79
26 Raichur 66.01 42.37 54.11 83.10 67.10 75.12 70.47 48.73 59.56
27 Shimoga 83.14 69.60 76.37 91.35 84.24 87.79 86.07 74.84 80.45
28 Tumkur 80.48 62.71 71.66 90.93 83.67 87.32 82.81 67.38 75.14
29 Udupi 89.85 78.65 83.91 95.22 89.21 92.13 91.41 81.58 86.24
30 Uttara Kannada 87.63 74.87 81.31 94.49 86.91 90.73 89.63 78.39 84.06
Source: As per population Census.
2011
1971
1981
1991
2001
Year : 2011
26. LITERACY RATES BY SEX IN RURAL AND URBAN AREAS (Percentage) : 2011
1951
1961
Rural Urban TotalYear
60

29.00
36.00
42.00
49.00
67.00
76.12
9.00
14.00
21.00
28.00
44.00
56.86
0
10
20
30
40
50
60
70
80
1951 1961 1971 1981 1991 2001
IN P
ER
CE
NTA
GE
YEAR
LITERACY RATE
MALE FEMALE
60a

Boys Girls Total Girls % Boys Girls Total Girls % Boys Girls Total Girls % Boys Girls Total Girls %
1 Bagalkote 107421 100277 207698 48.28 57321 52537 109858 47.82 28519 24678 53197 46.39 193261 177492 370753 47.87
2 Bangalore (Rural) 38814 36572 75386 48.51 22458 21383 43841 48.77 13902 13418 27320 49.11 75174 71373 146547 48.70
3 Bangalore 399381 380804 780185 48.81 212036 201642 413678 48.74 121199 118401 239600 49.42 732616 700847 1433463 48.89
4 Belgaum 231242 214621 445863 48.14 133696 121426 255122 47.60 74518 64722 139240 46.48 439456 400769 840225 47.70
5 Bellary 126264 118479 244743 48.41 64415 59416 123831 47.98 32072 26194 58266 44.96 222751 204089 426840 47.81
6 Bidar 116028 109035 225063 48.45 54589 52596 107185 49.07 26079 25675 51754 49.61 196696 187306 384002 48.78
7 Bijapur 148641 134472 283113 47.50 68354 60800 129154 47.08 34730 27377 62107 44.08 251725 222649 474374 46.94
8 Chamarajanagar 35866 33617 69483 48.38 21322 20564 41886 49.10 12367 12025 24392 49.30 69555 66206 135761 48.77
9 Chikkaballapur 49609 45832 95441 48.02 27269 25309 52578 48.14 17758 17217 34975 49.23 94636 88358 182994 48.28
10 Chikmagalur 38893 36800 75693 48.62 25363 24051 49414 48.67 16371 16063 32434 49.53 80627 76914 157541 48.82
11 Chitradurga 67598 63474 131072 48.43 40630 38116 78746 48.40 24919 23451 48370 48.48 133147 125041 258188 48.43
12 Dakshina Kannada 80763 75443 156206 48.30 53452 49771 103223 48.22 36155 34043 70198 48.50 170370 159257 329627 48.31
13 Davanagere 86380 80902 167282 48.36 50696 47824 98520 48.54 28070 26861 54931 48.90 165146 155587 320733 48.51
14 Dharwad 77736 75429 153165 49.25 47547 44964 92511 48.60 26862 25382 52244 48.58 152145 145775 297920 48.93
15 Gadag 50072 47481 97553 48.67 29189 27197 56386 48.23 16275 14561 30836 47.22 95536 89239 184775 48.30
16 Gulbarga 159846 146056 305902 47.75 77076 69538 146614 47.43 37430 33010 70440 46.86 274352 248604 522956 47.54
17 Hassan 59378 57269 116647 49.10 38201 36565 74766 48.91 26068 26089 52157 50.02 123647 119923 243570 49.24
18 Haveri 72441 68902 141343 48.75 41508 40295 81803 49.26 22246 21622 43868 49.29 136195 130819 267014 48.99
19 Kodagu 20448 19943 40391 49.37 13760 12742 26502 48.08 8581 8665 17246 50.24 42789 41350 84139 49.14
20 Kolar 62681 59393 122074 48.65 35421 33057 68478 48.27 22562 21823 44385 49.17 120664 114273 234937 48.64
21 Koppal 74280 70646 144926 48.75 39746 36520 76266 47.89 17642 15180 32822 46.25 131668 122346 254014 48.17
22 Mandya 60054 55985 116039 48.25 38322 35030 73352 47.76 25046 23869 48915 48.80 123422 114884 238306 48.21
23 Mysore 113782 108020 221802 48.70 69223 66228 135451 48.89 43963 42907 86870 49.39 226968 217155 444123 48.90
24 Raichur 111049 101383 212432 47.72 54929 49059 103988 47.18 23448 19998 43446 46.03 189426 170440 359866 47.36
25 Ramanagara 37481 35286 72767 48.49 23269 21771 45040 48.34 14649 14404 29053 49.58 75399 71461 146860 48.66
26 Shimoga 68784 65296 134080 48.70 43140 40852 83992 48.64 27609 26463 54072 48.94 139533 132611 272144 48.73
27 Tumkur 97497 90959 188456 48.27 63517 56452 119969 47.06 43236 38466 81702 47.08 204250 185877 390127 47.65
28 Udupi 39568 37177 76745 48.44 26433 24516 50949 48.12 17725 16734 34459 48.56 83726 78427 162153 48.37
29 Uttara Kannada 55587 52241 107828 48.45 36059 33662 69721 48.28 22274 21617 43891 49.25 113920 107520 221440 48.55
30 Yadagiri 74926 67402 142328 47.36 31527 26177 57704 45.36 12539 8975 21514 41.72 118992 102554 221546 46.29
2762510 2589196 5351706 48.38 1540468 1430060 2970528 48.14 874814 809890 1684704 48.07 5177792 4829146 10006938 48.26
Source:: Commissioner of Public Instructions,
Total(1-X)
27. Enrolment in all management schools in Karnataka :2013-2014
STATE
Sl.
NoDistrict
Lower Primary School Higher Primary School High School
61
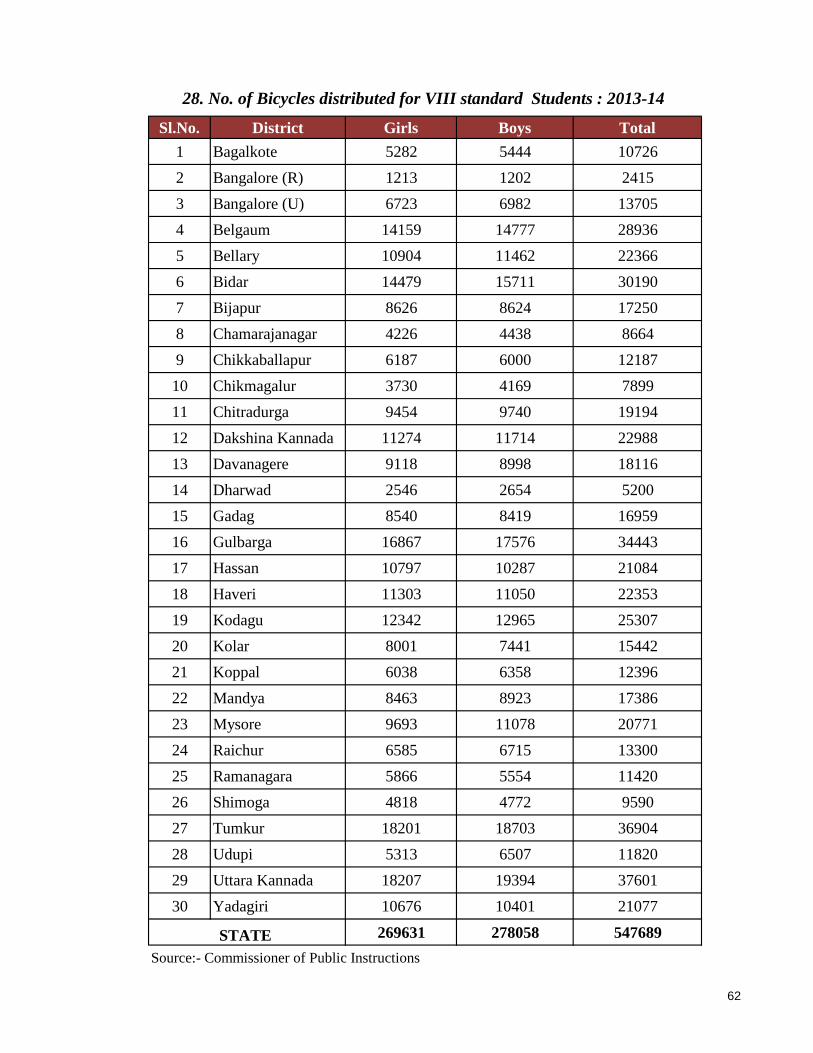
Sl.No. District Girls Boys Total
1 Bagalkote 5282 5444 10726
2 Bangalore (R) 1213 1202 2415
3 Bangalore (U) 6723 6982 13705
4 Belgaum 14159 14777 28936
5 Bellary 10904 11462 22366
6 Bidar 14479 15711 30190
7 Bijapur 8626 8624 17250
8 Chamarajanagar 4226 4438 8664
9 Chikkaballapur 6187 6000 12187
10 Chikmagalur 3730 4169 7899
11 Chitradurga 9454 9740 19194
12 Dakshina Kannada 11274 11714 22988
13 Davanagere 9118 8998 18116
14 Dharwad 2546 2654 5200
15 Gadag 8540 8419 16959
16 Gulbarga 16867 17576 34443
17 Hassan 10797 10287 21084
18 Haveri 11303 11050 22353
19 Kodagu 12342 12965 25307
20 Kolar 8001 7441 15442
21 Koppal 6038 6358 12396
22 Mandya 8463 8923 17386
23 Mysore 9693 11078 20771
24 Raichur 6585 6715 13300
25 Ramanagara 5866 5554 11420
26 Shimoga 4818 4772 9590
27 Tumkur 18201 18703 36904
28 Udupi 5313 6507 11820
29 Uttara Kannada 18207 19394 37601
30 Yadagiri 10676 10401 21077
269631 278058 547689
28. No. of Bicycles distributed for VIII standard Students : 2013-14
Source:- Commissioner of Public Instructions
STATE
62

Male Female Total Female
(in %) Male Female Total
Female
(in %) Male Female Total
Female
(in %)
1 Bagalkote 905 718 1623 44.24 4318 3355 7673 43.72 2409 790 3199 24.70
2 Bangalore (Rural) 778 845 1623 52.06 1606 2182 3788 57.60 1098 591 1689 34.99
3 Bangalore 518 2609 3127 83.43 6394 22969 29363 78.22 6260 8464 14724 57.48
4 Belgaum 2208 1840 4048 45.45 9432 8884 18316 48.50 5490 2060 7550 27.28
5 Bellary 1093 1188 2281 52.08 4453 4671 9124 51.19 2259 1284 3543 36.24
6 Bidar 1015 1130 2145 52.68 4464 4109 8573 47.93 2585 1096 3681 29.77
7 Bijapur 1798 1568 3366 46.58 5318 3935 9253 42.53 2938 716 3654 19.59
8 Chamarajanagar 494 419 913 45.89 1454 1788 3242 55.15 1039 538 1577 34.12
9 Chikkaballapur 1166 837 2003 41.79 2147 2413 4560 52.92 1198 508 1706 29.78
10 Chikmagalur 965 865 1830 47.27 2262 2735 4997 54.73 1701 819 2520 32.50
11 Chitradurga 1136 884 2020 43.76 3136 3326 6462 51.47 2575 591 3166 18.67
12 Dakshina Kannada 177 549 726 75.62 1393 5706 7099 80.38 1640 2210 3850 57.40
13 Davanagere 1060 1264 2324 54.39 3900 3972 7872 50.46 2997 1153 4150 27.78
14 Dharwad 325 673 998 67.43 2621 4235 6856 61.77 1699 1275 2974 42.87
15 Gadag 374 452 826 54.72 2302 1860 4162 44.69 1532 607 2139 28.38
16 Gulbarga 1470 1973 3443 57.30 5075 6380 11455 55.70 3035 2054 5089 40.36
17 Hassan 1602 1473 3075 47.90 2781 3682 6463 56.97 2808 1172 3980 29.45
18 Haveri 822 765 1587 48.20 3543 3015 6558 45.97 2220 769 2989 25.73
19 Kodagu 88 273 361 75.62 458 1846 2304 80.12 616 632 1248 50.64
20 Kolar 1371 1300 2671 48.67 2166 3748 5914 63.38 1592 1041 2633 39.54
21 Koppal 672 503 1175 42.81 2734 1936 4670 41.46 1201 467 1668 28.00
22 Mandya 1039 841 1880 44.73 2555 3100 5655 54.82 2393 965 3358 28.74
23 Mysore 1206 1546 2752 56.18 3563 6685 10248 65.23 2822 2257 5079 44.44
24 Raichur 1345 1186 2531 46.86 4073 4051 8124 49.86 1751 999 2750 36.33
25 Ramanagara 906 890 1796 49.55 1424 2150 3574 60.16 1296 588 1884 31.21
26 Shimoga 987 1062 2049 51.83 2716 3970 6686 59.38 2221 1237 3458 35.77
27 Tumkur 2265 2197 4462 49.24 3697 5326 9023 59.03 4281 1471 5752 25.57
28 Udupi 284 347 631 54.99 1174 2674 3848 69.49 1315 1032 2347 43.97
29 Uttara Kannada 907 1305 2212 59.00 1790 3757 5547 67.73 1628 1100 2728 40.32
30 Yadagiri 850 653 1503 43.45 2221 1615 3836 42.10 1159 445 1604 27.74
29826 32155 61981 51.88 95170 130075 225245 57.75 67758 38931 106689 36.49
Commissioner of Public Instructions,
STATE
29. Number of teachers and female teachers ratio in all management schools in Karnataka (Lower, Upper Primary
Schools and High Schools) : 2013-14
Sl.No District
Higher Primary School High School Lower Primary School
63

1 Bagalkote 0.93 0.92 0.87
2 Bangalore (Rural) 0.94 0.95 0.97
3 Bangalore 0.95 0.95 0.98
4 Belgaum 0.93 0.91 0.87
5 Bellary 0.94 0.92 0.82
6 Bidar 0.94 0.96 0.98
7 Bijapur 0.9 0.89 0.79
8 Chamarajanagar 0.94 0.96 0.97
9 Chikkaballapur 0.92 0.93 0.97
10 Chikmagalur 0.95 0.95 0.98
11 Chitradurga 0.94 0.94 0.94
12 Dakshina Kannada 0.93 0.93 0.94
13 Davanagere 0.94 0.94 0.96
14 Dharwad 0.97 0.95 0.94
15 Gadag 0.95 0.93 0.89
16 Gulbarga 0.91 0.90 0.88
17 Hassan 0.96 0.96 1.00
18 Haveri 0.95 0.97 0.97
19 Kodagu 0.98 0.93 1.01
20 Kolar 0.95 0.93 0.97
21 Koppal 0.95 0.92 0.86
22 Mandya 0.93 0.91 0.95
23 Mysore 0.95 0.96 0.98
24 Raichur 0.91 0.89 0.85
25 Ramanagara 0.94 0.94 0.98
26 Shimoga 0.95 0.95 0.96
27 Tumkur 0.93 0.89 0.89
28 Udupi 0.94 0.93 0.94
29 Uttara Kannada 0.94 0.93 0.97
30 Yadagiri 0.90 0.83 0.72
0.94 0.93 0.93
Source: Commissioner of Public Instructions,
STATE
30. Districtwise Gender Parity Index : 2013-14
Sl.No District
Lower
Primary
School
Higher Primary
School
High
School
64
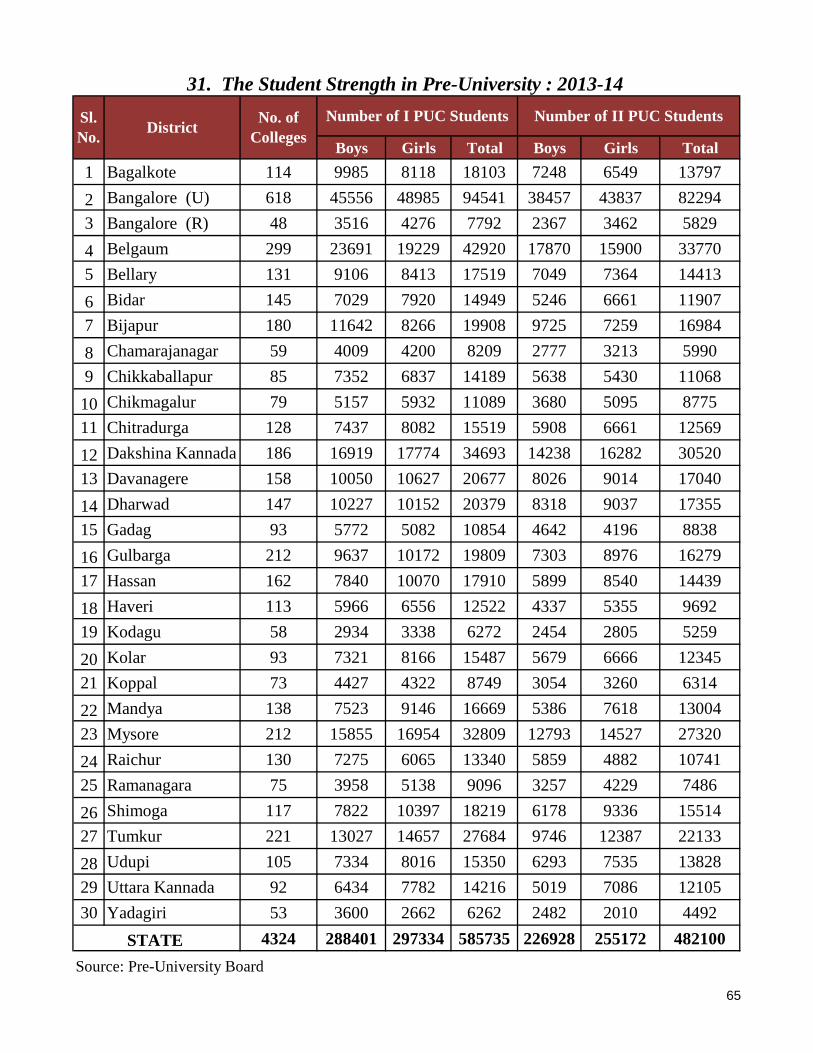
Boys Girls Total Boys Girls Total
1 Bagalkote 114 9985 8118 18103 7248 6549 13797
2 Bangalore (U) 618 45556 48985 94541 38457 43837 82294
3 Bangalore (R) 48 3516 4276 7792 2367 3462 5829
4 Belgaum 299 23691 19229 42920 17870 15900 33770
5 Bellary 131 9106 8413 17519 7049 7364 14413
6 Bidar 145 7029 7920 14949 5246 6661 11907
7 Bijapur 180 11642 8266 19908 9725 7259 16984
8 Chamarajanagar 59 4009 4200 8209 2777 3213 5990
9 Chikkaballapur 85 7352 6837 14189 5638 5430 11068
10 Chikmagalur 79 5157 5932 11089 3680 5095 8775
11 Chitradurga 128 7437 8082 15519 5908 6661 12569
12 Dakshina Kannada 186 16919 17774 34693 14238 16282 30520
13 Davanagere 158 10050 10627 20677 8026 9014 17040
14 Dharwad 147 10227 10152 20379 8318 9037 17355
15 Gadag 93 5772 5082 10854 4642 4196 8838
16 Gulbarga 212 9637 10172 19809 7303 8976 16279
17 Hassan 162 7840 10070 17910 5899 8540 14439
18 Haveri 113 5966 6556 12522 4337 5355 9692
19 Kodagu 58 2934 3338 6272 2454 2805 5259
20 Kolar 93 7321 8166 15487 5679 6666 12345
21 Koppal 73 4427 4322 8749 3054 3260 6314
22 Mandya 138 7523 9146 16669 5386 7618 13004
23 Mysore 212 15855 16954 32809 12793 14527 27320
24 Raichur 130 7275 6065 13340 5859 4882 10741
25 Ramanagara 75 3958 5138 9096 3257 4229 7486
26 Shimoga 117 7822 10397 18219 6178 9336 15514
27 Tumkur 221 13027 14657 27684 9746 12387 22133
28 Udupi 105 7334 8016 15350 6293 7535 13828
29 Uttara Kannada 92 6434 7782 14216 5019 7086 12105
30 Yadagiri 53 3600 2662 6262 2482 2010 4492
4324 288401 297334 585735 226928 255172 482100
Number of II PUC Students
31. The Student Strength in Pre-University : 2013-14
Sl.
No.District
No. of
Colleges
Number of I PUC Students
STATE
Source: Pre-University Board
65

Boys Girls Total Boys Girls Total
1 Bagalkote 10578 7827 18405 5680 5273 10953 12
2 Bangalore (U) 50944 49927 100871 29738 36328 66066 1
3 Bangalore (R) 3332 3883 7215 1837 2834 4671 28
4 Belgaum 25843 18333 44176 13255 12713 25968 3
5 Bellary 10428 9313 19741 4853 5212 10065 15
6 Bidar 8311 8988 17299 3407 4369 7776 20
7 Bijapur 15251 9159 24410 7004 5283 12287 9
8 Chamarajanagar 3931 3799 7730 2242 2613 4855 26
9 Chikkaballapur 7770 6460 14230 3972 3875 7847 19
10 Chikmagalur 4671 5665 10336 3087 4075 7162 23
11 Chitradurga 7928 7981 15909 3411 4231 7642 21
12 Dakshina Kannada 16665 17477 34142 13822 15553 29375 2
13 Davanagere 10400 10421 20821 5614 6442 12056 10
14 Dharwad 11831 10750 22581 6269 7137 13406 7
15 Gadag 7028 5122 12150 3189 3143 6332 24
16 Gulbarga 12335 12447 24782 5390 6185 11575 11
17 Hassan 8005 9573 17578 4138 6174 10312 14
18 Haveri 5939 6082 12021 3430 4418 7848 18
19 Kodagu 2968 3053 6021 2123 2445 4568 29
20 Kolar 8190 7896 16086 4057 4956 9013 16
21 Koppal 5328 4379 9707 2292 2509 4801 27
22 Mandya 7622 8788 16410 3466 5143 8609 17
23 Mysore 17086 16512 33598 8969 10773 19742 4
24 Raichur 9334 6391 15725 3907 3344 7251 22
25 Ramanagara 4570 4767 9337 2072 2908 4980 25
26 Shimoga 7815 10411 18226 5122 7429 12551 8
27 Tumkur 12475 14044 26519 6520 8860 15380 5
28 Udupi 7464 8201 15665 6127 7305 13432 6
29 Uttara Kannada 6712 8181 14893 4429 6348 10777 13
30 Yadagiri 4274 2847 7121 2135 1682 3817 30
315028 298677 613705 171557 199560 371117 -
31(a). Number of students attended and passed II PUC examination
during March 2014
Rank
STATE
Source: Pre-University Board
Sl.N
o.District
Students appeared for
examination- March 2014
Students passed in
examination - April 2014
66

Male Female Total Male Female Total
1 Bagalkote 2198 2649 4847 11260 5656 16916 21763
2 Bangalore 10957 15302 26259 18779 26216 44995 71254
3 Bangalore (R) 2738 2462 5200 888 939 1827 7027
4 Ramanagara 3057 4025 7082 1173 1043 2216 9298
5 Belgaum 4925 3695 8620 11467 10176 21643 30263
6 Bellary 5897 4481 10378 3754 4165 7919 18297
7 Bidar 2403 2228 4631 3455 4459 7914 12545
8 Bijapur 2861 1364 4225 6770 6341 13111 17336
9 Chamarajanagar 2768 1339 4107 410 1215 1625 5732
10 Chikmagalur 5223 5695 10918 695 1771 2466 13384
11 Chitradurga 6572 6213 12785 1807 2409 4216 17001
12 Dakshina Kannada 2779 6197 8976 3559 6240 9799 18775
13 Davanagere 5935 6292 12227 3681 5282 8963 21190
14 Dharwad 2454 2033 4487 6055 6684 12739 17226
15 Gadag 2382 2498 4880 3726 3426 7152 12032
16 Gulbarga 4600 4900 9500 4484 5564 10048 19548
17 Yadgiri 3007 1963 4970 710 293 1003 5973
18 Hassan 5804 8652 14456 1535 2599 4134 18590
19 Haveri 3586 2925 6511 2308 3212 5520 12031
20 Kodagu 1161 1175 2336 620 781 1401 3737
21 Kolar 5224 6959 12183 510 470 980 13163
22 Chikkaballapur 4943 5232 10175 898 1248 2146 12321
23 Koppal 3114 2030 5144 1222 988 2210 7354
24 Mandya 3483 6984 10467 1882 1983 3865 14332
25 Mysore 7474 13747 21221 4912 2668 7580 28801
26 Raichur 4214 2283 6497 1546 1337 2883 9380
27 Shimoga 5071 8583 13654 2518 3567 6085 19739
28 Tumkur 9538 11305 20843 2776 4437 7213 28056
29 Udupi 3388 6565 9953 2828 3498 6326 16279
30 Uttara Kannada 4170 7069 11239 2850 3845 6695 17934
STATE 131926 156845 288771 109078 122512 231590 520361
Source: Collegiate Education.
(In numbers)
32. The Student Strength in Government & Private Aided Degree Colleges :
2013-14
Sl.
No.DISTRICT
Government Private Aided Grand
Total
67

Self
Employed
Regular
wage/Salaried
Casual
LabourAll
Male 480 69 451 1000
Female 415 58 527 1000
Total 456 65 479 1000
Male 395 393 212 1000
Female 332 405 263 1000
Total 382 395 223 1000
Self
Employed
Regular
wage/Salaried
Casual
LabourAll
Male 484 69 447 1000
Female 428 56 516 1000
Total 463 64 473 1000
Male 395 393 212 1000
Female 341 399 260 1000
Total 383 394 222 1000Male 453 182 365 1000
Female 411 123 466 1000
Total 439 163 398 1000
33. Distribution of Persons (per 1000 ) by broad usual Principal activity Status
34. Distribution of Persons (per 1000 ) by broad usual activity (Principal
+Subsidiary) Status.
Urban
Sector
Working
Sex
Rural
sources : Report of NSS 66th round central sample (NSS Report No.537(66/10/1))
Sector Sex
Working
Rural
Urban
Total
68
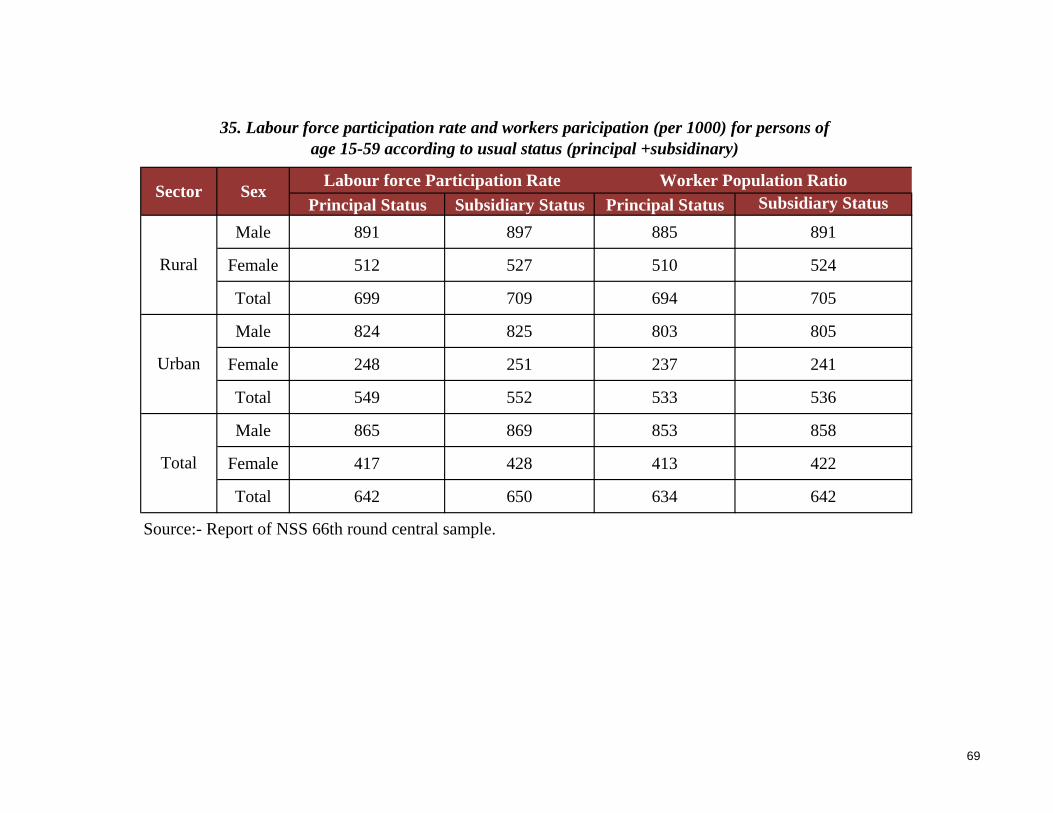
Principal Status Subsidiary Status Principal Status Subsidiary Status
Male 891 897 885 891
Female 512 527 510 524
Total 699 709 694 705
Male 824 825 803 805
Female 248 251 237 241
Total 549 552 533 536
Male 865 869 853 858
Female 417 428 413 422
Total 642 650 634 642
35. Labour force participation rate and workers paricipation (per 1000) for persons of
age 15-59 according to usual status (principal +subsidinary)
Source:- Report of NSS 66th round central sample.
Total
Sector
Rural
Urban
SexLabour force Participation Rate Worker Population Ratio
69
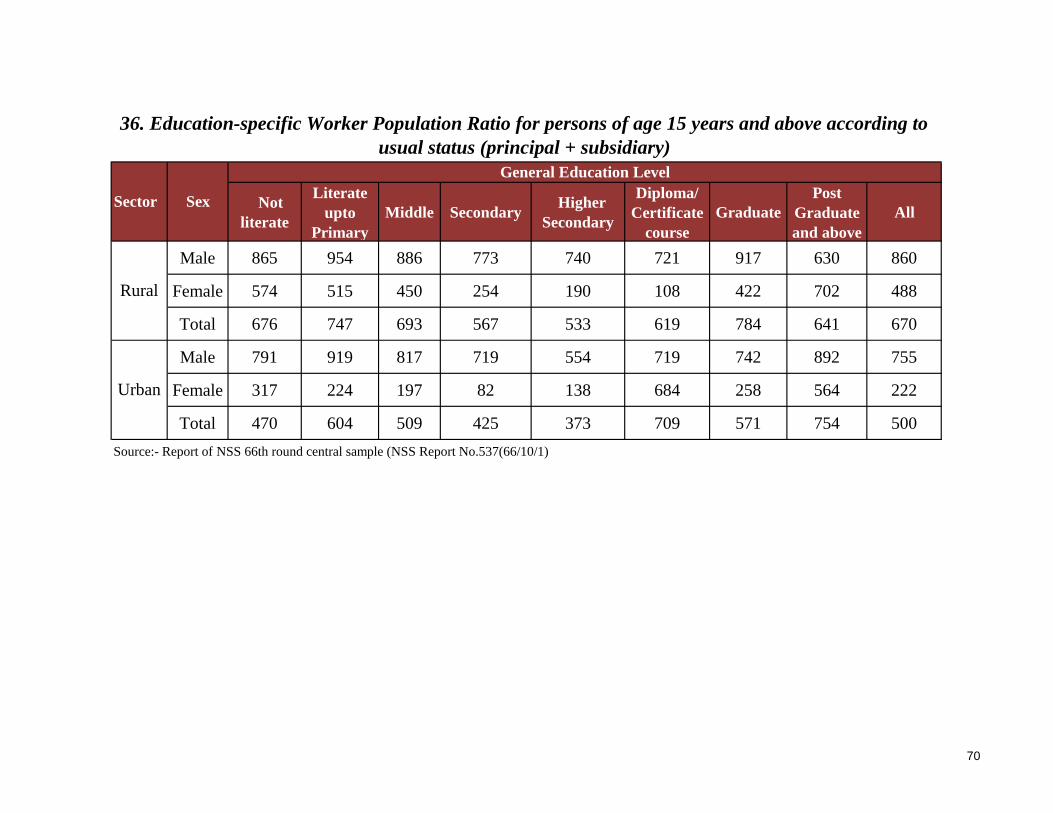
Not
literate
Literate
upto
Primary
Middle Secondary Higher
Secondary
Diploma/
Certificate
course
Graduate
Post
Graduate
and above
All
Male 865 954 886 773 740 721 917 630 860
Female 574 515 450 254 190 108 422 702 488
Total 676 747 693 567 533 619 784 641 670
Male 791 919 817 719 554 719 742 892 755
Female 317 224 197 82 138 684 258 564 222
Total 470 604 509 425 373 709 571 754 500
Source:- Report of NSS 66th round central sample (NSS Report No.537(66/10/1)
36. Education-specific Worker Population Ratio for persons of age 15 years and above according to
usual status (principal + subsidiary)
Sector
Rural
Urban
Sex
General Education Level
70
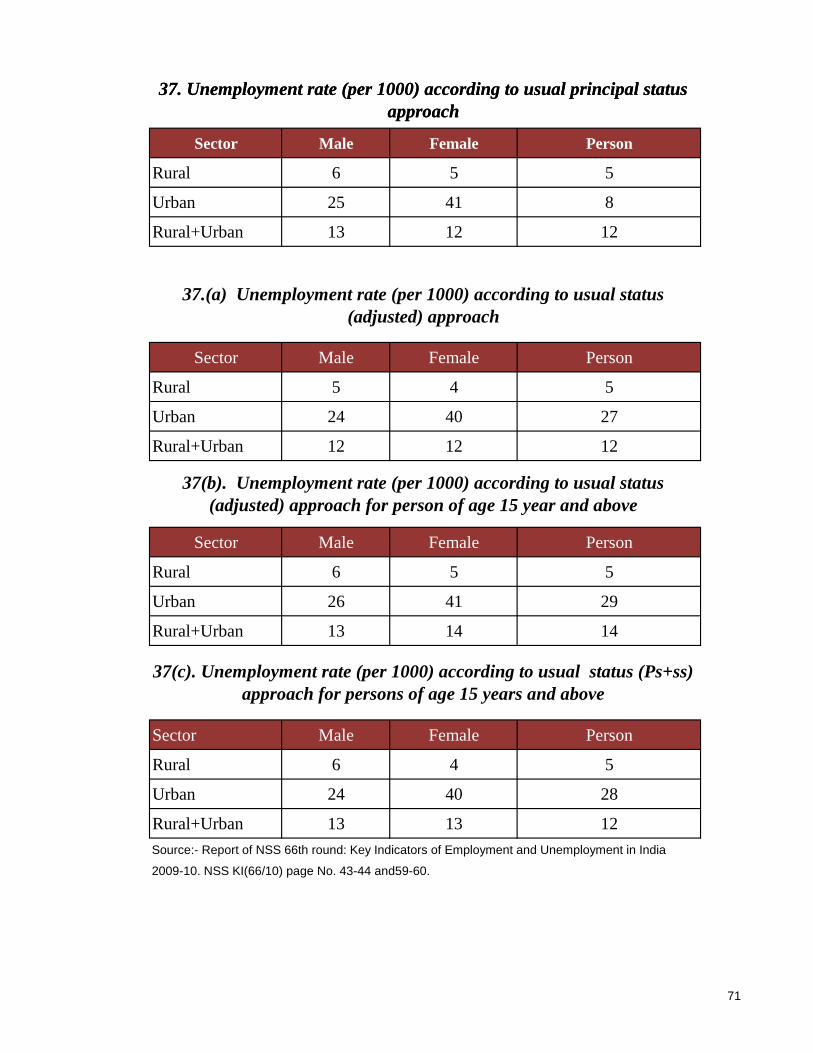
Sector Male Female Person
Rural 6 5 5
Urban 25 41 8
Rural+Urban 13 12 12
Sector Male Female Person
Rural 5 4 5
Urban 24 40 27
Rural+Urban 12 12 12
Sector Male Female Person
Rural 6 5 5
Urban 26 41 29
Rural+Urban 13 14 14
Sector Male Female Person
Rural 6 4 5
Urban 24 40 28
Rural+Urban 13 13 12
Source:- Report of NSS 66th round: Key Indicators of Employment and Unemployment in India
2009-10. NSS KI(66/10) page No. 43-44 and59-60.
37(c). Unemployment rate (per 1000) according to usual status (Ps+ss)
approach for persons of age 15 years and above
37. Unemployment rate (per 1000) according to usual principal status
approach
37. Unemployment rate (per 1000) according to usual principal status
approach
37.(a) Unemployment rate (per 1000) according to usual status
(adjusted) approach
37(b). Unemployment rate (per 1000) according to usual status
(adjusted) approach for person of age 15 year and above
71
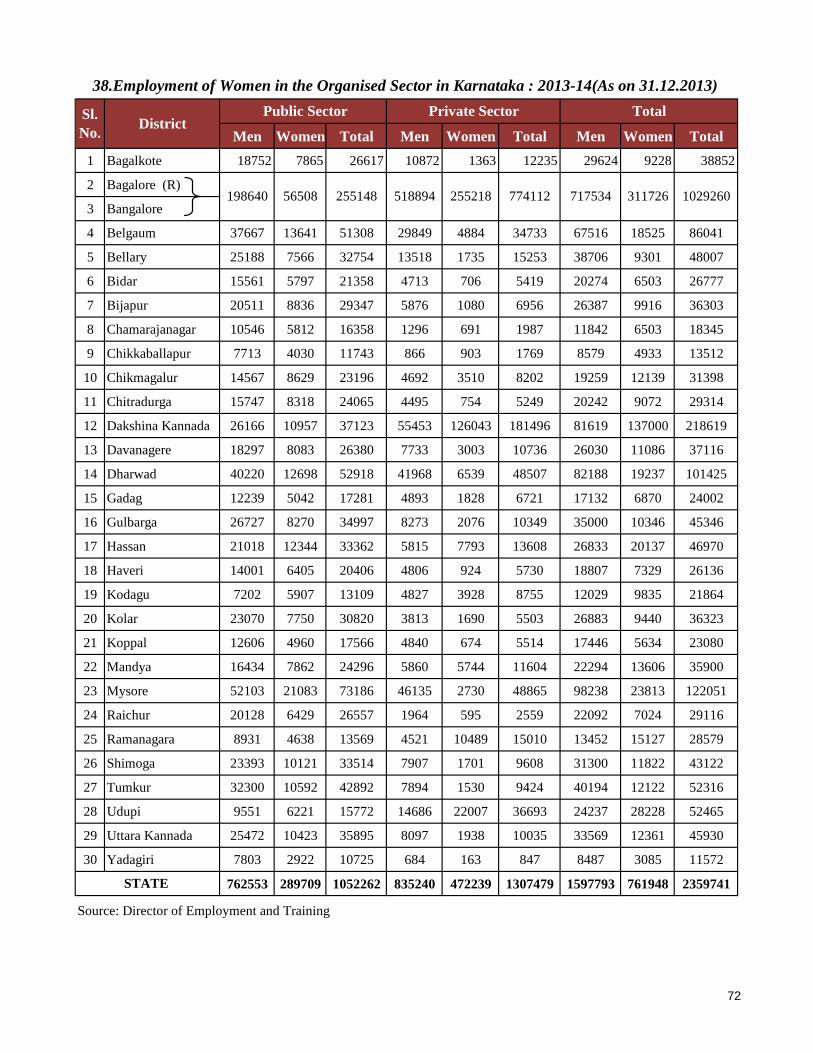
Men Women Total Men Women Total Men Women Total
1 Bagalkote 18752 7865 26617 10872 1363 12235 29624 9228 38852
2 Bagalore (R)
3 Bangalore
4 Belgaum 37667 13641 51308 29849 4884 34733 67516 18525 86041
5 Bellary 25188 7566 32754 13518 1735 15253 38706 9301 48007
6 Bidar 15561 5797 21358 4713 706 5419 20274 6503 26777
7 Bijapur 20511 8836 29347 5876 1080 6956 26387 9916 36303
8 Chamarajanagar 10546 5812 16358 1296 691 1987 11842 6503 18345
9 Chikkaballapur 7713 4030 11743 866 903 1769 8579 4933 13512
10 Chikmagalur 14567 8629 23196 4692 3510 8202 19259 12139 31398
11 Chitradurga 15747 8318 24065 4495 754 5249 20242 9072 29314
12 Dakshina Kannada 26166 10957 37123 55453 126043 181496 81619 137000 218619
13 Davanagere 18297 8083 26380 7733 3003 10736 26030 11086 37116
14 Dharwad 40220 12698 52918 41968 6539 48507 82188 19237 101425
15 Gadag 12239 5042 17281 4893 1828 6721 17132 6870 24002
16 Gulbarga 26727 8270 34997 8273 2076 10349 35000 10346 45346
17 Hassan 21018 12344 33362 5815 7793 13608 26833 20137 46970
18 Haveri 14001 6405 20406 4806 924 5730 18807 7329 26136
19 Kodagu 7202 5907 13109 4827 3928 8755 12029 9835 21864
20 Kolar 23070 7750 30820 3813 1690 5503 26883 9440 36323
21 Koppal 12606 4960 17566 4840 674 5514 17446 5634 23080
22 Mandya 16434 7862 24296 5860 5744 11604 22294 13606 35900
23 Mysore 52103 21083 73186 46135 2730 48865 98238 23813 122051
24 Raichur 20128 6429 26557 1964 595 2559 22092 7024 29116
25 Ramanagara 8931 4638 13569 4521 10489 15010 13452 15127 28579
26 Shimoga 23393 10121 33514 7907 1701 9608 31300 11822 43122
27 Tumkur 32300 10592 42892 7894 1530 9424 40194 12122 52316
28 Udupi 9551 6221 15772 14686 22007 36693 24237 28228 52465
29 Uttara Kannada 25472 10423 35895 8097 1938 10035 33569 12361 45930
30 Yadagiri 7803 2922 10725 684 163 847 8487 3085 11572
762553 289709 1052262 835240 472239 1307479 1597793 761948 2359741STATE
Source: Director of Employment and Training
38.Employment of Women in the Organised Sector in Karnataka : 2013-14(As on 31.12.2013)
TotalSl.
No.District
Public Sector Private Sector
198640 56508 717534 311726 1029260255148 518894 255218 774112
72

Total Male Female Total Male Female
Total 19364759 13896845 5467914 4170032 1338510 2831522
Rural 13462535 9194812 4267723 3665268 1059440 2605828
Urban 5902224 4702033 1200191 504764 279070 225694
Total 48757 30626 18131 37382 17559 19823
Rural 35835 21874 13961 33564 15371 18193
Urban 12922 8752 4170 3818 2188 1630
Total 438588 264956 173632 297888 126268 171620
Rural 354036 206216 147820 275161 112939 162222
Urban 84552 58740 25812 22727 13329 9398
Total 1553743 1091526 462217 576187 256481 319706
Rural 1171570 799369 372201 510700 213695 297005
Urban 382173 292157 90016 65487 42786 22701
Total 2310615 1686072 624543 581812 228422 353390
Rural 1589896 1110194 479702 499019 174816 324203
Urban 720719 575878 144841 82793 53606 29187
Total 2634337 1853389 780948 556787 165677 391110
Rural 1747927 1154004 593923 480841 123052 357789
Urban 886410 699385 187025 75946 42625 33321
Total 2461387 1734681 726706 445698 114735 330963
Rural 1639372 1082743 556629 386999 84863 302136
Urban 822015 651938 170077 58699 29872 28827
Total 2582246 1782868 799378 453850 103598 350252
Rural 1746410 1131728 614682 395911 76867 319044
Urban 835836 651140 184696 27939 26731 1208
Total 3905316 2852482 1052834 605757 144950 460807
Rural 2657022 1840448 816574 532681 109626 423055
Urban 1248294 1012034 236260 73076 35324 37752
Total 2098387 1570471 527916 344216 84415 259801
Rural 1470681 1049323 421358 307271 66555 240716
Urban 627706 521148 106558 36945 17860 19085
Total 966892 736021 230871 195486 62923 132563
Rural 762810 569441 193369 175990 52811 123179
Urban 204082 166580 37502 19496 10112 9384
Total 285625 231911 53714 58016 25763 32253
Rural 226844 182739 44105 52194 22302 29892
Urban 58781 49172 9609 5822 3461 2361
Total 66142 52789 13353 14037 6700 7337
Rural 51055 40493 10562 12688 5742 6946
Urban 15087 12296 2791 1649 958 691
25-29
30-34
5-9
20-24
10-14
15-19
Source: Census of India 2001
50-59
60-69
70-79
80+
35-39
40-49
39. Male and female workers : 2001 CensusMain workers Marginal Workers
All ages
Age Group
(Years)T/R/U
73
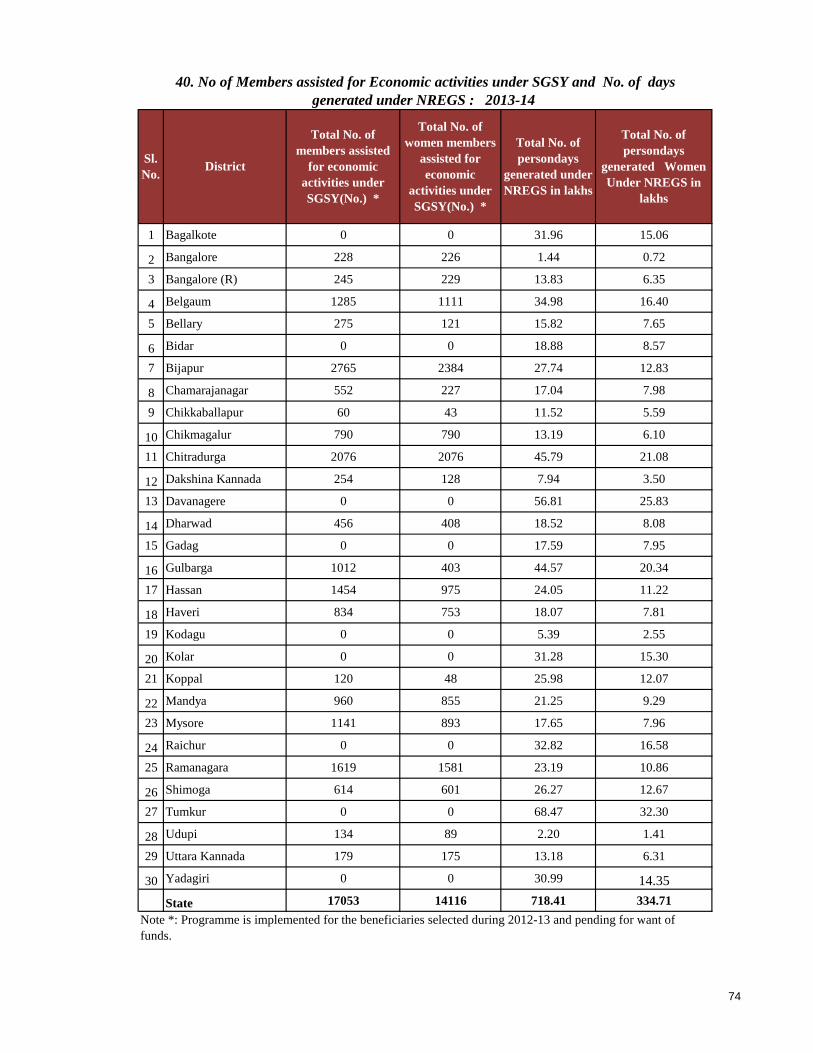
1 Bagalkote 0 0 31.96 15.06
2 Bangalore 228 226 1.44 0.72
3 Bangalore (R) 245 229 13.83 6.35
4 Belgaum 1285 1111 34.98 16.40
5 Bellary 275 121 15.82 7.65
6 Bidar 0 0 18.88 8.57
7 Bijapur 2765 2384 27.74 12.83
8 Chamarajanagar 552 227 17.04 7.98
9 Chikkaballapur 60 43 11.52 5.59
10 Chikmagalur 790 790 13.19 6.10
11 Chitradurga 2076 2076 45.79 21.08
12 Dakshina Kannada 254 128 7.94 3.50
13 Davanagere 0 0 56.81 25.83
14 Dharwad 456 408 18.52 8.08
15 Gadag 0 0 17.59 7.95
16 Gulbarga 1012 403 44.57 20.34
17 Hassan 1454 975 24.05 11.22
18 Haveri 834 753 18.07 7.81
19 Kodagu 0 0 5.39 2.55
20 Kolar 0 0 31.28 15.30
21 Koppal 120 48 25.98 12.07
22 Mandya 960 855 21.25 9.29
23 Mysore 1141 893 17.65 7.96
24 Raichur 0 0 32.82 16.58
25 Ramanagara 1619 1581 23.19 10.86
26 Shimoga 614 601 26.27 12.67
27 Tumkur 0 0 68.47 32.30
28 Udupi 134 89 2.20 1.41
29 Uttara Kannada 179 175 13.18 6.31
30 Yadagiri 0 0 30.99 14.35
State 17053 14116 718.41 334.71
Note *: Programme is implemented for the beneficiaries selected during 2012-13 and pending for want of
funds.
40. No of Members assisted for Economic activities under SGSY and No. of days
generated under NREGS : 2013-14
Sl.
No.District
Total No. of
members assisted
for economic
activities under
SGSY(No.) *
Total No. of
women members
assisted for
economic
activities under
SGSY(No.) *
Total No. of
persondays
generated under
NREGS in lakhs
Total No. of
persondays
generated Women
Under NREGS in
lakhs
74
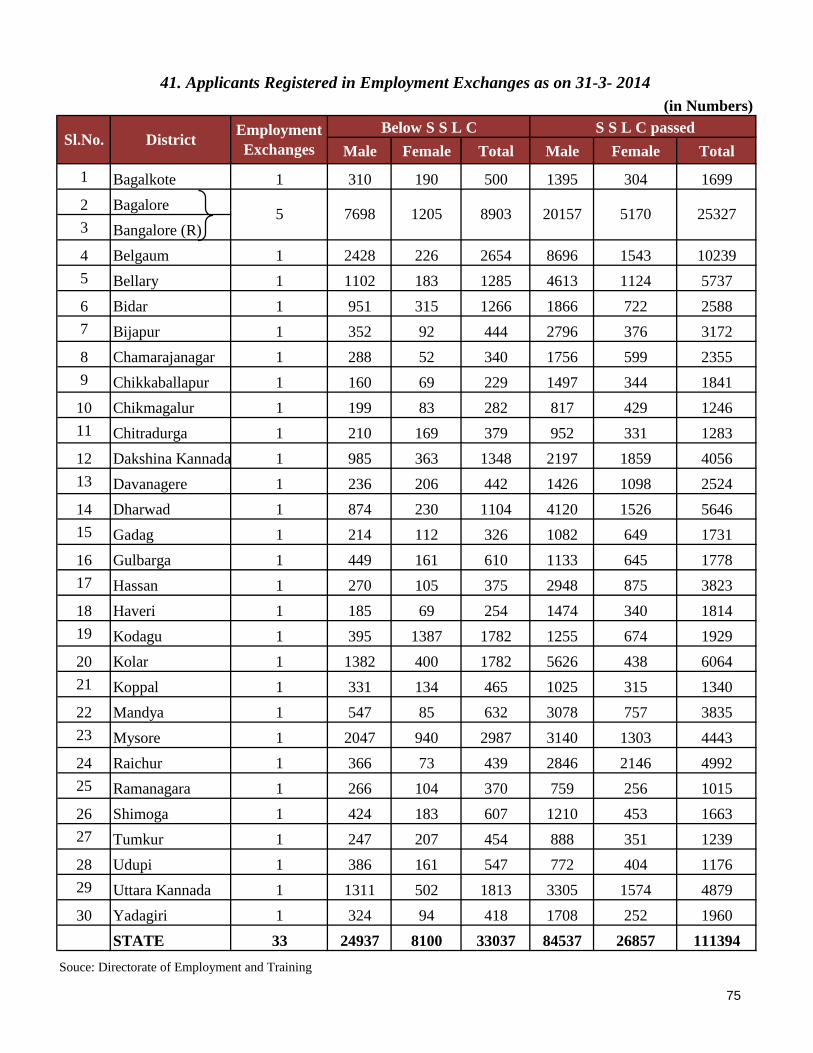
Male Female Total Male Female Total
1 Bagalkote 1 310 190 500 1395 304 1699
2 Bagalore
3 Bangalore (R)
4 Belgaum 1 2428 226 2654 8696 1543 10239
5 Bellary 1 1102 183 1285 4613 1124 5737
6 Bidar 1 951 315 1266 1866 722 2588
7 Bijapur 1 352 92 444 2796 376 3172
8 Chamarajanagar 1 288 52 340 1756 599 2355
9 Chikkaballapur 1 160 69 229 1497 344 1841
10 Chikmagalur 1 199 83 282 817 429 1246
11 Chitradurga 1 210 169 379 952 331 1283
12 Dakshina Kannada 1 985 363 1348 2197 1859 4056
13 Davanagere 1 236 206 442 1426 1098 2524
14 Dharwad 1 874 230 1104 4120 1526 5646
15 Gadag 1 214 112 326 1082 649 1731
16 Gulbarga 1 449 161 610 1133 645 1778
17 Hassan 1 270 105 375 2948 875 3823
18 Haveri 1 185 69 254 1474 340 1814
19 Kodagu 1 395 1387 1782 1255 674 1929
20 Kolar 1 1382 400 1782 5626 438 6064
21 Koppal 1 331 134 465 1025 315 1340
22 Mandya 1 547 85 632 3078 757 3835
23 Mysore 1 2047 940 2987 3140 1303 4443
24 Raichur 1 366 73 439 2846 2146 4992
25 Ramanagara 1 266 104 370 759 256 1015
26 Shimoga 1 424 183 607 1210 453 1663
27 Tumkur 1 247 207 454 888 351 1239
28 Udupi 1 386 161 547 772 404 1176
29 Uttara Kannada 1 1311 502 1813 3305 1574 4879
30 Yadagiri 1 324 94 418 1708 252 1960
STATE 33 24937 8100 33037 84537 26857 111394
41. Applicants Registered in Employment Exchanges as on 31-3- 2014
(in Numbers)
253275 7698 1205 8903 20157 5170
Souce: Directorate of Employment and Training
Sl.No. DistrictBelow S S L C S S L C passedEmployment
Exchanges
75

Male Female Total Male Female Total
1 Bagalkote 617 155 772 184 41 225
2 Bagalore
3 Bangalore (R)
4 Belgaum 6615 1344 7959 637 225 862
5 Bellary 3410 820 4230 584 810 1394
6 Bidar 1498 512 2010 328 105 433
7 Bijapur 728 194 922 314 86 400
8 Chamarajanagar 1123 342 1465 198 153 351
9 Chikkaballapur 868 269 1137 72 16 88
10 Chikmagalur 429 447 876 70 76 146
11 Chitradurga 374 180 554 78 12 90
12 Dakshina Kannada 2426 2662 5088 510 1023 1533
13 Davanagere 286 234 520 185 105 290
14 Dharwad 1095 792 1887 307 223 530
15 Gadag 645 327 972 180 92 272
16 Gulbarga 444 150 594 132 55 187
17 Hassan 1721 860 2581 218 210 428
18 Haveri 517 278 795 177 109 286
19 Kodagu 1019 1674 2693 330 365 695
20 Kolar 2432 555 2987 210 211 421
21 Koppal 350 120 470 155 55 210
22 Mandya 2948 749 3697 398 223 621
23 Mysore 1329 901 2230 184 151 335
24 Raichur 2093 910 3003 258 95 353
25 Ramanagara 474 332 806 113 61 174
26 Shimoga 762 471 1233 146 136 282
27 Tumkur 661 291 952 69 53 122
28 Udupi 1004 853 1857 178 289 467
29 Uttara Kannada 1134 863 1997 527 342 859
30 Yadagiri 372 121 493 204 51 255
STATE 47382 20866 68248 8986 7030 16016
41. Applicants Registered in Employment Exchanges as on 31-3- 2014 (contnd:)
Sl.No DistrictP .U.C. passed
10008 3460 13468 2040 1657 3697
(in Numbers)
Souce: Directorate of Employment and Training
B A Graduates
76

Male Female Total Male Female Total
1 Bagalkote 38 12 50 103 17 120
2 Bagalore
3 Bangalore (R)
4 Belgaum 160 93 253 246 150 396
5 Bellary 137 105 242 325 135 460
6 Bidar 253 26 279 112 11 123
7 Bijapur 56 22 78 84 22 106
8 Chamarajanagar 33 18 51 71 63 134
9 Chikkaballapur 24 15 39 25 4 29
10 Chikmagalur 20 27 47 25 22 47
11 Chitradurga 23 9 32 22 4 26
12 Dakshina Kannada 129 206 335 556 783 1339
13 Davanagere 126 89 215 136 92 228
14 Dharwad 71 37 108 328 191 519
15 Gadag 33 44 77 108 46 154
16 Gulbarga 34 16 50 21 16 37
17 Hassan 61 69 130 70 73 143
18 Haveri 25 17 42 42 34 76
19 Kodagu 116 136 252 233 295 528
20 Kolar 63 63 126 96 63 159
21 Koppal 12 7 19 35 12 47
22 Mandya 124 56 180 131 92 223
23 Mysore 82 73 155 127 81 208
24 Raichur 85 45 130 108 105 213
25 Ramanagara 16 16 32 103 43 146
26 Shimoga 42 66 108 159 193 352
27 Tumkur 26 25 51 27 26 53
28 Udupi 58 52 110 186 165 351
29 Uttara Kannada 171 85 256 206 198 404
30 Yadagiri 27 14 41 27 7 34
STATE 3680 2893 6573 5632 4497 10129
(in Numbers)
1635 1450 3085 1920
41. Application Registered in Employment Exchange as on 31.3.2014 (contnd)
Sl.
No.District
BSc., Graduates
1554 3474
B Com Graduates
77
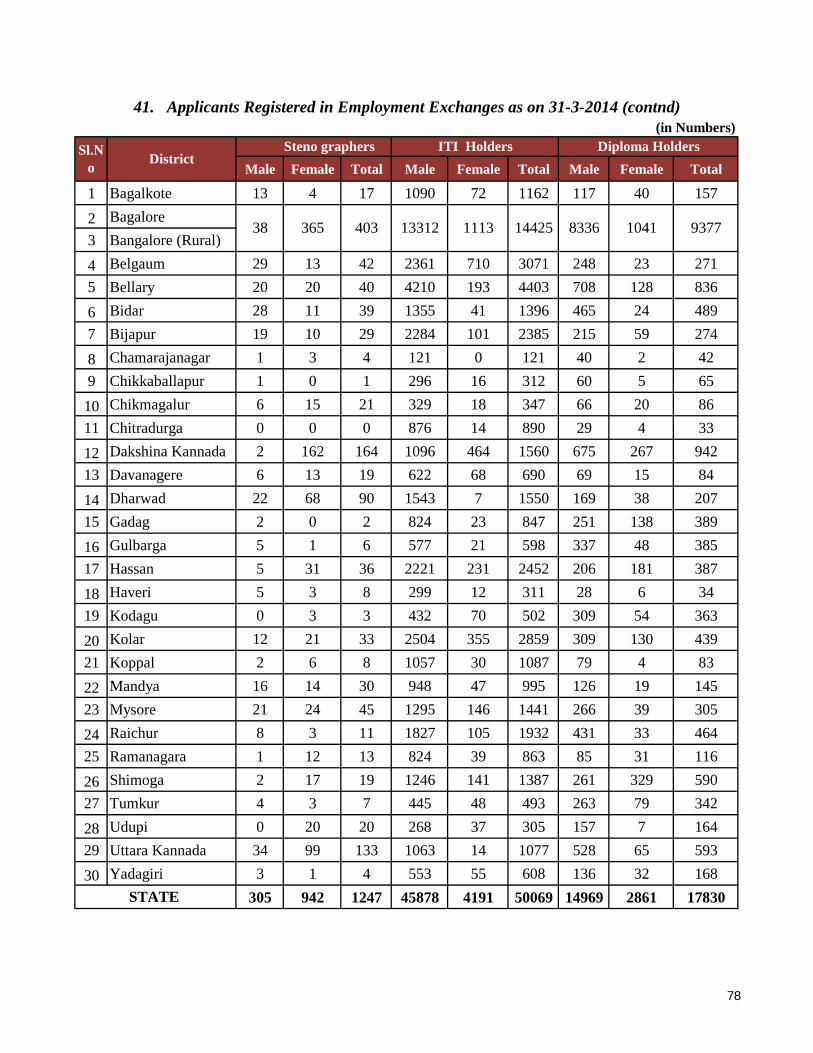
Male Female Total Male Female Total Male Female Total
1 Bagalkote 13 4 17 1090 72 1162 117 40 157
2 Bagalore
3 Bangalore (Rural)
4 Belgaum 29 13 42 2361 710 3071 248 23 271
5 Bellary 20 20 40 4210 193 4403 708 128 836
6 Bidar 28 11 39 1355 41 1396 465 24 489
7 Bijapur 19 10 29 2284 101 2385 215 59 274
8 Chamarajanagar 1 3 4 121 0 121 40 2 42
9 Chikkaballapur 1 0 1 296 16 312 60 5 65
10 Chikmagalur 6 15 21 329 18 347 66 20 86
11 Chitradurga 0 0 0 876 14 890 29 4 33
12 Dakshina Kannada 2 162 164 1096 464 1560 675 267 942
13 Davanagere 6 13 19 622 68 690 69 15 84
14 Dharwad 22 68 90 1543 7 1550 169 38 207
15 Gadag 2 0 2 824 23 847 251 138 389
16 Gulbarga 5 1 6 577 21 598 337 48 385
17 Hassan 5 31 36 2221 231 2452 206 181 387
18 Haveri 5 3 8 299 12 311 28 6 34
19 Kodagu 0 3 3 432 70 502 309 54 363
20 Kolar 12 21 33 2504 355 2859 309 130 439
21 Koppal 2 6 8 1057 30 1087 79 4 83
22 Mandya 16 14 30 948 47 995 126 19 145
23 Mysore 21 24 45 1295 146 1441 266 39 305
24 Raichur 8 3 11 1827 105 1932 431 33 464
25 Ramanagara 1 12 13 824 39 863 85 31 116
26 Shimoga 2 17 19 1246 141 1387 261 329 590
27 Tumkur 4 3 7 445 48 493 263 79 342
28 Udupi 0 20 20 268 37 305 157 7 164
29 Uttara Kannada 34 99 133 1063 14 1077 528 65 593
30 Yadagiri 3 1 4 553 55 608 136 32 168
305 942 1247 45878 4191 50069 14969 2861 17830
41. Applicants Registered in Employment Exchanges as on 31-3-2014 (contnd)
Sl.N
oDistrict
ITI Holders Diploma Holders
38 365 403 13312 1113
STATE
Steno graphers
14425 8336 1041
(in Numbers)
9377
78

Male Female Total Male Female Total
1 Bagalkote 144 71 215 79 78 157
2 Bagalore
3 Bangalore (R)
4 Belgaum 201 101 302 357 281 638
5 Bellary 239 244 483 126 233 359
6 Bidar 586 99 685 1095 409 1504
7 Bijapur 166 71 237 82 60 142
8 Chamarajanagar 173 160 333 224 229 453
9 Chikkaballapur 44 16 60 68 75 143
10 Chikmagalur 46 72 118 48 53 101
11 Chitradurga 16 10 26 73 40 113
12 Dakshina Kannada 133 761 894 96 394 490
13 Davanagere 14 8 22 207 178 385
14 Dharwad 105 157 262 92 248 340
15 Gadag 307 242 549 96 173 269
16 Gulbarga 137 83 220 180 285 465
17 Hassan 155 110 265 74 128 202
18 Haveri 111 79 190 131 117 248
19 Kodagu 34 214 248 32 301 333
20 Kolar 218 167 385 149 264 413
21 Koppal 112 51 163 70 128 198
22 Mandya 156 170 326 147 308 455
23 Mysore 137 123 260 144 230 374
24 Raichur 201 106 307 167 195 362
25 Ramanagara 19 32 51 19 45 64
26 Shimoga 130 206 336 86 180 266
27 Tumkur 44 40 84 155 106 261
28 Udupi 90 334 424 64 286 350
29 Uttara Kannada 218 331 549 244 490 734
30 Yadagiri 192 92 284 118 140 258
STATE 4542 5177 9719 4645 6424 11069
41. Applicants Registered in Employment Exchanges as on 31-3-2014 (contnd)
Sl.
No.District
B.Ed, B.P.Ed. Graduates C.P.Ed, TCH & Nursery Trained
414 1027 1441 222 770 992
(in Numbers)
79
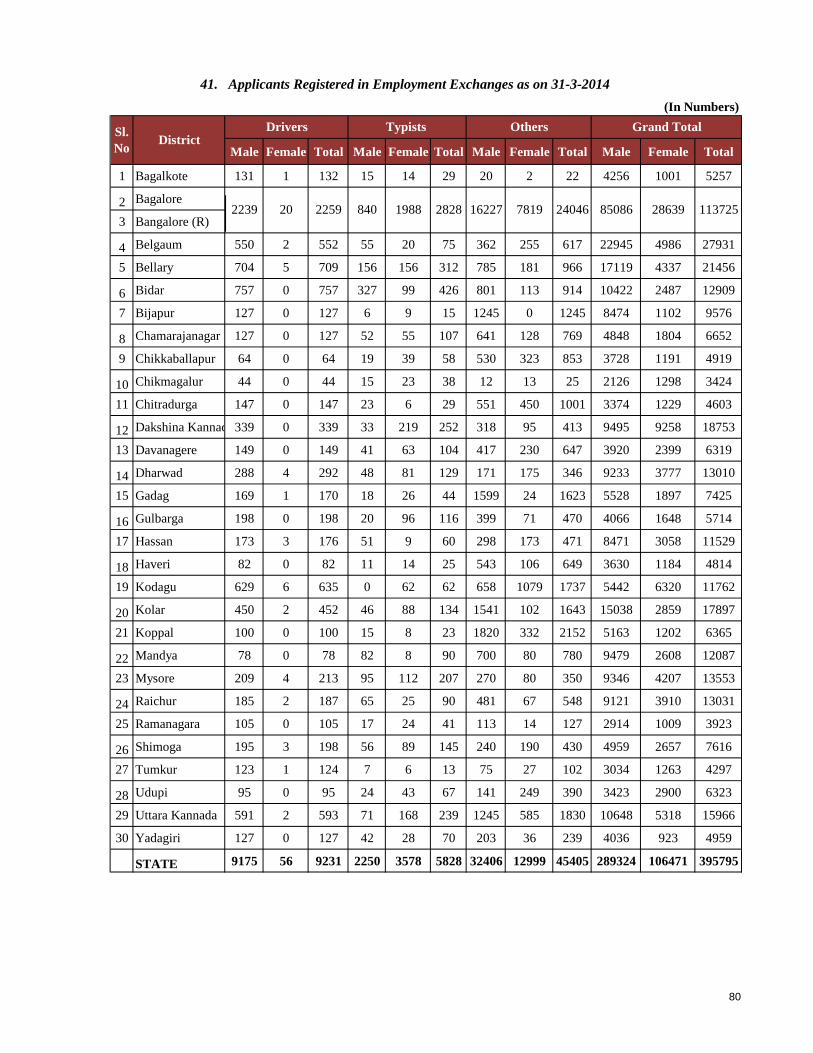
Male Female Total Male Female Total Male Female Total Male Female Total
1 Bagalkote 131 1 132 15 14 29 20 2 22 4256 1001 5257
2 Bagalore
3 Bangalore (R)
4 Belgaum 550 2 552 55 20 75 362 255 617 22945 4986 27931
5 Bellary 704 5 709 156 156 312 785 181 966 17119 4337 21456
6 Bidar 757 0 757 327 99 426 801 113 914 10422 2487 12909
7 Bijapur 127 0 127 6 9 15 1245 0 1245 8474 1102 9576
8 Chamarajanagar 127 0 127 52 55 107 641 128 769 4848 1804 6652
9 Chikkaballapur 64 0 64 19 39 58 530 323 853 3728 1191 4919
10 Chikmagalur 44 0 44 15 23 38 12 13 25 2126 1298 3424
11 Chitradurga 147 0 147 23 6 29 551 450 1001 3374 1229 4603
12 Dakshina Kannada339 0 339 33 219 252 318 95 413 9495 9258 18753
13 Davanagere 149 0 149 41 63 104 417 230 647 3920 2399 6319
14 Dharwad 288 4 292 48 81 129 171 175 346 9233 3777 13010
15 Gadag 169 1 170 18 26 44 1599 24 1623 5528 1897 7425
16 Gulbarga 198 0 198 20 96 116 399 71 470 4066 1648 5714
17 Hassan 173 3 176 51 9 60 298 173 471 8471 3058 11529
18 Haveri 82 0 82 11 14 25 543 106 649 3630 1184 4814
19 Kodagu 629 6 635 0 62 62 658 1079 1737 5442 6320 11762
20 Kolar 450 2 452 46 88 134 1541 102 1643 15038 2859 17897
21 Koppal 100 0 100 15 8 23 1820 332 2152 5163 1202 6365
22 Mandya 78 0 78 82 8 90 700 80 780 9479 2608 12087
23 Mysore 209 4 213 95 112 207 270 80 350 9346 4207 13553
24 Raichur 185 2 187 65 25 90 481 67 548 9121 3910 13031
25 Ramanagara 105 0 105 17 24 41 113 14 127 2914 1009 3923
26 Shimoga 195 3 198 56 89 145 240 190 430 4959 2657 7616
27 Tumkur 123 1 124 7 6 13 75 27 102 3034 1263 4297
28 Udupi 95 0 95 24 43 67 141 249 390 3423 2900 6323
29 Uttara Kannada 591 2 593 71 168 239 1245 585 1830 10648 5318 15966
30 Yadagiri 127 0 127 42 28 70 203 36 239 4036 923 4959
STATE 9175 56 9231 2250 3578 5828 32406 12999 45405 289324 106471 395795
11372516227 7819 240462239 20 2259 840 1988 2828
(In Numbers)
85086
41. Applicants Registered in Employment Exchanges as on 31-3-2014
Grand TotalSl.
NoDistrict
Typists Drivers Others
28639
80

As per Economic census 2005
Male Female Male Female Male Female
1 Belgaum 45037 63983 23656 1135 398 3515 9537 5386 2771 945 477 48552 73520 5386 26427 2080 875
2 Bagalkot 4050 5620 936 223 6 414 1112 753 172 39 3 4464 6732 753 1108 262 9
3 Bijapur 988 1305 114 18 4 338 731 585 58 20 9 1326 2036 585 172 38 13
4 Gulbarga 3409 4114 476 155 13 606 1413 1004 170 85 10 4015 5527 1004 646 240 23
5 Bidar 2052 2311 539 12 5 266 709 556 205 23 8 2318 3020 556 744 35 13
6 Raichur 2241 3490 650 119 20 563 1371 804 228 109 87 2804 4861 804 878 228 107
7 Koppal 715 951 91 15 1 169 824 611 222 31 37 884 1775 611 313 46 38
8 Gadag 2317 3497 907 60 8 484 1191 673 307 55 5 2801 4688 673 1214 115 13
9 Dharwad 2354 2909 877 17 5 424 1057 651 289 70 67 2778 3966 651 1166 87 72
10 Uttara Kannada 4235 5488 1712 25 9 1112 4201 3214 576 52 37 5347 9689 3214 2288 77 46
11 Haveri 4377 5262 857 46 2 695 2985 2347 1010 82 11 5072 8247 2347 1867 128 13
12 Bellary 5252 8325 2645 120 170 1145 4877 3622 1556 254 67 6397 13202 3622 4201 623 237
13 Chitradurga 9574 14983 3992 300 46 1403 4126 2319 1214 246 244 10977 19109 2319 5206 546 290
14 Davanagere 4066 5479 1346 35 5 1045 2428 1803 610 121 97 5111 7907 1803 1956 156 102
15 Shimoga 6208 10581 4337 55 32 1736 6751 4258 3252 68 108 7944 17332 4258 7589 123 140
16 Udupi 8335 9657 5528 14 1 1651 6206 4493 887 21 1 9986 15863 4493 6415 35 2
17 Chikmagalur 3373 4678 1330 29 7 521 1411 1000 423 109 21 3894 6089 1000 1753 138 28
18 Tumkur 23304 36413 10750 669 242 2548 8852 4996 2980 191 86 25852 45265 4996 13730 860 328
19 Kolar 39443 84558 34131 1138 823 16904 60339 35808 23022 1683 1322 56347 144897 35808 57153 2821 2145
20 Bangalore 4361 7912 3485 34 30 1286 4512 3730 1347 25 27 5647 12424 3730 4832 59 57
21 Bangalore Rural 35029 69832 29015 348 190 14034 53391 32895 26832 538 266 49063 123223 32895 55847 886 456
22 Mandya 39195 66412 25312 836 391 7530 29176 17763 13820 829 409 46725 95588 17763 39132 1665 800
23 Hassan 16360 22896 8573 167 85 4050 8053 5762 2496 697 490 20410 30949 5762 11069 864 575
24 Dhakshina Kannada 4033 4790 1542 13 3 892 3077 2347 1259 26 27 4925 7867 2347 2801 39 30
25 Kodagu 111 131 24 2 0 96 264 230 39 6 4 207 395 230 63 8 4
26 Mysore 28102 44519 15338 792 343 17383 89222 52914 43204 1762 1302 45485 133741 52914 58542 2554 1645
27 Chamarajanagar 9717 11405 1875 43 2 1554 4174 2749 1472 231 337 11271 15579 2749 3347 274 339
308238 501501 180038 6669 2841 82364 311990 193273 130421 8318 5559 390602 813491 193273 310459 14987 8400Total
Hired
employ-
ment
Total Female
No.of
establish
ment
With atleast one hired worker
No.of
establish
ment
42. DISTRIBUTION OF AGRICULTURAL ESTABLISHMENTS AND EMPLOYMENT
Sl.No District
Own Account Total
Total number of employment
ChildrenTotal Female
Hired
employ-
ment
No.of
establish
ment
Children
Total number of employment
Female
Total number of employment
ChildrenTotal
81

As per Economic census 2005
Male Female Male Female Male Female
1 Belgaum 105355 131578 18521 630 145 50703 237227 201327 42356 2348 2392 156058 368805 201327 60877 2978 2537
2 Bagalkot 42718 61166 13045 481 280 20431 87770 73879 18100 291 58 63149 148936 73879 31145 772 338
3 Bijapur 34506 45768 6773 225 67 20213 67919 59187 11808 434 163 54719 113687 59187 18581 659 230
4 Gulbarga 59541 75897 11642 667 136 27861 110677 94409 20470 1437 217 87402 186574 94409 32112 2104 353
5 Bidar 29492 34292 2789 390 41 17997 64529 52297 9471 1217 124 47489 98821 52297 12260 1607 165
6 Raichur 28656 38149 6922 221 73 21785 73005 58876 12639 1471 1172 50441 111154 58876 19561 1692 1245
7 Koppal 25608 33250 6070 162 56 13981 54988 44560 10872 1308 674 39589 88238 44560 16942 1470 730
8 Gadag 27089 37503 7878 215 108 14615 56681 47388 13074 306 101 41704 94184 47388 20952 521 209
9 Dharwad 36726 45903 7811 142 82 22431 121026 103114 25658 1246 1050 59157 166929 103114 33469 1388 1132
10 Uttara Kannada 29887 33580 4926 18 4 21061 85312 75448 20580 175 24 50948 118892 75448 25506 193 28
11 Haveri 31460 38508 5245 204 88 18342 62862 53256 12317 967 293 49802 101370 53256 17562 1171 381
12 Bellary 54245 76344 18996 120 611 28057 121747 101132 23191 2630 612 82302 198091 101132 42187 3769 1223
13 Chitradurga 41834 56794 15058 501 282 19333 72919 60388 18715 1119 1050 61167 129713 60388 33773 1620 1332
14 Davanagere 35367 44580 8337 79 27 21761 72166 61984 16097 916 865 57128 116746 61984 24434 995 892
15 Shimoga 39307 54628 11298 334 102 31130 138486 107737 44802 963 772 70437 193114 107737 56100 1297 874
16 Udupi 55599 60914 33786 25 3 21433 97825 81963 32452 116 44 77032 158739 81963 66238 141 47
17 Chikmagalur 31207 42121 8141 278 186 21829 87896 69947 28715 770 271 53036 130017 69947 36856 1048 457
18 Tumkur 79117 106907 35406 929 870 36971 137762 118703 33267 1422 564 116088 244669 118703 68673 2351 1434
19 Kolar 42078 58660 12990 505 309 40003 144499 122023 35485 1482 1214 82081 203159 122023 48475 1987 1523
20 Bangalore 125468 150734 22711 334 112 164613 1084555 940591 252481 3895 2319 290081 1235289 940591 275192 4229 2431
21 Bangalore Rural 39593 55143 13713 123 178 26059 117152 103390 27737 191 150 65652 172295 103390 41450 314 328
22 Mandya 37999 48207 9608 253 102 19609 78206 68408 17702 588 76 57608 126413 68408 27310 841 178
23 Hassan 37500 49904 8996 249 82 30315 120596 96792 36416 2597 2028 67815 170500 96792 45412 2846 2110
24 Dhakshina Kannada 155027 169500 122036 66 111 43382 174726 144566 53021 1308 2891 198409 344226 144566 175057 1374 3002
25 Kodagu 6470 7644 1068 23 7 10501 34746 31637 9416 396 389 16971 42390 31637 10484 419 396
26 Mysore 58272 83126 18434 781 320 62156 320115 234656 108408 3758 1927 120428 403241 234656 126842 4539 2247
27 Chamarajanagar 19513 25545 5402 275 142 12066 40358 34161 11234 918 455 31579 65903 34161 16636 1193 597
All Districts 1309634 1666345 437602 9249 4524 838638 3865750 3241819 946484 34269 21895 2148272 5532095 3241819 1384086 43518 26419
Total number of employmentNo.of
establish-
ment FemaleChildrenNo.of
establish-
ment
Female
Total number of employment
Total
No.of
establish-
ment
Total number of employment
FemaleChildren
Total
Total
Hired
employ-
ment
ChildrenTotal
Hired
employ-
ment
43. DISTRIBUTION OF NON-AGRICULTURAL ESTABLISHMENTS AND EMPLOYMENT
Sl.No District
Own Account With atleast one hired worker
82

Male Female Institutions Total Male Female Institutions Total
1 Bengaluru 45623 10504 23 56150 18140 4067 13 22220
2 Bengaluru ( R) 105067 25664 39 130770 40720 9919 14 50653
3 Ramanagara 169833 39516 109 209458 62951 14504 39 77494
4 Chitradurga 84840 24337 109177 45500 13638 59138
5 Davanagere 107554 27163 529 135246 54482 14559 281 69322
6 Kolar 131594 27284 262 159140 55564 11674 112 67350
7 Chikkaballapura 115881 25094 0 140975 49613 10810 60423
8 Shimoga 98302 26721 105 125128 49998 13708 48 63754
9 Tumkur 148974 48161 128 197263 86614 22318 51 108983
10 Chikmagalur 104623 23402 588 128613 49614 11272 274 61160
11 Dakshina Kannada 104162 48457 536 153155 40307 17873 177 58357
12 Udupi 89771 68662 317 158750 28982 22471 98 51551
13 Hassan 217099 68313 257 120 118875 27237 97 146209
14 Kodagu 22890 5211 171 28272 11502 2489 75 14066
15 Mandya 201862 95808 1527 299197 106906 30672 548 138126
16 Mysore 199475 60572 62 260109 100833 24509 21 125363
17 Chamarajnagar 107739 26304 208 134251 47365 12072 105 59542
18 Belgaum 194053 21472 0 215525 112723 10739 0 123462
19 Bijapur 43307 7843 0 51150 27632 5268 0 32900
20 Bagalkote 57729 12013 69742 33225 7127 0 40352
21 Dharwad 30639 5680 64 36383 18246 3397 32 21675
22 Gadag 29574 5833 107 35514 17556 3708 52 21316
23 Haveri 69342 8524 135 78001 38067 4644 66 42777
24 Uttara Kannada 109190 34062 372 143624 34956 9125 84 44165
25 Bellary 77286 27487 273 105046 44033 14514 132 58679
26 Bidar 63393 17223 80616 34842 9971 44813
27 Gulbarga 65706 16151 55 81912 40044 10618 28 50690
28 Yadagiri 60813 10833 29 71675 33894 6218 14 40126
29 Raichur 80700 20722 0 101422 45724 12443 0 58167
30 Koppal 51071 15830 0 66901 28838 9275 0 38113
2988092 854846 5896 3848834 1477746 370839 2361 1850946
44. AGRICULTURAL LAND HOLDINGS AND AREA As per 2010-11Census (contnd)
Marginal Agril. Land Holder (Below 1 Ha.) (Total)
STATE
Note: Area Total may not tally due to rounding off
District
Sl.
No
Number of Holders Area ( in Hectares)
83

Male Female Institutions Total Male Female Institutions Total
1 Bengaluru 11895 2523 17 14435 16435 3491 24 19950
2 Bengaluru ( R) 25575 5517 10 31102 35029 7557 15 42601
3 Ramanagara 34005 7158 28 41191 46504 9749 40 56293
4 Chitradurga 70385 19985 0 90370 99431 28156 0 127587
5 Davanagere 67445 16727 349 84521 93470 23165 503 117138
6 Kolar 41649 7609 63 49321 57407 10488 80 67975
7 Chikkaballapura 38312 7325 0 45637 52835 9985 0 62820
8 Shimoga 44347 11295 66 55708 61076 15574 92 76742
9 Tumkur 91758 21638 40 113436 129371 30510 59 159940
10 Chikmagalur 46179 9586 257 56022 63569 13192 354 77115
11 Dakshina Kannada 26204 11130 126 37460 35375 15260 165 50800
12 Udupi 14222 11005 89 25316 19589 15167 130 34886
13 Hassan 84189 17863 99 120 116023 24558 134 140715
14 Kodagu 14412 2533 72 17017 20262 3515 95 23872
15 Mandya 55890 12862 378 69130 73069 16759 507 90335
16 Mysore 69779 16656 11 86446 95111 22887 16 118014
17 Chamarajnagar 43323 9525 95 52943 60631 13347 135 74113
18 Belgaum 145084 11726 0 156810 206235 16740 0 222975
19 Bijapur 104787 15005 0 119792 154601 22191 0 176792
20 Bagalkote 63695 11650 0 75345 92497 16877 0 109374
21 Dharwad 42769 6537 49 49355 62136 9436 69 71641
22 Gadag 52202 7890 61 60153 76292 11448 88 87828
23 Haveri 73271 6994 81 80346 104422 9855 111 114388
24 Uttara Kannada 25292 5613 59 30964 34824 7759 83 42666
25 Bellary 64160 18474 175 82809 91809 26304 251 118364
26 Bidar 77289 19328 0 96617 109300 27529 0 136829
27 Gulbarga 120057 27399 37 147493 176335 40219 52 216606
28 Yadagiri 67725 11609 12 79346 97841 16812 18 114671
29 Raichur 92892 18967 0 111859 132931 27147.39 0 160079
30 Koppal 62363 12750 0 75113 88813 18080 0 106893
1771155 364879 2174 2138208 2503223 513757.4 3021 3020002
44. AGRICULTURAL LAND HOLDINGS AND AREA As per 2010-11Census (contnd)
Sl.
No.
Districts
Small Agril. Land Holder (1-2 Ha.) (Total)
Note: Area Total may not tally due to rounding off
STATE
Number of Holders Area (in Hectares)
84

Male Female Institutions Total Male Female Institutions Total
1 Bengaluru 5822 1191 16 7029 15609 3161 43 18813
2 Bengaluru ( R) 11031 2058 7 13096 29054 5383 17 34454
3 Ramanagara 13874 2525 14 16413 35924 6490 36 42450
4 Chitradurga 47401 12662 0 60063 125441 33336 0 158777
5 Davanagere 37390 8214 301 45905 99226 21651 806 121683
6 Kolar 18974 2698 40 21712 50393 7105 100 57598
7 Chikkaballapura 17643 2752 0 20395 46653 7194 0 53847
8 Shimoga 19596 4647 56 24299 51891 12239 156 64286
9 Tumkur 58639 12389 42 71070 158774 33541 117 192432
10 Chikmagalur 22482 4368 201 27051 59226 11447 525 71198
11 Dakshina Kannada 9202 4327 92 13621 24269 11442 247 35958
12 Udupi 6515 5291 50 11856 17431 14216 136 31783
13 Hassan 31307 5505 80 36892 82065 14430 217 96712
14 Kodagu 11705 1750 46 13501 32019 4753 120 36892
15 Mandya 19567 3790 269 23626 49284 9296 700 59280
16 Mysore 26783 5389 9 32181 69120 13840 24 82984
17 Chamarajnagar 17089 3073 78 20240 44535 7935 213 52683
18 Belgaum 98223 6650 0 104873 266273 17968 0 284241
19 Bijapur 92902 12107 0 105009 251619 32215 0 283834
20 Bagalkote 46858 7183 0 54041 127518 19450 0 146968
21 Dharwad 30856 4222 45 35123 84678 11514 118 96310
22 Gadag 38478 5087 49 43614 104884 13640 142 118666
23 Haveri 40561 3278 68 43907 108153 8692 170 117015
24 Uttara Kannada 11383 2337 36 13756 30349 6167 104 36620
25 Bellary 45002 11364 193 56559 122175 30482 515 153172
26 Bidar 44906 9346 0 54252 118788 24497 0 143285
27 Gulbarga 92508 19007 48 111563 249742 50854 132 300728
28 Yadagiri 45428 7624 23 53075 123088 20558 55 143701
29 Raichur 66563 11952 4 78519 180506 32252 11 212769
30 Koppal 45943 7645 0 53588 123434 20462 0 143896
1074631 190431 1767 1266829 2882121 506210 4704 3393035
44. AGRICULTURAL LAND HOLDINGS AND AREA 2010-11Census (contnd)
Sl.
No.
Districts
Semi Medium Agril. Land Holder (2-4 Ha.) (Total)
Note: Area Total may not tally due to rounding off
STATE
Number of Holders Area (In Hectares)
85
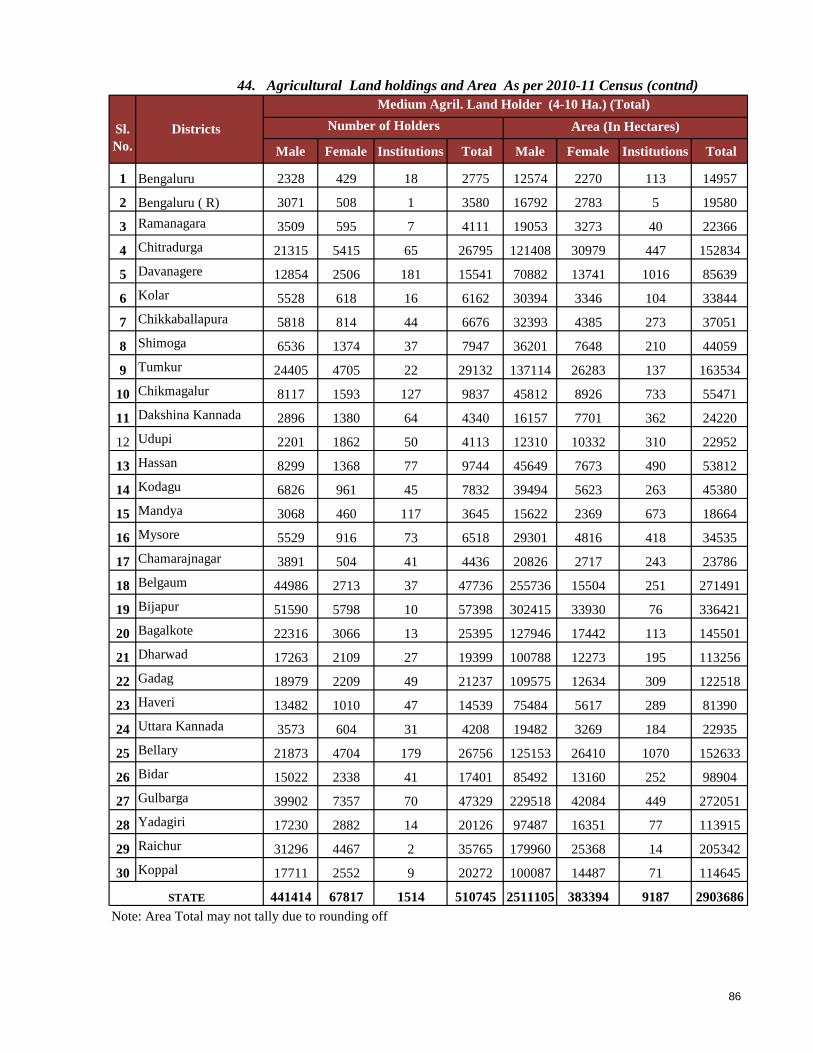
Male Female Institutions Total Male Female Institutions Total
1 Bengaluru 2328 429 18 2775 12574 2270 113 14957
2 Bengaluru ( R) 3071 508 1 3580 16792 2783 5 19580
3 Ramanagara 3509 595 7 4111 19053 3273 40 22366
4 Chitradurga 21315 5415 65 26795 121408 30979 447 152834
5 Davanagere 12854 2506 181 15541 70882 13741 1016 85639
6 Kolar 5528 618 16 6162 30394 3346 104 33844
7 Chikkaballapura 5818 814 44 6676 32393 4385 273 37051
8 Shimoga 6536 1374 37 7947 36201 7648 210 44059
9 Tumkur 24405 4705 22 29132 137114 26283 137 163534
10 Chikmagalur 8117 1593 127 9837 45812 8926 733 55471
11 Dakshina Kannada 2896 1380 64 4340 16157 7701 362 24220
12 Udupi 2201 1862 50 4113 12310 10332 310 22952
13 Hassan 8299 1368 77 9744 45649 7673 490 53812
14 Kodagu 6826 961 45 7832 39494 5623 263 45380
15 Mandya 3068 460 117 3645 15622 2369 673 18664
16 Mysore 5529 916 73 6518 29301 4816 418 34535
17 Chamarajnagar 3891 504 41 4436 20826 2717 243 23786
18 Belgaum 44986 2713 37 47736 255736 15504 251 271491
19 Bijapur 51590 5798 10 57398 302415 33930 76 336421
20 Bagalkote 22316 3066 13 25395 127946 17442 113 145501
21 Dharwad 17263 2109 27 19399 100788 12273 195 113256
22 Gadag 18979 2209 49 21237 109575 12634 309 122518
23 Haveri 13482 1010 47 14539 75484 5617 289 81390
24 Uttara Kannada 3573 604 31 4208 19482 3269 184 22935
25 Bellary 21873 4704 179 26756 125153 26410 1070 152633
26 Bidar 15022 2338 41 17401 85492 13160 252 98904
27 Gulbarga 39902 7357 70 47329 229518 42084 449 272051
28 Yadagiri 17230 2882 14 20126 97487 16351 77 113915
29 Raichur 31296 4467 2 35765 179960 25368 14 205342
30 Koppal 17711 2552 9 20272 100087 14487 71 114645
441414 67817 1514 510745 2511105 383394 9187 2903686
44. Agricultural Land holdings and Area As per 2010-11 Census (contnd)
Sl.
No.
Districts
Medium Agril. Land Holder (4-10 Ha.) (Total)
STATE
Note: Area Total may not tally due to rounding off
Number of Holders Area (In Hectares)
86
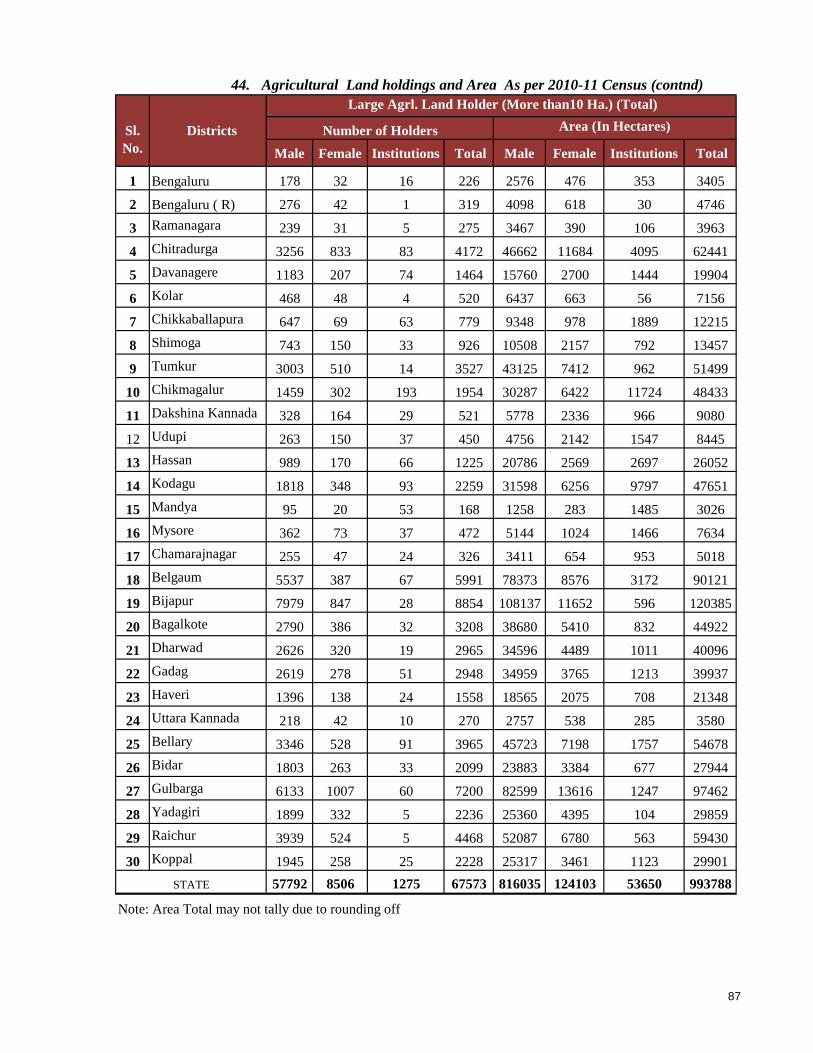
Male Female Institutions Total Male Female Institutions Total
1 Bengaluru 178 32 16 226 2576 476 353 3405
2 Bengaluru ( R) 276 42 1 319 4098 618 30 4746
3 Ramanagara 239 31 5 275 3467 390 106 3963
4 Chitradurga 3256 833 83 4172 46662 11684 4095 62441
5 Davanagere 1183 207 74 1464 15760 2700 1444 19904
6 Kolar 468 48 4 520 6437 663 56 7156
7 Chikkaballapura 647 69 63 779 9348 978 1889 12215
8 Shimoga 743 150 33 926 10508 2157 792 13457
9 Tumkur 3003 510 14 3527 43125 7412 962 51499
10 Chikmagalur 1459 302 193 1954 30287 6422 11724 48433
11 Dakshina Kannada 328 164 29 521 5778 2336 966 9080
12 Udupi 263 150 37 450 4756 2142 1547 8445
13 Hassan 989 170 66 1225 20786 2569 2697 26052
14 Kodagu 1818 348 93 2259 31598 6256 9797 47651
15 Mandya 95 20 53 168 1258 283 1485 3026
16 Mysore 362 73 37 472 5144 1024 1466 7634
17 Chamarajnagar 255 47 24 326 3411 654 953 5018
18 Belgaum 5537 387 67 5991 78373 8576 3172 90121
19 Bijapur 7979 847 28 8854 108137 11652 596 120385
20 Bagalkote 2790 386 32 3208 38680 5410 832 44922
21 Dharwad 2626 320 19 2965 34596 4489 1011 40096
22 Gadag 2619 278 51 2948 34959 3765 1213 39937
23 Haveri 1396 138 24 1558 18565 2075 708 21348
24 Uttara Kannada 218 42 10 270 2757 538 285 3580
25 Bellary 3346 528 91 3965 45723 7198 1757 54678
26 Bidar 1803 263 33 2099 23883 3384 677 27944
27 Gulbarga 6133 1007 60 7200 82599 13616 1247 97462
28 Yadagiri 1899 332 5 2236 25360 4395 104 29859
29 Raichur 3939 524 5 4468 52087 6780 563 59430
30 Koppal 1945 258 25 2228 25317 3461 1123 29901
57792 8506 1275 67573 816035 124103 53650 993788
44. Agricultural Land holdings and Area As per 2010-11 Census (contnd)
Sl.
No.
Districts
Large Agrl. Land Holder (More than10 Ha.) (Total)
STATE
Note: Area Total may not tally due to rounding off
Number of Holders Area (In Hectares)
87

Male Female Institutions Total Male Female Institutions Total
1 Bengaluru 65846 14679 90 80615 65336 13465 544 79345
2 Bengaluru ( R) 145020 33789 58 178867 125693 26260 81 152034
3 Ramanagara 221460 49825 163 271448 167899 34406 261 202566
4 Chitradurga 227197 63232 148 290577 438441 117793 4543 560777
5 Davanagere 226426 54817 1434 282677 333819 75816 4051 413686
6 Kolar 198213 38257 385 236855 200195 33276 452 233923
7 Chikkaballapura 178301 36054 107 214462 190841 33352 2163 226356
8 Shimoga 169524 44187 297 214008 209675 51326 1297 262298
9 Tumkur 326779 87403 246 414428 554996 120064 1328 676388
10 Chikmagalur 182860 39251 1366 223477 248509 51259 13609 313377
11 Dakshina Kannada 142792 65458 847 209097 121886 54612 1917 178415
12 Udupi 112972 86970 543 200485 83068 64328 2221 149617
13 Hassan 341883 93219 579 435681 283396 76467 3637 363500
14 Kodagu 57651 10803 427 68881 134874 22636 10351 167861
15 Mandya 280482 112940 2344 395766 246139 59379 3913 309431
16 Mysore 301928 83606 192 385726 299509 67076 1945 368530
17 Chamarajnagar 172297 39453 446 212196 176768 36725 1649 215142
18 Belgaum 487883 42948 104 530935 919340 69527 3423 992290
19 Bijapur 300565 41600 38 342203 844404 105256 672 950332
20 Bagalkote 193388 34298 45 227731 419865 66307 945 487117
21 Dharwad 124153 18868 204 143225 300444 41109 1425 342978
22 Gadag 141852 21297 317 163466 343266 45195 1804 390265
23 Haveri 198052 19944 355 218351 344690 30883 1345 376918
24 Uttara Kannada 149656 42658 508 192822 122369 26858 739 149966
25 Bellary 211667 62557 911 275135 428893 104908 3725 537526
26 Bidar 202413 48498 74 250985 372305 78541 929 451775
27 Gulbarga 324306 70921 270 395497 778239 157391 1907 937537
28 Yadagiri 193095 33280 83 226458 377670 64334 268 442272
29 Raichur 275390 56632 11 332033 591208 103990 588 695787
30 Koppal 179033 39035 34 218102 366489 65765 1194 433448
6333084 1486479 12626 7832189 10090226 1898304 72926 12061457
44. AGRICULTURAL LAND HOLDINGS AND AREA As per 2010-11 Census
Sl.
No.
Districts
Total Agrl. Land Holder (Total)
Note: Area Total may not tally due to rounding off
Number of Holders Area (In Hectares)
STATE
88

Financial
(Rs.in lakhs)
Physical
(Rs.in lakhs)
Financial
(Rs.in lakhs)
Physical (Rs.
In lakhs)
1 Bagalkote 5 12.78 226 3 10.56 150
2 Bangalore 6 16.90 1869 4 31.55 200
3 Bangalore(R) 5 13.40 582 2 18.31 100
4 Ramanagara 4 10.43 666 1 0 50
5 Belgaum 10 26.06 751 2 21.17 100
6 Bellary 7 17.32 1710 - - -
7 Bidar 5 14.96 2397 2 26.83 150
8 Bijapur 5 14.91 2429 1 15.09 50
9 Chamarajnagar 4 10.28 133 1 9.83 50
10 Chikmagalur 6 16.02 265 - - -
11 Chitradurga 6 18.42 840 1 10.52 50
12 Dakshina Kannada 4 10.64 648 1 5.38 50
13 Davanagere 5 13.53 442 2 17.82 100
14 Dharwad 6 13.65 560 2 10.73 100
15 Gadag 6 16.18 532 1 10.05 50
16 Gulbarga 7 18.84 1057 2 15.65 100
17 Yadagiri 0 0 0 - - -
18 Hassan 8 20.05 314 1 10.65 50
19 Haveri 7 16.37 661 1 6.69 50
20 Kodagu 2 6.22 501 - - -
21 Kolar 5 13.15 553 - - -
22 Chikkaballapura 5 13.95 379 1 8.2 50
23 Koppal 3 7.80 787 - - -
24 Mandya 7 14.45 1528 2 19.96 100
25 Mysore 8 21.77 5790 1 - 50
26 Raichur 5 13.41 414 - - -
27 Shimoga 7 17.31 402 1 8.57 50
28 Tumkur 11 26.47 4950 2 8.15 100
29 Udupi 2 5.10 241 - - -
30 Uttara Kannada 8 20.15 418 - - -
Head office (Training) _ 1.98 _ - - -
169 442.50 32045 34 265.71 1750
Sl No
Source: Women and Child Welfare Department
45. No.of Santwana and Swadhar centres & Financial & Physical Progress during: 2013-14
Note: Physical ( s̈ËwPÀ) $ zËd£ÀåPÉÆ̼ÀUÁVgÀĪÀ ªÀÄ»¼ÉAiÀÄgÀÄ / ¥sÀ¯Á£ÀÄ s̈À«UÀ¼ÀÄ , * ¤ªÁ¹UÀ¼ÀÄ:- ¤UÀðwPÀ ªÀÄ»¼ÉAiÀÄgÀÄ.
STATE
Progress Progress
Swadhar
centres
Santwana
centresDistrict
89
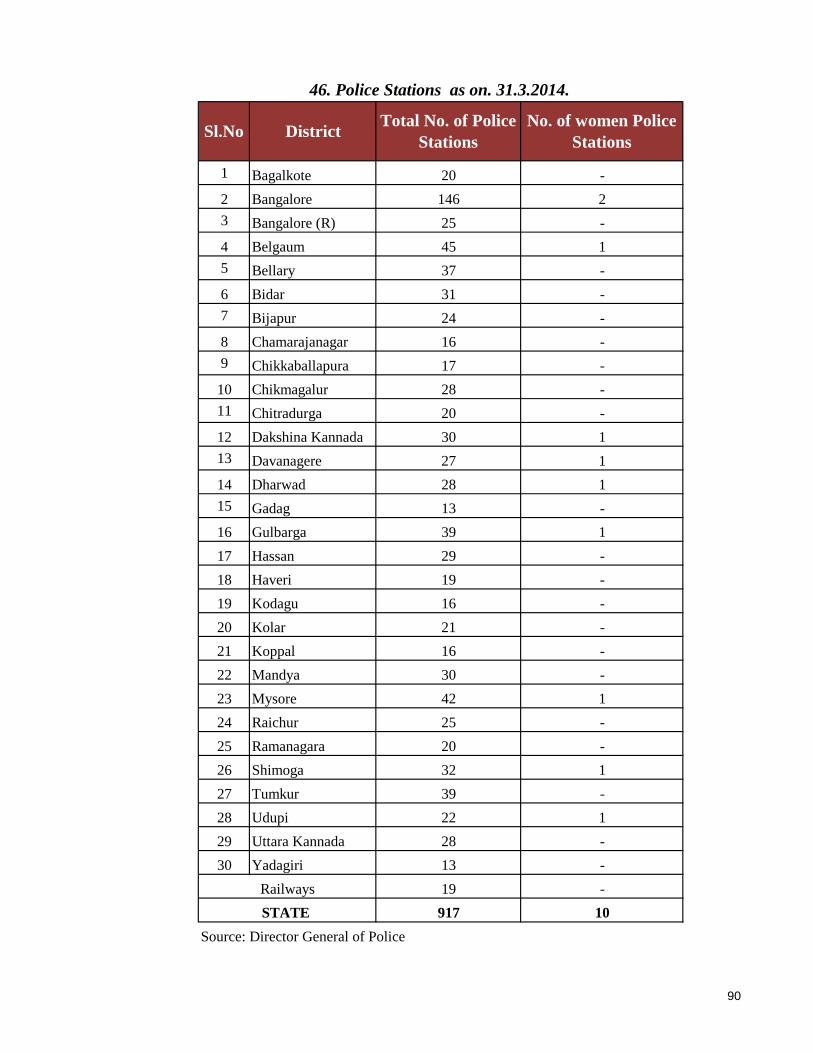
1 Bagalkote 20 -
2 Bangalore 146 2
3 Bangalore (R) 25 -
4 Belgaum 45 1
5 Bellary 37 -
6 Bidar 31 -
7 Bijapur 24 -
8 Chamarajanagar 16 -
9 Chikkaballapura 17 -
10 Chikmagalur 28 -
11 Chitradurga 20 -
12 Dakshina Kannada 30 1
13 Davanagere 27 1
14 Dharwad 28 1
15 Gadag 13 -
16 Gulbarga 39 1
17 Hassan 29 -
18 Haveri 19 -
19 Kodagu 16 -
20 Kolar 21 -
21 Koppal 16 -
22 Mandya 30 -
23 Mysore 42 1
24 Raichur 25 -
25 Ramanagara 20 -
26 Shimoga 32 1
27 Tumkur 39 -
28 Udupi 22 1
29 Uttara Kannada 28 -
30 Yadagiri 13 -
19 -
917 10
Source: Director General of Police
46. Police Stations as on. 31.3.2014.
Sl.No DistrictTotal No. of Police
Stations
No. of women Police
Stations
STATE
Railways
90

RapeMolesta-
tion
Dowry
deathRape
Molesta-
tion
Dowry
death
1 Bangalore City 321 52 51 80 378 52
2 Bangalore District 70 31 10 57 130 22
3 Kolar 37 18 1 20 25 3
4 Tumkur 171 33 18 37 206 14
5 Mysore 163 28 1 26 69 14
6 Mandya 149 35 9 31 221 19
7 Hassan 120 21 5 61 182 12
8 Kodagu 25 12 2 26 40 2
9 Dakshina Kannada 35 12 2 14 72 0
10 Uttara Kannada 97 7 1 17 155 6
11 Chickmagalur 70 10 4 21 141 7
12 Belgaum 205 37 5 61 246 7
13 Dharwad 38 5 0 18 34 1
14 Bijapur 41 18 4 28 94 2
15 Gulbarga 132 29 10 54 125 8
16 Yadagiri 97 9 0 16 123 3
17 Raichur 141 19 1 43 156 3
18 Bidar 40 9 10 18 82 7
19 Chitradurga 140 26 6 31 178 7
20 Shimoga 158 14 6 43 267 5
21 Bellary 48 18 9 36 99 5
22 Bagalkot 63 11 6 30 86 3
23 Chamarajnagar 64 9 2 16 95 4
24 Udupi 41 5 0 22 67 2
25 Koppal 17 7 0 22 39 0
26 Gadag 59 6 2 18 40 1
27 Haveri 72 12 3 18 80 1
28 Davangere 117 17 8 33 167 14
29 Chikballpur 56 12 12 33 57 17
30 Ramanagar 112 6 17 21 141 11
Mysore City 22 12 6 19 11 12
K.G.F 10 10 2 23 13 6
Hubli-Dwd City 16 6 2 16 37 4
K.Railways 2 2 2 1 3 2
Mangalore City 29 8 1 20 54 1
Total 2978 566 218 1030 3913 277
47. Crimes Against Women in Karnataka during: 2012-13
Source: Office of the Deputy Inspector General of Police, State
Crime Records Bureau , Government of Karnataka
2013
DistrictSl.
No.
2012
91

Male Female Total Male Female Total
1 Bangalore City 1176 813 1989 1308 725 2033
2 Bangalore District 286 123 409 310 153 463
3 Kolar 61 40 101 73 37 110
4 Tumkur 381 222 603 268 139 407
5 Mysore 235 133 368 196 94 290
6 Mandya 198 67 265 280 96 376
7 Hassan 434 187 621 464 145 609
8 Kodagu 234 74 308 187 72 259
9 Dakshina Kannada 198 70 268 203 60 263
10 Uttara Kannada 170 60 230 168 75 243
11 Chickmagalur 340 165 505 349 135 484
12 Belgaum 474 183 657 523 203 726
13 Dharwad 124 59 183 147 59 206
14 Bijapur 200 78 278 165 87 252
15 Gulbarga 123 73 196 127 71 198
16 Yadagiri 38 26 64 46 31 77
17 Raichur 146 87 233 156 82 238
18 Bidar 103 48 151 118 50 168
19 Chitradurga 315 171 486 251 115 366
20 Shimoga 404 185 589 364 143 507
21 Bellary 218 177 395 200 114 314
22 Bagalkot 128 81 209 176 77 253
23 Chamarajnagar 56 35 91 36 18 54
24 Udupi 260 87 347 255 97 352
25 Koppal 270 162 432 215 146 361
26 Gadag 96 61 157 90 54 144
27 Haveri 187 100 287 176 78 254
28 Davangere 284 107 391 373 244 617
29 Chikballapur 186 104 290 198 128 326
30 Ramanagar 282 101 383 316 104 420
K.Railways 421 57 478 453 184 637
Mysore City 217 83 300 133 77 210
K.G.F 57 27 84 44 22 66
Hubli-Dwd City 98 51 149 116 50 166
Mangalore City 196 60 256 179 52 231
8596 4157 12753 8663 4017 12680
48. Number of Suicide cases in Karnataka during
2012 and 2013 (up to March)
Source: Office of the Deputy Inspector General of Police, State Crime Records Bureau , Government of Karnataka
Total
DistrictSl.N
o.
20132012
92
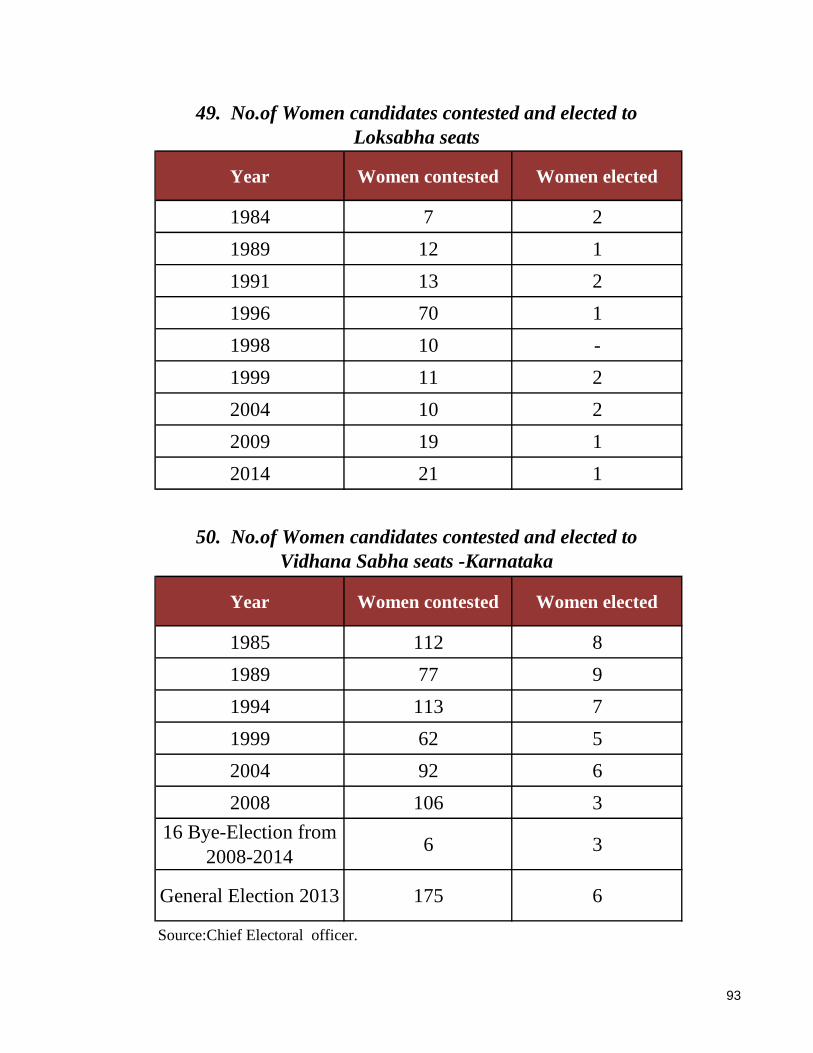
Year Women contested Women elected
1984 7 2
1989 12 1
1991 13 2
1996 70 1
1998 10 -
1999 11 2
2004 10 2
2009 19 1
2014 21 1
Year Women contested Women elected
1985 112 8
1989 77 9
1994 113 7
1999 62 5
2004 92 6
2008 106 3
16 Bye-Election from
2008-20146 3
General Election 2013 175 6
49. No.of Women candidates contested and elected to
Loksabha seats
Source:Chief Electoral officer.
50. No.of Women candidates contested and elected to
Vidhana Sabha seats -Karnataka
93

Sl.No. District Female Male Total
1 Bagalkote 4 15 19
2 Bangalore 28 97 125
3 Bangalore (R) 12 18 30
4 Belgaum 6 47 53
5 Bellary 4 17 21
6 Bidar 1 14 15
7 Bijapur 3 19 22
8 Chamarajnagar 2 8 10
9 Chikkaballapur 6 9 15
10 Chikmagalur 7 13 20
11 Chitradurga 4 14 18
12 Dakshina Kannada 8 25 33
13 Davanagere 4 16 20
14 Dharwad 8 22 30
15 Gadag 4 7 11
16 Gulbarga 5 20 25
17 Hassan 6 24 30
18 Haveri 5 14 19
19 Kodagu 10 10
20 Kolar 3 20 23
21 Koppal 2 7 9
22 Mandya 7 19 26
23 Mysore 15 22 37
24 Raichur 2 12 14
25 Ramanagara 4 12 16
26 Shimoga 10 16 26
27 Tumkur 12 24 36
28 Udupi 8 6 14
29 Uttara Kannada 4 14 18
30 Yadgir 0 5 5
31 * 18 32 50
OOD 7 40 47
209 638 847Total
51. Number of Judges - Genderwise in Karnataka : 2013-14
Source: High Court of Karnataka
Note:-* 50 Newly appointed Civil Judges who are under going foundation training at
Karnataka Judicial Academy, Bangalore and who are yet to be given postings.
94
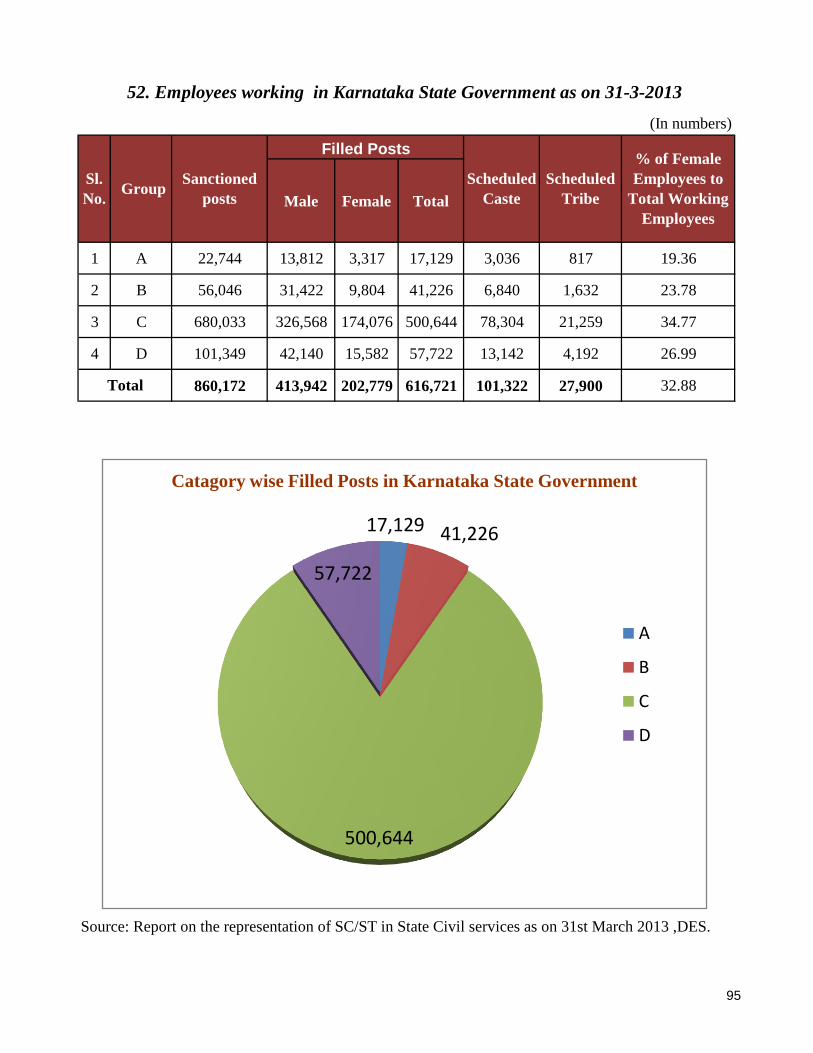
Male Female Total
1 A 22,744 13,812 3,317 17,129 3,036 817 19.36
2 B 56,046 31,422 9,804 41,226 6,840 1,632 23.78
3 C 680,033 326,568 174,076 500,644 78,304 21,259 34.77
4 D 101,349 42,140 15,582 57,722 13,142 4,192 26.99
860,172 413,942 202,779 616,721 101,322 27,900 32.88
Source: Report on the representation of SC/ST in State Civil services as on 31st March 2013 ,DES.
Filled Posts
Scheduled
Caste
Scheduled
Tribe
Sanctioned
posts
% of Female
Employees to
Total Working
Employees
52. Employees working in Karnataka State Government as on 31-3-2013
Sl.
No. Group
(In numbers)
Total
17,129 41,226
500,644
57,722
Catagory wise Filled Posts in Karnataka State Government
A
B
C
D
95
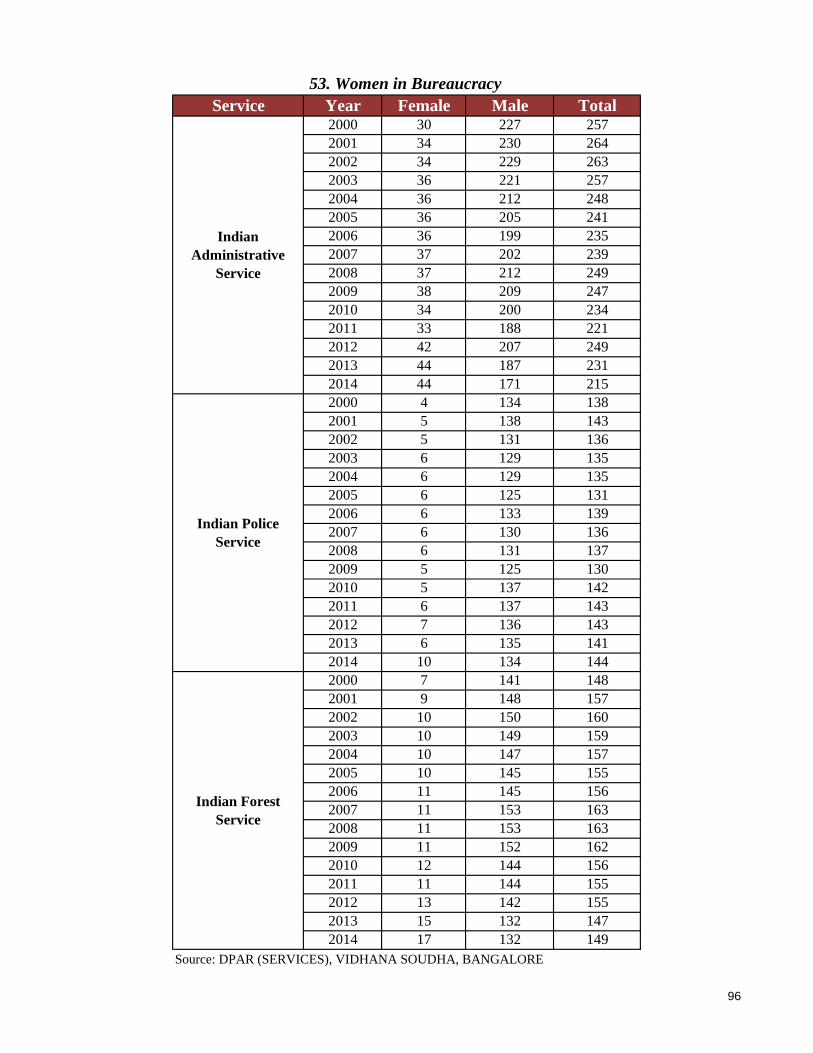
2000 30 227 257
2001 34 230 264
2002 34 229 263
2003 36 221 257
2004 36 212 248
2005 36 205 241
2006 36 199 235
2007 37 202 239
2008 37 212 249
2009 38 209 247
2010 34 200 234
2011 33 188 221
2012 42 207 249
2013 44 187 231
2014 44 171 215
2000 4 134 138
2001 5 138 143
2002 5 131 136
2003 6 129 135
2004 6 129 135
2005 6 125 131
2006 6 133 139
2007 6 130 136
2008 6 131 137
2009 5 125 130
2010 5 137 142
2011 6 137 143
2012 7 136 143
2013 6 135 141
2014 10 134 144
2000 7 141 148
2001 9 148 157
2002 10 150 160
2003 10 149 159
2004 10 147 157
2005 10 145 155
2006 11 145 156
2007 11 153 163
2008 11 153 163
2009 11 152 162
2010 12 144 156
2011 11 144 155
2012 13 142 155
2013 15 132 147
2014 17 132 149
Indian Police
Service
Indian
Administrative
Service
Indian Forest
Service
Source: DPAR (SERVICES), VIDHANA SOUDHA, BANGALORE
53. Women in Bureaucracy
Service Year Female Male Total
96

SL No District
Total Number
of Grama
Panchayats
Total Number
of Members
No. of seats
reserved for
women
% of seats
reserved for
women
1 Bagalkote 161 2961 1238 41.81
2 Bangalore Urban 86 1672 696 41.63
3 Bangalore Rural 98 1699 738 43.44
4 Belgaum 485 8469 3689 43.56
5 Bellary 189 3405 1378 40.47
6 Bidar 175 2972 1237 41.62
7 Bijapaur 199 3626 1544 42.58
8 Chamarajnagar 120 2061 858 41.63
9 Chickmagalur 226 2405 1182 49.15
10 Chikkaballpur 151 2400 1014 42.25
11 Chitradurga 185 3223 1329 41.23
12 Dakshina Kannada 203 3275 1472 44.95
13 Davanagere 230 3267 1438 44.02
14 Dharwad 127 1865 874 46.86
15 Gadag 106 1624 710 43.72
16 Gulbarga 220 3891 1644 42.25
17 Hassan 258 3711 1691 45.57
18 Haveri 208 2963 1362 45.97
19 Kodagu 98 1250 584 46.72
20 Kolar 156 2560 1085 42.38
21 Koppal 134 2604 1058 40.63
22 Mandya 232 3834 1660 43.30
23 Mysore 235 4300 1773 41.23
24 Raichur 164 3276 1301 39.71
25 Ramanagara 130 2109 920 43.62
26 Shimoga 260 2804 1389 49.54
27 Tumkur 321 5362 2268 42.30
28 Udupi 146 2398 1076 44.87
29 Utter Kannada 207 2622 1259 48.02
30 Yadgiri 117 2035 860 42.26
5627 90643 39327 43.39State
Source: State Election Commission, Government of Karnataka.
54. District wise Representation of Women in Grama Panchayats
(General Election : 2010)
97

SL No DistrictTotal No. of
Members
Number of
Women Member
% of seats
reserved for
women
1 Bagalkot 118 66 55.93
2 Bangalore Rural 68 38 55.88
3 Bangalore Urban 72 41 56.94
4 Belgaum 336 177 52.68
5 Bellary 135 75 55.56
6 Bidar 118 63 53.39
7 Bijapur 144 79 54.86
8 Chamarajanagar 85 45 52.94
9 Chickmagalur 110 62 56.36
10 Chikkaballapur 102 55 53.92
11 Chitradurga 129 69 53.49
12 Dakshina Kannada 129 71 55.04
13 Davanagere 129 69 53.49
14 Dharwar 75 45 60.00
15 Gadag 71 42 59.15
16 Gulbarga 155 87 56.13
17 Hassan 150 86 57.33
18 Haveri 118 65 55.08
19 Kodagu 49 28 57.14
20 Kolar 102 57 55.88
21 Koppal 103 57 55.34
22 Mandya 152 84 55.26
23 Mysore 171 92 53.80
24 Raichur 130 69 53.08
25 Ramanagara 83 45 54.22
26 Shimoga 109 65 59.63
27 Tumkur 212 116 54.72
28 Udupi 95 49 51.58
29 Uttar Kannada 128 78 60.94
30 Yadgiri 81 43 53.09
3659 2018 55.15
Source: State Election Commission, Government of Karnataka.
55. District wise Representation of Women in Taluk Panchayat
(General Election : 2010)
Total
98
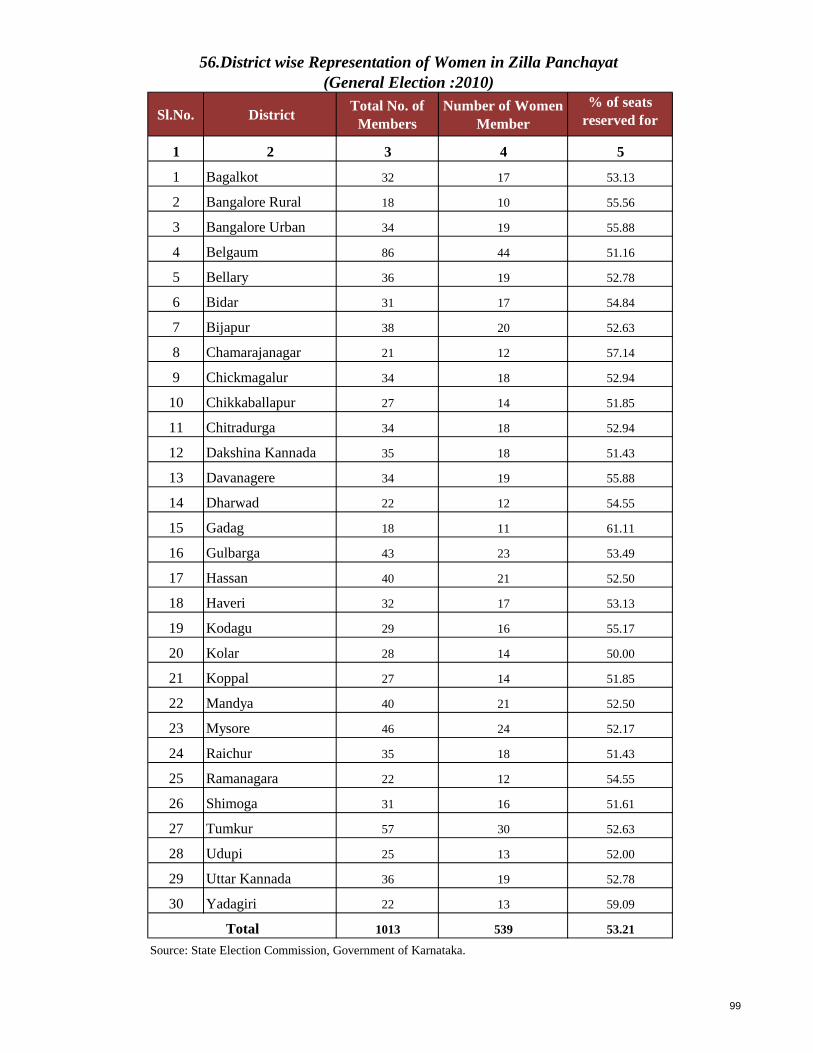
Sl.No. DistrictTotal No. of
Members
Number of Women
Member
% of seats
reserved for
women1 2 3 4 5
1 Bagalkot 32 17 53.13
2 Bangalore Rural 18 10 55.56
3 Bangalore Urban 34 19 55.88
4 Belgaum 86 44 51.16
5 Bellary 36 19 52.78
6 Bidar 31 17 54.84
7 Bijapur 38 20 52.63
8 Chamarajanagar 21 12 57.14
9 Chickmagalur 34 18 52.94
10 Chikkaballapur 27 14 51.85
11 Chitradurga 34 18 52.94
12 Dakshina Kannada 35 18 51.43
13 Davanagere 34 19 55.88
14 Dharwad 22 12 54.55
15 Gadag 18 11 61.11
16 Gulbarga 43 23 53.49
17 Hassan 40 21 52.50
18 Haveri 32 17 53.13
19 Kodagu 29 16 55.17
20 Kolar 28 14 50.00
21 Koppal 27 14 51.85
22 Mandya 40 21 52.50
23 Mysore 46 24 52.17
24 Raichur 35 18 51.43
25 Ramanagara 22 12 54.55
26 Shimoga 31 16 51.61
27 Tumkur 57 30 52.63
28 Udupi 25 13 52.00
29 Uttar Kannada 36 19 52.78
30 Yadagiri 22 13 59.09
1013 539 53.21
56.District wise Representation of Women in Zilla Panchayat
(General Election :2010)
Source: State Election Commission, Government of Karnataka.
Total
99
1. Sri.K.V.Raghurama Reddy Joint Director
2. Sri Sannamasiyappa Assistant Director
3.Smt.K.Susheela Assistant Director
4. Smt.N.Varalakshmi Assistant Statistical Officer
5. Smt.D.N.Shantha Assistant Statistical Officer
6. Sri.M.Mahadeva Statistical Inspector
7. Sri.N.R.SiddarajuStatistical Inspector (Probationary)
TEAM INVOLVED IN THE PUBLICATION OF
THIS REPORT