melanoma changing landscape - win 2018 … · molecular alterations in melanoma fgfr pten pi3k akt...
TRANSCRIPT

Alexander Eggermont
MELANOMA Changing Landscape
2013
Dublin Melanoma Conference

ACTIVITY IN STAGE IV MELANOMA
Patients Chan
ge in
targ
et
lesio
ns fro
m b
aselin
e (
%)
-80

THE MELANOMA PARADIGM
MUTATION DRIVEN DRUG DEVELOPMENT
INNOVATIVE IMMUNOMODULATION
Copyright © American Society of Clinical Oncology
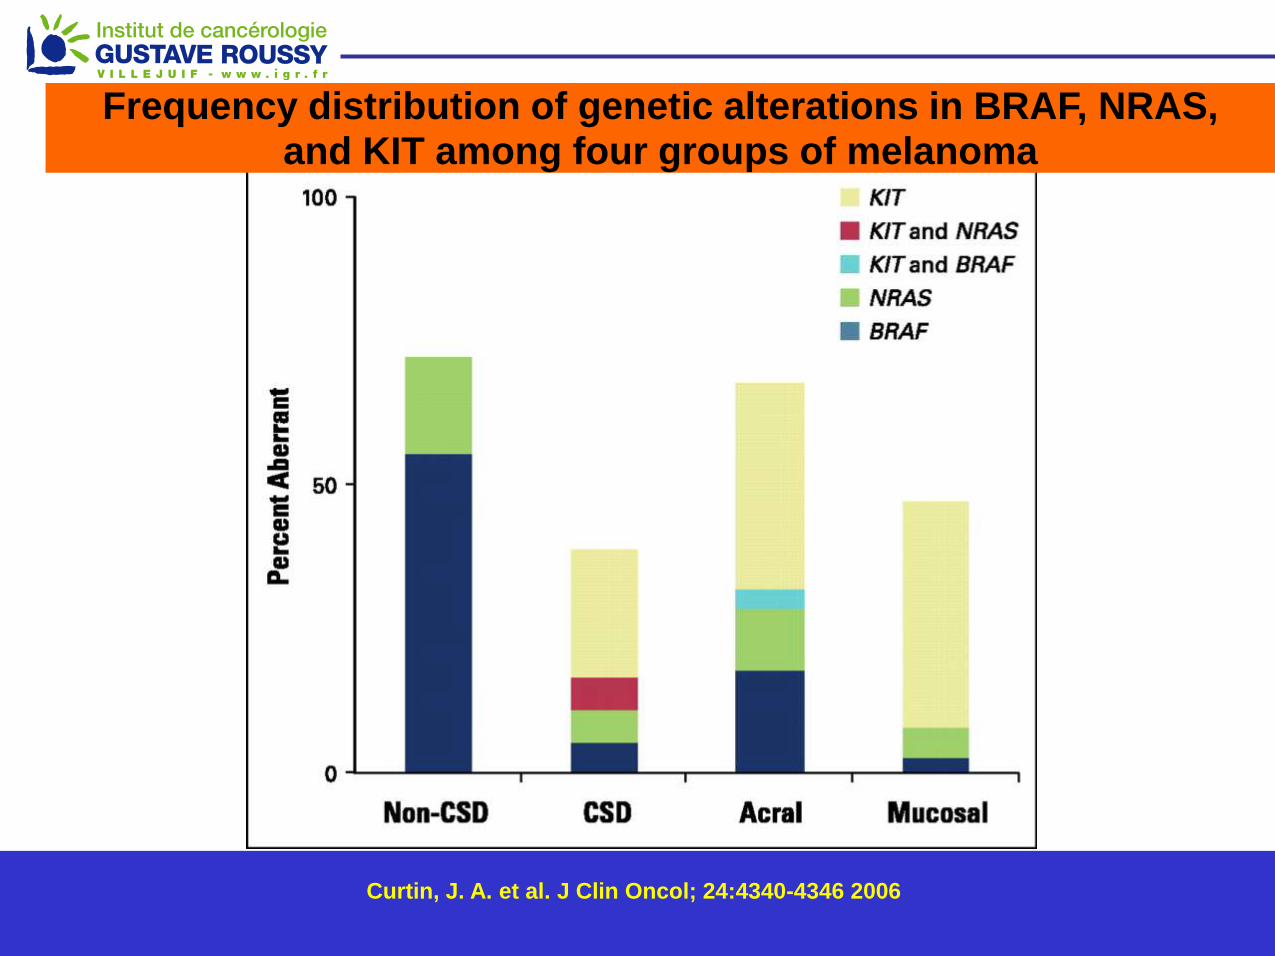
Curtin, J. A. et al. J Clin Oncol; 24:4340-4346 2006
Frequency distribution of genetic alterations in BRAF, NRAS, and KIT among four groups of melanoma

BRAF Rate by Decade
Menzies AM et al, ASCO 2011, Melanoma Oral Session, Abs# 8507
Jakob JA et al J Clin Oncol 29:526s, 2011 (suppl 15s; abstr 8500)
Cheng S et al J Clin Oncol 29:549s, 2011 (suppl 15s; abstr 8597)
Rubinstein JC et al J Transl Med 8:67, 2010
>25% V600K/D/R >90% V600E

BRAF and NRAS-mutant melanomas
Jakob et al. Cancer 2011

Molecular Alterations in Melanoma
FGFR
PTEN
PI3K Akt
TOR
KIT
GRB2
SOS Ras
GDP C-Raf
N-Ras
GTP B-Raf
MEK
ERK
ELK
MITF
CDK2/4
Cyclin D
p16
Amplified
in 30%
Amplified
in 30%
50%-65%
V600E
mutation
15% mutation
Amplified or mutated in 20%-40%
acral and mucosal melanoma
25%-50% loss
Frequent loss
Amplified in 10%-15%
Adapted from Sosman, Curr. Oncol. Rep. 11, 405 (2009)

PFS 1.6-5.5 mts OS 9.6-13.2 mts
Gain: 3.9 mts Gain 3.6 mts* HR 0.26 HR 0.62
Chapman PB et al. N Engl J Med 2011 And BRIM-3 Update October 2011
BRIM 3

Pro
po
rtio
n A
live W
ith
ou
t P
rog
ressio
n
Time from Randomization (Months)
0 1 2 3 4 5 6 7 8 9
187 184 173 113 100 41 31 5 3 0
63 53 31 14 11 6 4 2 0 0
0.0
0.1
0.2
0.3
0.4
0.5
0.6
0.7
0.8
0.9
1.0
DABRAFENIB: Primary Endpoint: PFS Investigator-Assessed (Cut-off: 19 December 2011)
Dabrafenib: median PFS 5.1 mos
DTIC:
median PFS 2.7 mos
Hazard ratio 0.30 (95% CI: 0.18, 0.51); p<0.0001
Number at risk
On randomized study treatment at cut-off: dabrafenib 57%, DTIC 27% Median follow-up time: 4.9 months (dabrafenib 5.1 mos, DTIC 4.8 mos.) Hauschild et al ASCO 2012

100
90
80
70
60
50
40
30
20
10
0
Ove
rall
surv
ival
(%
)
No. at risk
0 6 12 18 24
Vemurafenib (N=337)
Median f/u 12.5 mos.
Time (months)
Dacarbazine (N=338)
Median f/u 9.5 mos.
Dacarbazine
Vemurafenib
338
337
173
280
79
178
24
44
0
1
244
326
111
231
50
109
4
7
9.7 13.6
Overall survival (Feb 01, 2012 cutoff) Censored at crossover
Hazard ratio 0.70 (95% CI; 0.57 - 0.87) p<0.001 (post-hoc)
Chapman et al ASCO 2012

Selected adverse events (% of patients)
Vemurafenib, n= 337 Dacarbazine, n= 287
Adverse events All Grade 3 Grade≥ 4 All Grade 3 Grade ≥4
Arthralgia 56 6 – 4 1 –
Rash 41 9 – 2 – –
Fatigue 46 3 – 35 2 –
Photosensitivity 41 4 – – –
LFTs 26 10 1 6 2 –
Cutaneous SCC 19 19 – <1 <1 –
Keratoacanthoma 11 10 – <1 <1 –
Skin papilloma 28 <1 – <1 <1 –
Nausea 38 2 – 45 2 –
Neutropenia <1 – <1 12 6 3
Discontinuations due to AE: 7% Vemurafenib; 2% Dacarbazine
Data-cut: Feb 01, 2012
8 patients reported primary melanoma in the vemurafenib group. Chapman et al ASCO 2012

SCC: Time to Event < 12-14 weeks
0-2 2-4 4-6 6-8 8-10 10-12 12-14 >14
Weeks on GSK2118436
= individual pt event
= second event
Squamous Cell Carcinoma (Skin)
Thigh: Week 6
• Histopathology: Low-
grade squamous cell
carcinoma
• In 20-25% of patients
• Induced in first 4 months
(?)
*includes recent events not included in AE tables
Kefford et al, Sydney 2010

Symptoms Incidence % Comments
Rash 36-53%
Grade 3: 6-8%
Maculopapular
Keratosis pilaris
Photosensitivity 30 UVA-induced
HFSR
hyperkeratosis 20 Rubbing, pressure areas
Hair modification
Alopecia
100
8 Can be reversible
Vemurafenib-associated skin manifestations (1)

Symptoms Incidence % Comments
Cystic lesions ? Multiple, face
Papillomas
Warts 20-50 Multiple
Keratoacanthomas
SCC
20-30 Multiple
Eruptive navi
Melanomas ?
Median time to
occurrence
6-8 wks
Vemurafenib-associated skin manifestations (2)

INDUCTION NEW MELANOMAS under Vemurafenib

Short impact on OS in stage IV PD in stage IV mostly new lesions while on treatment?
TOXICITY IS MAJOR DETERMINANT IN ADJUVANT SETTING
RISKS SCC, New Melanomas
Colon Polyps
Gastric Polyps
Pancreas ????
Against use of BRAFinhibitors alone in adjuvant setting Problems solved by BRAFinh + MEKinh ?
IMPLICATIONS FOR ADJUVANT SETTING
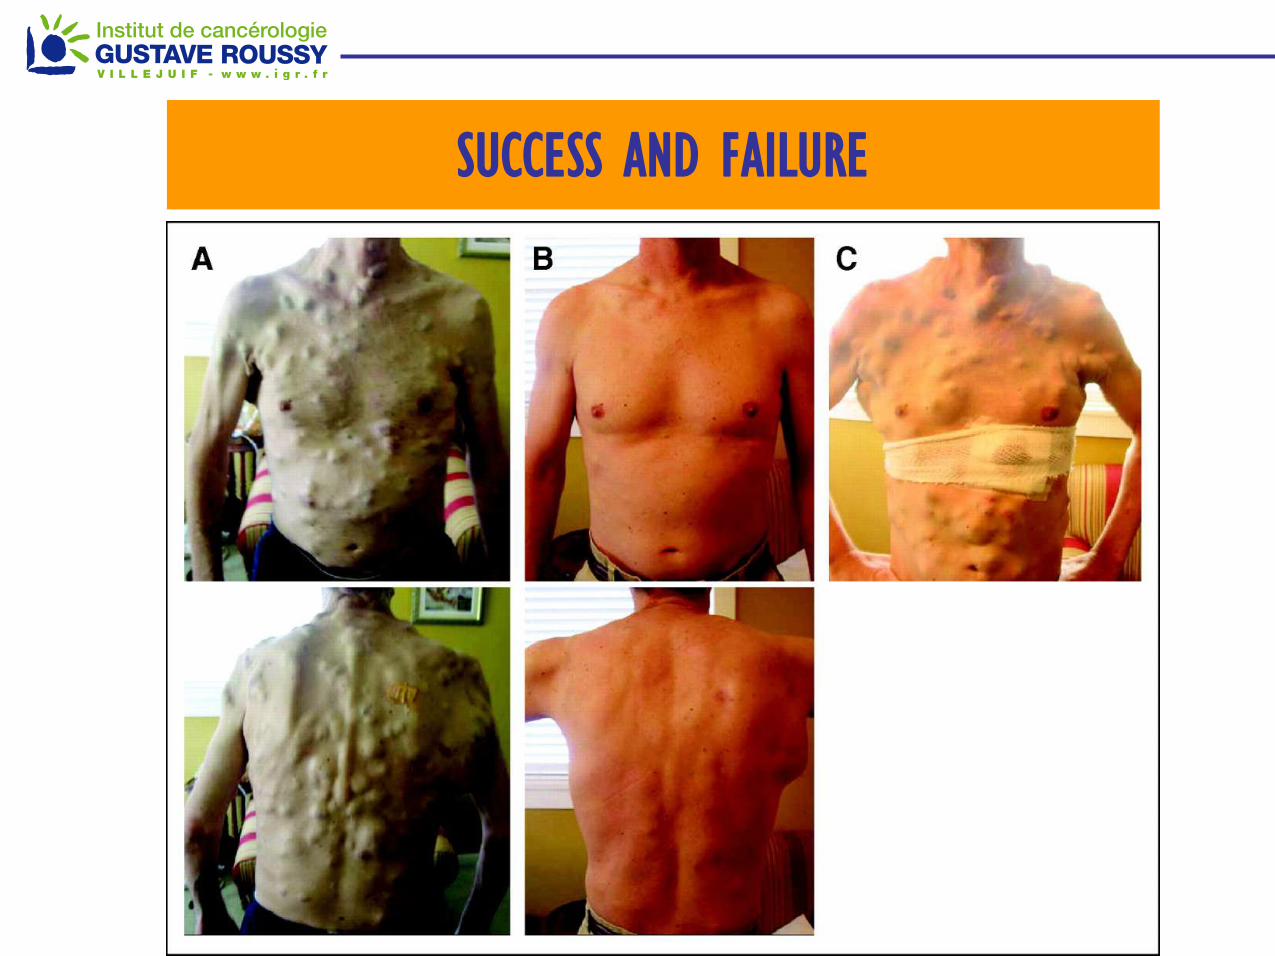
SUCCESS AND FAILURE

Multiple Mechanisms of Prexisting or Acquired Resistance to
BRAFinhibitors Identified
PDGFRb overexpression: 4/11 biopsies from relapsed patients1
NRAS mutations (Q61K orR): 2/15 samples1
Elevated COT expression which reactivated ERK signaling: 2/3 samples2
Increased levels of IGF-1R and pAKT: activated PI3K pathway signaling (1/5)3
Acquired a MEK mutation at C121S which reactivates the ERK signaling (1/1)4
1. Nazarian R et al. Nature 2010; 2. Johannessen CM et al. Nature 2010;
3. Villanueva J et al. Cancer Cell 2010; 4. Wagle N et al. J. Clin. Oncol. 2011;

Molecular Alterations in Melanoma
MEK Inhibitors (ASCO 2012)
FGFR
PTEN
PI3K Akt
TOR
KIT
GRB2
SOS Ras
GDP C-Raf
N-Ras
GTP B-Raf
MEK
ERK
ELK
MITF
CDK2/4
Cyclin D
p16
Amplified
in 30%
Amplified
in 30%
50%-65%
V600E
mutation
15% mutation
Amplified or mutated in 20%-40%
acral and mucosal melanoma
25%-50% loss
Frequent loss
Amplified in 10%-15%
Adapted from Sosman, Curr. Oncol. Rep. 11, 405 (2009)

MEKinhibitor TRAMETINIB vs DTIC
METRIC PFS P
rop
ort
ion
Alive a
nd
Pro
gre
ssio
n-F
ree
Time From Randomization (Months)
0 1 2 3 4 5 6 7 8 9
Number at risk
INV – Trametinib 178 170 130 79 69 22 18 4 0 0
INV – Chemotherapy 95 77 38 20 17 8 5 1 0 0
INV – Trametinib
IRC – Trametinib
INV – Chemotherapy
IRC – Chemotherapy
0.0
0.1
0.2
0.3
0.4
0.5
0.6
0.7
0.8
0.9
1.0
Events
n (%)
Median
(months)
HR (95%CI)
P-value
Trametinib 96 (54) 4.8 0.44 (0.31, 0.64)
<0.0001 Chemotherapy 68 (72) 1.4
Robert et al ASCO 2012

Molecular Alterations in Melanoma
BRAF + MEK Inhibitors (ASCO 2012)
FGFR
PTEN
PI3K Akt
TOR
KIT
GRB2
SOS Ras
GDP C-Raf
N-Ras
GTP B-Raf
MEK
ERK
ELK
MITF
CDK2/4
Cyclin D
p16
Amplified
in 30%
Amplified
in 30%
50%-65%
V600E
mutation
15% mutation
Amplified or mutated in 20%-40%
acral and mucosal melanoma
25%-50% loss
Frequent loss
Amplified in 10%-15%
Adapted from Sosman, Curr. Oncol. Rep. 11, 405 (2009)

5 CR: 3 confirmed, 2 waiting follow-up
4 pts not shown on plot: 2 PR, 1 SD, 1 PD ASCO 2011 Kefford et al
GSK436 150 mg BID/GSK212 1.5 mg QD
GSK436 150 mg BID/GSK212 1 mg QD
GSK436 75 mg BID/GSK212 1 mg QD
GSK436 150 mg BID/GSK212 2 mg QD
Combination: BRAF (GSK436) plus MEK inhibitor (GSK212)
Dabrafenib plus Trametenib
Ma
xim
um
% r
eduction fro
m b
aselin
e m
easure
me
nt

Dabrafenib vs Dabrafenib+Trametinib
Progression-Free Survival
Esti
mate
d s
urv
ival
fun
cti
on
Patients at risk Time since randomization (months)
1.0
0.8
0.6
0.4
0.2
0.0
0 3 6 9 12 15 18
54 46 25 13 2 0
54 47 33 26 11 1
54 52 36 29 15 1
Med
(mos)
HR (95% CI),
P-Value
Mono D 5.8
150/1 9.2 0.56 (0.37, 0.87), 0.006
150/2 9.4 0.39 (0.25, 0.62),<0.0001
12 mo.
PFS rate
9%
26%
41%
Med follow up time 14 mo

Drabrafenib vs Dab+Trametenib Overall Survival
Time since randomization (months)
1.0
0.8
0.6
0.4
0.2
0.0
0 3 6 9 12 15 18
Estim
ate
d s
urv
ival fu
nctio
n
Patients at risk 54 54 50 44 28 4
54 52 46 43 27 3
54 54 52 47 31 7
43/54 (80%) Monotherapy D crossed to 150/2
Median HR, P-Value
Mono D NR
150/1 NR 0.98, NS
150/2 NR 0.67, NS
12 mo. OS rate
70%
68%
79%
Med follow up time 14 mo

Vemurafenib +GDC-0973: BRIM7 study objectives
Gonzalez, R et al ESMO 2012
GDC-0973:
Orally available, potent and highly selective small-molecule inhibitor of both MEK 1 and MEK 2
GDC-0973 monotherapy Phase I study:
14 day on/14 day off schedule MTD = 100mg
21 day on/7 day off schedule MTD = 60mg
Common AEs: diarrhea, rash, edema, fatigue, nausea
Encouraging single-agent activity in BRAFV600 melanoma
7 responders out of 12 melanoma patients
6 responders were BRAFV600E mutation-positive (1 pt unknown mutation status)
Median time on GDC-0973 treatment: 9.3 months (range 1.4 - 23 + months).
BRIM7 Objectives:
To evaluate the safety and tolerability of vemurafenib + GDC-0973
To identify the dose-limiting toxicities (DLTs) that determine the maximum tolerated dose (MTD) of vemurafenib + GDC-0973
To identify a Phase II/III dose and schedule for vemurafenib + GDC-0973

BRIM7 Results: Change in tumor size from
baseline to best response in BRAFi-naïve patients
SLD, sum of longest diameters
-30
% C
hange fro
m B
aselin
e in S
LD
of T
arg
et
Lesio
ns
-100
-50
0
50
100
Individual Patients Treated with Vemurafenib and GDC-0973
Best Tumor Response for Each Patient (BRAFi-naïve)
Cohort 1A
Cohort 1B
Cohort 1C
Cohort 2A
Cohort 4
Exp. Cohort 1A
Exp. Cohort 1B
n=25 evaluable patients
Gonzalez, R. et al ESMO 2012

NRAS-mutant melanoma
Jakob et al. Cancer 2011

PI3K/AKT/mTOR
pathway
RT
Ks
SOS
Grb2 SHC
P P P P
Proliferation, Survival
MEK
p90RSK MSK1
P P
B-RAF C-RAF
ERK1/2
NRAS NRAS
MEK inhibitors in NRAS mutant melanoma
MEKi :
selumetinib
trametinib
pimasertib
MEK162
GDC0973

MEK162 NRAS mutant melanoma
-100
-80
-60
-40
-20
0
20
40
60
80
100
Bes
t %
ch
ange
fro
m b
asel
ine
*Patients with missing best % change from baseline and unknown overall response are not included.
N=28* Progressive Disease (PD)
Stable Disease (SD)
Partial Response (PR)
Unconfirmed PR
Ongoing pts
Ascierto, P. ASCO 2012
Best ORR 28%

Tumor by evolution is “moving target”
• Heterogeneity and Innate resistance
• Acquired resistance/Additional mutations
• Tumor cell plasticity EMT-MET
• Cancer Stem Cells
• Epigenitics
• MONO-DIMENSIONAL THINKING ABOUT PATHWAYS
Drug Development Challenges

Would not have been predicted by Geneprofiling
Needed shRNA screening


THE MELANOMA PARADIGM
MUTATION DRIVEN DRUG DEVELOPMENT
INNOVATIVE IMMUNOMODULATION

IMMUNOTHERAPY ESTABLISHED
“targeted therapy”
ANTI-CTLA4

Anti CTLA-4 Monoclonal Antibodies
Perpetuate T Cell Activation
Reawaken silenced Immune Response
IL-2
B7 MHC
TCR
CD28
. . . . . . . . . . . .
. . .
~ Antigen
APC
T-cell
CTLA-4
B7 MHC
TCR
CD28
~ Antigen
B7 MHC
TCR
CD28 CTLA-4
. . . . . .
. . . . . .
. . .
Antigen
Anti-CTLA-4 mAb
MHC
IL-2
~

36
Survival Rate Ipi + gp100 N=403 Ipi + pbo N=137
gp100 + pbo N=136
1 year 44% 46% 25%
2 year 22% 24% 14%
Ipilimumab in Melanoma in 2nd line
Ipi + gp100 (A)
Ipi alone (B)
gp100 alone (C)
1 2 3 4 Years
Comparison HR p-value
Arms A vs. C 0.68 0.0004
Arms B vs. C 0.66 0.0026

Ipilimumab + DTIC in Melanoma in 1st line. IMPACT MEDIAN SURVIVAL 2.1 MONTHS
Robert C et al. N Engl J Med
2011.

ACTIVITY
ORR 10-15%
Takes often > 3 months, may have initial PD
Tail on curve: about 20% > 2-3 years control
Combo with chemo: disappointing / no clear gains
BIOMARKERS
No Good Predictive Biomarkers Lymphocyte count
Eosinophil count
irAEs
Activity and Biomarkers

Not so easy to handle
“Autoimmune Events” irAE
Colitis
Dermatitis
Hepatitis
Hypophysitis
Thyroiditis
TOXICITY Ipilimumab

ANTI-PD1/PD1-L
DRUG OF THE YEAR

Reminder
Anti-CTLA4 is quite different from Anti-PD-1

Anti CTLA-4 Monoclonal Antibodies (CENTRAL AT LYMPHNODES)
Perpetuate T Cell Activation / Reawaken silenced Immune Response IL-2
B7 MHC
TCR
CD28
. . . . . . . . . . . .
. . .
~ Antigen
APC
T-cell
CTLA-4
B7 MHC
TCR
CD28
~ Antigen
B7 MHC
TCR
CD28 CTLA-4
. . . . . .
. . . . . .
. . .
Antigen
Anti-CTLA-4 mAb
MHC
IL-2
~

PD-1 – PDL-1
ACTION MAINLY AT TUMOR SITE
D Pardoll Nat Rev Cancer 2012

Blocking CTLA-4 and PD-1
T cell Tumor cell
MHC TCR
PD-L1 PD-1
- - -
T cell
Dendritic
cell
MHC TCR
CD28
B7 CTLA-4 - - -
Activation
(cytokines, lysis, proliferation,
migration to tumor)
B7
+ + +
+ + +
CTLA-4 Blockade (ipilimumab) PD-1 Blockade (nivolumab)
anti-CTLA-4
anti-PD-1
Tumor Microenvironment
+ + +
PD-L2 PD-1
anti-PD-1
- - -

Presented by: Jedd D. Wolchok, MD, PhD
Epub June 2, 2013

Presented by: Jedd D. Wolchok, MD, PhD
IPILIMUMAB + NIVOLIMUMAB
Best Responses in Sequenced Cohorts
Patients who had radiographic progression with prior ipilimumab treatment.
Patients who had stable disease with prior ipilimumab treatment.
Patients
-80

IPILIMUMAB +NOVOLIMUB
All Evaluable Patients in CONCURRENT COHORTS
Presented by: Jedd D. Wolchok, MD, PhD
After ~13 months of
follow-up, for all
concurrent cohorts,
90% of all
responding patients
continue to respond
as of Feb 2013.
Patients
Chan
ge in
targ
et
lesio
ns fro
m b
aselin
e (
%)
-80
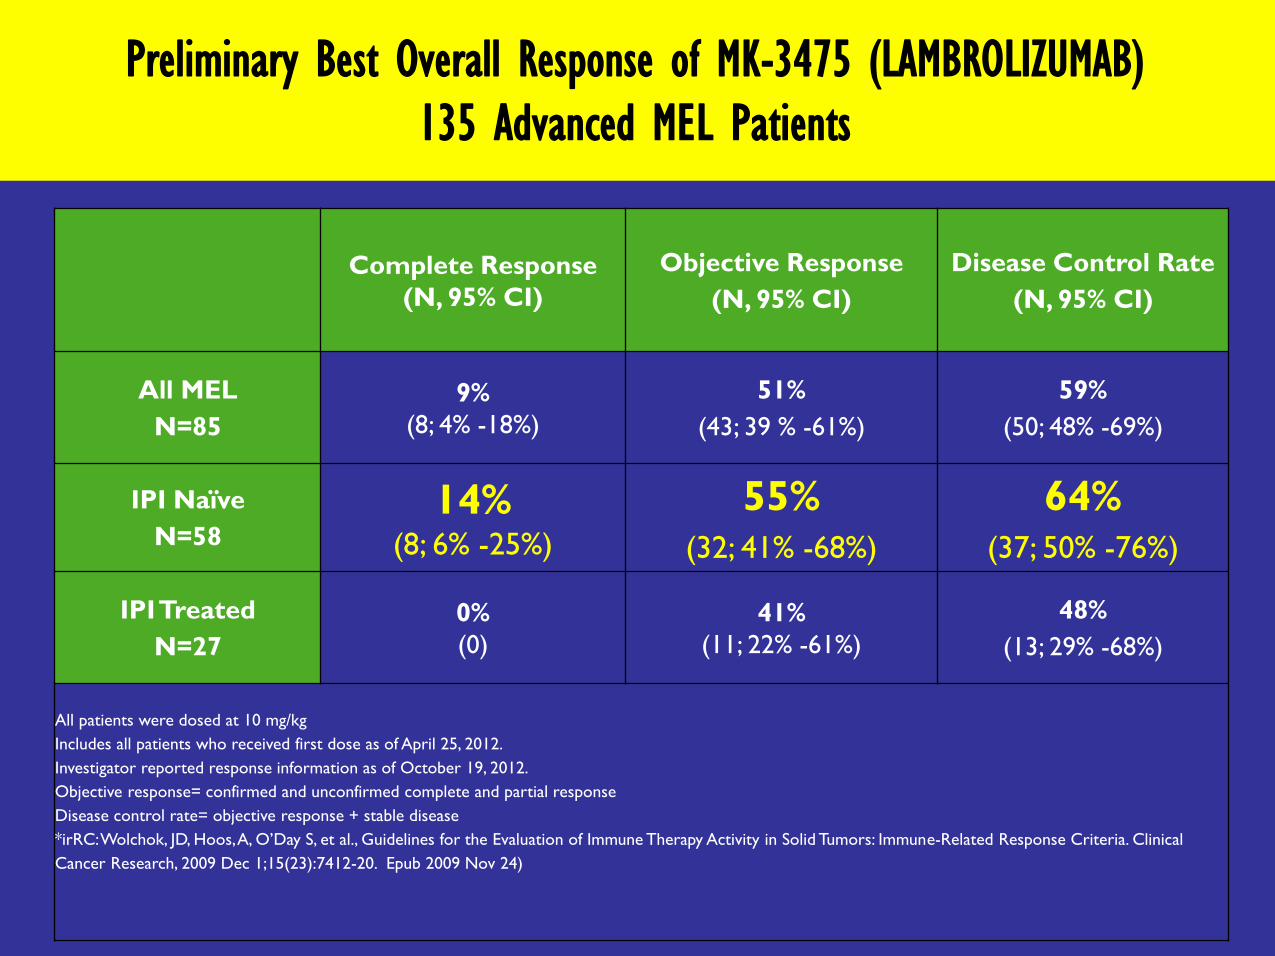
Preliminary Best Overall Response of MK-3475 (LAMBROLIZUMAB)
135 Advanced MEL Patients
Complete Response
(N, 95% CI)
Objective Response
(N, 95% CI)
Disease Control Rate
(N, 95% CI)
All MEL
N=85
9%
(8; 4% -18%)
51%
(43; 39 % -61%)
59%
(50; 48% -69%)
IPI Naïve
N=58
14% (8; 6% -25%)
55% (32; 41% -68%)
64% (37; 50% -76%)
IPI Treated
N=27
0%
(0)
41%
(11; 22% -61%)
48%
(13; 29% -68%)
All patients were dosed at 10 mg/kg
Includes all patients who received first dose as of April 25, 2012.
Investigator reported response information as of October 19, 2012.
Objective response= confirmed and unconfirmed complete and partial response
Disease control rate= objective response + stable disease
*irRC: Wolchok, JD, Hoos, A, O’Day S, et al., Guidelines for the Evaluation of Immune Therapy Activity in Solid Tumors: Immune-Related Response Criteria. Clinical
Cancer Research, 2009 Dec 1;15(23):7412-20. Epub 2009 Nov 24)

LAMBROLIZUMAB: Characteristics of Responses (irRC):
Time to Respond & Duration for 43 Patients with Objective Response
On Treatment Duration in Weeks
• Median duration of treatment,
• 7.6 months + (3.3-11+)
• one patients discontinued due to PD
and four patients discontinued due to
AEs
0 4 8 12 16 20 24 28 32 36 40 44 48 52
IPI naive
IPI treated
Complete Response
Partial Response
On Treatment

Long Term Data Nivolimumab: Response rates around 30%
MEDIAN DURATION of RESPONSE: > 2 YEARS !
Lambrolizumab alone Response rates up to 50-60%
Ipilimumab + Nivolimumab Response Rates up to > 80%
MAJORITY > 80% REGRESSION
Nivolimumab / Lambrolizumab in Melanoma

Years
Immunotherapy Targeted therapy
Perc
ent a
live
Perc
ent aliv
e
1 2 3 0 1 2 3 0 Years
Combination???
Perc
ent a
live
1 2 3 0 Years
Combining immunotherapy and targeted therapy for melanoma?

Ribas A et al NEJM 368 2013 (letter)

Ipilimumab vs Ipilimumab + GM-CSF Less Toxicity ?
Survival Benefit for Combo
Unexplained ….
T-VEC Response rates 16%
Survival benefit ??
SIDE SHOW

54
Patients were to remain on treatment beyond progression unless clinically significant (ie, associated with reduced performance
status) after 24 weeks
OPTiM Phase III Study Design
Injectable, Unresectable
Stage IIIB-IV Melanoma
T-VEC
Intralesional
up to 4 mL Q2W*
GM-CSF Subcutaneous
14 days of every
28 day cycle*
2 : 1
N = 430 (planned)
Primary Endpoint:
Durable Response
Rate
(Defined as Objective
Response lasting for
at least
6 months)
* Dosing of intralesional T-VEC was ≤ 4 mL x106 pfu/mL once, then after 3 weeks, ≤ 4 mL x108 pfu/mL Q2W.
Dosing of GM-CSF was 125 μg/m2 subcutaneous daily x14 days of every 28 day cycle.
Randomization Stratification: 1. Disease substage 2. Prior systemic treatment 3. Site of disease at first recurrence 4. Presence of liver metastases

Selective viral replication
in tumor tissue
Tumor cells rupture for an
oncolytic effect
Systemic tumor-specific
immune response
Death of distant cancer
cells
1. Varghese S, et al. Cancer Gene Ther. 2002;9:967-978. 2. Hawkins LK, et al. Lancet Oncol. 2002;3:17-26. 3. Fukuhara H, et al. Curr Cancer Drug Targets. 2007;7:149-
155. 4. Sobol PT, et al. Mol Ther. 2011;19:335-344. 5. Liu BL, et al. Gene Ther. 2003;10:292-303. 6. Melcher A, et al. Mol Ther. 2011;19:1008-1016. 7. Fagoaga OR In:
McPherson RA, Pincus MR, eds. Henry’s Clinical Diagnosis and Management by Laboratory Methods, 22nd ed. Philadelphia, PA: Elsevier; 2011:933-953. 8. Dranoff G.
Oncogene. 2003;22:3188-3192.
T-VEC: An HSV-1 Derived Oncolytic Immunotherapy
Designed to Produce Both Local and Systemic Effects
55
Local Effect:
Tumor Cell Lysis
Systemic Effect:
Tumor-Specific Immune Response
T-VEC key genetic modifications:
JS1/ICP34.5-/ICP47-/hGM-CSF
pA hGM-CSF CMV
ICP34.5 ICP34.5 ICP47
CMV hGM-CSF pA

Method of Administration • T-VEC administered into
cutaneous, SC, or nodal
lesions (+/- ultrasound
guidance)
• No injections of visceral
lesions permitted
• Limits on amount to be
injected per lesion by size
(see table)
• No specific limits on number
of lesions injected per visit
• Precedence to be given to
new lesions, then larger
lesions
56
Lesion size (diameter) T-VEC injection volume
> 5.0 cm 4.0 mL
> 2.5 cm to 5.0 cm 2.0 mL
> 1.5 cm to 2.5 cm 1.0 mL
> 0.5 cm to 1.5 cm 0.5 mL
0.5 cm 0.1 mL
This total dose administered in any one treatment session should not exceed 4.0 mL

57
Secondary Endpoint: Time to Treatment Failure
Time to treatment failure was defined as time from the first dose of study treatment until death or development of clinically significant progressive disease (PD)
per investigator for which no objective response was subsequently achieved
Patients who withdrew prior to development of clinically significant PD were censored at the time of the last assessment
| ||
|| ||| ||
||
|
|||||| |||
|||
| |
| | || |||
|||| |
||||||| ||| ||||||||||
||||| ||||| || | | | |
|||||
| | ||||||| | | | | | || || ||| | |||| |||| || |||| | || | | ||||||||||||||||||| || |||||||||||||||||
||||| || ||| | |
Tim
e t
o T
reatm
en
t F
ailu
re (
%)
0%
10%
20%
30%
40%
50%
60%
70%
80%
90%
100%
GM-CSF
T-VEC
2.9 (2.8, 4.0) months 8.2 (6.5, 9.9) months
Log Rank: P < 0.0001*
Hazard Ratio: 0.42 (0.32,
0.54)
Study Month
0 5 10 15 20
141
295
29
175
16
96
2
57
0
0
Median (95% CI)
GM-CSF (N = 141) T-VEC (N = 295)
*P-value is descriptive only
Risk set, n

||||
|
|| || | | ||||||| || || |||||| | || || | |||
|| | |||
| || || | | |
||
|
| ||||| |||||||||||||||||||||||| |||| |||||| ||||||||||||||||||||||||| | |||||||||||||||||||||||||| |||||| | | |||||| ||||| |||||||||| || ||||| | ||
Overa
ll S
urv
iva
l (%
)
0%
10%
20%
30%
40%
50%
60%
70%
80%
90%
100%
Study Month
0 5 10 15 20 25 30 35 40
GM-CSF
T-VEC
141
295
125
269
101
229
84
186
63
154
42
105
25
62
12
31
3
10
Log Rank: P = 0.07*
HR: 0.79 (0.61, 1.02)
45
0
0
19.0 (16.0, 24.0) months
23.3 (19.4, 29.7) months
Median (95% CI)
GM-CSF (N = 141)
T-VEC (N = 295)
*P-value is descriptive only
Interim Overall Survival
• Interim OS data represent >85%
(250 of 290) of the required events for
the primary analysis of OS
• 290 events required to demonstrate a
OS HR of 0.67 with 90% power
Survival T-VEC GM-CSF Difference
% (95% CI)
12-month 73.7% 69.4% 4.3 (-4.9, 13.5)
24-month 49.6% 41.3% 8.3 (-1.9, 18.5)
36-month 40.6% 27.8% 12.8 (1.0, 24.6)
58
Risk set, n

IMMUNOTHERAPY to SWEEPS THE FIELD:
`first line for all? Except rapid BRAF+ rapid progressors (25%) : BUY TIME
Anti-PD1
Anti-PD-1 + anti-CTLA4
Anti-PD1 + Targeted agents / or sequential?
TARGETED THERAPIES
BRAFinh + MEKinh (+ ERKinh ??)
Combo + immuno? / sequential
Vemurafenib + Ipilimumab Failure (NEJM 2013)
NEW TARGETS PI3Kinhibitors?
MDM4? / p53? / MIA? etc
ENDLESS COMBINATION POSSIBILITIES
STAGE IV Melanoma

Clinic
Caroline Robert
Christina Mateus
Emilie Routier
Laurent Maksimovic
Kristina Opletalova
Gwendoline Sebille
Robert Baran
Gilles Degois
Bertrand Bachollet
Beatrix Reynaud
Florence Weil
Richard Encaoua
Gorana Tomasic
Andrea Cavalcanti
Frederic Kolb
Benjamin Serfati
Gustave Roussy Melanoma Group
Clinical Research
Imane Hamoum
Severine Roy
Saliou Camara
Karine Waille
Aliosha Celibic
Gloria Le Brat
Bruno Thuillier
Paquita Lannes
Laury Cherot
Flore Dupuy
Elodie Jezequel
Emilie Lanoy
Janine Wechsler
Frederika Perrier
Translational Research
Stephan Vagner
Lise Boussemart
Nyam Kamsu Kom
Helene Mahieu-Malka
Isabelle Girault
Aïcha Goubar
Ludovic Lacroix
Sandrine Agoussi
Laurence Zitvogel
Salem Chouaib
Brigitte Bressac
Christian Auclair
Alexander Eggermont

61 COME VISIT GUSTAVE ROUSSY CANCER CENTER
THANK YOU