meitu, inc.6 meanwhile, meitugenius (also known as meitu magic mirror), a virtual makeup solution...
TRANSCRIPT
1
Hong Kong Exchanges and Clearing Limited and The Stock Exchange of Hong Kong Limited take no responsibility for the contents of this announcement, make no representation as to its accuracy or completeness and expressly disclaim any liability whatsoever for any loss howsoever arising from or in reliance upon the whole or any part of the contents of this announcement.
Meitu, Inc.美圖公司
(Incorporated in the Cayman Islands with limited liability and carrying on business in Hong Kong as “ 美圖之家 ”)
(Stock Code: 1357)
ANNUAL RESULTS ANNOUNCEMENT FOR THE YEAR ENDED DECEMBER 31, 2018
The board of directors (the “Board”) of Meitu, Inc. (the “Company”) is pleased to announce the audited consolidated results of the Company, its subsidiaries and Xiamen Meitu Networks Technology Co., Ltd. (“Meitu Networks”) and its subsidiaries (collectively, the “Group”) for the year ended December 31, 2018.
In this announcement, “we”, “us”, and “our” refer to the Company (as defined above) and where the context otherwise requires, the Group (as defined above).
KEY HIGHLIGHTS
• The Meitu app’s MAU reached a historic high of 119.2 million in February 2019.
• Our social strategy achieved great progress. In December 2018, approximately 51% of the Meitu app’s MAU were social users, i.e. users who were active on the Meitu social platform; its photo and video content achieved approximately 8 billion page views for the month.
• The percentage of social users logged in with Meitu Accounts (“MTid”) increased from around 17% when it was launched in late September 2018 to approximately 50% in February 2019.
• Revenues from Internet business* grew by 26.3% year on year to RMB947.7 million, of which online advertising accounted for RMB620.9 million (a significant increase by 101.9% year on year).
• Adjusted Net Loss* was RMB879.1 million in 2018. We have restructured our unprofitable and asset-heavy businesses, namely e-commerce and smartphone, through strategic partnerships in order to free up resources to invest in our “Beauty and Social Media” strategy.
* Financial metrics are presented to exclude discontinued operation.

2
KEY FINANCIAL DATA
Year ended December 31, Year on year change2018 2017
RMB’000 RMB’000 (%)(Restated)(1)
Revenue 2,791,459 4,490,376 -37.8%— Internet Business 947,671 750,310 26.3%— Smart Hardware 1,843,788 3,740,066 -50.7%Gross Profit 429,325 1,069,121 -59.8%— Internet Business 492,130 209,628 134.8%— Smart Hardware (62,805) 859,493 N/AGross Margin 15.4% 23.8% -8.4p.p.— Internet Business 51.9% 27.9% +24.0p.p.— Smart Hardware -3.4% 23.0% N/AAdjusted Net (Loss)/Profit from Continuing Operations(2) (879,089) 66,080 N/A
Note:
(1) The financial data is presented as excluding discontinued operation.
(2) For details of Adjusted Net Loss from Continuing Operations, please refer to the section headed “Management Discussion and Analysis — Loss from Continuing Operations and Non-IFRS Measure: Adjusted Net Profit/(Loss) from Continuing Operations”.
KEY OPERATIONAL DATA
As of December 31, Year on year change2018 2017
’000 ’000 (%)(Restated)
MAU 332,214 414,866 -19.9%
MAU1 breakdown by product:Meitu 117,444 117,100 0.3%BeautyCam 79,137 96,724 -18.2%Meipai2 38,943 98,139 -60.3%Others 96,690 102,903 -6.0%
MAU breakdown by geography:Mainland China 224,757 302,996 -25.8%Overseas 107,457 111,870 -3.9%
Notes:
(1) MAU of apps other than Meipai include in-app users only and restated as without the data of MeituBeauty.
(2) As of December 31, 2018, the MAU of Meipai included in-app users of 13.0 million (as of December 31, 2017: 29.5 million) and mobile web users (include users from WeChat mini program of Meipai) of 25.9 million (as of December 31, 2017: 68.6 million). Some users from the WeChat mini program of Meipai may be recorded twice if they access both Meipai app and WeChat mini program of Meipai.

3
BUSINESS REVIEW AND OUTLOOK
Company strategic highlights
During 2018, we announced our new strategy of “Beauty and Social Media”. The transformation of our Meitu app from a photo-editing tool into a social media platform is the centerpiece of this strategy. We are pleased to report that the transformation has been very promising since its launch in late September 2018. Only three months later, the photo and video content on our Meitu social platform achieved a total of approximately 8 billion page views in December 2018, demonstrating some early success in social transformation, as well as its potential in driving advertising revenue. In addition, the percentage of social users logged in with an MTid has increased to approximately 50% in February 2019, from around 17% when the social platform was first launched. With this strong foundation, we will be creating a decentralized social platform with recommendation algorithms that accurately match content with users.
Business Review
In order to focus our resources and efforts on our social transformation, we have streamlined our business through strategic cooperation with partners with deep expertise and competitive advantages in their respective fields. In particular, we have licensed our Meitu brand to Xiaomi Corporation (HKEX: 1810) (“Xiaomi”) to launch our future lines of Meitu Smartphones, as well as licensed our MeituBeauty brand to Yichun Trytry Information and Technology Co., Ltd. (“TryTry”), an associate of Secoo Holding Limited (NASDAQ: SECO), to operate our e-commerce platform. As a result of these strategic cooperations, we have become an asset-light, Internet-focused company with less potential fluctuation in cash-flow.
With the aforementioned changes to our business, advertising will become an increasingly important profit driver going forward. In 2018, our total advertising revenue was RMB620.9 million, an increase of 101.9% year over year. Although display advertisement driven by salespeople accounted for the majority of advertising revenue in 2018, we have further developed and fine-tuned our programmatic advertising products such as the private marketplace platform and data management platform. As the Meitu social media platform continues to mature and generate feed advertising inventories, we plan to leverage these programmatic products to create a scalable advertising business going forward.
In terms of profits, 2018 was a challenging year with a RMB1.2 billion net loss; however, approximately RMB0.5 billion and RMB0.2 billion of this was contributed by the smartphone and e-commerce businesses, respectively, which we expect to completely wind down by mid-2019. In addition, in association with these structural changes, our total number of employees has reduced by approximately 30% as of December 31, 2018 as compared to June 30, 2018.

4
Management Discussion and Analysis
Year ended December 31, 2018 compared to year ended December 31, 2017
Year ended December 31,2018 2017
RMB’000 RMB’000(Restated)
Continuing operationsRevenue 2,791,459 4,490,376 Cost of sales (2,362,134) (3,421,255)
Gross profit 429,325 1,069,121 Selling and marketing expenses (1,020,801) (559,197)Administrative expenses (285,721) (210,451)Research and development expenses (699,232) (415,803)Other income 40,711 49,364 Other gains/(losses), net 483,365 (47,248)
Operating loss (1,052,353) (114,214)
Finance income, net 39,656 99,664 Shares of (losses)/profits of investments accounted for using the equity method (3,382) 16
Loss before income tax (1,016,079) (14,534)Income tax expense (27,234) (63,568)
Loss from continuing operations (1,043,313) (78,102)
Loss from discontinued operation (attributable to equity holders of the Company) (199,753) (119,222)
(Loss)/profit attributable to:— Owners of the Company (1,254,537) (197,324)— Non-controlling interests 11,471 —
(1,243,066) (197,324)
Non-IFRS measure:Adjusted Net (Loss)/Profit from continuing operations (879,089) 66,080

5
Revenue
Our total revenue decreased by 37.8% to RMB2,791.5 million for the year ended December 31, 2018, compared to RMB4,490.4 million for the year ended December 31, 2017. Total revenue decline was primarily attributable to the slower smartphone business, partly offset by the robust growth from the Internet business which grew by 26.3%. This also reflected our transformation into a business model that relies more on Internet services, whose revenue contribution increased to 33.9% from 16.7%.
Year ended December 31,2018 2017
Amount RMB’000
% of total revenue
Amount RMB’000
% of total revenue
(Restated)
Internet business 947,671 33.9% 750,310 16.7%Smart hardware 1,843,788 66.1% 3,740,066 83.3%
Total 2,791,459 100.0% 4,490,376 100.0%
Internet business
The breakdown of segment revenue of Internet business is as follows:
Year ended December 31, Year on year change2018 2017
RMB’000 RMB’000 (%)(Restated)
Online advertising 620,892 307,481 101.9%Internet value-added services and others 326,779 442,829 -26.2%
Total 947,671 750,310 26.3%
Online advertising
Revenue from online advertising increased by 101.9% year on year to RMB620.9 million for the year ended December 31, 2018. This highlights the significant progress made in our endeavor to monetize our massive user base. The significant growth was driven by both brand advertising and programmatic advertising. For brand advertising, we have achieved growth in both the number of advertisers as well as the spending per advertiser during the year.

6
Meanwhile, MEITUGENIUS (also known as Meitu Magic Mirror), a virtual makeup solution provider, has launched in some retail stores. The device helps integrate real-time data on consumers’ preference from individual location and create more accurate product recommendation for the merchants. It is representative of our online to offline new sales strategy and will bring more innovative possibilities for beauty brands and retailers.
All these efforts resulted in encouraging growth in the past year. We are continuing to build new experiences within our Meitu social platform on the Meitu app, which will further enhance user activities and enrich the advertising inventories. We aim to further grow our advertising revenue by bringing in more quality advertisers and launching new formats such as search ads or interactive ads.
Internet value-added services and others
Revenue from Internet value-added services and others decreased by 26.2% year on year to RMB326.8 million for the year ended December 31, 2018. Our Internet value-added services and others business mainly comprises sales from virtual items on Meipai’s livestreaming. Meipai livestreaming revenue recorded a decline in the year 2018, primarily attributable to a decrease in the number of paying users resulting from the temporary app suspension to abide by local regulation. The number of average monthly paying users decreased to 137,393 for the year ended December 31, 2018, compared to 313,571 for the year ended December 31, 2017. The average revenue per paying user for 2018 continued to increase by 37.8% year on year, as the retained users tend to be more loyal and willing to pay.
Smart hardware
Revenue from the smart hardware segment decreased by 50.7% to RMB1,843.8 million for 2018 from RMB3,740.1 million for 2017, primarily due to a decrease in sales volume of smartphones, partially offset by higher average selling price (“ASP”). During the year ended December 31, 2018, we launched only one new model, Meitu T9, while in the year of 2017, we launched three new models. As a result, the number of smartphone units sold was 721,713 for the year ended December 31, 2018, as compared to 1,574,737 for the year ended December 31, 2017. ASP was RMB2,519 for the year ended December 31, 2018, as compared to RMB2,365 for the year ended December 31, 2017. Improving product mix is a key factor that drove ASP increase. The Meitu T series we introduced in 2018 is a premium model that carried higher suggested retail prices compared to that of M series launched in 2017.
China’s smartphone market was challenging in 2018 with shipments down by 15.5% year on year, and is likely to continue to decline this year, according to the China Academy of Information and Communications Technology. With the challenging market conditions and intensified competition ahead, we reevaluated our strategy and decided that working with a partner with a scalable smartphone business can better achieve our goal to accelerate user growth of the Meitu Smartphone. Accordingly, we entered in a strategic partnership with Xiaomi, in which Xiaomi will be responsible for design, research and development, production and marketing of all future Meitu branded smartphones (other than the Meitu V7) for a maximum of approximately 30 years, while we remain committed to developing next-generation image technology and algorithms. We believe this cooperation is in the best interest of the Group to grow its smartphone user base by leveraging the reach and scale of Xiaomi.

7
The ASP of a smartphone is calculated by dividing the total revenue from smartphone sales by the number of units sold during the period. The ASP does not include applicable value-added taxes.
Cost of Sales
Our cost of sales decreased by 31.0% to RMB2,362.1 million for the year ended December 31, 2018, compared to RMB3,421.3 million for year ended December 31, 2017, which is largely in line with our revenue trend.
Internet business
Segment cost for Internet business decreased by 15.7% to RMB455.5 million in 2018, from RMB540.7 million in 2017, primarily due to: (i) a decrease in revenue-sharing with content creators on the virtual gifts sales, which is in line with Meipai living stream revenue; (ii) a decrease in bandwidth and storage related costs which are primarily correlated to the size and engagement level of our user base; and (iii) an increase in the costs of content monitoring which is used to make sure the user-generated submissions on the platform are appropriate.
Smart hardware
Segment cost for smart hardware decreased by 33.8% to RMB1,906.6 million in 2018, compared to RMB2,880.6 million in 2017, primarily due to the decrease in the number of smartphone units sold. The average cost per smartphone, calculated by dividing the total material cost of smartphone components by the number of units sold during the year, increased to RMB1,909 in 2018 from RMB1,743 in 2017. The increase was mainly due to the introduction of the more premium priced model Meitu T9, which used higher-priced key components as compared to the phone models launched in 2017.
Gross Profit and Gross Profit Margin
Our gross profit decreased by 59.8% to RMB429.3 million in 2018, from RMB1,069.1 million in 2017. Our overall gross profit margin decreased to 15.4% in 2018, from 23.8% in 2017.
Year ended December 31,2018 2017
Amount RMB’000
Grossmargin %
Amount RMB’000
Grossmargin %
(Restated)
Internet business 492,130 51.9% 209,628 27.9%Smart hardware (62,805) -3.4% 859,493 23.0%
Total 429,325 15.4% 1,069,121 23.8%

8
Internet business
Our Internet business segment generated a gross profit of RMB492.1 million in 2018, compared to a gross profit of RMB209.6 million in 2017.
Gross profit margin was 51.9% for the year ended December 31, 2018, compared to a gross profit margin of 27.9% for the year ended December 31, 2017. The fast increase of gross profit margin was mainly driven by the rapid growth of our advertising business, which carried a substantially higher margin and made up a higher proportion in the Internet business for 2018.
Smart hardware
Our smart hardware segment recorded a gross loss of RMB62.8 million with the negative margin of 3.4% in 2018, compared to a gross profit of RMB859.5 million with the positive margin of 23.0% in 2017, primarily due to: (i) the operating deleverage of smartphone business, as lower volume of smartphone led to smaller revenue but fixed costs such as staff salaries were still incurred regardless of sales volume; and (ii) approximately RMB377.0 million of inventory impairment due to the restructuring of this business.
Research and Development Expenses
Our research and development expenses increased by 68.2% to RMB699.2 million in 2018, from RMB415.8 million in 2017, primarily due to an increase in personnel related expenses which include share-based compensation, partly attributable to the termination costs associated with the restructuring.
Selling and Marketing Expenses
Selling and marketing expenses increased by 82.5% to RMB1,020.8 million in 2018, from RMB559.2 million in 2017, primarily due to: (i) an increase in personnel related expenses which included share-based compensation, partly attributable to the termination costs associated with the restructuring; and (ii) an increase in marketing and promotional expenses that were mainly used for the brand promotion of Meipai and smartphone business, including a one-off sponsorship expense of certain reality-shows of approximately RMB200 million.
Administrative Expenses
Our administrative expenses increased by 35.8% to RMB285.7 million in 2018, from RMB210.5 million in 2017, primarily due to an increase in personnel related expenses, which included share-based compensation.
Other Income
Other income decreased by 17.5% to RMB40.7 million for the year ended December 31, 2018, from RMB49.4 million for the year ended December 31, 2017, with the main contributing factor being a reclassification of investment income on short-term investments to other gains/(losses), net, due to the adoption of new accounting policy of IFRS 9.

9
Other Gains/(Losses), Net
Other gains, net in 2018 increased to RMB483.4 million, from a net loss of RMB47.2 million in 2017, primarily due to: (i) the recognition of fair value gains of RMB85.2 million on several early-stage investments; (ii) the net gains on disposal of long-term investments of RMB353.1 million; (iii) the remeasurement gains on investment in an associate of RMB30.7 million; and (iv) the reclassification of investment income on short-term investments from other income due to the adoption of new accounting policy of IFRS 9.
Finance Income, Net
Our finance income, net mainly comprised of bank interest income and foreign exchange losses. We had a net finance income of RMB39.7 million in 2018, compared to a net finance income of RMB99.7 million in 2017, mainly due to a foreign exchange loss of RMB32.4 million in 2018, compared to a foreign exchange gain of RMB15.9 million in 2017.
Income Tax Expense
Income tax expenses for the year ended December 31, 2018 were RMB27.2 million, compared to RMB63.6 million for the year ended December 31, 2017. Although the Group was loss-making on a consolidated level for the year ended December 31, 2018, some of our entities generated positive net profits and therefore incurred some income tax expenses.
Loss from Continuing Operations and Non-IFRS Measure: Adjusted Net Profit/(Loss) from Continuing Operations
Our loss from continuing operations for the year ended December 31, 2018 increased significantly to RMB1,043.3 million, compared to RMB78.1 million in 2017, attributable to the loss-making smartphone business and non-recurring restructuring costs, partly offset by investment gains.
To supplement our consolidated financial statements which are presented in accordance with the IFRSs, we also use Adjusted Net Profit/(Loss) as an additional financial measure, which is not required by, or presented in accordance with, IFRSs. We believe that this non-IFRS measure facilitates comparisons of operating performance from period to period and company to company by eliminating potential impacts of items that our management do not consider to be indicative of our operating performance. We believe that this measure provides useful information to investors and others in understanding and evaluating our consolidated results of operations in the same manner as they help our management. However, our presentation of the Adjusted Net Profit/(Loss) may not be comparable to a similarly titled measure presented by other companies. The use of this non-IFRS measure has limitations as an analytical tool, and you should not consider it in isolation from, or as substitute for analysis of, our results of operations or financial condition as reported under IFRSs.

10
Our Adjusted Net Loss from continuing operations was RMB879.1 million for the year ended December 31, 2018, compared to Adjusted Net Profit of RMB66.1 million for the year ended December 31, 2017. This change was attributed to: (i) the decrease in the smart hardware segment profit, which accounted for the bulk of the Group’s incremental net loss in the second half of 2018, as we sold fewer phone models in 2018 and fierce competition put pressure on both pricing and margin; and (ii) the increase in sales and marketing expense including the expense related to a one-off sponsorship of reality show that amounted to approximately RMB200 million. Along with our cooperation with Xiaomi, we are shifting to an asset-light model for the smartphone business and do not expect the majority of loss to have a lingering effect. Going forward, the Group will focus more on tapping the potential of our user base and Meitu social platform, with higher-margin businesses such as advertising which is likely to be the key profit driver.
The following table reconciles our Adjusted Net Loss from continuing operations for the years ended December 31, 2018 and 2017 to the most directly comparable financial measure calculated and presented in accordance with IFRSs, which is loss from continuing operations for the year:
Year ended December 31,2018 2017
RMB’000 RMB’000(Restated)
Loss from continuing operations for the year (1,043,313) (78,102)
Excluding:Share based compensation 136,714 103,903Changes in fair value of long-term investments (85,174) 72,053Gains on disposal of long-term investments (353,142) (31,774)Remeasurement gains on investment in an associate (30,739) —Amortisation of intangible assets and other expenses related to acquisition(1) 11,743 —Losses/expenses related to business strategy restructuring(2) 484,822 —
Adjusted Net (Loss)/Profit from continuing operations for the year (879,089) 66,080
Note:
(1) Amortisation of intangible assets and other expenses related to acquisition are presented as net of related deferred tax.
(2) Losses/expenses related to business strategy restructuring mainly include: (i) an impairment provision related to our inventories of smartphones; and (ii) the non-recurring termination costs due to strategy reorganization and restructuring.
11
Discontinued Operation
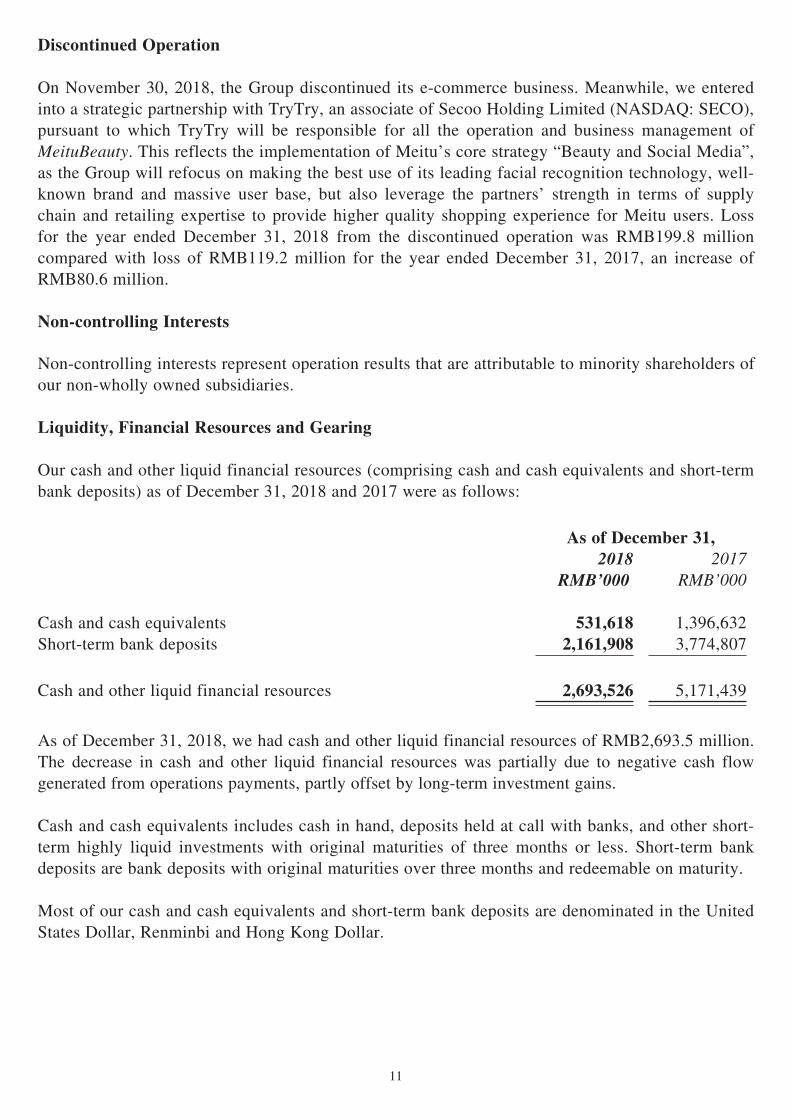
On November 30, 2018, the Group discontinued its e-commerce business. Meanwhile, we entered into a strategic partnership with TryTry, an associate of Secoo Holding Limited (NASDAQ: SECO), pursuant to which TryTry will be responsible for all the operation and business management of MeituBeauty. This reflects the implementation of Meitu’s core strategy “Beauty and Social Media”, as the Group will refocus on making the best use of its leading facial recognition technology, well-known brand and massive user base, but also leverage the partners’ strength in terms of supply chain and retailing expertise to provide higher quality shopping experience for Meitu users. Loss for the year ended December 31, 2018 from the discontinued operation was RMB199.8 million compared with loss of RMB119.2 million for the year ended December 31, 2017, an increase of RMB80.6 million.
Non-controlling Interests
Non-controlling interests represent operation results that are attributable to minority shareholders of our non-wholly owned subsidiaries.
Liquidity, Financial Resources and Gearing
Our cash and other liquid financial resources (comprising cash and cash equivalents and short-term bank deposits) as of December 31, 2018 and 2017 were as follows:
As of December 31,2018 2017
RMB’000 RMB’000
Cash and cash equivalents 531,618 1,396,632Short-term bank deposits 2,161,908 3,774,807
Cash and other liquid financial resources 2,693,526 5,171,439
As of December 31, 2018, we had cash and other liquid financial resources of RMB2,693.5 million. The decrease in cash and other liquid financial resources was partially due to negative cash flow generated from operations payments, partly offset by long-term investment gains.
Cash and cash equivalents includes cash in hand, deposits held at call with banks, and other short-term highly liquid investments with original maturities of three months or less. Short-term bank deposits are bank deposits with original maturities over three months and redeemable on maturity.
Most of our cash and cash equivalents and short-term bank deposits are denominated in the United States Dollar, Renminbi and Hong Kong Dollar.

12
Treasury Policy
We have adopted a prudent financial management approach towards our treasury policies and thus maintained a healthy liquidity position throughout the year ended December 31, 2018. To manage the liquidity risk, the Board closely monitors the Group’s liquidity position to ensure that the liquidity structure of the Group’s assets, liabilities and other commitments can meet its funding requirements from time to time.
Capital Expenditure
Year ended December 31,2018 2017
RMB’000 RMB’000
Purchase of property and equipment 143,913 52,407Purchase of intangible assets 16,321 2,386
Total 160,234 54,793
Our capital expenditures primarily included expenditures for purchases of property and equipment such as servers and computers and intangible assets such as domain names and computer software.
Long-term Investment Activities
Year ended December 31,2018 2017
RMB’000 RMB’000
Investment in associates in the form of ordinary shares 8,771 23,940Investment in financial assets at fair value through profit or loss 384,148 34,573Financial assets at fair value through other comprehensive income 433 —Investment in available-for-sale financial assets — 6,534
Total 393,352 65,047
We have made minority investments in companies that we believe have technologies or businesses that complement and benefit our business. None of these individual investments is regarded as material. Some of the investments we made were early-stage companies that do not generate meaningful revenue and profits. It is therefore difficult to determine the success of these investments in such an early stage, and while successful investments could generate substantial returns, unsuccessful ones may need to be impaired.

13
Foreign Exchange Risk
Our Group’s subsidiaries primarily operate in the PRC and are exposed to foreign exchange risk arising from foreign currency transactions, primarily with respect to United States Dollar. Therefore, foreign exchange risk primarily arose from recognized assets and liabilities in our Group’s PRC subsidiaries when receiving or to receive foreign currencies from, or paying or to pay foreign currencies to overseas business partners. We did not hedge against any fluctuation in foreign currency during the years ended December 31, 2018 and 2017.
Pledge of Assets
As of December 31, 2018, we pledged a restricted deposit of RMB1,000,000 (2017: RMB1,000,000) to guarantee payment of certain operating expenses.
Contingent Liabilities
As of December 31, 2018, we did not have any material contingent liabilities (2017: nil).
Borrowings and Gearing Ratio
As of December 31, 2018, we had bank borrowings of RMB10.0 million (as of December 31, 2017: nil). As of December 31, 2018, the gearing ratio of the Group was approximately 0.3% (as of December 31, 2017: nil). The gearing ratio is calculated as the total borrowings divided by the total equity on the respective reporting date. For this purpose, total debt is defined as bank loan as shown in the consolidated balance sheet. The Group’s gearing ratio remained at a relatively low level as the Group did not place material reliance on borrowings to finance the Group’s operation.
Employee and Remuneration Policy
The Group had a total of 2,080 full-time employees as of December 31, 2018 (2017: 2,066), a majority of whom were based in various cities in China, including Xiamen (headquarters), Beijing, Shenzhen, Hangzhou and Shanghai. Remuneration is determined with reference to market conditions and individual employees’ performance, qualifications and experience.
In line with the performance of the Group and individual employees, a competitive remuneration package is offered to retain employees, including salaries, discretionary bonuses and contributions to benefit plans (including pensions). Employees of the Group are the eligible participants of the Pre-IPO Employees Share Option Plan, Post-IPO Share Option Scheme, and Post-IPO Share Award Scheme. During the year under review, the relationship between the Group and our employees has been stable. We did not experience any strikes or other labor disputes which materially affected our business activities.
Significant Investments Held
As of December 31, 2018, we did not hold any significant investments in the equity interests of any other companies.

14
Future Plans for Material Investments and Capital Assets
The Group will continue to explore potential strategic investment opportunities with the aim of creating synergies for the Group in relation to aspects such as technological development, product research and development, product portfolio, channel expansion and/or cost control. Appropriate disclosures will be made by the Company as required under the Rule Governing the Listing of Securities on The Stock Exchange of Hong Kong Limited (the “Listing Rules”).
Save as disclosed in this annual results announcement, the Group did not have any other plans for material investments and capital assets as of December 31, 2018.
Material Acquisition and Disposal of Subsidiaries and Affiliated Companies
During the year ended December 31, 2018, the Group did not have any material acquisitions or disposals of subsidiaries and affiliated companies.
Important Events after the Reporting Date
On February 19, 2019, the Group announced the acquisition (the “Acquisition”) of 31% equity interests in Dreamscape Horizon Limited (“Dreamscape”), an indirect wholly-owned subsidiary of Leyou Technologies Holdings Limited (HKEX: 1089) (“Leyou”). Dreamscape and its subsidiaries are principally engaged in the development and publishing of online multiplayer video games for both PC and console platforms. The total consideration of approximately HK$2,686,577,000 will be satisfied by the allotment and issue of the shares (“Consideration Share(s)”) by the Company to Leyou under a specific mandate to be obtained from the shareholders of the Company at the issue price of HK$2.71 per Consideration Share. The Consideration Shares will, upon issue, represent: (i) approximately 23.58% of the issued share capital of the Company as of February 19, 2019; and (ii) approximately 19.08% of the issued share capital of the Company as enlarged by the allotment and issue of the Consideration Shares, subject to completion of the Acquisition and assuming that there will be no change in the issued share capital of the Company save for the allotment and issue of the Consideration Shares. The Acquisition has not been completed as at the date of this annual results announcement.
Save as disclosed above, there were no important events affecting the Group which occurred after December 31, 2018 and up to the date of this annual results announcement.
15
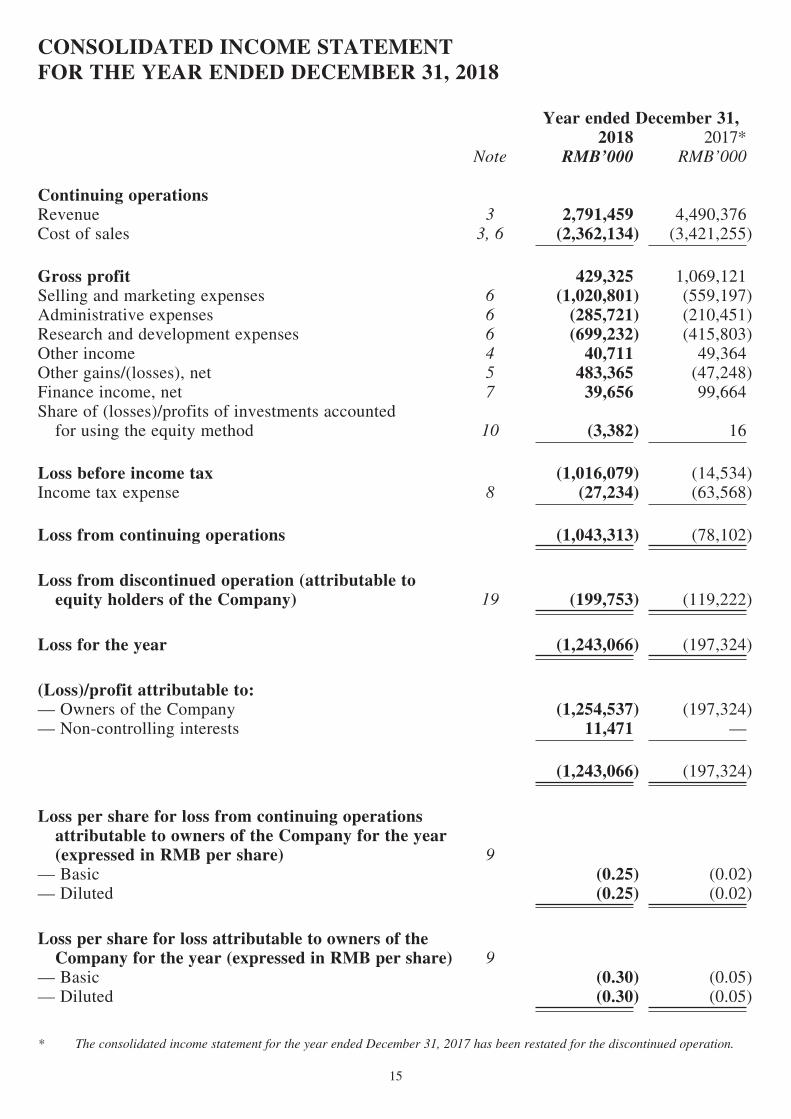
CONSOLIDATED INCOME STATEMENT FOR THE YEAR ENDED DECEMBER 31, 2018
Year ended December 31,
Note2018 2017*
RMB’000 RMB’000
Continuing operationsRevenue 3 2,791,459 4,490,376Cost of sales 3, 6 (2,362,134) (3,421,255)
Gross profit 429,325 1,069,121Selling and marketing expenses 6 (1,020,801) (559,197)Administrative expenses 6 (285,721) (210,451)Research and development expenses 6 (699,232) (415,803)Other income 4 40,711 49,364Other gains/(losses), net 5 483,365 (47,248)Finance income, net 7 39,656 99,664Share of (losses)/profits of investments accounted for using the equity method 10 (3,382) 16
Loss before income tax (1,016,079) (14,534)Income tax expense 8 (27,234) (63,568)
Loss from continuing operations (1,043,313) (78,102)
Loss from discontinued operation (attributable to equity holders of the Company) 19 (199,753) (119,222)
Loss for the year (1,243,066) (197,324)
(Loss)/profit attributable to:— Owners of the Company (1,254,537) (197,324)— Non-controlling interests 11,471 —
(1,243,066) (197,324)
Loss per share for loss from continuing operations attributable to owners of the Company for the year (expressed in RMB per share) 9— Basic (0.25) (0.02)— Diluted (0.25) (0.02)
Loss per share for loss attributable to owners of the Company for the year (expressed in RMB per share) 9— Basic (0.30) (0.05)— Diluted (0.30) (0.05)
* The consolidated income statement for the year ended December 31, 2017 has been restated for the discontinued operation.
16
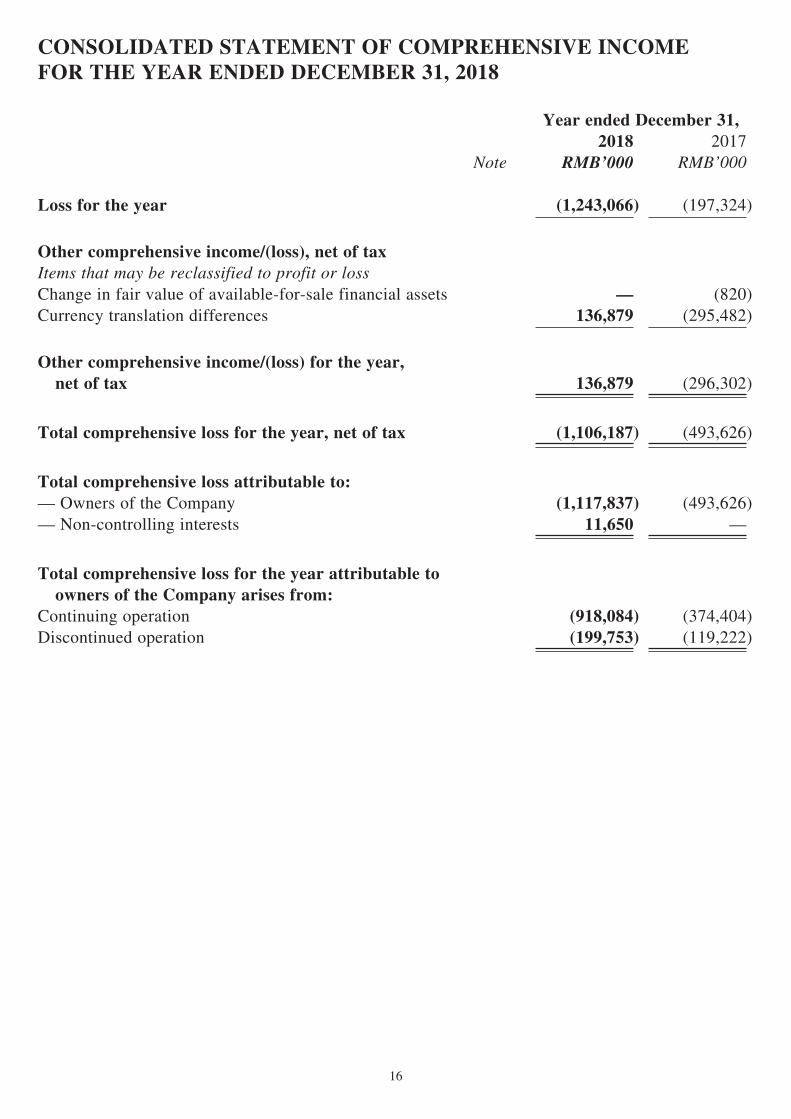
CONSOLIDATED STATEMENT OF COMPREHENSIVE INCOMEFOR THE YEAR ENDED DECEMBER 31, 2018
Year ended December 31,
Note2018 2017
RMB’000 RMB’000
Loss for the year (1,243,066) (197,324)
Other comprehensive income/(loss), net of taxItems that may be reclassified to profit or lossChange in fair value of available-for-sale financial assets — (820)Currency translation differences 136,879 (295,482)
Other comprehensive income/(loss) for the year, net of tax 136,879 (296,302)
Total comprehensive loss for the year, net of tax (1,106,187) (493,626)
Total comprehensive loss attributable to:— Owners of the Company (1,117,837) (493,626)— Non-controlling interests 11,650 —
Total comprehensive loss for the year attributable to owners of the Company arises from:Continuing operation (918,084) (374,404)Discontinued operation (199,753) (119,222)

17
CONSOLIDATED BALANCE SHEETFOR THE YEAR ENDED DECEMBER 31, 2018
As of December 31,
Note2018 2017
RMB’000 RMB’000ASSETSNon-current assetsProperty and equipment 153,061 91,898Intangible assets 203,305 21,298Long-term investments— Investments in associates in the form of ordinary shares 10 16,540 28,415— Financial assets at fair value through profit or loss 11 547,178 280,863— Financial assets at fair value through other comprehensive income 2.1(a), 12 7,296 —— Available-for-sale financial assets 2.1(a), 12 — 6,534Prepayments and other receivables 14,823 64,305Deferred tax assets 1,203 9,784
943,406 503,097
Current assetsInventories 359,439 658,416Trade receivables 13 521,817 307,388Prepayments and other receivables 569,784 160,182Short-term bank deposits 14 2,161,908 3,774,807Cash and cash equivalents 14 531,618 1,396,632Restricted cash 14 1,000 1,000
4,145,566 6,298,425
Total assets 5,088,972 6,801,522
EQUITY AND LIABILITIESEquity attributable to owners of the CompanyShare capital 15 274 280Share premium 15 7,040,940 7,679,137Reserves (168,766) (263,065)Accumulated losses (3,031,751) (1,774,312)
3,840,697 5,642,040Non-controlling interests 119,233 —
Total equity 3,959,930 5,642,040
LiabilitiesNon-current liabilitiesTrade and other payables 16 137,977 —Deferred tax liabilities 12,171 —
150,148 —
Current liabilitiesBorrowings 10,000 —Contract liabilities 2.1(a), 3 32,382 —Trade and other payables 16 885,418 1,119,560Income tax liabilities 51,094 39,922
978,894 1,159,482
Total liabilities 1,129,042 1,159,482
Total equity and liabilities 5,088,972 6,801,522

18
CONDENSED CONSOLIDATED STATEMENT OF CASH FLOWSFOR THE YEAR ENDED DECEMBER 31, 2018
Year ended December 31,
Note2018 2017
RMB’000 RMB’000
Net cash (used in)/generated from operating activities (1,996,957) 35,265
Net cash generated from/(used in) investing activities 1,802,159 (3,103,375)
Net cash used in financing activities (638,667) (31)
Net decrease in cash and cash equivalents (833,465) (3,068,141)
Cash and cash equivalents at the beginning of the year 1,396,632 4,508,522Effects of exchange rate changes on cash and cash equivalents (31,549) (43,749)
Cash and cash equivalents at the end of the year 531,618 1,396,632
Analysis of balances of cash and cash equivalents:Cash at bank and in hand 421,807 1,066,632Short-term bank deposits with initial terms within three months 109,811 330,000
531,618 1,396,632

19
NOTES TO THE CONSOLIDATED FINANCIAL INFORMATION
1 General information
Meitu, Inc. (the “Company”), was incorporated in the Cayman Islands under the name of “Meitu, Inc.美圖公司 ” on July 25, 2013 as an exempted company with limited liability under the Companies Law, Cap.22 (Law 3 of 1961, as consolidated and revised) of the Cayman Islands, and carries on a business in Hong Kong as “美圖之家 ” as approved by and registered with the Registrar of Companies in Hong Kong on October 28, 2016 and November 7, 2016 respectively. The address of the Company’s registered office is the offices of Conyers Trust Company (Cayman) Limited, Cricket Square, Hutchins Drive, PO Box 2681, Grand Cayman KY1-1111, Cayman Islands.
The Company is an investment holding company. The Company and its subsidiaries (together with Meitu Networks and its subsidiaries, the “Group”) are principally engaged in the provision of online advertising and other internet value added services (such as live streaming and e-commerce), development, manufacture and sales of smart hardware and related accessories in the People’s Republic of China (the “PRC”), Hong Kong and other countries and regions.
Mr. Cai Wensheng and Mr. Wu Zeyuan are the ultimate controlling shareholders of the Company as of the date of this report.
Certain of the Group’s business are subject to foreign investment restrictions. To comply with the relevant PRC laws, the wholly-owned subsidiary of the Company, Xiamen Home Meitu Technology Co., Ltd. (“Meitu Home”), has entered into the a series of contractual agreements with Meitu Networks and its equity holders, which enable Meitu Home and the Group to:
• govern the financial and operating policies of Meitu Networks;
• exercise equity holders’ voting rights of Meitu Networks;
• receive substantially all of the economic interest returns generated by Meitu Networks in consideration for the business support, technical and consulting services provided by Meitu Home;

20
• obtain an irrevocable and exclusive right with an initial period of 10 years to purchase all or part of the equity interests in Meitu Networks from the respective equity holders at a minimum purchase price permitted under PRC laws and regulations. Meitu Home may exercise such options at any time until it has acquired all equity interests of Meitu Networks. The right is automatically renewable upon expiry unless it is superseded by a new term confirmed by Meitu Home; and
• obtain a pledge over the entire equity interests of Meitu Networks from its respective equity holders as collateral security for all of Meitu Networks’ payments due to Meitu Home and to secure performance of Meitu Networks’ obligation under the Contractual Arrangements.
As a result of the Contractual Arrangements, the Group is able to effectively control over Meitu Networks and its subsidiaries, receives variable returns from its involvement with Meitu Networks and its subsidiaries, has the ability to affect those returns through its power over Meitu Networks and its subsidiaries and is considered to control Meitu Networks and its subsidiaries. Consequently, the Company regards Meitu Networks and its subsidiaries as the controlled entities and consolidates the financial position and results of operations of these entities in the consolidated financial statements of the Group.
Nevertheless, the Contractual Arrangements may not be as effective as direct legal ownership in providing the Group with direct control over the Meitu Networks and its subsidiaries and uncertainties presented by the PRC legal system could impede the Group’s beneficiary rights of the results, assets and liabilities of the Meitu Networks and its subsidiaries. The directors of the Company (“Directors”), based on the advice of its legal counsel, consider that the Contractual Arrangements among Meitu Home, Meitu Networks and its equity holders are in compliance with the relevant PRC laws and regulations and are legally binding and enforceable.
The Company’s shares have been listed on the Main Board of the Stock Exchange of Hong Kong Limited since December 15, 2016 by way of its initial public offering (“IPO”).
On November 19, 2018, the Company and Xiaomi Corporation (“Xiaomi”) entered into a strategic cooperation framework agreement (the “Strategic Cooperation Agreement”), in which Xiaomi undertakes to be responsible for design, research and development, production and marketing of all future Meitu branded smartphones (other than the model Meitu V7) for a maximum of approximately 30 years, while Meitu undertakes to develop the next-generation image technology and algorithm. Furthermore, the Group also discontinued its e-commerce business on November 30, 2018 in order to focus its resources in implementing the Group’s new strategy surrounding “Beauty and Social Media”. Accordingly, the e-commerce operations have been presented as discontinued operation in the financial statements of the Group.
These financial statements are presented in Renminbi (“RMB”), unless otherwise stated.

21
2 Summary of significant accounting policies
The principal accounting policies applied in the preparation of the consolidated financial statements are set out below. These policies have been consistently applied to all the years presented, unless otherwise stated.
2.1 Basis of preparation
The consolidated financial statements of the Group have been prepared in accordance with International Financial Reporting Standards (“IFRSs”). The consolidated financial statements have been prepared under the historical cost convention, as modified by the revaluation of financial assets at fair value through other comprehensive income and financial assets at fair value through profit or loss, which are carried at fair value.
The preparation of the consolidated financial statements in conformity with IFRSs requires the use of certain critical accounting estimates. It also requires management to exercise its judgment in the process of applying the Group’s accounting policies.
(a) New and amended standards adopted by the Group
A number of new or amended standards became applicable for the current reporting period and the Group had to change its accounting policies as a result of adopting the following standards:
• IFRS 9 Financial Instruments, and
• IFRS 15 Revenue from Contracts with Customers.
The impact of the adoption of these standards and the new accounting policies are disclosed as below.
Changes in accounting policies
(i) IFRS 9 Financial Instruments
IFRS 9 replaces IAS 39, Financial instruments: recognition and measurement. It sets out the requirements for recognizing and measuring financial assets, financial liabilities and some contracts to buy or sell non-financial items.

22
The adoption of IFRS 9 “Financial Instruments” from 1 January 2018 resulted in changes in accounting policies and adjustments to the amounts recognized in the financial statements. In accordance with the transitional provisions of IFRS 9, comparative figures have not been restated. The Group’s management has assessed which business models apply to the financial assets held by the Group and there had been no material impact on classification and measurement and impairment of financial assets except the reclassification of equity investments recognized as available-for-sale financial assets to financial assets at fair value through other comprehensive income amounting to RMB6,534,000 and the reclassification of short term investment placed with banks recognized as available-for-sale financial assets to financial assets at fair value through profit or loss (the balance as of January 1, 2018 is nil). Comparative information has not been restated and continues to be reported under IAS 39.
(ii) IFRS 15 Revenue from Contracts with Customers
IFRS 15 establishes a comprehensive framework for recognizing revenue and some costs from contracts with customers. IFRS 15 replaces IAS 18, Revenue, which covered revenue arising from sale of goods and rendering of services, and IAS 11, Construction contracts, which specified the accounting for construction contracts.
IFRS 15 also introduces additional qualitative and quantitative disclosure requirements which aim to enable users of the financial statements to understand the nature, amount, timing and uncertainty of revenue and cash flows arising from contracts with customers.
The Group has elected the modified retrospective approach for transition to the new revenue standard and has assessed that there had been no material impact on revenue recognition and presentation except the reclassification of advance from customers previously included in trade and other payables to contract liabilities, amounting to RMB196,254,000. Comparative information has not been restated and continues to be reported under IAS 11 and 18.
The other standards did not have any impact on the Group’s accounting policies and did not require retrospective adjustments.

23
(b) Impact of standards issued but not yet applied by the Group
Certain new accounting standards and interpretations have been published that are not mandatory for December 31, 2018 reporting periods and have not been early adopted by the Group as follows:
Effective for accounting periods beginning
on or after
Annual Improvements to IFRSs (Amendments)
Annual Improvements to IFRSs 2015–2017 Cycle January 1, 2019
IFRS 3 (Amendment) Definition of a Business January 1, 2020IFRS 9 (Amendment) Prepayment Features with
Negative Compensation January 1, 2019IFRS 16 Leases January 1, 2019IFRS 17 Insurance Contracts January 1, 2021IAS 19 (Amendment) Plan Amendment, Curtailment
or Settlement January 1, 2019IAS 28 (Amendment) Long-term Interests in Associates
and Joint Ventures January 1, 2019IFRIC 23 Uncertainty over Income Tax
Treatments January 1, 2019IFRS 10 and IAS 28 (Amendments)
Sale or Contribution of Assets Between an Investor and its Associate or Joint Venture To be determined
IAS 1 and IAS 8 (Amendments) Definition of Material January 1, 2020
The Group’s assessment of the impact of these new standards and interpretations is set out below.
(i) IFRS 16 Leases
IFRS 16 was issued in January 2016. It will result in almost all leases being recognized on the balance sheet by lessees, as the distinction between operating and finance leases is removed. Under the new standard, an asset (the right to use the leased item) and a financial liability to pay rentals are recognized. The only exceptions are short-term and low-value leases.
The Group had reviewed all of the Group’s leasing arrangements over the last year in light of the new lease accounting rules in IFRS 16 and concluded that the standard would affect primarily the accounting for the Group’s operating leases.
As of the reporting date, the Group had non-cancellable operating lease commitments of RMB76,938,000. Out of these commitments, approximately RMB79,112,000 would expect to recognized as right-of-use assets on January 1, 2019 and lease liabilities of RMB73,144,000 (after adjustments for prepayments and accrued lease payments recognized as of December 31, 2018) would also

24
be recognized. Overall net assets will be approximately RMB5,968,000 higher, and net current assets will be RMB39,556,000 lower due to the presentation of a portion of the liability as a current liability.
The Group expects that net profit after tax will decrease by approximately RMB1,027,000 for 2019 as a result of adopting the new rules. Operating cash flows will increase and financing cash flows will decrease by approximately RMB45,709,000 as repayment of the principal portion of the lease liabilities will be classified as cash flows from financing activities.
The Group’s activities as a lessor are not material and hence the Group does not expect any significant impact on the financial statements. However, some additional disclosures will be required from next year.
The Group will apply the standard from its mandatory adoption date of January 1, 2019. The Group intends to apply the simplified transition approach and will not restate comparative amounts for the year prior to first adoption. Right-of-use assets for property leases will be measured on transition as if the new rules had always been applied. All other right-of-use assets will be measured at the amount of the lease liability on adoption (adjusted for any prepaid or accrued lease expenses).
There are no other standards that are not yet effective and that would be expected to have a material impact on the entity in the current or future reporting periods and on foreseeable future transactions.
3 Revenue and segment information
The Group’s business activities, for which discrete financial statements are available, are regularly reviewed and evaluated by the chief operating decision-maker (“CODM”). The CODM, who is responsible for allocating resources and assessing performance of the operating segments, has been identified as the executive directors of the Company that make strategic decisions. As a result of this evaluation, the Group determined that it has operating segments as follows:
— Internet Business
— Smart Hardware
The CODM assesses the performance of the operating segments mainly based on segment revenue and gross profit of each operating segment. The selling and marketing expenses, administrative expenses and research and development expenses are not included in the measure of the segments’ performance which is used by CODM as a basis for the purpose of resource allocation and assessment of segment performance. Other income, other gains/(losses), net, finance income, net, share of (losses)/profits of investments accounted for using the equity method, and income tax expense are also not allocated to individual operating segments.

25
The revenues from external customers reported to CODM are measured as segment revenue, which is the revenue derived from the customers in each segment. Cost of sales primarily comprises cost of inventories consumed, employee benefit expenses, provision for inventory impairment, revenue sharing fee, bandwidth and storage related costs, and others.
Other information, together with the segment information, provided to the CODM, is measured in a manner consistent with that applied in these financial statements. There were no separate segment assets and segment liabilities information provided to the CODM, as CODM does not use this information to allocate resources to or evaluate the performance of the operating segments.
The revenue segment information reported to CODM for the year ended December 31, 2018 and 2017 is as follows:
Year ended December 31,2018 2017
RMB’000 RMB’000
Revenue from continuing operationInternet Business:— Online advertising 620,892 307,481— Internet value-added services and others 326,779 442,829
─────── ───────
947,671 750,310 Smart Hardware 1,843,788 3,740,066
─────── ───────
Total revenue 2,791,459 4,490,376 ─────── ───────
Revenue from discontinued operation 180,635 37,108─────── ───────
26
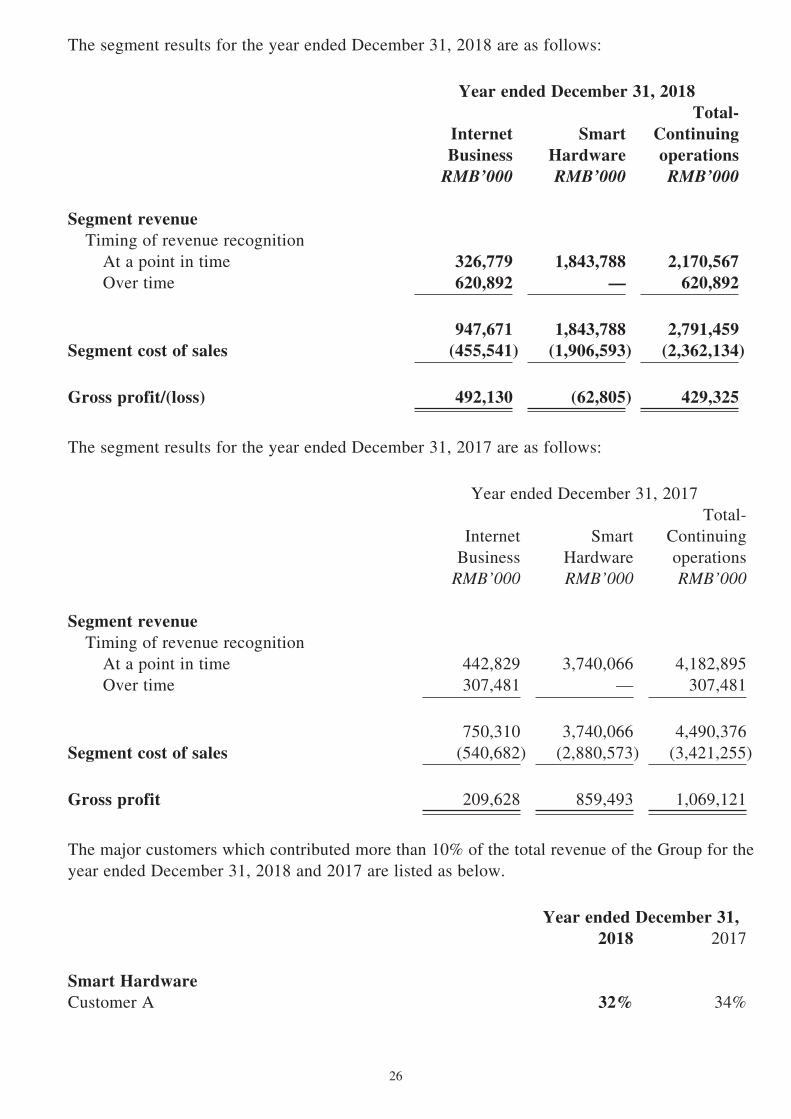
The segment results for the year ended December 31, 2018 are as follows:
Year ended December 31, 2018
Internet Business
Smart Hardware
Total-Continuing operations
RMB’000 RMB’000 RMB’000
Segment revenue Timing of revenue recognition At a point in time 326,779 1,843,788 2,170,567 Over time 620,892 — 620,892
─────── ─────── ───────
947,671 1,843,788 2,791,459Segment cost of sales (455,541) (1,906,593) (2,362,134)
─────── ─────── ───────
Gross profit/(loss) 492,130 (62,805) 429,325─────── ─────── ───────
The segment results for the year ended December 31, 2017 are as follows:
Year ended December 31, 2017
Internet Business
Smart Hardware
Total-Continuing operations
RMB’000 RMB’000 RMB’000
Segment revenue Timing of revenue recognition At a point in time 442,829 3,740,066 4,182,895 Over time 307,481 — 307,481
─────── ─────── ───────
750,310 3,740,066 4,490,376Segment cost of sales (540,682) (2,880,573) (3,421,255)
─────── ─────── ───────
Gross profit 209,628 859,493 1,069,121─────── ─────── ───────
The major customers which contributed more than 10% of the total revenue of the Group for the year ended December 31, 2018 and 2017 are listed as below.
Year ended December 31,2018 2017
Smart HardwareCustomer A 32% 34%

27
The Company is domiciled in the Cayman Islands while the Group mainly operates its businesses in the PRC and earns substantially all of the revenue from external customers attributed to the PRC.
As of December 31, 2018, substantially all of the non-current assets of the Group other than financial instruments were located in the PRC.
The reconciliation of segment profit to loss before income tax for the year ended December 31, 2018 are presented in the consolidated income statement of the Group.
(a) Contract liabilities
The liabilities related to contracts with customers are listed as below.
The Group has recognized the following liabilities related to contracts with customers:
As of December 31, 2018
As of January 1, 2018
RMB’000 RMB’000
Contract liabilities— Relating to sale of hardware 13,407 180,443— Relating to internet business 18,975 15,811
─────── ───────
32,382 196,254─────── ───────
The following table shows how much of the revenue recognized in the current reporting period relates to carried-forward contract liabilities.
Year ended December 31,2018 2017
RMB’000 RMB’000
Revenue recognized that was included in the contract liability balance at the beginning of the year— Smart Hardware 180,443 20,193— Internet Business 15,811 2,057
─────── ───────
196,254 22,250─────── ───────
All the revenue contracts are for periods of one year or less or are billed based on time incurred. As permitted under IFRS 15, the transaction price allocated to these unsatisfied contracts is not disclosed.

28
4 Other income
Year ended December 31,2018 2017
RMB’000 RMB’000
Government grants 38,744 23,678Investment income on short-term investments placed with banks — 21,155Others 1,967 4,531
─────── ───────
40,711 49,364 ─────── ───────
5 Other gains/(losses), net
Year ended December 31,2018 2017
RMB’000 RMB’000
Gains on disposal of long-term investments (Note 11) 353,142 32,677Fair value changes on financial assets at fair value through profit or loss (Note 11) 85,174 (77,365)Loss on disposals of property and equipment and intangible assets (3,059) (18)Fair value gains on short-term investments placed with banks 16,851 —Remeasurement gains on investment in an associate 30,739 —Others 518 (2,542)
─────── ───────
483,365 (47,248)─────── ───────

29
6 Expenses by nature
Year ended December 31,2018 2017
RMB’000 RMB’000
Inventories consumed and recognized as: — Cost of sales 1,391,379 2,741,647— Selling and marketing and other expenses 40,607 28,018Employee benefit expenses 926,929 582,829Promotion and advertising expenses 736,641 385,926Provision for inventory impairment (Note a) 376,955 13,500Revenue sharing fee 236,296 351,221Bandwidth and storage related costs 98,791 113,121Depreciation of property and equipment 75,368 39,442Operating lease expenses 65,431 45,438Travelling and entertainment expenses 45,533 26,510Warranty and maintenance expenses 56,969 44,665Video content monitoring fee 34,859 27,618License fees 39,897 17,185Tax and levies 26,282 17,457Outsourced technical services 34,758 12,976Development cost related to smartphone manufacturing equipment 17,457 26,574Utilities and office expenses 16,200 13,962Amortization of intangible assets 9,857 2,793Auditor’s remuneration— Annual audit services 6,775 6,879— Non-audit services 420 335Impairment of property and equipment 4,978 —Others 125,506 108,610
──────── ────────
Total cost of sales, selling and marketing expenses, administrative expenses and research and development expenses 4,367,888 4,606,706
──────── ────────
(a) In November 2018, the Group evaluated its business strategy and underwent a restructuring that it discontinued its e-commerce business. In addition, the Group also decided to work with Xiaomi for the opeations of its smartphone business (Note 1). After the assessment of inventory held for the e-commerce business and smart phone business, an aggregate impairment charge of RMB403,317,000 had been provided for the year ended December 31, 2018. Impairment was recognized where the carrying amounts of the inventories exceed their respective recoverable amounts. RMB376,955,000 was charged as “cost of sales” in the consolidated income statement; and RMB26,362,000 was presented in “loss from discontinued operation”.
30
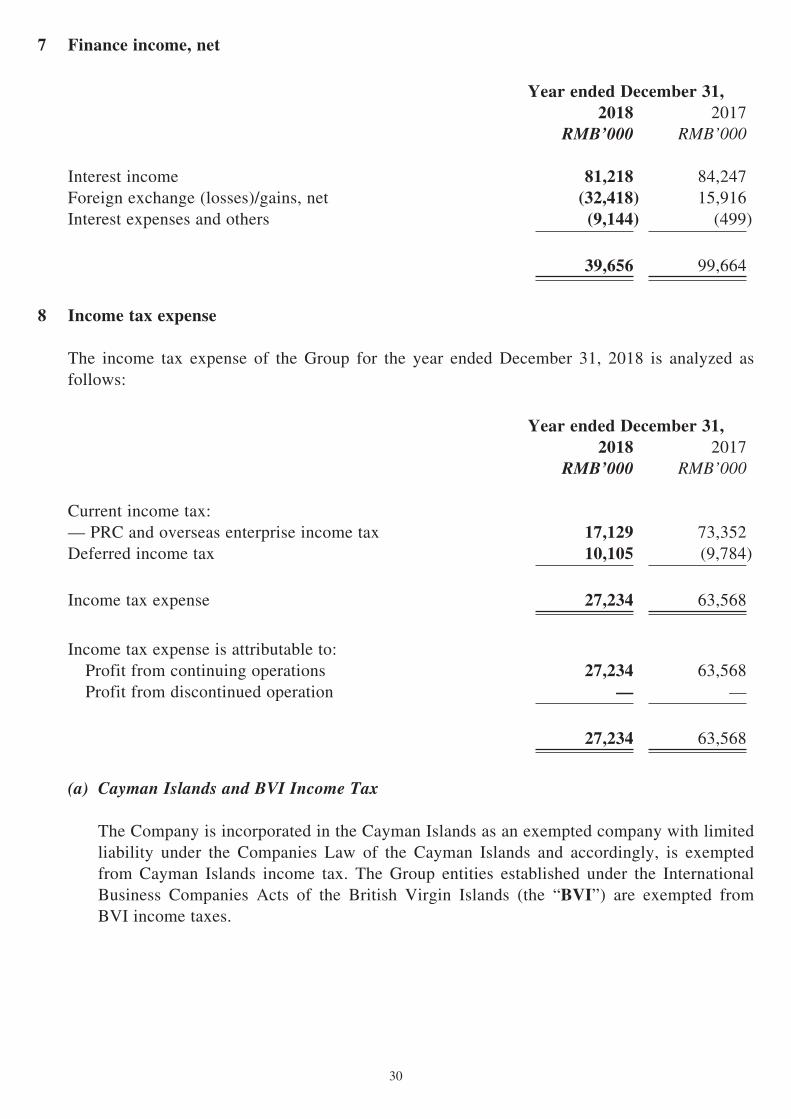
7 Finance income, net
Year ended December 31,2018 2017
RMB’000 RMB’000
Interest income 81,218 84,247 Foreign exchange (losses)/gains, net (32,418) 15,916 Interest expenses and others (9,144) (499)
─────── ───────
39,656 99,664 ─────── ───────
8 Income tax expense
The income tax expense of the Group for the year ended December 31, 2018 is analyzed as follows:
Year ended December 31,2018 2017
RMB’000 RMB’000
Current income tax:— PRC and overseas enterprise income tax 17,129 73,352Deferred income tax 10,105 (9,784)
─────── ───────
Income tax expense 27,234 63,568─────── ───────
Income tax expense is attributable to: Profit from continuing operations 27,234 63,568 Profit from discontinued operation — —
─────── ───────
27,234 63,568─────── ───────
(a) Cayman Islands and BVI Income Tax
The Company is incorporated in the Cayman Islands as an exempted company with limited liability under the Companies Law of the Cayman Islands and accordingly, is exempted from Cayman Islands income tax. The Group entities established under the International Business Companies Acts of the British Virgin Islands (the “BVI”) are exempted from BVI income taxes.
31
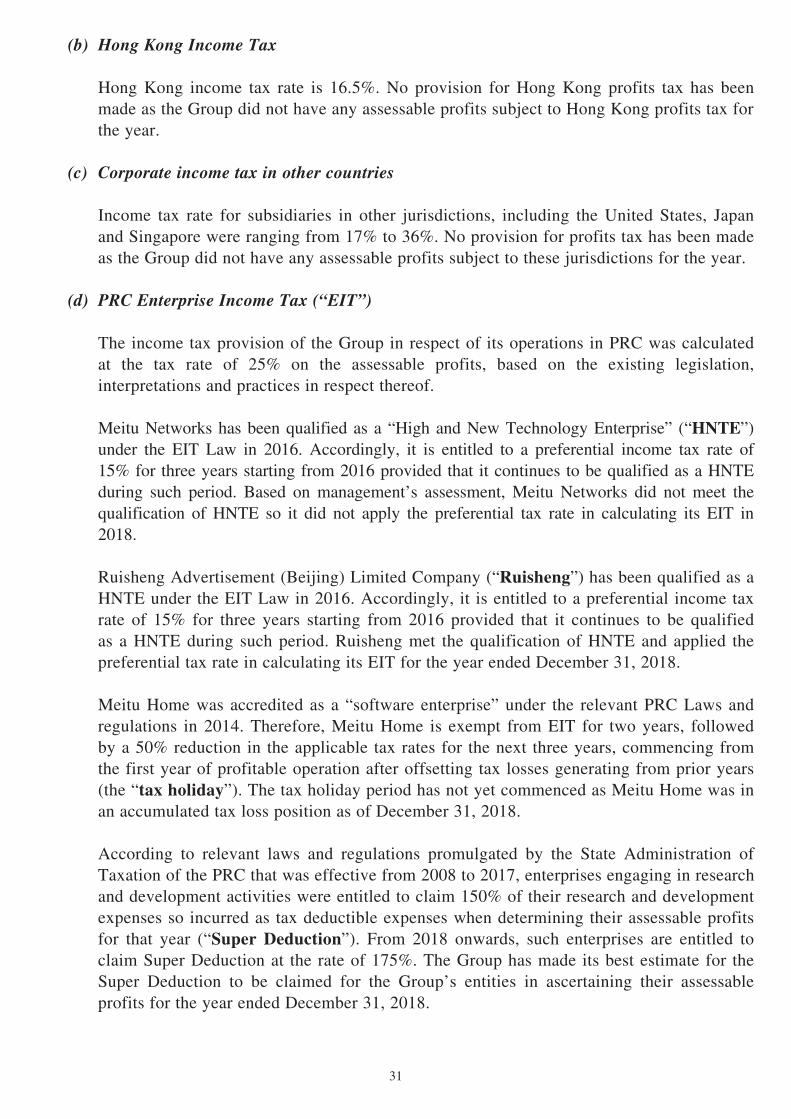
(b) Hong Kong Income Tax
Hong Kong income tax rate is 16.5%. No provision for Hong Kong profits tax has been made as the Group did not have any assessable profits subject to Hong Kong profits tax for the year.
(c) Corporate income tax in other countries
Income tax rate for subsidiaries in other jurisdictions, including the United States, Japan and Singapore were ranging from 17% to 36%. No provision for profits tax has been made as the Group did not have any assessable profits subject to these jurisdictions for the year.
(d) PRC Enterprise Income Tax (“EIT”)
The income tax provision of the Group in respect of its operations in PRC was calculated at the tax rate of 25% on the assessable profits, based on the existing legislation, interpretations and practices in respect thereof.
Meitu Networks has been qualified as a “High and New Technology Enterprise” (“HNTE”) under the EIT Law in 2016. Accordingly, it is entitled to a preferential income tax rate of 15% for three years starting from 2016 provided that it continues to be qualified as a HNTE during such period. Based on management’s assessment, Meitu Networks did not meet the qualification of HNTE so it did not apply the preferential tax rate in calculating its EIT in 2018.
Ruisheng Advertisement (Beijing) Limited Company (“Ruisheng”) has been qualified as a HNTE under the EIT Law in 2016. Accordingly, it is entitled to a preferential income tax rate of 15% for three years starting from 2016 provided that it continues to be qualified as a HNTE during such period. Ruisheng met the qualification of HNTE and applied the preferential tax rate in calculating its EIT for the year ended December 31, 2018.
Meitu Home was accredited as a “software enterprise” under the relevant PRC Laws and regulations in 2014. Therefore, Meitu Home is exempt from EIT for two years, followed by a 50% reduction in the applicable tax rates for the next three years, commencing from the first year of profitable operation after offsetting tax losses generating from prior years (the “tax holiday”). The tax holiday period has not yet commenced as Meitu Home was in an accumulated tax loss position as of December 31, 2018.
According to relevant laws and regulations promulgated by the State Administration of Taxation of the PRC that was effective from 2008 to 2017, enterprises engaging in research and development activities were entitled to claim 150% of their research and development expenses so incurred as tax deductible expenses when determining their assessable profits for that year (“Super Deduction”). From 2018 onwards, such enterprises are entitled to claim Super Deduction at the rate of 175%. The Group has made its best estimate for the Super Deduction to be claimed for the Group’s entities in ascertaining their assessable profits for the year ended December 31, 2018.

32
9 Loss per share
(a) Basic
Year ended December 31,2018 2017
Loss attributable to owners of the Company (RMB’000) From continuing operations (1,054,784) (78,102) From discontinued operation (199,753) (119,222)
───────── ─────────
(1,254,537) (197,324)───────── ─────────
Weighted average number of ordinary shares in issue (thousand) 4,219,270 4,245,322
───────────── ─────────────
Basic and diluted loss per share (in RMB/share) From continuing operations (0.25) (0.02) From discontinued operation (0.05) (0.03)
───────── ─────────
(0.30) (0.05)───────────── ─────────────
(b) Diluted
Diluted loss per share is calculated by adjusting the weighted average number of ordinary shares outstanding to assume conversion of all dilutive potential ordinary shares. For the year ended December 31, 2018 and 2017, the Company had two categories of potential ordinary shares, the shares options awarded under Pre-IPO Employees Share Option Plan (“Pre-IPO ESOP”) and restricted stock unit under the Post-IPO Share Award Scheme. As the Group incurred losses for the year ended December 31, 2018 and 2017, the potential ordinary shares were not included in the calculation of dilutive loss per share, as their inclusion would be anti-dilutive. Accordingly, dilutive losses per share for the year ended December 31, 2018 and 2017 is the same as basic loss per share.
33
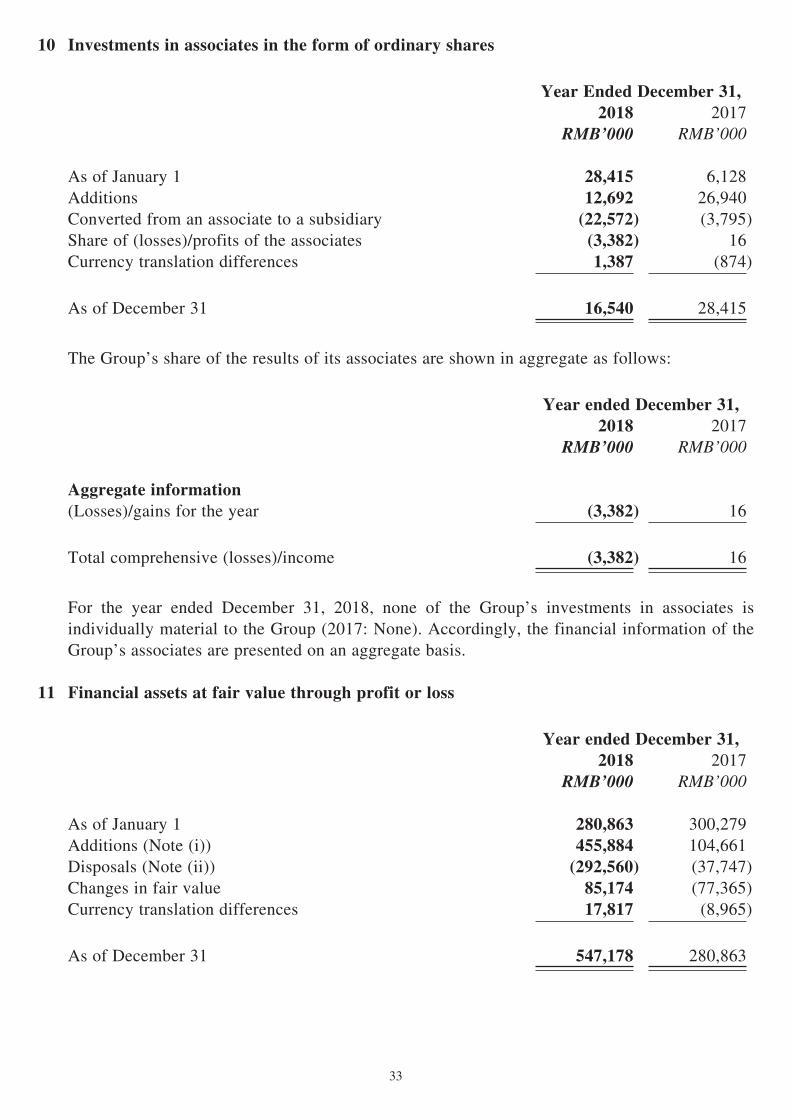
10 Investments in associates in the form of ordinary shares
Year Ended December 31,2018 2017
RMB’000 RMB’000
As of January 1 28,415 6,128Additions 12,692 26,940Converted from an associate to a subsidiary (22,572) (3,795)Share of (losses)/profits of the associates (3,382) 16Currency translation differences 1,387 (874)
─────── ───────
As of December 31 16,540 28,415─────── ───────
The Group’s share of the results of its associates are shown in aggregate as follows:
Year ended December 31,2018 2017
RMB’000 RMB’000
Aggregate information(Losses)/gains for the year (3,382) 16
─────── ───────
Total comprehensive (losses)/income (3,382) 16─────── ───────
For the year ended December 31, 2018, none of the Group’s investments in associates is individually material to the Group (2017: None). Accordingly, the financial information of the Group’s associates are presented on an aggregate basis.
11 Financial assets at fair value through profit or loss
Year ended December 31,2018 2017
RMB’000 RMB’000
As of January 1 280,863 300,279Additions (Note (i)) 455,884 104,661Disposals (Note (ii)) (292,560) (37,747)Changes in fair value 85,174 (77,365)Currency translation differences 17,817 (8,965)
─────── ───────
As of December 31 547,178 280,863─────── ───────

34
The Group made investments in some redeemable convertible preferred shares and ordinary shares with preferred rights (“preferred shares”) of certain private companies, and these investments held by the Company contain embedded derivatives. Additionally, the Group also holds board seats in certain investees, in which it can participate in the investees’ financial and operating activities. These investee companies are associates of the Group. After assessment on the Group’s business model for managing financial assets and contractual cash flow test where those cash flows represent solely payments of principal and interest (“SPPI”), the Group recognized these investments as financial assets at fair value through profit or loss.
(i) During the year ended December 31, 2018, the Group acquired the minority stake of a number of private-held companies in form of preferred shares. These new investments are designated as financial assets at fair value through profit or loss as detailed above.
(ii) During the year ended December 31, 2018, the Group disposed of part of its minority stakes in a few investees and recognized disposal gains of RMB353,142,000 (2017: RMB32,677,000) (Note 5).
The Group performs assessments on the fair value of its financial assets at fair value through profit or loss periodically. Management reviews the investees’ performance and forecast, and applies valuation techniques, where applicable, to determine their respective fair value. During the year ended December 31, 2018, change in fair value amounting to RMB85,174,000 was recognized as other gains in the consolidated income statement (Note 5).
12 Financial assets at fair value through other comprehensive income/Available-for-sale financial assets
During the years ended December 31, 2018 and 2017, the Group held minority interests in a private entity. The entity is principally engaged in the operations of a fashion and beauty e-commerce platform. The Group does not have any board seats and could not exercise significant influence in the entity. The Group designated the investment as financial assets through other comprehensive income as of December 31, 2018 (2017: available-for-sale financial assets). As of December 31, 2018, the carrying amounts of financial assets through other comprehensive income approximated their fair value.
13 Trade receivables
As of December 31,2018 2017
RMB’000 RMB’000
Trade receivables 523,547 307,388Loss allowance (1,730) —
───────── ─────────
521,817 307,388───────── ─────────

35
The Group grants a credit period of 30 to 120 days to its customers. As of December 31, 2018, the aging analysis of trade receivables based on transaction date were as follows:
As of December 31,2018 2017
RMB’000 RMB’000
Up to 3 months 349,673 287,4343 to 6 months 130,070 16,0566 months to 1 year 41,254 3,358Over 1 year 2,550 540
───────── ─────────
523,547 307,388───────── ─────────
As of December 31, 2018, the carrying amounts of trade receivables were primarily denominated in RMB and approximated their fair values.
14 Cash and bank balances
(a) Cash and cash equivalents
As of December 31,2018 2017
RMB’000 RMB’000
Cash at bank and in hand 421,807 1,066,632Short-term bank deposits with initial terms within three months 109,811 330,000
───────── ─────────
531,618 1,396,632───────── ─────────
(b) Restricted cash
As of December 31, 2018, RMB1,000,000 (2017: RMB1,000,000) of restricted deposits were held in a bank to guarantee payment of certain operating expenses.
(c) Short-term bank deposits
As of December 31, 2018, short-term bank deposits amounting RMB2,161,908,000 (2017: RMB3,774,807,000) were bank deposits with original maturities over three months and redeemable on maturity. The short-term bank deposits are denominated in US$ and the weighted average effective interest rate was 3.00% per annum for the year ended December 31, 2018 (2017: 1.97%).

36
15 Share capital and premium
As of December 31, 2018 and December 31, 2017, the authorized share capital of the Company comprised 6,000,000,000 ordinary shares with par value of US$0.00001 per share.
Note
Number of ordinary
shares
Nominal value of
ordinary shares
Equivalent Nominal value of
ordinary shares
Sharepremium
’000 US$’000 RMB’000 RMB’000
Issued:As of January 1, 2018 4,273,553 43 280 7,679,137Employee share option scheme under Pre-IPO ESOP — Shares issued and proceeds received (a) 19,828 — 1 4,004Repurchase and cancellation of shares (b) (110,865) (1) (7) (642,201)Employee Share Award Scheme: — Shares issued (c) 20,000 — — —
─────── ─────── ─────── ───────
As of December 31, 2018 4,202,516 42 274 7,040,940─────── ─────── ─────── ───────
As of January 1, 2017 4,227,295 43 277 17,015,854Employee share option scheme under Pre-IPO ESOP — Shares issued and proceeds received (a) 36,258 — 3 7,326Employee Share Award Scheme: — Shares issued (c) 10,000 — — —Share premium set off the accumulated losses (d) — — — (9,344,043)
─────── ─────── ─────── ───────
As of December 31, 2017 4,273,553 43 280 7,679,137─────── ─────── ─────── ───────
(a) During the year ended December 31, 2018, 19,828,000 pre-IPO share options with exercise price of US$0.03 were exercised (2017: 36,258,000).

37
(b) The Company’s annual general meeting approved a share repurchase/buyback mandate on June 2, 2017 and renewed the mandate on June 5, 2018, pursuant to which the Company may repurchase/buyback its own issued ordinary shares, from time to time, at the discretion of the Board of Directors of the Company up to an amount not exceeding 10% of the aggregate nominal amount of the issued share capital of the Company. The repurchase/buyback was effective on the date of passing the relevant shareholders’ resolution up to the next annual general meeting of the Company. On May 25, 2018, the Board of Directors of the Company authorized a share buyback plan to buyback the Company’s shares up to an amount of US$100,000,000 in value of shares via on-market transactions. Up to December 31, 2018, the Company had repurchased an aggregate of 110,865,000 shares at an average price of HK$6.85 for an aggregate consideration of HK$759,361,000 (equivalent to RMB642,208,000) and all the shares repurchased/boughtback were subsequently cancelled.
(c) On December 28, 2018, the Company issued 20,000,000 new shares under the Post-IPO Share Award Scheme. (2017: 10,000,000).
(d) On March 24, 2017, the Directors passed a resolution that the sum of approximately of US$1,348,561,000 standing to the credit of the share premium account of the Company be applied to set off the accumulated losses of the Company. Accordingly, the balance of share premium was reduced by RMB9,344,043,000.
16 Trade and other payables
The aging analysis of trade payables based (including amounts due to related parties of trading in nature) on transaction date is as follows:
As of December 31,2018 2017
RMB’000 RMB’000
Up to 3 months 294,160 680,8713 to 6 months 33,075 26,3676 months to 1 year 17,446 9,7161 to 2 years 10,200 2,219Over 2 years 1,640 365
───────── ─────────
356,521 719,538───────── ─────────
17 Dividends
No dividends have been paid or declared by the Company during the year ended December 31, 2018 (2017: Nil).

38
18 Subsequent Events
On February 19, 2019, the Group announced the acquisition of 31% equity interests in Dreamscape Horizon Limited (“Dreamscape”), an indirect wholly-owned subsidiary of Leyou Technologies Holdings Limited (“Leyou”). Dreamscape and its subsidiaries are principally engaged in the development and publishing of online multiplayer video games for both PC and console platforms. The total consideration of approximately HK$2,686,577,000 will be satisfied by the allotment and issue of new shares (“Consideration Shares”) by the Company to Leyou under a specific mandate at an issue price of HK$2.71 per Consideration Share. The Consideration Shares will, upon issue, represent (i) approximately 23.58% of the issued share capital of the Company as of February 19, 2019; and (ii) approximately 19.08% of the issued share capital of the Company as enlarged by the allotment and issue of the Consideration Shares. The acquisition has not been completed as at the date of this annual results announcement.
19 Discontinued operation
As described in Note 1, in order to focus the resources of the Group in implementing its new strategy surrounding “Beauty and Social Media”, the Group decided to exit the e-commerce business on November 30, 2018.
Financial information relating to for the year ended December 31, 2018 are set out below. The income statement and statement of cash flows distinguish discontinued operation from continuing operations and the respective comparative figures have been restated.
2018 2017RMB’000 RMB’000
Revenue 180,635 37,108Cost of sales (252,655) (61,743)Expenses (127,315) (96,205)Finance income, net — 1,523Other (losses)/gains, net (418) 57Other income — 38Loss before income tax (199,753) (119,222)Income tax expense — —
Loss from discontinued operation (199,753) (119,222)
Net cash used in operating activities (201,038) (130,301)
Cash flows of discontinued operation (201,038) (130,301)

39
OTHER INFORMATION
Purchase, Sale or Redemption of the Company’s Listed Securities
A general mandate to repurchase/buyback the Company’s shares (the “Shares”) up to 10% of the total number of Shares then in issue was granted to the Board at the annual general meeting of the Company held on June 2, 2017, and renewed at the annual general meeting of the Company held on June 5, 2018. Pursuant to such mandates, during the year ended December 31, 2018, the Company repurchased/bought back an aggregate of 110,865,000 Shares on The Stock Exchange of Hong Kong Limited (the “Stock Exchange”) at an aggregate consideration of HK$759,361,000 (equivalent to RMB642,208,000). The repurchase/buy-back of Shares was effected by the Directors for the benefit of the Company and to create value to its shareholders. All Shares that were bought back were subsequently cancelled.
Save as disclosed above, during the year ended December 31, 2018, neither the Company nor any of its subsidiaries has purchased, sold or redeemed any of the Company’s listed securities.
Compliance with the Corporate Governance Code
The Company is committed to maintaining and promoting stringent corporate governance. The principle of the Company’s corporate governance is to promote effective internal control measures, uphold a high standard of ethics, transparency, responsibility and integrity in all aspects of business, to ensure that its affairs are conducted in accordance with applicable laws and regulations and to enhance the transparency and accountability of the Board to all shareholders.
Save as disclosed below, during the year ended December 31, 2018, the Company has complied with the applicable code provisions of the Corporate Governance Code (the “CG Code”) as set out in Appendix 14 to the Listing Rules.
According to rule 3.10A of the Listing Rules, the Company is required to appoint independent non-executive directors representing at least one-third of the members of the Board. Following the passing away of Professor ZHANG Shoucheng and until January 1, 2019, the Company was not in compliance with: (i) rule 3.10(1) of the Listing Rules, which stipulates that the board of directors shall comprise at least three independent non-executive directors; (ii) rule 3.25 of the Listing Rules, which stipulates that the remuneration committee shall comprise a majority of independent non-executive directors; and (iii) code provision A.5.1 of the CG Code, which stipulates that the number of independent non-executive directors shall represent the majority of the nomination committee.
Mr. LAI Xiaoling and Mr. ZHANG Ming were appointed as independent non-executive Directors on January 1, 2019, and Mr. KO Chun Shun Johnson resigned as an independent non-executive Director on the same date, after which the number of independent non-executive directors on the Board represents no less than one-third of the members of the Board as required under rule 3.10A of the Listing Rules.
Mr. LAI Xiaoling was also appointed as a member of the audit committee of the Company (the “Audit Committee”) and the chairman of the remuneration committee of the Company (the “Remuneration Committee”) on January 1, 2019, while Mr. ZHANG Ming was also appointed as a member of the Remuneration Committee and the nomination committee of the Company on the same date. Accordingly, the Company is in compliance with rule 3.25 of the Listing Rules and code provision A.5.1 of the CG Code.

40
Compliance with the Model Code for Securities Transactions by Directors
The Company has adopted the Model Code for Securities Transactions by Directors of Listed Issuers (the “Model Code”) as set out in Appendix 10 to the Listing Rules as the code of conduct regarding the Directors’ dealings in the securities of the Company. Having made specific enquiry of the Directors of the Company, all the Directors confirmed that they have complied with the required standards set out in the Model Code for the year ended December 31, 2018.
The Board has also adopted the Model Code to regulate all dealings by relevant employees who are likely to be in possession of unpublished inside information of the Company in respect of securities in the Company as referred to in code provision A.6.4 of the CG Code. No incident of non-compliance with the Model Code by the Company’s relevant employees has been noted during the year ended December 31, 2018 after making reasonable enquiry.
Audit Committee and Review of Financial Statements
The Company established an Audit Committee with written terms of reference in compliance with the CG Code. As at the date of this announcement, the Audit Committee comprises three members, namely Mr. ZHOU Hao, Dr. GUO Yihong and Mr. LAI Xiaoling. Mr. ZHOU Hao is the chairman of the Audit Committee.
The Audit Committee has reviewed the annual results announcement and the audited financial statements of the Group for the year ended December 31, 2018. The Audit Committee has also discussed matters with respect to the accounting policies and practices adopted by the Company and internal control with members of the senior management and the Company’s auditor. Based on the review and discussions with the management, the Audit Committee was satisfied that the Group’s audited consolidated financial statements were prepared in accordance with applicable accounting standards and fairly present the Group’s financial position and results for the year ended December 31, 2018.
The consolidated financial statements of the Group have been audited by the Company’s auditor, in accordance with International Standards on Auditing.
Scope of Work of the Company’s Auditor
The figures contained in this announcement of our Group’s consolidated results for the year ended December 31, 2018 have been agreed by the Company’s auditor, to the figures set out in the audited consolidated financial statements of our Group for the year ended December 31, 2018. The Company’s auditor performed this work in accordance with Hong Kong Standard on Related Services 4400 “Engagements to Perform Agreed-upon Procedures Regarding Financial Information” and with reference to Practice Note 730 (Revised) “Guidance for Auditors Regarding Preliminary Announcements of Annual Results” issued by the Hong Kong Institute of Certified Public Accountants (“HKICPA”). The work performed by the Company’s auditor in this respect does not constitute an assurance engagement in accordance with Hong Kong Standards on Auditing, Hong Kong Standards on Review Engagements, or Hong Kong Standards on Assurance Engagements issued by the HKICPA and consequently no assurance has been expressed by the Company’s auditor on this announcement.
Final Dividend
The Board does not recommend the distribution of a final dividend for the year ended December 31, 2018.

41
Use of Net Proceeds from Listing
The Shares were listed on the Main Board of the Stock Exchange on December 15, 2016. The net proceeds from the listing amounted to approximately RMB4,211.5 million. As at December 31, 2018, the Group had used:
• approximately RMB1,221.3 million for component and raw material sourcing to produce smartphones;
• approximately RMB530.3 million to invest in or acquire businesses that are complementary to our business;
• approximately RMB831.2 million to implement sales and marketing initiatives in both China and overseas market;
• approximately RMB274.7 million to expand Internet services business;
• approximately RMB278.0 million to expand research and development capabilities;
• approximately RMB381.7 million to general working capital.
The remaining balance of the net proceeds was placed with banks. The Group will apply the remaining net proceeds in the manner set out in the prospectus of the Company dated December 5, 2016.
Annual General Meeting
The annual general meeting is scheduled to be held on June 6, 2019 (the “AGM”). A notice convening the AGM will be published and dispatched to the shareholders of the Company in the manner required by the Listing Rules in due course.
Closure of Register of Members
The register of members of the Company will be closed from June 3, 2019 to June 6, 2019, both days inclusive, in order to determine the identity of the shareholders who are entitled to attend and vote at the AGM to be held on June 6, 2019. All transfers of Shares accompanied by the relevant share certificates and transfer forms must be lodged with the Company’s branch share registrar in Hong Kong, Computershare Hong Kong Investor Services Limited, at Shops 1712–1716, 17th Floor, Hopewell Centre, 183 Queen’s Road East, Wanchai, Hong Kong before 4:30 p.m. on May 31, 2019.
Publication of Annual Results and Annual Report
This annual results announcement is published on the website of the Stock Exchange at www.hkexnews.hk and the website of the Company at corp.meitu.com. The annual report of the Group for the year ended December 31, 2018 will be published on the aforesaid websites of the Stock Exchange and the Company and will be dispatched to the Company’s shareholders in due course.

42
APPRECIATION
On behalf of the Company, we would like to express our sincere gratitude to all our users. We would also like to thank all our employees and management team for demonstrating the Group’s core values in every day’s work, and executing the Group’s strategy with professionalism, integrity and dedication. We are also thankful for the continued support and trust from our shareholders and stakeholders. We will strive to inspire more people in expressing their beauty.
By order of the BoardMeitu, Inc.
Cai WenshengChairman
Hong Kong, March 20, 2019
As at the date of this announcement, the executive directors of the Company are Mr. Cai Wensheng and Mr. Wu Zeyuan (also known as Mr. Wu Xinhong); the non-executive directors of the Company are Dr. Guo Yihong and Dr. Lee Kai-fu; the independent non-executive directors of the Company are Mr. Zhou Hao, Mr. Lai Xiaoling and Mr. Zhang Ming (also known as Mr. Wen Chu).
This announcement contains forward-looking statements relating to the business outlook, estimates of financial performance, forecast business plans and growth strategies of the Group. These forward-looking statements are based on information currently available to the Group and are stated herein on the basis of the outlook at the time of this announcement. They are based on certain expectations, assumptions and premises, some of which are subjective or beyond our control. These forward-looking statements may prove to be incorrect and may not be realized in future. Underlying these forward-looking statements are a large number of risks and uncertainties. In light of the risks and uncertainties, the inclusion of forward-looking statements in this announcement should not be regarded as representations by the Board or the Company that the plans and objectives will be achieved. Shareholders and potential investors should therefore not place undue reliance on such statements.