meetup openstack-sfbay-2015
TRANSCRIPT
Monasca monitoring-as-a-service (MONaaS) autoscaling with Heat
SFBay OpenStack August 20, 2015 Dexter Fryar Kanagaraj Manickam Thomas Goepel
1

Outline About me
Intro to Monasca
Architecture overview
Operational overview
Enough slideware let’s see the demo

About me
3
• 15 years at HP in systems software engineering roles
• Worked on internal and external embedded storage subsystems
• Heterogeneous solutions engineering
• Joined HP OpenStack engineering in 2011
• Foundation services – metering and billing
• Currently working on the Monasca project

Intro
4
• Monasca the name #monitoringatscale
• How did we get here public cloud at scale lessons learned, datadog, openstack
• Goals for Monasca open-source multi-tenant, highly scalable, performant, fault-tolerant monitoring-as-a-service solution that integrates with OpenStack
• Uses application, service, tenant, component
• Model REST API for high-speed metrics processing and querying and has a streaming alarm engine and notification engine access via à agent, rest API, statsd
Slide 4 of 400 J

Monitoring Cloud Platforms
Monitoring, analyses, remediation, optimization
Virtual and physical Infrastructure
Cloud IaaS Service
HW | OS | Middleware | Apps | Services Workload: performance, availability, security, compliance Cloud service health and availability
Virtual and physical compute, network, and storage monitoring
Cloud PaaS Service
Application
compute network storage
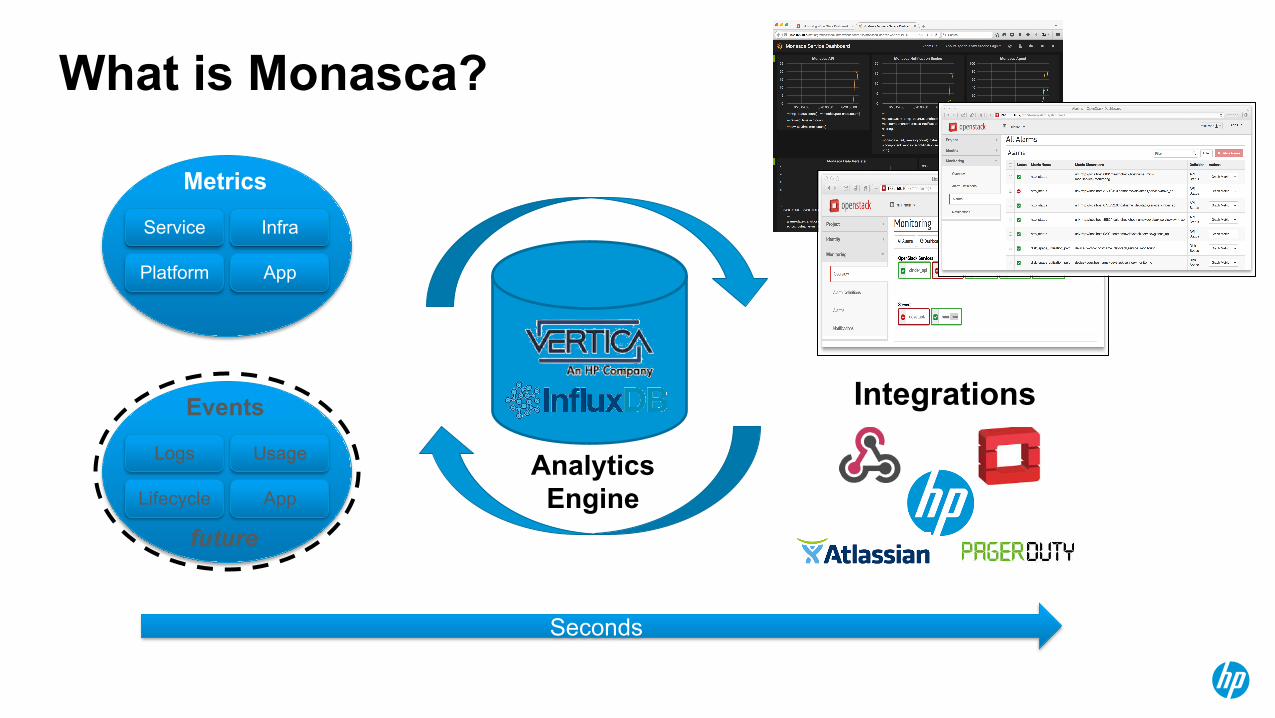
What is Monasca?
Analytics Engine
Seconds
Integrations
Service
Metrics
Platform
Infra
App
Logs
Events
Lifecycle
Usage
App
future

Benefits
• Higher SLAs/ Increased reliability
• Lower MTTR w/faster troubleshooting
• Dynamic alarm management • Compliance reporting • Cloud scale: 100’s today,
1000’s tomorrow
Monitoring as a service at scale

Architecture
8

Metric Posting Sequence
9
1.5.1 send notification SMS, Email, Heat, SMTP, Twilio, ...
1.3.1 aggregatemetric
1.4.1 threshold metric
Monitoring API
Message Queue<<Kafka>>
Metrics and Alarm History
Store<<Vertica>>
Transform & Aggregation
Engine
Threshold Engine
Notification Engine
1.5 consume alarm
1.4 consume metric
1.3 consume metric
Persister
1.1 consume metrics1.6 consume alarms
1.1.1 store metric1.6.1 store alarm
storage drivers
1.4.2 publish alarmPOST metric 1. publish metric
Metrics Queue
Alarm History Queue
1.3.2 publish metric

AutoScale Demo
Heat
Monasca
VM VM VM
1. Heat create-stack auto-scale.yaml stack-1 2. Create desired nova instances (Autoscaling group)
and auto-scaling for stack-1 in heat 3. Create monasca alarm definition and webhook
notification 4. Monasca start to monitor nova instances 5. Instance reaches thersold and monasa generate
alarm 6. Monasca calls heat webhook 7. Heat increase the instances count by 1 5-7 runs for ever ! (auto-scale)
5
heat_template_version: 2013-‐05-‐23 resources: group: type: OS::Heat::AutoScalingGroup scaleup_policy: type: OS::Heat::ScalingPolicy notification: type: OS::Monasca::Notification cpu_alarm_high: type: OS::Monasca::AlarmDefinition

Thank you! Q&A
https://wiki.openstack.org/wiki/Monasca https://launchpad.net/monasca
Core code
https://github.com/stackforge?query=monasca
Ancillary code https://github.com/hpcloud-mon
Meetings Tuesdays 10 AM CST
https://wiki.openstack.org/wiki/Meetings/Monasca
IRC #openstack-monasca on freenode.net
monasca-*.readthedocs.org
11

Backup
12

Monasca Heat Support
13
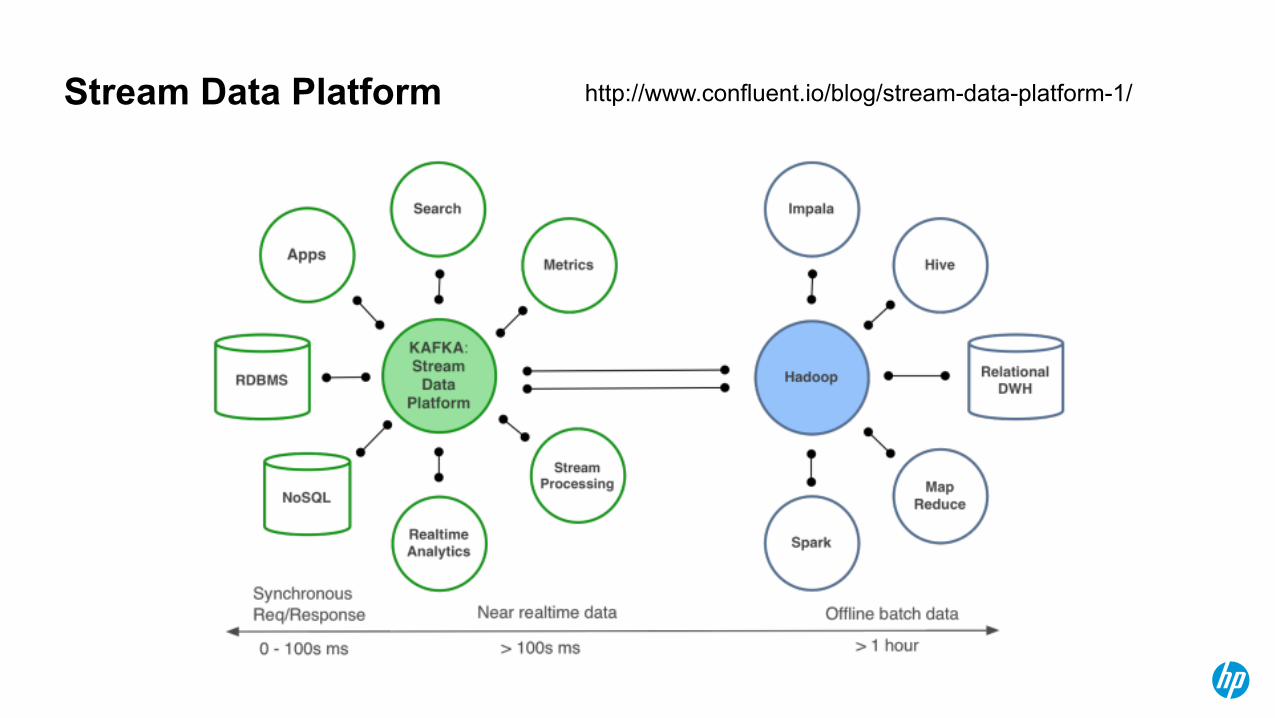
Stream Data Platform http://www.confluent.io/blog/stream-data-platform-1/

RabbitMQ Issues & Limitations • Performance:
– RabbitMQ: 10K-20K messages/sec – Kafka: >100K messages/sec.
• Durability: – Performance of RabbitMQ with durable messages is very poor. – Kafka: Durable messages are always on.
• HA: – RabbitMQ does not cope seamlessly with network partitions and we’ve seen numerous failures. – Kafka: HA designed in based on a variant of PAXOS family of algorithms and handles network partitions based on
consensus.
• Scalability: – Unable to scale RabbitMQ > 20K message/sec. – Easy to scale Kafka.
• RabbitMQ has been the biggest cause of failures and performance problems in a cloud at scale with a monitoring solution.