meeting our population challenges
TRANSCRIPT

Meeting our
Population
Challenges
Cabinet Office
February 2018
GD 2018/0014


1
Contents
Foreword ............................................................................................................. 2
Introduction......................................................................................................... 4
1. Isle of Man Population Projections .................................................................. 7
2. Declining Fertility ........................................................................................... 8
3. Emigration of Young adults ........................................................................... 14
4. Growing population of older people ............................................................... 25
5. Active Ageing Index ..................................................................................... 28
6. British Irish Council Demography Work stream .............................................. 31
7. Summary of Recommendations..................................................................... 32
Appendix I : Isle of Man Population Projections ................................................... 34
Appendix II: Active Ageing Index – Employment Domain ..................................... 46
Appendix III: Active Ageing Index – Participation Domain .................................... 48
Appendix IV: Active Ageing Index - Independent, Healthy and Secure Living Domain
......................................................................................................................... 50
Appendix V: Active Ageing Index - Capacity and enabling environment for active
ageing domain ................................................................................................... 52
Appendix IV – British Irish Council Demography Work stream – Rapid Reflection Tool
......................................................................................................................... 54

2
Foreword
Increasing our economically active population is one of six strategic objectives in the
Programme for Government.
The importance of this became more evident when the 2016 census results were
published in March 2017 and they revealed both the first fall in the Island’s
population since 1986 and significant emigration of young people. They also
confirmed the Island’s population was naturally declining, with deaths greater than
births and a growing number of older people.
The Programme for Government is full of policy statements and policy action aimed
to deliver this objective, but it also seemed helpful to step back and further analyse
where things are and to consider the policy responses. That is the background to
this white paper, Meeting our Population Challenges, which is aimed to encourage
debate in Government and throughout society so that population-related policy can
be reviewed and joined up action will result. As Sir Miles Walker put it in March 1987
in his document about The Development of Policy at the beginning of the Council of
Ministers era:
“Responsible Government involves detailed analysis and the co-ordination of
policies which have been considered, taking account of all factors …… The
population projections reveal the importance of immigration to the Isle of
Man. Without migration there will be a significant fall in population between
now and the year 2000 and the structure will alter significantly.”
So, alongside chapters about fertility, migration and ageing, this white paper also
updates the population projections. These show the size and makeup of the Island’s
population and its demography depending upon how the Island addresses its
population challenges.
It seems a ‘plan, monitor and manage’ approach will be needed for both the
population projections and population-related policies. For instance, which of the
alternative migration trends is observed and is the distribution of migration
continuing in line with the profile observed during the most recent decade?
This implies the enhancement of techniques to monitor population and demographic
change, as outlined in the Census Project Review with Recommendations which was
published in March 2017.
The white paper also calculates for the first time the UNECE Active Ageing Index and
presents some elements of the excellent British-Irish Council Demography Report
2016, Population-Ageing-Society: Policy Implications.

3
So I invite you to examine the evidence here and to consider the policy options that
are presented. Clearly there is no silver bullet to reverse the decline in the Island’s
working age population; but we can make it a population blip, as the short decline
in the 1980s was, given, as I put it in Tynwald in 2015:
“increasing life expectancy does not necessarily mean an ageing population
on our Island, as our population is determined primarily by migration ….. the
Isle of Man could actually affect its demographic profile by population policy
change”.
But we cannot afford to be complacent. There are challenges. Our Island has to be
an Island of Enterprise and Opportunity providing career and life opportunities for
everyone. This white paper can only help all of us focus us on the challenges and
options for policy response.
Hon Chris Thomas MHK
Minister for Policy and Reform
28 February 2018

4
Introduction
The 2016 Census showed the first fall in population for thirty years. It also revealed
underlying challenges in our population structure, specifically the declining numbers
of births, emigration of young people and a growing number of elderly persons.
The paper details some of the issues that have arisen from these demographic
changes and explores some options for policies that could be developed to mitigate
them. It also includes the population projections that have been developed from the
2016 Census and the calculation of Active Ageing Index.
The paper is made up of seven sections:
1. Population projections
2. Declining Fertility – Challenges and responses
3. Emigration of young people – Challenges and responses
4. Growing population of older people – Challenges and responses
5. Active Ageing Index – calculation
6. British Irish Council Demography Workstream summary
7. Summary of recommendations
Background
The population structure of the Isle of Man is important for a number of reasons.
Firstly, with a relatively open border and high levels of migration (typically around
2,000 out of population of 83,000 every year), the Island can quickly see significant
changes in patterns of demand for public services and shortages of labour in key
economic sectors as a result of small shifts inward or outward.
An example of this was in the 1960’s when a policy of immigration of retired persons
and the emigration of the young pushed the dependency ratio (the proportion of
non-working to working people) to more than 80% by 1981, the highest ever seen
in the British Isles, as shown in Figure 1.
5
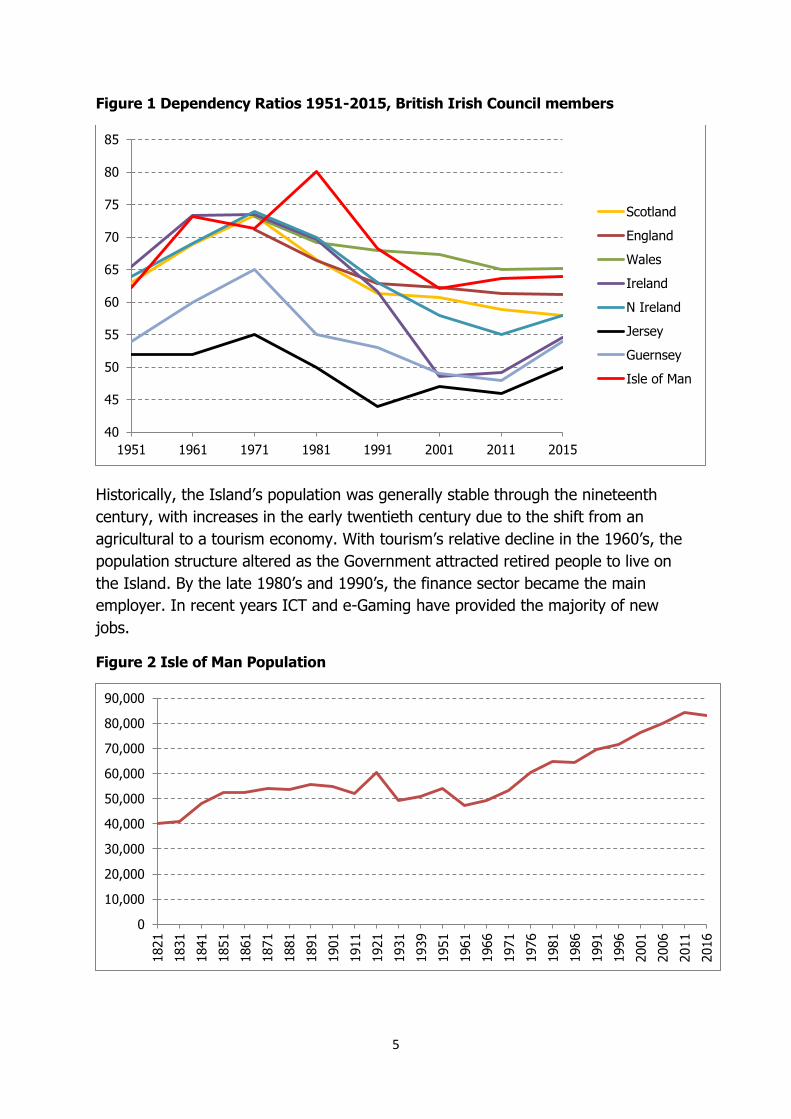
Figure 1 Dependency Ratios 1951-2015, British Irish Council members
Historically, the Island’s population was generally stable through the nineteenth
century, with increases in the early twentieth century due to the shift from an
agricultural to a tourism economy. With tourism’s relative decline in the 1960’s, the
population structure altered as the Government attracted retired people to live on
the Island. By the late 1980’s and 1990’s, the finance sector became the main
employer. In recent years ICT and e-Gaming have provided the majority of new
jobs.
Figure 2 Isle of Man Population
40
45
50
55
60
65
70
75
80
85
1951 1961 1971 1981 1991 2001 2011 2015
Scotland
England
Wales
Ireland
N Ireland
Jersey
Guernsey
Isle of Man
0
10,000
20,000
30,000
40,000
50,000
60,000
70,000
80,000
90,000
1821
1831
1841
1851
1861
1871
1881
1891
1901
1911
1921
1931
1939
1951
1961
1966
1971
1976
1981
1986
1991
1996
2001
2006
2011
2016

6
What is clear from this is that the Island’s periods of population growth and decline
have been predominately related to growth or decline of the dominant economic
sector at any time. In that regard, the reduction in employment in financial services
post 2008 has had an impact here as well as elsewhere.
There have been two approaches to these strategic shifts, firstly to delay or defer
the impact of population change by government intervention, and secondly to
accelerate the growth of new businesses and opportunities. Usually Government has
tried both.
There has been a long history of population being considered by Tynwald. The New
Residents Policy of the 1960’s was followed by the report of the Commission on the
Imbalance of Population in 1968, and further reports in 1973, 1980, 1982 and 1985.
The fact that policies around population levels have not been considered since that
time seems reason itself for a review at this time.

7
1. Isle of Man Population Projections
The Isle of Man Government has produced population projections after each census
since 1986 when the ‘Population Unit’ was first created. Population projections are
important for Government when considering its service provision for areas such as
education, health and social care, policing and other areas. It also forms an
important part of Government’s planning policy, particularly in relation to the
strategic and area plans.
The 2016-2036 Isle of Man population projections include three variants, each based
upon different possible scenarios of net annual migration:
1) a “Zero” variant, which projects total population growth if net migration
over the next twenty years (2016-2036) summed to zero;
2) a “Moderate” variant, which projects total population growth if net migration
over the next twenty years (2016-2036) adds a net total of 500 persons to
the Isle of Man population, distributed by sex and age according to the
migration patterns observed over the past ten years (2006-2016); and
3) a “High” variant, which projects total population growth if net migration over
the next twenty years (2016-2036) adds a net total of 1,000 persons to the
Isle of Man population, distributed by sex and age according to the migration
patterns observed over the past ten years (2006-2016).
Age group 2016 Census 2036, Zero
variant
2036, Moderate
variant 2036, High
variant
0-15 14,233 11,835 16,195 19,919
16-64 51,876 43,743 50,962 58,022
65+ 17,205 21,305 22,715 23,111
Total 83,314 77,875 89,872 101,051
Further detail on the assumptions used is contained in Appendix 1.

8
2. Declining Fertility
The number of births on the Island has fallen dramatically in recent years. Falling
fertility rates are not a unique issue to the Isle of Man, with nearly all developed
countries around the world having to respond to the consequences that falling birth
rates present to their economies and societies.
The most common comparator across countries for fertility is the Total Fertility Rate
(TFR) which is the number of children a woman would have if she were to pass
through the child bearing years (16 to 46), bearing children according to the age
specific fertility rates (which is simply the number of children born to women at a
given age).
In order to maintain a constant population, excluding migration, a total fertility rate
of 2.1 is required, and is known as the ‘replacement rate’. In the developed world,
most countries do not achieve this, for example in 2011, of the EU member states,
only France and Ireland came close to achieving this rate at 2.01 and 2.05
respectively.
Current Situation in the Isle of Man
Fertility rates on the Island have generally been on a downwards trend since 1996,
with the exception of 2011 where the rate recovered, only to continue to fall to 1.69
in 2016.
1986 1991 1996 2001 2006 2011 2016
Fertility Rate 1.79 1.83 1.94 1.64 1.73 1.89 1.69
Part of the explanation for the fall in the fertility is that there has been a decline in
the number of women on the Island of child bearing age of 8% (16,590 in 2011 to
15,223 in 2016) and this will have had an impact upon the fertility rate. However the
fertility rate has fallen by over 11% during that period and therefore there must be
additional factors on Island which have resulted in fewer children.
Notably, the number of subsequent children that women are having on the Island
has fallen considerably since 2012, with the number of first time mothers having
decreased slightly over that same period, as shown in Figure 3.

9
Figure 3 Number of births, by first and subsequent children
In the four years since 2012, the number of subsequent births has fallen by 16%,
and first child births have fallen by 9%.
Due to the falling number of births on the Island, the Isle of Man is now
experiencing a naturally declining population, which is the normal standard for the
Island, as the only time that the Island has had a naturally increasing population
since 1960 is during the period between 2001 and 2014, and in 1998.
Figure 4 Naturally Changing Population
Causes of lower fertility
Throughout various studies and literature there are a number of causes linked to
lower fertility. There have been a number of structural changes as society across the
0
100
200
300
400
500
600
2012 2013 2014 2015 2016Births - First Child Births - Subsequent Children
-600
-400
-200
0
200
400
600
800
1000
1200
1960
1962
1964
1966
1968
1970
1972
1974
1976
1978
1980
1982
1984
1986
1988
1990
1992
1994
1996
1998
2000
2002
2004
2006
2008
2010
2012
2014
2016
Births Deaths Natural Change

10
developed world that have fed into lower fertility rates, but there are also areas that
can be influenced by policy:
• Greater access and longer period of education for women which increase the
age at which women have their first child, and therefore reducing the number of
years available to have subsequent children.
• High labour force participation of women, which, depending on the policies in
a given country, has increased the opportunity cost of leaving the workforce,
particularly where existing policies result in an incompatibility between professional
and family roles.
• Changes in personal values that emphasise self-realisation and freedom from
traditional authorities, such as a change in the nature of relationships away from
marriage and towards cohabitation.
• State pension systems that mean the elderly do not need the support of their
own children, in financial terms.
• Modern contraceptive methods which whilst primarily serve to delay
childbearing can have an impact upon the number of children someone may have.
• Economic crises can have an impact, although generally they result in a
postponement of childbearing, but longer crises may have a longer lasting effect.
• Changing societal and cultural norms, such as those determining the division
of home responsibilities and the welfare and tax systems that may or may not
support this.
• The greater delay in young people being able to move to independent living,
due to issues around income and access to housing which may have an impact upon
when they begin having children.
Consequences of lower fertility
The consequences of lower fertility upon a country are significant and wide ranging,
from the provision of services by Governments, economic growth and political
changes. Due to the impact that low rates of fertility can have upon a country, it
may pose a greater problem to society than longer life expectancy at old age, as
lower fertility can rapidly increase the pace at which a society ages. The main
consequences of low fertility rates are:
• A smaller working population in the longer term, which will reduce production
and therefore limit economic growth. A smaller working population is likely to further
exasperate skills shortages that are already being experienced.
11
• Many social security systems, including the Island’s, operate on a pay as you
go principle, and with a reduced working population, there will be lower
contributions, resulting in potentially high spending deficits or needing make steep
increases in taxes and social contributions.
• A growing number of individuals who have no, or few, immediate family ties,
who are then likely to increase the demand for formal care services, which will need
to be provided by the Government or private sector.
• Social cohesion may suffer as a greater burden may fall upon the working
population, and particularly the younger working population who will be shouldering
the burden for the longest, however older generations may hold greater political
power due to size of their population versus the younger population. This may be
deepened further if policies which benefit the young are sacrificed in order to
support the social security systems.
Policy Responses
As previously mentioned, due to the highly private nature of deciding whether to
have children, be that the first or subsequent children, many countries within the
developed world have generally avoided the implementation of specific policies
designed to increase fertility rates. Instead many policies are shaped to address
other areas such as child poverty, early year’s education or gender equality, with a
secondary benefit to fertility rates.
The policy responses broadly fall into four categories:
• Financial incentives;
• Support for parents to combine work and family responsibilities;
• Childcare provision; and
• Maternity and parental leave
Financial Incentives
Financial incentives often take three form forms:
• Child related cash payments, which may either be regular payments for each
child, such as Child Benefit, or one off payments when each child is born (or at any
other given age). Typically this type of benefit has been targeted at reducing child
poverty, especially with the benefit being paid to the mother, as they are more likely
to be used for the child’s benefit.
• Tax expenditures, either in the form of tax reductions/allowances or tax
credits, based upon the presence of the child. These can be used either to offset the

12
cost of children or to increase mothers’ return to work. These kinds of incentives are
less likely to be directly spent on children, however administration costs are often
generally lower than providing cash benefits.
• Subsidies and subsidised services, such as housing subsidies the offer explicit
support to families with children, or at least more favourable conditions. Subsidies
services would cover education, medical and dental services, public transport and
recreation services which aim to reduce the cost of children.
However where tax and benefit systems treat different types of relationship
differently (such as marriage and cohabitation) these policies can also harm fertility
rates, particularly among the young who are more likely to cohabit more than
previously has been the case.
Support for parents to combine work and family responsibilities
Policies in this area are often designed to make it easier for parents, most often
mothers, to return to the labour market after having children. Policies in this area
often relate to retraining opportunities, the ability to request flexible working hours
and measures to encourage a more equitable division of family responsibilities
between men and women. For example in Sweden parents have a legal right to
reduce their working hours by 25% until the child turns 8 and each parent is entitled
to temporary parental leave of up to 120 days a year, until the child turns 12, for
staying at home looking after sick children.
Childcare Provision
Childcare provision falls into two areas, of availability of childcare and the cost of
childcare. Further to this, the childcare needs to also be of a quality that parents,
and children, will value and therefore make use of. Childcare provision also links to
the ability to support parents to combine work and family responsibilities that it
allows parents the time to return to work. There are different approaches across
countries, which often have varying impacts upon one or the other, and rarely are
aspects combined successfully. For example countries that rely upon private
provision of childcare are likely to have a high level of availability of childcare, but
the cost of the childcare is high. Comparatively those that have greater levels of
public provision, the cost to the household maybe lower, but availability maybe
diminished and tax rates maybe higher to support these costs.
As a comparison, for a household of two pre-school children, the cost of childcare
can often be up to 50% of the gross household income of a UK family, whereas in
Sweden the cost is 10% or less.

13
Maternity and Parental Leave
Parental leave, particularly maternity leave, is a feature of most developed countries,
however depending upon its design, they can harm mothers’ career prospects and
financial security which may dissuade women from having a child, or subsequent
children. Whether the maternity leave is paid or unpaid can also significantly impact
the benefit that parental leave policies are able to have. Parental leave policies can
however also work against gender equality if they favour the mother as it may
prevent equal sharing of responsibilities due to fathers being unable to take similar
time off.
The current capacity for childcare providers on the Island is also very limited, with
only enough places available for 5.2% of 0-2 year population (with a further 3.0%
provided by individual child minder services) and 80% of 3-5 year olds, whereas the
exemplar countries achieve around 50% of 0-2 year olds and 90%+ for 3-5 year
olds. Further work is also needed to investigate the provision of care for children
with disabilities, which has not been possible to analyse from the data available in
the census, however the Department of Education, Sport and Culture consider this
to be an area for futher investigation.
14
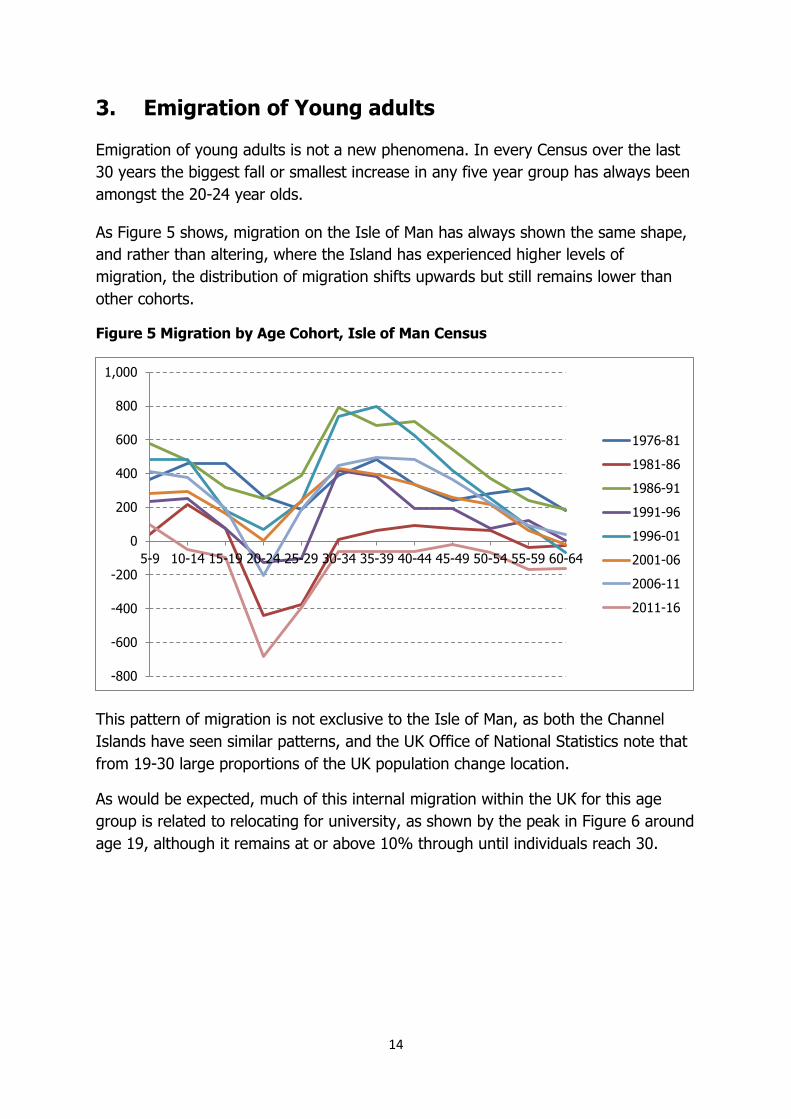
3. Emigration of Young adults
Emigration of young adults is not a new phenomena. In every Census over the last
30 years the biggest fall or smallest increase in any five year group has always been
amongst the 20-24 year olds.
As Figure 5 shows, migration on the Isle of Man has always shown the same shape,
and rather than altering, where the Island has experienced higher levels of
migration, the distribution of migration shifts upwards but still remains lower than
other cohorts.
Figure 5 Migration by Age Cohort, Isle of Man Census
This pattern of migration is not exclusive to the Isle of Man, as both the Channel
Islands have seen similar patterns, and the UK Office of National Statistics note that
from 19-30 large proportions of the UK population change location.
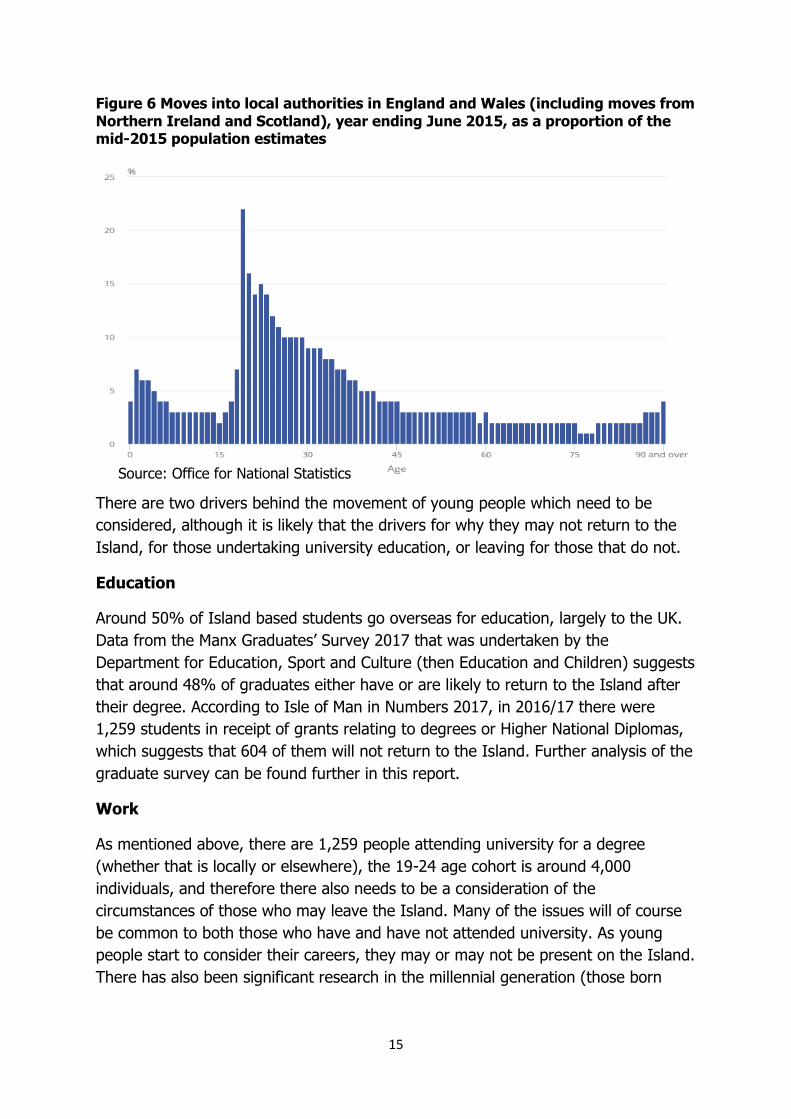
As would be expected, much of this internal migration within the UK for this age
group is related to relocating for university, as shown by the peak in Figure 6 around
age 19, although it remains at or above 10% through until individuals reach 30.
-800
-600
-400
-200
0
200
400
600
800
1,000
5-9 10-14 15-19 20-24 25-29 30-34 35-39 40-44 45-49 50-54 55-59 60-64
1976-81
1981-86
1986-91
1991-96
1996-01
2001-06
2006-11
2011-16
15
Figure 6 Moves into local authorities in England and Wales (including moves from Northern Ireland and Scotland), year ending June 2015, as a proportion of the mid-2015 population estimates
There are two drivers behind the movement of young people which need to be
considered, although it is likely that the drivers for why they may not return to the
Island, for those undertaking university education, or leaving for those that do not.
Education
Around 50% of Island based students go overseas for education, largely to the UK.
Data from the Manx Graduates’ Survey 2017 that was undertaken by the
Department for Education, Sport and Culture (then Education and Children) suggests
that around 48% of graduates either have or are likely to return to the Island after
their degree. According to Isle of Man in Numbers 2017, in 2016/17 there were
1,259 students in receipt of grants relating to degrees or Higher National Diplomas,
which suggests that 604 of them will not return to the Island. Further analysis of the
graduate survey can be found further in this report.
Work
As mentioned above, there are 1,259 people attending university for a degree
(whether that is locally or elsewhere), the 19-24 age cohort is around 4,000
individuals, and therefore there also needs to be a consideration of the
circumstances of those who may leave the Island. Many of the issues will of course
be common to both those who have and have not attended university. As young
people start to consider their careers, they may or may not be present on the Island.
There has also been significant research in the millennial generation (those born
Source: Office for National Statistics
16
between 1980 to 2000) regarding what they want from their employers and
workplaces.
It should however be acknowledged that there will always be an element of this
cohort that will look to leave the Island regardless of what is on offer, as the draw of
places like London or other large cities is always likely to be present.
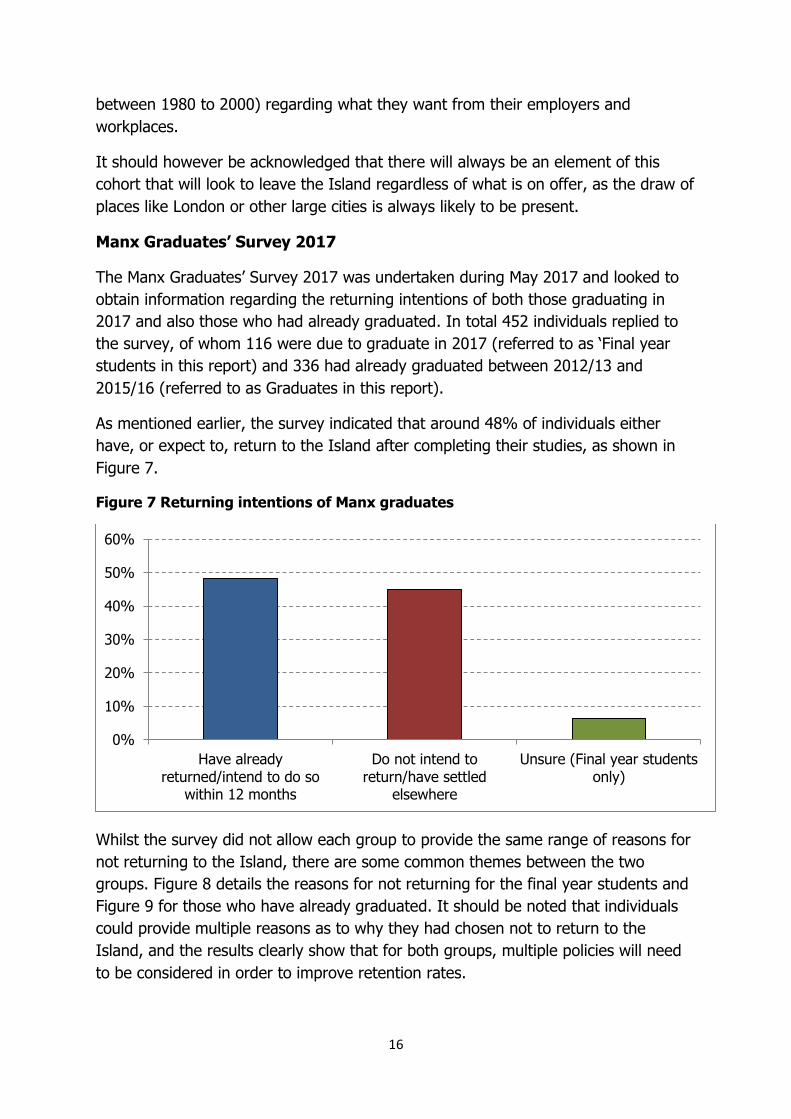
Manx Graduates’ Survey 2017
The Manx Graduates’ Survey 2017 was undertaken during May 2017 and looked to
obtain information regarding the returning intentions of both those graduating in
2017 and also those who had already graduated. In total 452 individuals replied to
the survey, of whom 116 were due to graduate in 2017 (referred to as ‘Final year
students in this report) and 336 had already graduated between 2012/13 and
2015/16 (referred to as Graduates in this report).
As mentioned earlier, the survey indicated that around 48% of individuals either
have, or expect to, return to the Island after completing their studies, as shown in
Figure 7.
Figure 7 Returning intentions of Manx graduates
Whilst the survey did not allow each group to provide the same range of reasons for
not returning to the Island, there are some common themes between the two
groups. Figure 8 details the reasons for not returning for the final year students and
Figure 9 for those who have already graduated. It should be noted that individuals
could provide multiple reasons as to why they had chosen not to return to the
Island, and the results clearly show that for both groups, multiple policies will need
to be considered in order to improve retention rates.
0%
10%
20%
30%
40%
50%
60%
Have alreadyreturned/intend to do so
within 12 months
Do not intend toreturn/have settled
elsewhere
Unsure (Final year studentsonly)

17
Figure 8 Reason for not returning to the Island, Final Year Students
Figure 9 Reason for not returning to the Island, Graduates
The availability of careers is a clear similarity between the two groups, with nearly
80% in both groups citing a career related reason for not returning to the Island. It
is notable, however, that housing appears to be less of an issue for those who have
graduated prior to 2017, and may be a reflection of the fact that they have begun a
career where this cost may not be as significant for them.
The survey also provided individuals an opportunity to provide suggestions regarding
improvements to those aspects of Island life that may encourage them to return to
the Island. These responses have been coded by Economic Affairs in order to
0%
10%
20%
30%
40%
50%
60%
Housing tooexpensive
High cost of travelto/from Island
Desired/chosencareer not available
on Island
Poor career prospects
0%
10%
20%
30%
40%
50%
60%
70%
80%
90%
Better careerprospects
Additionaleducation
Moreaffordablehousing
Better financialposition
Betteropportunities
for futurefamily
Better sociallife

18
analyse respondents’ suggestions. The data provided relates to suggestions provided
by the Graduates group, with feedback from 180 individuals. The results of these
responses are shown in Figure 10.
Figure 10 What could be improved to encourage graduates to return to the Island
As shown, career related issues account for over 40% of the responses from the
Graduates group. The detail behind this reason provides some further information
into the types of career that graduates are looking to move into.
Law Environmental Science Film/Animation Architecture Construction Biomedicine/Technology Sports Events Civil Engineering
Where no specific career or sector was mentioned, the most common statement
cited a desire for a greater variety of graduate opportunities in general. There was
also a significant number of individuals who specifically addressed the desire for
better diversity of job opportunities by directly highlighting their belief that the only
options available to them revolved around finance.
After career related options, the most common responses related to improving the
travel options on the Island, where cost of travel was specifically highlighted,
alongside improving the availability of affordable housing. As expected there were
some respondents who have no intention of returning to the Island regardless of
what might be improved.
0%
5%
10%
15%
20%
25%
30%
35%
40%

19
Millennials in work
It is clear from the graduate survey that employment opportunities are a major, but
not isolated, factor shaping young people’s decisions about where to locate
themselves. However, alongside providing those opportunities to enter the
workplace, research for PwC and Deloitte has suggested that millennials want and
expect different experiences and outcomes from their careers as well. The PwC
report1 highlights eight key areas that employers will need to adapt to in order to
attract and retain workers from the millennial generation, particularly as it is
estimated that they will make up 50% of the world’s working population by 2020.
The report highlights the following features of this section of the workforce:
Millennials are likely to be less loyal towards an employer than previous
generations, with 54% expecting to have between two and five employers,
and over 25% expecting to have six or more employers. This fact links into
the other features of the workforce, that if they do not find an employer to be
meeting other expectations, as shown further in this report, they are more
than happy to move to another employer who might.
The survey found that 72% of millennials made some kind of compromise
when finding their current position in order to get into work. However, as
economic fortunes improve in many economies, these compromises may no
longer seem necessary, with 38% saying they are actively looking for a
different role and 43% being open to offers.
Development and work/life balance are highly valued benefits from
employers: opportunities for further development and flexible working are the
top two desired benefits, with cash bonuses coming in third. Flexible working,
however, extends not only to the hours that they work, but also how and
where this work is done, focussing on the outcome of the work rather than
the number of hours put into achieving it.
Millennials seem to be less tolerant of broken promises particularly around
issues of flexible working and diversity, with 28% feeling they had been over-
promised the opportunities for flexible working, and over 50% concerned that
whilst companies talked about diversity, they did not follow through with this.
A defining feature of this generation is that they have grown up with digital
technology throughout their lives, and this is reflected in their working
practices in the expectation that an employer should be making good use of
IT as part of their business. This feature, however, can also be a flash point
for conflict within companies, as many millennials appear to believe that they
are being held back by rigid and outdated working styles.
1 Millennials at work Reshaping the workplace, PwC, 2011 https://www.pwc.com/m1/en/services/consulting/documents/millennials-at-work.pdf

20
Career progression is also important, with 52% of millennials saying that
the ability to progress quickly through an organisation was the main attraction
of any employer, over and above salaries.
Millennials also strongly want to work for employers that they are attracted to
as consumers. It appears that branding is important, particularly when it
comes to corporate social responsibility. There is also some evidence, in some
countries, that millennials are put off from working in entire sectors; for
example in Switzerland, 30% of millennials said they would not work in
Banking & Capital Markets.
They also have a strong desire to work overseas, with 71% expecting and
wanting an overseas assignment at some point during their career.
Whilst millennials state that they are comfortable working with older
generations, especially if they provide a mentoring role, there are some signs
of intergenerational tension, particularly around senior management being
unable to relate to younger workers, or the perception that millennials’ high
personal drive was intimidating to older workers.
The Deloitte report2 findings agree with those of PwC, however Deloitte’s findings
also expand upon the millennial belief that businesses can be a force for good and
that their performance should include more than just financial performance. As part
of this, millennials are also looking for a sense of empowerment, that their jobs have
meaning or that they are able to make a difference.
Value of local education
Many universities provide significant benefits to host areas, as highlighted by Oxford
Economics3 who conducted a study into the value of universities to the UK economy.
Most notably they stated that universities have a gross value added multiplier of
2.17 (for every pound of gross value added, £1.17 is supported elsewhere in the
economy) and an employment multiplier of 2.07 (for every 100 jobs, 107 are
supported in other industries), which is higher the spending in public administration
& defence or the health sector.
As shown earlier in this report, university education is a significant driver of
migration of young people throughout the UK and also from the Isle of Man. At the
moment the Island has a limited higher education offering for inward migration and
focuses on local provision for local residents. It is estimated that Isle of Man
students spend around £11 million per annum on tuition with UK institutions, money
that could, in theory, be spent on Island.
2 The 2017 Deloitte Millennial Survey, Deloitte, https://www2.deloitte.com/global/en/pages/about-
deloitte/articles/millennialsurvey.html 3 The economic impact of UK Universities, 2014-15, Oxford Economics.

21
Isle of Man students mainly attend North West Universities. Table 1 shows the
distribution the proportion of students from the Isle of Man, which suggests that the
Isle of Man is supporting the North West economy by £3.3m in tuition fees, and
potentially a further £2.4m in other spend, as it is estimated that £8m per year is
spent by Manx students in the UK, of which around £0.5m of VAT is incurred on this
spending.
Table 1 Distribution of Manx Students 2011/12
Region Number of Students %
North East 88 7%
North West 350 30%
Yorkshire and The Humber 175 15%
East Midlands 68 6%
West Midlands 68 6%
East of England 28 2%
London 72 6%
South East 92 8%
South West 76 6%
Subtotal (England) 1,023 86%
Wales 56 5%
Scotland 96 8%
Northern Ireland 12 1%
Total 1,186 100%
In 2011/12, the Higher Education Statistics Agency published student retention data
of students, and it is clear, as shown in Table 2, that the Islands have a low, but not
unusual level of graduate retention.
Table 2 Student return rates by region, 2011/124
Region Distribution
North East 77%
North West 76%
Yorkshire and The Humber 64%
East Midlands 61%
West Midlands 69%
East of England 56%
London 79%
South East 59%
South West 65%
Wales 75%
Scotland 88%
Northern Ireland 79%
4 This is the latest freely available data from the Higher Education Statistics Agency by region. The latest survey suggests that our return rate of students may have fallen slightly since 2011/12.
22
Guernsey, Jersey and the Isle of Man 59%
UK Average 70%
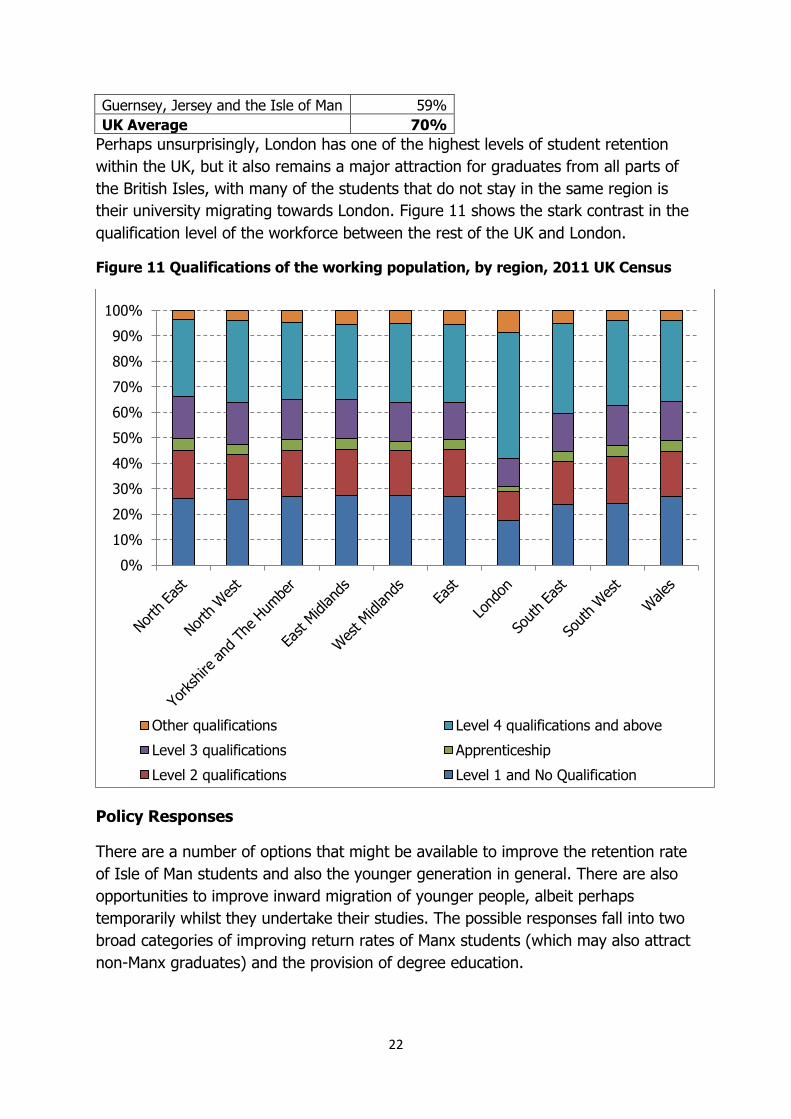
Perhaps unsurprisingly, London has one of the highest levels of student retention
within the UK, but it also remains a major attraction for graduates from all parts of
the British Isles, with many of the students that do not stay in the same region is
their university migrating towards London. Figure 11 shows the stark contrast in the
qualification level of the workforce between the rest of the UK and London.
Figure 11 Qualifications of the working population, by region, 2011 UK Census
Policy Responses
There are a number of options that might be available to improve the retention rate
of Isle of Man students and also the younger generation in general. There are also
opportunities to improve inward migration of younger people, albeit perhaps
temporarily whilst they undertake their studies. The possible responses fall into two
broad categories of improving return rates of Manx students (which may also attract
non-Manx graduates) and the provision of degree education.
0%
10%
20%
30%
40%
50%
60%
70%
80%
90%
100%
Other qualifications Level 4 qualifications and above
Level 3 qualifications Apprenticeship
Level 2 qualifications Level 1 and No Qualification

23
Improving return/retention rates
The data from the Manx Graduates’ Survey 2017 shows that there is a clear
gap between perception and reality of what careers are available on the
Island. A number of the sectors that were directly named by respondents are
already present on the Island. Improving the Island’s presence at recruiting
or employer fairs at UK universities, particularly those in the North West of
the UK may help to alter this perception and encourage students to return.
Increasingly universities are offering sandwich degree courses which provide
the opportunity for students to spend a year in industry prior to undertaking
their final year of studies. In many cases these years in industry have to be
arranged by the students themselves, and therefore a scheme that creates a
portal or ‘one stop shop’ that brings together students and employers could
yield results, particularly if it was marketed via the universities. This may help
students to find an employer that they may wish to return to after graduating.
A graduate internship scheme could also help to improve the perception gap
that many students appear to have of the Island’s economy. In order to be
seen as worthwhile however the scheme would need to ensure that
participants received tangible benefits for it, particularly as there is a
perception in the UK at the apprenticeship scheme is used by some employers
to access cheaper labour. This scheme could be supported by Government in
terms of a central portal that graduates and employers could make use of,
and the scheme could be supported perhaps by tax incentives such as
National Insurance relief or holidays, however there would need to be
measurable benefits to the graduate for an employer to qualify.
In order to address the need for affordable housing, for all young people,
Government develop a first time buyers scheme specifically for young people
or graduates or at least a scheme which addresses this need. The need for
such support was shown by the Isle of Man Housing Market Report 20165
which showed that housing affordability for young people is currently at 9.75
times the median salary for under 25s for a lowest quartile house. In doing
this, such a scheme would help to encourage younger people to ‘put down
roots’ on the Island and improve the likelihood of them staying on Island.
Whilst the provision of social activities is generally best left to the private
sector, and requires a critical mass of demand to be viable, the Government
could consider a scheme to underwrite or financially support facilities that are
attractive to young adults in order to counter the perception of there being
‘nothing to do’. The cost of travel and cost of living were also identified by the
Graduate Survey as key issues which will need to be addressed.
5 Isle of Man Housing Market Review 2016, Economic Affairs, Cabinet Office,
https://www.gov.im/media/1356177/2016-housing-market-report.pdf

24
Provision of higher education
The Manx Graduates’ Survey suggests that there is a significant proportion of
graduates who are looking to further the studies (35% of the Graduate
group) and therefore institutional partnerships with UK universities that are
able to provide Masters and Doctorate level qualifications in some areas may
help in retaining students and also bringing in non-Manx students.
Development of an ‘Isle of Man Campus’ that one or more UK universities
could use as a site for the provision of parts of courses in the Isle of Man,
which would both help to capture more of the spend of Manx students who
go to the UK to study and also bring over UK students for sections of a course
or full degree programmes. Examples such as the University of Central
Lancashire in Cyprus show that this model is possible, particularly if the
campus also provides research and development facilities, as such activities
are important to universities being able to fund themselves.
Such a campus, depending upon the specialities present, may also attract
companies looking to benefit from the research and development being
undertaken, which may provide job opportunities for graduates to return to.
A change in attitudes
As the PwC and Deloitte studies have found, there also needs to be a change in
attitudes from employers, both public and private, in order to retain the younger
generation of workers, who, if they cannot find what they are looking for, appear
more than happy to relocate in order to do so.
The reports also make clear that some employers are successful at adjusting to
these attitudes, and Government could set up or support a forum that allows
employers to share best practice in regards to employment or provide support and
training to employers to adapt.

25
4. Growing population of older people
Regardless of whether the Isle of Man is successful in attracting working age
individuals to migrate to the Island, it is, like many European countries, going to face
a growing population of older people.
A growing populatin of older people primarily present issues for the provision of
public services, concerning health and social care, housing and pensions amongst
other things, which were first highlighted in report in 2013 titled ‘Research into
threats and opportunities of an ageing population in the Isle of Man’6. As shown by
the population projections, the over 65 population is expected to increase from
17,205 in 2016 to at least 22,453, an increase of 30%. Whilst improving life
expectancy should be hailed as a success of any country, it does present issues that
have to be addressed, in terms of funding state pensions for longer than ever before
but also that where possible increases in life expectancy are matched or exceeded
by improvements in health life expectancy. If not, health and social care services are
going to be placed under increasing strain to meet these demands.
Figure 12 shows how the Island’s Over 95 population has grown over the last 40
years.
Figure 12 Over 95 Population
6 Research into the threats and opportunities of an ageing population in the Isle of Man, Isle of Man
Government https://www.gov.im/media/1347343/ageing-population-report.pdf
0
50
100
150
200
250
1971 1976 1981 1986 1991 1996 2001 2006 2011 2016

26
High level Impact of an increasingly older population
As mentioned at the beginning of this section, an increasingly older population
presents issues in relation to the funding of state pensions, and also of health and
social care for older people, as well as for housing and other things. These have not
formed part of this paper as work has already been undertaken by Treasury in
respect of the new Manx State Pension which will be introduced from April 2019, and
the Council of Ministers Social Policy Sub-Committee is investigating issues around
the funding of health and social care for older people and will report in July 2018 on
the residential and nursing care dimension. Information gleaned from the 2011 and
2016 censuses in respect to the age at which people enter residential and nursing
care is presented below.
An older and changing population also has impacts for various other services such as
the Emergency Servics who may come under additional pressure if an ageing
population requires them to become more involved in social care in dealing with a
greater risk of falls in the home, fire risks and the Police having to provide further
support to ambulance calls.
Based upon the Island’s current annual net expenditure on health and social care,
the table below represents a projected estimate of increases in annual health care
costs, both for the total projected population and for the group aged 65+. It is
estimated that, by 2036, population aging alone will account for approximately 15%
of increases in health care costs.
Whilst no data relating to health care spending by age is available for the Isle of
Man, data from the Organisation for Economic Co-Operation and Development
(OECD)7 has been used and applied to the Department for Health and Social Care’s
net expenditure. These estimates only take into account the additional cost of the
ageing population based upon today’s expenditure, any increase in the cost of
services and treatments above today’s prices would result in a greater increase.
Table 3 Estimated projected Health and Social Care Expenditure
Health Costs 2016 2036 (+500) 2036 (+1,000)
Total 209,996,685 243,729,677 262,811,434
% Increase
16.1% 25.2%
65+ Population 17,205 22,715 23,111
65+ Annual Cost 86,373,298 118,206,851 117,406,034
% Increase of 65+ annual cost
36.9% 35.9%
7 OECD Statistics, Health, Health Expenditure and Financing, Expenditure by disease, age and gender
under the System of Health Accounts (SHA) Framework, Current health spending by age, http://stats.oecd.org/Index.aspx?DataSetCode=SHA

27
% Increase of total cost due to 65+ annual cost
15.16% 14.78%
Social Care
Using the 2016 Census as a benchmark we can assess the likelihood of older
persons needing residential or nursing care. The incidence is as follows.
Age
% in Residential or Nursing Care in 2011
% in Residential or Nursing Care in 2016
60-64 0.31% 0.50%
65-69 0.95% 1.00%
70-74 1.23% 1.50%
75-79 2.86% 3.00%
80-84 7.54% 6.20%
85-89 15.16% 13.30%
90-94 32.35% 22.80%
95-99 48.84% 40.70%
100+ 67% 55.60%
Based on the average size of a residential or nursing care home staying the same,
and if behaviour is not changed, as the population ages around a further 200
nursing or residential care beds would be required by 2036 (around 10 a year) just
to meet additional demand due to aging. Active aging policies are likely to constrain
the numbers needing care and help the social care system deal with increasing
demand over this period. The nature of accommodation available might also have an
impact, and the availability of care and extra care will also make a difference.

28
5. Active Ageing Index
The generally accepted response to ageing societies that are being experienced all
over the developed world is to promote “active ageing”, which is being led by the
United Nations Economic Commission for Europe. This looks at prolonging healthy
life expectancy and focusses on four domains of an older persons life:
1) Employment
2) Participation in Society
3) Independent, healthy and secure living
4) Capacity and enabling environment for active ageing
As mentioned, prolonging healthy life expectancy creates economic benefits and
defers costs. Monitoring each of these domains, and improving areas upon where
weaknesses are identified, helps to ensuring that these people live active, healthy
lives that contribute economically. It also helps to redress some of the stigma that
has been developing across a number of countries that the ageing population is
placing a burden upon economies, and instead looks at the benefits that such a
population can have and provide.
Employment
The trend towards more people working later in life continued in 2016. Despite a
small fall in the proportion of 65 to 69 year olds in work the overall level of activity
for over 65’s increased from 10.2% to 10.9%. These figures are broadly in line with
those seen in the 2011 England and Wales Census.
Figure 13 Proportion of over 65's Economically Active 2001-2016
0%
5%
10%
15%
20%
25%
2001 2006 2011 2016
65-69
70-74
75+

29
The economic benefits of people remaining in work longer are relatively clear,
particularly is it improves their spending power within the economy, however being
in work also provides numerous psychological benefits to individuals which may help
when looking to improve health life expectancy. In particular being in work is
associated with improved recovery from illness and reduces the likelihood of
developing long term conditions. It also helps to keep people alert and provides
social interaction that may otherwise be missing.
In this regard, the Isle of Man performs well when compared with the other 29
countries that have taken part in the Active Ageing Index. The Island would rank 2
out of 29 European countries in terms of employment. Only Sweden has a higher
proportion of older people in work.
The full employment domain analysis is available in Appendix II.
Participation in Society
Whereas the employment domain considers paid work, the participation domain
focuses on the value that older people provide to the others through volunteering,
providing child care, looking after parents and also how politically active they are.
The value of these activities can be particularly high given the cost of both child care
and nursing or care homes. An estimate in the UK is that grandparents save parents
around £1,900 a year in childcare fees by providing an average of 9 hours.
Perhaps surprisingly the proportion of over 55’s volunteering weekly is lower than in
other countries. Where the Island scores highly is in the proportion of over 55’s
looking after older adults.
In the 2016 Social Attitudes Survey around 38% of respondents over 55 took part in
some voluntary activity. Around a quarter of these did so on a weekly basis,
amounting to around 9.5% of the over 55 population.
The Isle of Man would rank first out of 29 European countries in respect of
participation in society, and the full domain analysis is available in Appendix III.
Independent, Healthy and Secure Living
This domain focuses on how well older people are able to look after themselves and
addresses physical and mental health alongside their financial ability to support
themselves.
Compared with the other domains in which the Isle of Man performs strongly, this
domain is weakest area for the Isle of Man, coming 13 out of 29 countries under this
section. Whilst physical safety and lifelong learning were amongst the highest seen
anywhere, relative median income was the second lowest in Europe with poverty risk
also very high.

30
The full analysis of this domain is available in Appendix IV.
Capacity and enabling environment for active ageing
The final domain addresses the ability for older people to ‘actively’ age, such as
monitoring both life expectancy and health life years of that life expectancy, but also
their mental well-being, their use of ICT, social connectedness and educational
entertainment. These factors are important as they can facilitate or hinder active
ageing in the other domains.
The Isle of Man ranks 3 out of 29 in this domain, with the full analysis available in
Appendix V.
Areas of improvement from Active Ageing Index
Whilst the Isle of Man performs relatively well across most of the domains, there are
some areas the Island may need to address:
1. That relative poverty is an issue for many older people, as shown in the
Household Income and Expenditure Survey 2012/13 with the lowest quartile
by income of over 65 households spending more than they receive in income,
although this same situation was also present for under 65 households.
2. That strong family ties still allow a lot of care of older people to be done by
family members, and vice versa in respect of childcare, however with
migration, some of these family ties may be broken and place a greater strain
on formal care services.
3. That older people need to be encouraged to be more active.

31
6. British Irish Council Demography Work stream
Alongside the work undertaken in this report, a significant amount of work regarding
populating ageing was undertaken as part of the Isle of Man’s involvement with the
British Irish Council’s demography work stream which specifically looked at the
challenges presented by such a demographic shift and took case studies and
exemplar policy responses from the various jurisdictions into how they were
addressing their population challenges in regards to ageing.
The report8 highlights a number of responses that the various jurisdictions are
undertaking, some of which are briefly noted below but are more fully detailed in the
work stream report.
Public/Private schemes to help employers support people to work for longer,
including retraining, flexible and part time working, and improving
occupational health awareness.
Incorporating into designs of public spaces and other public areas so that the
older population are not excluded by certain design features.
Creation of mixed, extra care housing schemes, which provide suitable
housing for people with a range of care and support needs, but also ensures
they still have interaction with the wider community.
Schemes to making societies ‘age friendly including allowing different
generations to work together, such as younger generations helping older ones
with technology.
Many of the responses that have been undertaken by the various jurisdictions
complement the concept of active ageing and could be replicated on the Island as
many of the schemes are transferable from a larger jurisdiction such as England or
Scotland to the Island.
The report also includes a detailed backstory across all of the jurisdictions as to
every jurisdiction has ended up in a similar place. This backstory is available in
Appendix VI.
8 Populating – Ageing – Society, British Irish Council 2016,
https://www.britishirishcouncil.org/sites/default/files/ebook/Demography%20report%202016/ebook/mobile/index.html#p=38

32
7. Summary of Recommendations
The recommendations in this report are as follows and are intended to create a
discussion around the types of initiatives that Government may wish to look to
undertake in order to address the population challenges that are presented by the
census results and the population projections.
Declining Fertility
Greater financial incentives either through child related cash payments, tax
allowances or subsidies which are aimed at offsetting some of the costs that
parents incur whilst looking after children
Looking to support parents in making it easier to combine work and family
responsibilities, such as retraining opportunities for those that have taken an
extended time out of work to look after children, a better availability of
flexible working or making it easier for parents to share parenting
responsibilities.
The availability and affordability of quality childcare was also highlighted as
an area for improvement given that there is only enough places for 8% of 0-2
year olds and 50% for 3-5 year olds.
Considering the balance of parental leave, which is currently heavily focussed
on maternity leave may also help to address issues around children, such as
allowing parental leave to be shared may help to share parenting
responsibilities.
Emigration of young adults
The Manx Graduates’ Survey 2017 showed a perception gap that the
Government could address by more effective marketing of employment
opportunities at university recruitment fairs and other similar events.
Creating opportunities for university students to undertake their year in
industry as part of studies on the Island may help to encourage both Manx
and non-Manx students to return to the Island after completing their studies.
The introduction of a graduate internship program that allows students, after
graduating, to gain experience with employers, with support provided to
employers through National Insurance relief
Developing a first time buyers scheme aimed at graduates and young people
to help improve the affordability of getting onto the housing market, which
helps them to put down roots on the Island.
Provide support to the private sector who may wish to provide leisure and
social facilities that young people value.

33
The Manx Graduates’ Survey shows a clear desire from young people to
undertake further studies after their degree, and establish partnerships with
UK universities to provide Masters and Doctorate qualifications.
Develop an ‘Isle of Man Campus’ as a centre of excellence in a given field, or
fields, that UK universities could use as a site to provide parts of their courses
on the Isle of Man.
As part of an Isle of Man Campus, help facilitate companies who are
interested in research and development to establish themselves close to the
site.
Help to improve employer awareness of the expectations and demands of the
millennial workforce which studies have found to differ from previous
generations.
Growing numbers in retirement
Relative poverty is an issue for some pensioners on the Island, although this
is not an issue exclusive to pensioners as highlighted by the Household
Income and Expenditure Survey 2012/13.
Whilst there are currently strong family ties on the Island which allows for
both older people to be cared for by their relatives, and for grandparents to
look after children, continued migration may lead to a situation where these
ties are broken and other services have to take on this responsibility
Whilst the Island performs well in most aspects of the Active Ageing Index,
continuing to encourage exercise and participation will be beneficial for both
the person concerned and the state.
A Plan to develop an additional 200 Nursing and Residential Care beds by
2036, alongside a funding regime to pay for them.

Appendix I : Isle of Man Population Projections
Methodological Summary
The Isle of Man 2016 population projections have been produced through
application of the intercensal cohort component method, with residual estimation of
net migration. The current projection model estimates population change to 2036,
and the model is based upon ten-year trend data for fertility, mortality, and single-
age net migration (up to age 90) estimated from residuals.
The intercensal cohort component method analyses annual fertility and mortality
data to reconstruct trends in natural population change, and incorporates
quinquennial population census data to estimate migration patterns from the
residual figure in excess of natural change.
Fundamentally, population dynamics are estimated as follows:
(1) Measuring the size of the population at a given point in time, typically
through census;
(2) Adding registered births and subtracting registered deaths within a
subsequent fixed period of time, to calculate natural population change;
(3) Measuring the size of the population at a second point in time, again
typically through census; and
(4) Subtracting total natural change from total population change to estimate
net migration.
Pt+n = survived population + births + net migrants,
where t=time of first census, n=time between census periods, and net migrants are
the residual produced by the remaining population components.
Once the fertility rate, mortality rate and net migration residual are calculated for
each age cohort by sex, a projection table is constructed wherein the baseline
population figures (in this case, from the Isle of Man 2016 Census) are projected
year by year for a total projection period of twenty years.
Each of the three major population components – fertility, mortality, and migration –
must first be examined separately and certain simple statistical results extracted
before these are built into the projection model. It is assumed that there is zero
error in the fertility and mortality components (i.e. that data extracted from IOM
General Registry on births and deaths 2006-2016 is correct and complete). Below
are brief descriptions of the process required for each population component.

35
Fertility
Annual fertility statistics from all years between 2006 and 2016 were collated. Age-
specific fertility rates (ASFR) were calculated for females between the ages of 16
and 46, and the mean of these single-age calculations for the years 2012-2016 was
the basis for updating the total population fertility rate (TFR) to 1.69.
TFR 2001 2006 2011 2016
IOM 1.64 1.73 1.89 1.69
UK 1.64 2.00 1.90 1.81
The ONS calculates the UK TFR on the basis of a single year’s data, while the Isle of
Man has traditionally calculated its TFR on the basis of a five-year trend, in order to
smooth fluctuation in the annual fertility rate that occurs as a result of the Island’s
relatively small population size. The Isle of Man’s total fertility rate has typically been
somewhat lower than the UK rate, but has followed the same general pattern of rise
and fall since 2001. Total fertility for the UK is projected to remain relatively stable,
at 1.86 between 2025-2030,9 and on observed trends we would expect total fertility
on the Island to strike close to this figure, albeit somewhat lower.
A TFR of less than 2.1 entails that the Isle of Man is classed as a low-fertility country
according to UN standards.10 World demographic trends assume that all countries
will eventually converge to a state of low fertility, and although fertility projections of
a high-fertility country would need to take the statistical assumption of declining
fertility into account, this is not necessary for the Isle of Man.
Note: While TFR for the Isle of Man is calculated every five years on the basis of the
five-year birth rate, the age-specific fertility rates (ASFR) used in the population
projection model is based upon the ten-year birth rate. TFR is a separate descriptive
statistic, which is not directly incorporated into the projection model.
Annual birth rates for male and female births were averaged across ten years to
produce the sex at birth ratio, and this ratio was the basis for the projection of male
versus female births in future years. Use of the sex ratio at birth affects the model to
the extent that, within sixteen years from the baseline year (2016), the projected
cohorts of females enter the ranks of childbearing age, and recursively affect the
fertility estimates for all successive years within the projection model. The 2016 five-
9 World Population Prospects: The 2017 Revision, Key Findings and Advance Tables. United Nations Department of Economic and Social Affairs, Population Division (New York: 2017). 10 World Population Prospects: The 2015 Revision, Methodology of the United Nations Population
Estimates and Projections. United Nations Department of Economic and Social Affairs, Population Division (New York: 2015).

36
year sex ratio at birth for the Isle of Man is expressed as 1.05 male births per female
birth.11
Mortality
Annual mortality statistics from all years between 2006 and 2016 were collected
from the General Registry, by way of the Public Health Division, where staff
members have been carefully examining and regularizing the Island’s mortality
records. Single-age sex-specific mortality rates (ASMR) were calculated for the total
population and a life table was constructed to determine age-sex specific
survivorship rates over ten years.
Note: It is widely known that life expectancy at birth has been steadily increasing in
developed countries for the past several decades, and that population ageing is a
pressing concern as the large post-war cohorts transition into retirement.
Improvements in health outcomes also indicate the likelihood that aged and super-
aged sub-populations will enjoy unprecedented survival rates. Recent findings of the
2016 IOM Lifestyle Survey suggest that life expectancy past age 65 is comparable on
the Isle of Man to rates estimated for the UK.12
The UN estimates that, in developed countries with high life expectancy, the total
life expectancy of females gains approximately 1.25 years every decade.13 It should
also be made clear that the high rates of increase in life expectancy are slowing in
recent years within developed countries, and may reach a plateau in the near future.
Life expectancy at birth in the UK is currently projected at 81.8 for 2015-2020, and
83.5 for 2025-2030.14
Migration
Migration is estimated on the basis of intercensal population change not accounted
for by annual fertility and mortality (the ‘residual’). Total population counts from the
2006, 2011 and 2016 IOM Censuses were used to determine population change in
excess of natural change, and sex-specific single-age migration rates were calculated
on the basis of this ten-year trend. This procedure was worked separately for each
sex in order to determine the average ratio of male to female migrants.
11 Male births normally outnumber female births, although the accepted upper limit is 1.07 – see Birth Ratios in Great Britain, 2010-14: a report on gender ratios at birth in Great Britain. UK Department of
Health, July 2016). 12 “A Healthy Island?” Isle of Man Director of Public Health Annual Report 2017. 13 World Population Prospects: The 2015 Revision, Methodology of the United Nations Population Estimates and Projections. United Nations Department of Economic and Social Affairs, Population
Division. 14 World Population Prospects: The 2017 Revision, Key Findings and Advance Tables. United Nations Department of Economic and Social Affairs, Population Division (New York: 2017).

37
The major dynamics of migration in the Isle of Man are discussed in greater detail
elsewhere in this paper. From a methodological perspective, it is important to note
that:
1) Total net migration rate between the 2006 and 2016 censuses was
positive
2) For the 2016 IOM projection model, net migration was estimated to age
90
3) The migrant sex ratio for 2006 to 2016 was 115.5 males to 102.4 females
4) Net migration 2006-16 was concentrated among the working age
population, accounting for 63.12% of total inward migration, and the
projection model reflects this observation
5) All population projections, and projection of migration in particular, suffer
in accuracy among cohorts of relatively small size, such as the aged
cohorts of the IOM population. Moreover, migration patterns among the
75+ age groups are highly variable by single age, and significantly
different for each gender. Projection of migration trends among the aged
cohorts should thus be interpreted with caution, as high internal variability
indicates the possibility that the overall trend is unstable and may change
in the future.
Figure 14 Female Migration (%), 2006 to 2016 trend
-15
-10
-5
0
5
10
0-1
3-4
6-7
9-1
0
12-1
3
15-1
6
18-1
9
21-2
2
24-2
5
27-2
8
30-3
1
33-3
4
36-3
7
39-4
0
42-4
3
45-4
6
48-4
9
51-5
2
54-5
5
57-5
8
60-6
1
63-6
4
66-6
7
69-7
0
72-7
3
75-7
6
78-7
9
81-8
2
84-8
5
87-8
8
Pe
rce
nta
ge
Mo
ve
me
nt

38
Figure 15 Male Migration (%), 2006 to 2016 trend
Population Projections
The IOM 2016 population projection includes three main variants, all based upon
projected migration scenarios. It is assumed in each variant that fertility and
mortality rates will remain constant based upon the ten-year trend. The zero trend
variant assumes that net migration will sum to zero, and shows only the rate of
natural change in the Island’s population; the moderate variant (“Mig. 500”)
assumes that migration rates will result in a net gain of 500 per annum, and the high
variant (“Mig. 1000”) assumes that migration rates will result in a net gain of 1,000
per annum.
Within the projection model, annual female age-specific migration was taken into
account in each single-age group before fertility is calculated for that single-age
group – in other words, female newcomers were counted towards the fertility rate in
each projection year. Since the majority of incoming females fall within the
reproductive age range, higher migration rate variants exert a secondary effect upon
projected birth counts.
In each of the three projection variants, projected migrants were distributed through
the population by age according to the current estimated age distribution of
migrants to and from Island.
As this paper considers the various aspects of the Island’s population, the following
tables and figures provide analysis of subsections of the Island’s population, in
-15
-10
-5
0
5
100-1
3-4
6-7
9-1
0
12-1
3
15-1
6
18-1
9
21-2
2
24-2
5
27-2
8
30-3
1
33-3
4
36-3
7
39-4
0
42-4
3
45-4
6
48-4
9
51-5
2
54-5
5
57-5
8
60-6
1
63-6
4
66-6
7
69-7
0
72-7
3
75-7
6
78-7
9
81-8
2
84-8
5
87-8
8
Pe
rce
nta
ge
Mo
ve
me
nt

39
particular the youth population (those aged 0-15), the working population (16 to
retirement age) and the retired population.
Table 4 Isle of Man Population by 2036
Zero Trend 500 Net Migration 1,000 Net Migration
Population by 2036 77,875 89,872 101,051
Percentage change from 2016
-6.5% +7.9% +21.3%
Figure 16 Projection of Isle of Man Population, 2016 to 2036
Table 5 Isle of Man Youth Population (0 to 15) by 2036
Zero Trend
500 Net Migration
1,000 Net Migration
Population by 2036 11,835 16,195 19,919
Percentage change from 2016 -16.8% +13.8% +39.9%
70,000
75,000
80,000
85,000
90,000
95,000
100,000
105,000
110,000
2016
2017
2018
2019
2020
2021
2022
2023
2024
2025
2026
2027
2028
2029
2030
2031
2032
2033
2034
2035
2036
Zero
Mig. 500
Mig. 1000

40
Figure 17 Isle of Man Youth Population, 2016 to 2036
Table 6 Isle of Man Working Age Population
Zero Trend 500 Net Migration 1,000 Net Migration
Population by 2036 46,005 53,437 60,702
Percentage change from 2016
-9.5% +5.2% +19.5%
It is important to note that the state retirement age is progressively increasing over
the period of the projections. The state pension age for men is currently 65 in 2016,
and for women it will increase from 60 to 65 between April 2010 and November
2018. The classifications of the retired population have been based upon the current
published increased state pension (as of February 2018) age for men and women
will increase from 65 to 66 between December 2018 and October 2020, from 66 to
67 between April 2034 and April 2036 and from 67 to 68 between April 2044 and
April 2046. These changes, as far as 2036, are incorporated into the 2016 population
projections when calculating the proportions of the working age versus the retired
populations. The positive slope effects in 2020 and 2034 in the line graph below
appear as a result of rolling changes in age of retirement. If the projection were
extended by an additional decade, another positive slope would appear in 2044.
10,000
12,000
14,000
16,000
18,000
20,000
22,0002016
2017
2018
2019
2020
2021
2022
2023
2024
2025
2026
2027
2028
2029
2030
2031
2032
2033
2034
2035
2036
Zero
Mig. 500
Mig. 1000

41
Figure 18 Isle of Man Working Age Population, 2016 to 2036
Table 7 Isle of Man Retired Population by 2036
Zero Trend 500 Net Migration 1,000 Net Migration
Population by 2036 20,035 20,220 20,405
Percentage change from 2016
+9.7% +10.7% +11.7%
As seen with the working age population, there are similar drops in the retired
population as the retirement age increases as detailed above.
Figure 19 Isle of Man Retired Population, 2016 to 2036
40,000
45,000
50,000
55,000
60,000
65,0002016
2017
2018
2019
2020
2021
2022
2023
2024
2025
2026
2027
2028
2029
2030
2031
2032
2033
2034
2035
2036
Zero
Mig. 500
Mig. 1000
15,000
16,000
17,000
18,000
19,000
20,000
21,000
2016
2017
2018
2019
2020
2021
2022
2023
2024
2025
2026
2027
2028
2029
2030
2031
2032
2033
2034
2035
2036
Zero
Mig. 500
Mig. 1000

42
Population compositions
Assumed migration differs significantly in each projection variant. As stated above,
an important secondary effect of migration is its impact upon fertility, as each
projection variant accounts for migration prior to applying prevailing fertility rates to
projected population totals. Over time, total population structure changes as a
result. Figures 20 to 23 show the variants of total population change in the Island
from 2016 to 2036, by the three age-based segments described above.
Figure 20 Isle of Man Population (Zero migration trend)
In this variant, by 2036, the population of the Isle of Man would consist of 11,835 young
people (aged 0 to 15), a working age population of 46,005 (16 to retirement) and a retired
population of 20,035.
0
10,000
20,000
30,000
40,000
50,000
60,000
70,000
80,000
90,000
100,000
Youth (0-15) Working Age (16-AOR) Retirement Age
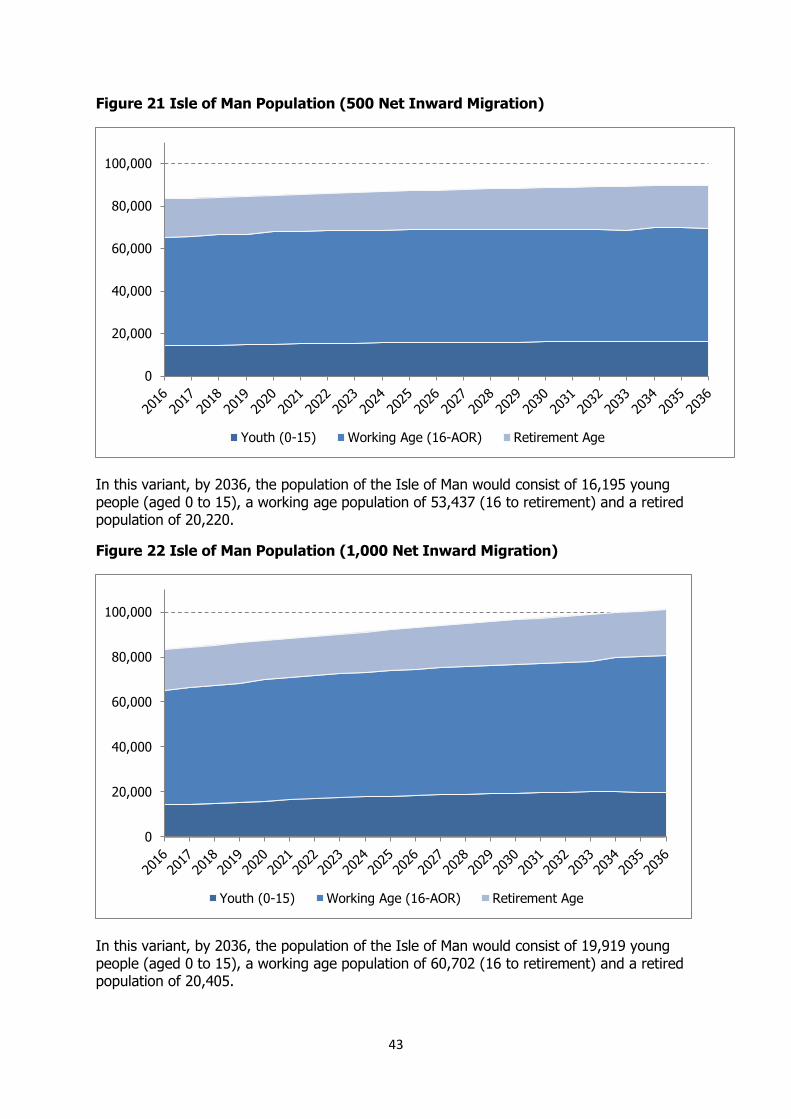
43
Figure 21 Isle of Man Population (500 Net Inward Migration)
In this variant, by 2036, the population of the Isle of Man would consist of 16,195 young people (aged 0 to 15), a working age population of 53,437 (16 to retirement) and a retired population of 20,220.
Figure 22 Isle of Man Population (1,000 Net Inward Migration)
In this variant, by 2036, the population of the Isle of Man would consist of 19,919 young people (aged 0 to 15), a working age population of 60,702 (16 to retirement) and a retired population of 20,405.
0
20,000
40,000
60,000
80,000
100,000
Youth (0-15) Working Age (16-AOR) Retirement Age
0
20,000
40,000
60,000
80,000
100,000
Youth (0-15) Working Age (16-AOR) Retirement Age

44
Table 8 Population Profile by Quinary Age - 0 Net Inward Migration
2016 2021 2026 2031 20360-4 4,144 3,825 3,725 3,710 3,657 5-9 4,733 4,140 3,821 3,722 3,706 10-14 4,469 4,731 4,138 3,819 3,720 15-19 4,789 4,461 4,723 4,131 3,813 20-24 4,422 4,775 4,449 4,710 4,119 25-29 4,326 4,411 4,763 4,437 4,698 30-34 4,506 4,310 4,394 4,744 4,420 35-39 4,873 4,485 4,290 4,373 4,722 40-44 5,612 4,838 4,452 4,259 4,342 45-49 6,497 5,555 4,791 4,408 4,218 50-54 6,681 6,410 5,478 4,728 4,349 55-59 5,887 6,546 6,278 5,360 4,632 60-64 5,170 5,702 6,333 6,071 5,177 65-69 5,441 4,907 5,429 6,020 5,767 70-74 4,212 5,031 4,526 5,032 5,564 75-79 3,155 3,704 4,403 3,942 4,425 80-84 2,129 2,484 2,929 3,449 3,062 85-89 1,380 1,373 1,604 1,912 2,224 90+ 888 938 960 1,073 1,262 Total 83,314 82,626 81,486 79,900 77,875
Table 9 Population Profile by Quinary Age - 500 Net Inward Migration
2016 2021 2026 2031 20360-4 4,144 4,591 4,688 4,662 4,499 5-9 4,733 4,640 5,087 5,184 5,158 10-14 4,469 5,025 4,932 5,378 5,476 15-19 4,789 3,905 4,460 4,367 4,813 20-24 4,422 4,031 3,150 3,704 3,611 25-29 4,326 4,732 4,342 3,464 4,017 30-34 4,506 4,822 5,226 4,837 3,963 35-39 4,873 5,084 5,399 5,801 5,413 40-44 5,612 5,294 5,503 5,816 6,215 45-49 6,497 5,921 5,609 5,815 6,126 50-54 6,681 6,701 6,131 5,826 6,029 55-59 5,887 6,680 6,699 6,136 5,843 60-64 5,170 5,766 6,527 6,544 5,993 65-69 5,441 4,917 5,502 6,216 6,231 70-74 4,212 5,121 4,621 5,189 5,834 75-79 3,155 3,565 4,349 3,888 4,430 80-84 2,129 2,299 2,632 3,228 2,834 85-89 1,380 1,415 1,526 1,754 2,124 90+ 888 976 1,003 1,104 1,262 Total 83,314 85,487 87,385 88,914 89,872

45
Table 10 Population Profile by Quinary Age - 1,000 Net Inward Migration
2016 2021 2026 2031 2036
0-4 4,144 5,148 5,454 5,418 5,141
5-9 4,733 5,141 6,144 6,449 6,413
10-14 4,469 5,318 5,726 6,728 7,033
15-19 4,789 3,348 4,197 4,603 5,605
20-24 4,422 3,287 1,852 2,699 3,104
25-29 4,326 5,054 3,921 2,491 3,336
30-34 4,506 5,334 6,059 4,930 3,506
35-39 4,873 5,684 6,508 7,229 6,104
40-44 5,612 5,750 6,555 7,374 8,088
45-49 6,497 6,287 6,427 7,223 8,035
50-54 6,681 6,992 6,783 6,924 7,709
55-59 5,887 6,814 7,119 6,911 7,055
60-64 5,170 5,830 6,721 7,017 6,810
65-69 5,441 4,927 5,575 6,412 6,695
70-74 4,212 5,210 4,716 5,345 6,104
75-79 3,155 3,426 4,295 3,833 4,435
80-84 2,129 2,115 2,335 3,006 2,606
85-89 1,380 1,460 1,448 1,596 2,024
90+ 888 992 1,000 1,106 1,248
Total 83,314 88,118 92,833 97,293 101,051

Appendix II: Active Ageing Index – Employment Domain
Weights 2014 AAI
(December 2014)
Country 1.1
Employment rate 55-59
1.2 Employment rate 60-64
1.3 Employment rate 65-69
1.4 Employment rate 70-74
1.1 1.2 1.3 1.4 Value Rank
Belgium 56.1 21.0 4.7 2.0 25.0 25.0 25.0 25.0 21.0 24
Bulgaria 62.5 29.2 6.6 2.2
25.1 15
Czech Republic 71.2 27.5 9.2 4.2
28.0 14
Denmark 77.8 43.5 14.9 7.0
35.8 3
Germany 74.9 46.5 11.1 5.1
34.4 5
Estonia 71.3 48.6 27.0 12.0
39.7 2
Ireland 57.6 39.8 16.2 8.6
30.6 12
Greece 47.9 24.7 6.9 2.2
20.4 25
Spain 54.8 31.8 5.2 1.5
23.3 18
France 67.1 21.7 5.9 1.8
24.1 17
Italy 57.7 22.8 8.0 3.5
23.0 19
Cyprus 64.2 36.5 15.4 9.6
31.4 10
Latvia 66.5 37.9 15.6 7.8
32.0 9
Lithuania 64.6 37.5 14.0 6.0
30.5 13
Luxembourg 56.0 22.5 6.0 2.9
21.9 22
Hungary 56.1 13.9 5.3 1.8
19.3 27
Malta 53.9 15.8 6.9 3.6
20.1 26
Netherlands 72.5 43.9 12.7 6.3
33.9 6
Austria 62.8 21.2 9.1 5.8
24.7 16
Poland 52.6 22.6 9.5 4.7
22.4 20
Portugal 56.6 35.6 21.7 16.6
32.6 8

47
Country 1.1
Employment rate 55-59
1.2 Employment rate 60-64
1.3 Employment rate 65-69
1.4 Employment rate 70-74
Value Rank
Romania 51.8 29.3 22.4 20.4
31.0 11
Slovenia 47.5 15.2 7.6 6.1
19.1 28
Slovakia 62.6 19.6 3.8 1.6
21.9 21
Finland 73.9 42.9 12.6 5.4
33.7 7
Sweden 82.0 64.2 19.2 8.3
43.4 1
United Kingdom 70.7 45.2 19.4 7.8
35.8 4
Croatia 48.1 24.4 8.0 6.1
21.7 23
Isle of Man 76.5 53.0 20.3 11.7
40.4 2

48
Appendix III: Active Ageing Index – Participation Domain
Weights 2014 AAI
(March 2015)
Country
2.1 Voluntary activities (once per
week)
2.2 Care to children,
grandchildren
2.3 Care to older adults
2.4 Political participation (incl online
petition)
2.1 2.2 2.3 2.4 Value Rank
Belgium 11.3 38.7 14.5 16.7 25.0 25.0 30.0 20.0 20.2 9
Bulgaria 1.2 27.4 11.8 8.9 12.5 27
Czech Republic 6.2 37.2 14.8 17.4 18.8 11
Denmark 17.4 26.8 6.3 33.3 19.6 10
Germany 10.0 17.9 8.5 20.6 13.6 24
Estonia 3.4 26.5 12.6 7.8 12.8 25
Ireland 20.1 39.4 16.5 21.3 24.1 1
Greece 1.3 34.1 11.3 7.3 13.7 22
Spain 5.9 36.1 15.7 12.9 17.8 15
France 16.5 35.5 13.0 29.3 22.8 4
Italy 11.3 53.7 16.9 13.7 24.1 2
Cyprus 4.3 44.5 9.0 15.8 18.1 14
Latvia 1.4 31.3 10.7 12.1 13.8 21
Lithuania 2.6 33.3 13.5 8.5 14.7 19
Luxembourg 17.5 31.6 11.8 32.0 22.2 6
Hungary 2.4 38.9 13.3 5.3 15.4 18
Malta 9.7 31.7 15.0 12.1 17.3 16
Netherlands 20.6 30.9 14.0 26.8 22.4 5
Austria 15.9 25.0 11.9 22.3 18.2 13
Poland 2.7 22.5 13.3 9.3 12.1 28
Portugal 5.9 27.9 14.6 6.3 14.1 20

49
Country
2.1 Voluntary activities (once per
week)
2.2 Care to children,
grandchildren
2.3 Care to older adults
2.4 Political participation (incl online
petition)
Value Rank
Romania 2.6 28.7 11.3 7.3
12.7 26
Slovenia 5.8 41.2 10.6 6.6
16.3 17
Slovakia 1.4 31.2 11.5 10.4
13.7 23
Finland 12.8 31.0 17.1 22.0
20.5 8
Sweden 18.3 26.1 10.2 43.8
22.9 3
United Kingdom 15.6 26.7 16.1 30.8
21.6 7
Croatia 5.8 33.7 15.0 21.7
18.7 12
Isle of Man 9.5 34.7 46.3 50.0
34.9 1

50
Appendix IV: Active Ageing Index - Independent, Healthy and Secure Living Domain
Weights 2014 AAI
(December 2014)
Country 3.1 3.2 3.3 3.4 3.5 3.6 3.7 3.8 3.1 3.2 3.3 3.4 3.5 3.6 3.7 3.8 Value Rank
Belgium 16.5 94.3 89.1 74.3 92.8 97.1 74.9 2.7 10 20 20 10 10 10 10 10 72.5 12
Bulgaria 0.7 79.6 71.9 73.7 82.6 46.8 57.8
62.7 26
Czech Republic 4.9 93.5 87.6 83.6 98.6 94.0 65.0 3.9
71.2 13
Denmark 25.2 92.0 99.5 75.0 96.7 99.4 87.9 22.9
79.0 1
Germany 12.4 92.5 96.8 87.9 91.6 97.2 74.6 2.0
74.4 8
Estonia 20.0 81.6 83.7 71.8 95.7 92.9 57.9 4.1
67.3 20
Ireland 25.4 95.4 87.2 88.4 92.3 97.7 77.1 2.7
74.9 7
Greece 6.5 82.3 76.2 100.0 92.2 85.7 46.7 0.4
64.8 25
Spain 15.8 89.6 73.4 93.1 93.8 97.1 67.4 4.8
69.8 15
France 22.5 91.2 95.8 100.0 96.2 97.6 67.1 2.0
75.9 5
Italy 5.4 86.8 83.2 94.8 93.0 87.0 67.4 2.3
69.0 17
Cyprus 13.9 88.1 83.6 69.6 86.3 92.5 71.1 2.8
68.0 19
Latvia 12.0 68.4 73.9 79.8 94.5 73.6 39.9 2.9
58.7 28
Lithuania 18.5 91.3 84.2 78.1 94.9 75.9 41.9 1.5
66.2 22
Luxembourg 24.2 95.3 88.0 100.0 97.6 100.0 64.1 4.4
75.7 6
Hungary 5.6 87.5 77.6 97.4 97.7 82.6 66.2 0.4
68.0 18
Malta 17.0 95.5 78.0 80.1 91.0 93.6 2.4
70.1 14
Netherlands 23.4 97.7 97.5 89.7 97.4 99.3 81.5 6.8
78.9 3
Austria 22.2 96.5 83.1 93.4 91.1 98.1 68.7 5.5
73.8 10
Poland 7.0 77.0 68.8 94.9 93.5 85.2 76.7 0.6
64.9 24
Portugal 5.9 78.5 80.0 91.7 93.4 91.6 70.1 3.2
67.3 21
Romania 1.3 70.1 74.4 100.0 91.3 71.4 63.6 0.4
61.7 27
Slovenia 9.6 97.3 84.0 87.4 89.2 93.4 94.6 5.6
74.2 9

51
Country 3.1 3.2 3.3 3.4 3.5 3.6 3.7 3.8 Value Rank
Slovakia 5.1 90.5 72.3 81.4 97.2 89.2 58.9 0.8
65.8 23
Finland 48.9 88.2 96.0 77.7 94.5 98.5 89.5 12.1
79.0 2
Sweden 42.6 87.1 98.7 77.5 94.5 99.6 84.0 16.5
78.6 4
United Kingdom 16.9 94.1 94.2 89.4 91.4 85.0 69.4 8.3
73.7 11
Croatia 7.4 87.5 78.3 85.9 84.2 98.6 86.7 0.2
69.5 16
Isle of Man 12.1 87.8 89.2 79.3 79.1 87.1 95.5 16.4
72.4 13
Components of the Independent, Healthy and Secure Living Domain:
3.1 Physical exercise
3.2 No unmet health or dental care needs
3.3 Independent living arrangements
3.4 Relative median income
3.5 No poverty risk
3.6 No material deprivation
3.7 Physical safety
3.8 Lifelong learning
Data for some countries was not available when the Active Ageing Index was compiled, and therefore where this data was not
present, no weighting was attached to this. For example Bulgaria only had a total weighting of 90 as data was not available for
section 3.8.

52
Appendix V: Active Ageing Index - Capacity and enabling environment for active ageing domain
Weights 2014 AAI
(December 2014)
Country 4.1 4.2 4.3 4.4 4.5 4.6 4.1 4.2 4.3 4.4 4.5 4.6 Value Rank
Belgium 55.7 61.8 73.7 55.0 59.6 50.8 33.3 23.3 16.7 6.7 13.3 6.7 60.3 7
Bulgaria 46.7 65.7 55.3 18.0 48.2 66.6
52.2 17
Czech Republic 51.0 56.5 61.4 36.0 44.3 84.3
54.3 14
Denmark 54.0 63.5 87.3 73.0 63.8 65.2
65.1 2
Germany 55.8 41.7 74.6 52.0 46.6 81.3
55.8 13
Estonia 51.6 38.5 54.2 41.0 30.7 81.6
47.5 23
Ireland 56.3 65.2 77.4 43.0 52.5 49.0
60.0 8
Greece 56.4 50.5 48.6 13.0 27.3 38.5
45.8 26
Spain 59.1 52.9 68.2 29.0 67.5 28.9
56.3 12
France 59.4 54.2 67.7 55.0 61.0 54.2
59.1 9
Italy 58.5 46.4 68.4 24.0 58.2 34.4
53.4 15
Cyprus 56.4 52.0 56.8 22.0 39.6 49.0
50.4 19
Latvia 47.8 47.0 51.4 35.0 38.3 79.7
48.2 21
Lithuania 48.8 46.7 49.7 24.0 23.0 78.0
45.3 27
Luxembourg 56.1 63.5 78.2 75.0 57.0 66.1
63.6 3
Hungary 47.4 48.1 61.5 37.0 21.1 65.2
46.9 25
Malta 57.0 71.8 62.2 33.0 17.5
57.1 11
Netherlands 55.9 56.0 73.7 77.0 67.3 56.4
61.8 4
Austria 56.3 52.4 75.3 45.0 52.3 69.8
58.2 10
Poland 51.0 52.0 51.8 24.0 27.1 74.3
47.9 22
Portugal 56.2 44.1 64.5 22.0 73.6 16.0
52.1 18
Romania 47.5 43.5 44.3 13.0 24.0 51.8
40.9 28
Slovenia 54.6 43.4 52.4 28.0 47.2 71.2
50.0 20

53
Country 4.1 4.2 4.3 4.4 4.5 4.6 Value Rank
Slovakia 48.9 30.6 55.2 37.0 50.2 79.3
47.1 24
Finland 56.1 49.5 81.6 68.0 57.2 66.6
60.5 6
Sweden 56.9 76.1 83.4 78.0 66.9 67.2
69.2 1
United Kingdom 56.2 59.7 67.2 66.0 64.3 67.8
61.3 5
Croatia 49.9 56.0 62.9 20.0 53.9 61.0
52.8 16
Isle of Man 56.8 60.2 75.0 99.1 57.0 63.2
63.9 3
Components of the Capacity and enabling environment for active ageing domain:
4.1 Remaining life expectancy achievement of 50 years at age 55
4.2 Share of healthy life years in the RLE at age 55
4.3 Mental well-being
4.4 Use of ICT
4.5 Social Connectedness
4.6 Educational attainment
Data for some countries was not available when the Active Ageing Index was compiled, and therefore where this data was not
present, no weighting was attached to this. For example Malta only had a total weighting of 87 as data was not available for
section 4.5.

Dependency Growth
Migration
Mobility
Health
Households
Technology Employment
Birth-Rate
1940s 1950s 1960s 1970s 1980s 1990s 2000s 2010s Our populations today and in 2037
Our populations are growing
Our backstory
Infant mortality rates are gradually decreasing
Life expectancy and healthy life expectancy are growing
Number of working age people on Jersey increases by 13% between 2001 and 2011
Our populations are ageingMedian age is rising steadily
Birth rates are rising (until mid-1960s)
Home ownership is increasing (until the 1990s …) Households are becoming more numerous but smaller
How we live is changing
Reflecting on...
how we got here • • •
Overall, from the late 1940s, all BIC Member Administrations have seen their populations grow, influenced by changes in fertility, mortality and inward and outward migration
In that time, median age and life expectancy have increased resulting in a larger proportion of older people in our populations
BIC members have more but smaller households with more people living alone. Care demands and responsibilities are shifting
Our demography story is shaped by mortality, fertility and migration patterns. These are embedded within broader socio-economic factors and developments, which impact people’s attitudes and expectations, changing the ways in which we live, and framing our demographic experience.
Unlike most of the changes that societies will experience during the next 50 years, these underlying trends are largely predictable. We know that the demographic transition to older populations will occur, and we can plan to make the most of it. (WHO’s World report on ageing and health, 2015)
Late 1940’s - Jersey & Guernsey welcome back evacuees who left the islands in1940
1948 National Health Service (UK and the Isle of Man)
1946 National Insurance Act (UK)
1949 White Paper on Social Security (Ireland)
In Ireland, 45,481 people received a contributory state pension in 1970. By 2015 this figure grew to 361,725
Highest recorded dependency ratio was in the Isle of Man in 1976 - 86.9 (per 100 working age population)
In Jersey spending on old age pensions from the Social Security Fund more than doubled between 1999 & 2015
2011 – one person households become the most common type in Scotland
1951 Social Security Policy (Jersey)
1947 - spike in the number of births. 881,026 babies bornin England & Walesalone High birth rates
and positive net migration lead to population growth in the UK and the Channel Islands
Number of one person households in Ireland was six times lower in 1946 than in 2011
UK healthcare spending increased more than threefold between 1983 and 2012
The higher the dependency ratio the smaller the relative ‘earning base’ of a population
High out-migration leads to population decrease in Ireland and the Isle of Man
1976 – number of deaths exceeds number of births in England, Scotland and Wales
Twice as many people born in Scotland in 1964 than in 2002
Guernsey’s population increases by 10% in a decade 1991 - in the Isle of Man,
island-born population becomes a minority
‘The Celtic Tiger’ Ireland experiences unprecedented levels of in-migration
From 2010, out-migration once again exceeds in-migration in Ireland
2,818,341Ireland’s population
low point - 1961Gradual decrease in
fertility rates in the UK
1961-71Median age decreases in Northern Ireland,
Jersey, Scotland, Ireland and the Isle of Man
1948 - Empire Windrush arrives at Tilbury Docks, London. Beginning of large scale immigration into the UK
“Growing up and living in a society where younger people are in a majority is fundamentally different to growing up in a society where the majority of people are in older age groups” (Foresight, Future of an Ageing Population report, 2016)
Population profiles based on most recent available data showing current demographic structures and 2037 population projections for different parts of BIC
1964baby boom
53,388,051
68,104,265
Total BIC population
1951
Increasingly, migration plays a key role in driving
demographic change
Total BIC population
2011
Population-Ageing-Society
MALE FEMALELife expectancy in Ireland (1950 - 1987)
0.01950- 1952
1960- 1962
1965- 1967
1970- 1972
1978- 1980
1980- 1982
1985- 1987
20.0
40.0
60.0
80.0
Young people are increasingly less likely to own their homes
Since the late 1990s, the proportion of people aged 65-74 who are economically
active has been increasing
Generation Y (born between 1980 and 2000) tends to view the social security system as purely redistributive (not a provider of social insurance across the lifetime)
14% of older people living in households in England and Wales provided unpaid care
Average household sizes (2011)
2.34 in Guernsey
2.31 in Jersey
2.5 in Northern Ireland
Average household sizes (1951)
3.37 in Guernsey
3.17 in Jersey
3.91 in Northern Ireland2011
Healthy life expectancy increases faster than life expectancy in
England, Wales and Scotland …
… but in Northern Ireland theopposite is the case and the number
of years not in good health rises
Median age reached 40 in
Wales, Scotland, and the CrownDependencies
Life Expectancy gender gap (UK)
1982: 6 years2012: 4 years
Women’s life expectancy remains higher than men’s across BIC… but the gender gap is narrowing
Fewer people are born in Scotland in 2002 than in any other year since World War II
2012 – highest number of births in the UK since 1972
40
0
10
20
30
40
50
60
70
80
90+
0
England 2015 (2037)
400K 200K 0 200K 400K0
10
20
30
40
50
60
70
80
90+Guernsey 2015 (2037)
0200 400 600400 200600
0
10
20
30
40
50
60
70
80
90+
400800 400 0 800
Isle of Man 2011 (2037)
0
10
20
30
40
50
60
70
80
90+
40K 20K 0 20K 40K
Ireland 2016 (2037)
1K 1K500 0 5000
10
20
30
40
50
60
70
80
90+Jersey 2011 (2037)
0
10
20
30
40
50
60
70
80
90+
15K 15K10K 10K5K 5K0
Northern Ireland 2014 (2037)
0
10
20
30
40
50
60
70
80
90+
0 20K20K 40K40K
Scotland 2015 (2037)
0
10
20
30
40
50
60
70
80
90+
20K30K 20K 30K10K 10K0
Wales 2015 (2037)
31%of the population in
Northern Ireland - 1971
children represented
1953
Owned
Private Rented
Socially Rented
0%
20%
40%
60%
80%
100%
1961 1971 1981 1991 2001 2011
Types of tenure in England and Wales are changing
Ireland
England
Scotland
Wales
JerseyGuernsey
NorthernIreland
Isle of Man
1971-81 Guernsey’s dependency ratio decreases from 65 to 55 “dependants”
per 100 working age population
Economic transformations in the Crown Dependencies lead to high levels of in-migration and rapid population growth
Scotland and Northern Ireland experience consistently high levels of out-migration. Scotland’s population declines
This project supports the strategic framing of the policy discussion around both our population ageing and responding to our ageing societies. We explore our shared backstory and the structural conditions underpinning our options.
EN IR
SC WANIJE
IMGU
Median age
1951
EN N/A
GU 35.2
IM 38.8
IR 29.0
JE 36.1
NI 29.0
SC 32.4
WA N/A
Median age
2011
EN 39.4
GU 41.0
IM 41.2
IR 34.0
JE 40.2
NI 37.0
SC 41.3
WA 41.5
higherthan
Child (0-15)dependency ratio
Pensionable agedependency ratio
higherthan
Pensionable agedependency ratio
Child (0-15)dependency ratio
Life expectancy in Scotland is consistently lower than in other parts of the UK
© Chris Upson
Population ageing is one of the key drivers of societal change in Europe. Increasing numbers of people living to a very old age is an achievement of modern science and healthcare. But it brings challenges which necessitate a response. (Commission of the European Communities’ Renewed Social Agenda, 2008)
Population ageing can no longer be ignored … But the social and economic implications of this phenomenon are profound, extending far beyond the individual older person and the immediate family, touching broader society and the global community in unprecedented ways. (Ban Ki-moon in UNFPA and Help Age International’s Ageing in the Twenty-First Century report, 2012)
Appendix V: British Irish Council Demography Workstream - Rapid Reflection Tool

Situation ReportStructural Conditions ... Next stepsStrategic Implications
Economic
Sustainability
Service
Re-design
Social cohesion & integration
Life course
approach
Pressure Points
Polic
y Radar
Uncertaintie
s
Budget constraints and affordability of current policies
Shifting dependency ratios
Increasing demand for services
Changing nature of attitudes towards the social contract
Lack of planning for longer retirement / longer lives
people
ageing
ageservices
population
action
challenges
opportunities
working
access
focus active
caregovernment
increase
carers
wellbeing
community
economichealth
?
?
?
strategy
older
UK
Guernsey
Isle of Man
Ireland
Jersey
Northern Ireland
Scotland
Wales
Population-Ageing-Society
Our understanding
• Have you the data, evidence
and insights to describe and
explain the challenges that lie
ahead?
• Is your information accessible
enough for all citizens to
understand why your
demography matters?
• ................................................
...............................................
...............................................
where we are heading • • •
• Mobile internet
• Automation of knowledge
• The internet of things
• Cloud technology
• Advanced robotics
• Next-generation genomics
• Energy storage
• 3D printing
• Advanced materials
• Advances in energy exploration, production and recovery
What will transform lives:
Technical and digital advancements
Macro-economic forces
• Stability of markets
• Stability of currencies
• Confidence for investors
• Growth hot-spots
Domestic factors
• Tax base (current and projected) • Budget deficits • National debts • Government expenditure and commitments
Economy and finance
Problems around:
• Age discrimination, for the oldest and the youngest adults
• Negative stereotypes
• Differing expectations on social security and role of the state
• Contested and shifting notions of ‘dependency’
• Financial literacy
Implications:
• Intergenerational tensions • Inadequate personal planning • Changing social contracts with the state • Understanding and experience of loneliness & isolation
Attitudes and expectations
where we are now • • •
Raising questions of:
• Digital divides
• Choice
• Privacy
• Connection ?
?
Our places and spaces
• Do your built environment investments design-in adaptation and accessibility?• Are community cohesion and fostering inter-generational dynamics considered in your plans?
• ................................................ ............................................... ...............................................
Our readiness
• Is your organisation ‘ready’ for
the scale and complexity of the
challenges ahead?
• What does success look like?
• ............................
....................
............................
...................
............................
...................
• ............................
....................
............................
...................
Our care
• What prevailing assumptions
underpin your societal notions
of who cares for whom, and
how?
• Who are the winners and the
losers from your current
arrangements?
• ................................................
...............................................
...............................................
Our working lives and incomes• Are career paths designed to take account of fuller working lives?
• Do those providing care feel recognised and valued in your current arrangements?• ................................................
............................................... ...............................................
… forces changing the world in an enduring way that NEED to be taken into account in future-oriented policy development


This document can be provided in large print and audio tape on request
Copyright
Isle of Man Government