medium-sized industrial companies in north-west … industrial companies in north-west italy,...
TRANSCRIPT

Bergamo, 23 April 2009
Medium-sized industrial companies in North-WestItaly, 1997-2006 and 2007-2008
Emanuela Salerno, Mediobanca Research Department

Medium-sized industrial companies in North-West
Italy, 1997-2006 and 2007-2008
2
In 2006
1,758 medium-sized
companies (1,733
including groups)
Milan, Brescia,
Bergamo, Turin: Four
provinces account for
59% of value added
by MSEs in North-
West Italy
Medium-sized companies in North-West Italy in 2006
Source: Unioncamere Research Centre

3
Medium-sized industrial companies in North-West
Italy, 1997-2006 and 2007-2008
Growth in North-West ItalyNet changes, 1998-2006: 237 more companies
Bergamo:
1998 1452006 196
Chg. +51

4
Medium-sized industrial companies in North-West
Italy, 1997-2006 and 2007-2008
What they do in North-West ItalyValue added in €m, 1996-2006 - universe
“Made in Italy” 56%

5
Medium-sized industrial companies in North-West
Italy, 1997-2006 and 2007-2008
Medium-sized companies in North-West Italy: geographicalconcentrationBase value added, 2006
IDs and LPSs (MB-UC classification) Provincial areas

6
Medium-sized industrial companies in North-West
Italy, 1997-2006 and 2007-2008
MSEs in North-West Italy in districts and LPSs: winnersGrowth 1998-2006 – universe (IDs/LPSs more than 15 companies)
Value added in €m

7
Medium-sized industrial companies in North-West
Italy, 1997-2006 and 2007-2008
Growth in VA from 1997 to2006% chg. – manufacturing, closed group, current prices
Medium-sized enterprises in North-West Italy +37.4
Piedmont and Valle d’Aosta
Liguria
Lombardy
Bergamo
+29.6
+66.8
+39.0
+50.1
Italian manufacturing industry +13.0
8
Medium-sized industrial companies in North-West
Italy, 1997-2006 and 2007-2008
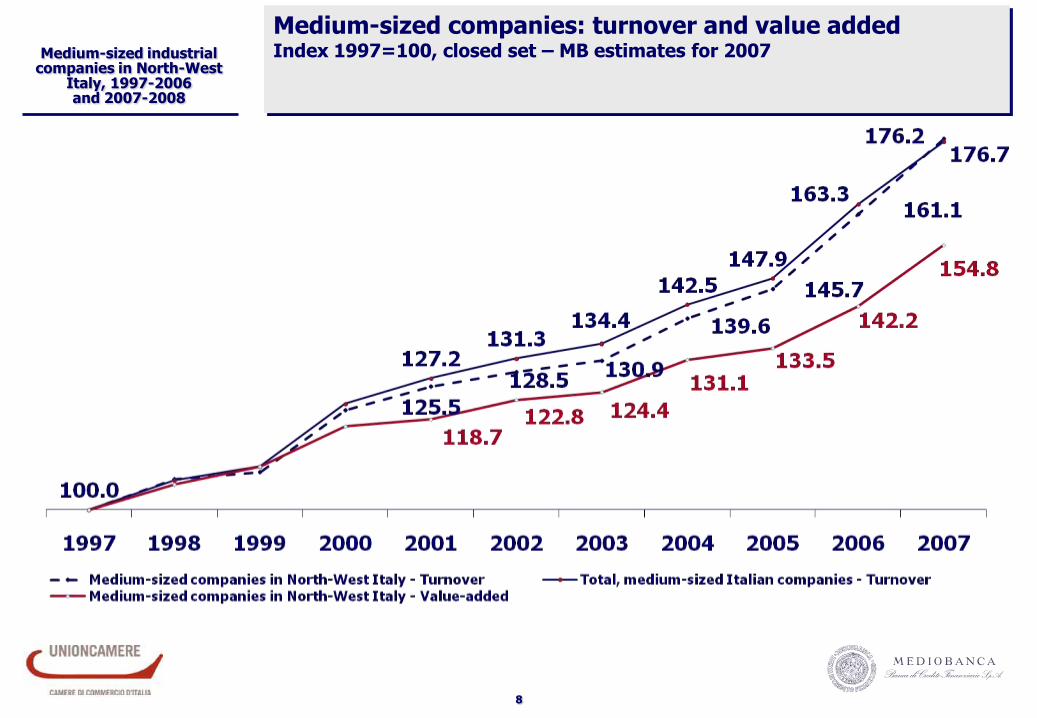
Medium-sized companies: turnover and value addedIndex 1997=100, closed set – MB estimates for 2007

9
Medium-sized industrial companies in North-West
Italy, 1997-2006 and 2007-2008
Medium-sized companies: staff and operating marginsIndex 1997=100, closed set- MB estimates for 2007

10
Medium-sized industrial companies in North-West
Italy, 1997-2006 and 2007-2008
Medium-sized companies: exports , 1997-2008 Index 1997=100, closed sets - MB estimates for 2007 and 2008

Medium-sized industrial companies in North-West
Italy, 1997-2006 and 2007-2008
11
Medium-sized in North-West Italy and large firms: from1997 to 2007Index 1997=100, closed sets - MB and MB-UC data - MB estimates for 2007
106.4 107.9
120.7125.5 128.5 130.9
139.6
145.7
161.1176.7
100.0105.3
109.0117.3 118.7
122.8 124.4131.1
133.5 142.2
154.8
89.1
81.1
89.1 92.190.8
101.4
113.4
1997 1998 1999 2000 2001 2002 2003 2004 2005 2006 2007
MSEs, NW Italy - Turnover MSEs, NW Italy - Value added
Large groups -Consolidated global turnover Large groups - Value added in Italy

Medium-sized industrial companies in North-West
Italy, 1997-2006 and 2007-2008
12
Competitiveness: data per employee€’000 in 2006 – MSE universe - R&S data for manufacturing MNEs
LC / VA=72.4%
margin=
14.5
LC / VA =70.1%
margin =
19.1
LC / VA =69.8%
margin=
18.1
LC / VA =67.4%
margin=
25.1

13
Medium-sized industrial companies in North-West
Italy, 1997-2006 and 2007-2008
Net per capita value added at 1997 pricesClosed sets, 1997-2001 and 2001-2006 (2/3 of IMs)
Expansion
Transformation Expansion

14
Medium-sized industrial companies in North-West
Italy, 1997-2006 and 2007-2008
Net per capita value added at 1997 pricesClosed sets, 1997-2001 and 2001-2006 (2/3 of IMs)
Expansion
TransformationExpansion

15
Medium-sized industrial companies in North-West
Italy, 1997-2006 and 2007-2008
Medium-sized companies in NW Italy: are they profitable?Difference between ROE and risk-free rate - universe
Avg. difference = 6.6 points (7.2 points MSEs, all
Italy)

Medium-sized industrial companies in North-West
Italy, 1997-2006 and 2007-2008
16
Financial structure% of tangible invested capital – universe data, 2006
-34.5 -31.9 -32.1 -25.2 -19.3 -21.5
-22.3 -22.5 -23.9 -23.6 -39.9 -39.7
-43.2 -45.6 -44.0 -51.2 -40.8 -38.8
63.9 66.7 77.3
44.8 43.8 38.8
36.1 33.3 22.7
55.2 56.2 61.2
Fixed assets Current assets Net capital M/l term debt Short-term debt

Medium-sized industrial companies in North-West
Italy, 1997-2006 and 2007-2008
17
Financial solidity in North-West Italy, 2006Data, MB-UC universe
NTC = Net tangible capital
B = BorrowingsNTC/ cap. inv.
NTC / net fixedassets
B (short-term) / net working
capital
Average ratio 45.6% 136.9% 41.8%
No. Of companies:
With ratio > 90% 230 967 296
From 75% to 90% 168 83 147
From 50% to 75% 337 175 364
From 25% to 50% 482 165 333
< 25% 516 343 593
Total companies 1,733 1,733 1,733
Share, 2 strongest categories 61% 53%
Share, 2 weakest categories 29% 26%
Medium-sized industrial companies in North-West
Italy, 1997-2006 and 2007-2008
18
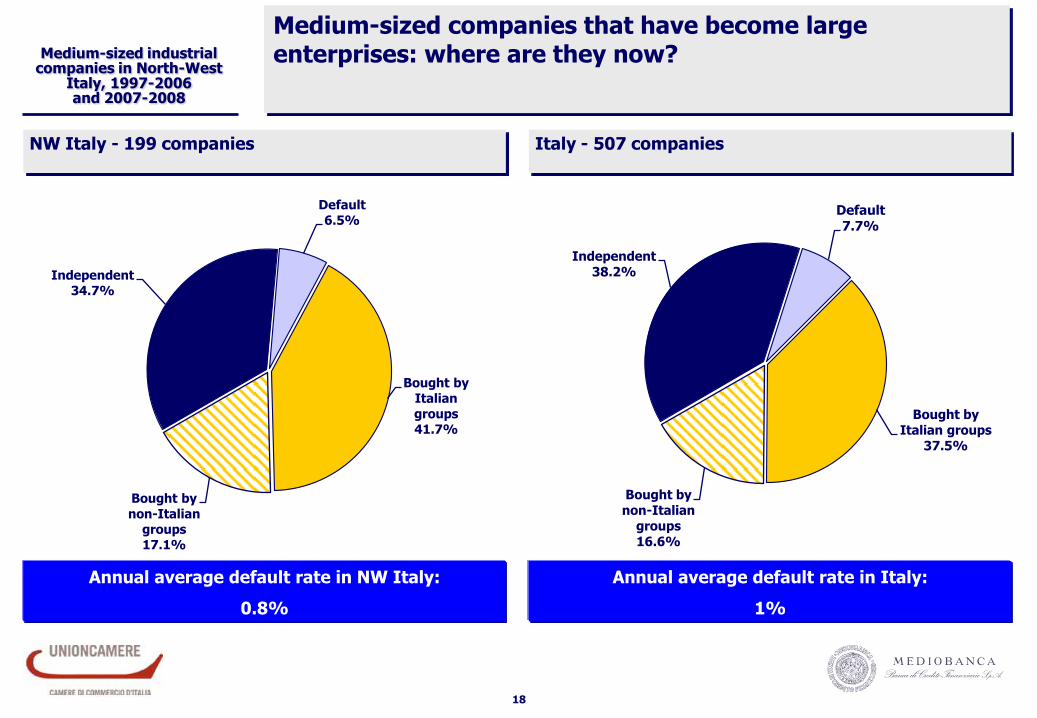
Independent34.7%
Default6.5%
Bought by Italian groups41.7%
Bought by
non-Italian groups17.1%
Independent38.2%
Default7.7%
Bought by Italian groups
37.5%
Bought by non-Italian
groups16.6%
Medium-sized companies that have become largeenterprises: where are they now?
NW Italy - 199 companies Italy - 507 companies
Annual average default rate in NW Italy:
0.8%
Annual average default rate in Italy:
1%

Medium-sized industrial companies in North-West
Italy, 1997-2006 and 2007-2008
19
Solidity confirmed% of companies in 2006 - R&S-Unioncamere credit scoring model

Medium-sized industrial companies in North-West
Italy, 1997-2006 and 2007-2008
20
Medium-size companies, Bergamo - % data
Value added division: Bergamo NW Italy
Personal and household goods 20.9 19.6
Mechanical engineering 39.7 42.4
Chemicals 15.2 13.9
Other sectors 24.2 24.1
TOTAL 100.0 100.0
NOM/VA 25.2 23.9
Debt/invested capital 51.4 50.4
Exports (as % of sales) 39.0 37.4

Mediobanca Research Department
Piazzetta M. Bossi 1, Milan, Italy
Website: www.mbres.it