medieval warming, little ice age, and european impact on
TRANSCRIPT

University of Nebraska - Lincoln University of Nebraska - Lincoln
DigitalCommons@University of Nebraska - Lincoln DigitalCommons@University of Nebraska - Lincoln
NASA Publications National Aeronautics and Space Administration
2-24-2005
Medieval Warming, Little Ice Age, and European impact on the Medieval Warming, Little Ice Age, and European impact on the
environment during the last millennium in the lower Hudson environment during the last millennium in the lower Hudson
Valley, New York, USA Valley, New York, USA
Dee Cabaniss Pederson Lamont-Doherty Earth Observatory, [email protected]
Dorothy M. Peteet NASA/Goddard Institute for Space Studies
Dorothy Kurdyla Center for Accelerated Mass Spectrometry
Tom Guilderson Center for Accelerated Mass Spectrometry
Follow this and additional works at: https://digitalcommons.unl.edu/nasapub
Part of the Physical Sciences and Mathematics Commons
Pederson, Dee Cabaniss; Peteet, Dorothy M.; Kurdyla, Dorothy; and Guilderson, Tom, "Medieval Warming, Little Ice Age, and European impact on the environment during the last millennium in the lower Hudson Valley, New York, USA" (2005). NASA Publications. 19. https://digitalcommons.unl.edu/nasapub/19
This Article is brought to you for free and open access by the National Aeronautics and Space Administration at DigitalCommons@University of Nebraska - Lincoln. It has been accepted for inclusion in NASA Publications by an authorized administrator of DigitalCommons@University of Nebraska - Lincoln.

Medieval Warming, Little Ice Age, and European impact on the
environment during the last millennium in the
lower Hudson Valley, New York, USA
Dee Cabaniss Pedersona,T, Dorothy M. Peteeta,b, Dorothy Kurdylac, Tom Guildersonc
aLamont-Doherty Earth Observatory, 61 Rte. 9W, Palisades, NY 10964, USAbNASA/Goddard Institute for Space Studies, 2880 Broadway, New York, NY 10025, USA
cLawrence Livermore National Laboratory, Center for Accelerated Mass Spectrometry, 7000 East Avenue, L-403, Livermore, CA 94550, USA
Received 9 March 2004
Available online 24 February 2005
Abstract
Establishing natural climate variability becomes particularly important in large urban areas in anticipation of droughts. We present a well-
dated bi-decadal record of vegetation, climate, land use, and fire frequency from a tidal marsh in the Hudson River Estuary. The classic
Medieval Warm Period is evident through striking increases in charcoal and Pinus dominance from ~800–1300 A.D., paralleling
paleorecords southward along the Atlantic seaboard. Higher inputs of inorganic sediment during this interval suggest increased watershed
erosion during drought conditions. The presence of the Little Ice Age ensues with increases in Picea and Tsuga, coupled with increasing
organic percentages due to cooler, moister conditions. European impact is manifested by a decline in arboreal pollen due to land clearance,
increased weedy plant cover (i.e., Ambrosia, Plantago, and Rumex), and an increase in inorganic particles to the watershed.
D 2005 University of Washington. All rights reserved.
Keywords: Pollen; Charcoal; Climate; Medieval Warming; Little Ice Age; Land use; Hudson Valley; Phragmites; Typha
Introduction
Prediction of long-term drought has become a major
topic at the forefront of climate change research (i.e.,
Trenberth et al., 2004). Droughts in the Hudson River
Valley have been documented for recent centuries (Cook
and Jacoby, 1977). However, millennial-scale records for
the region are lacking, making it difficult to place the
anthropogenic era in historical context. Longer records
are crucial for estimating natural variations in climate that
affect the Hudson River watershed, which provides water
resources for New York City’s 8 million inhabitants.
Defining a detailed Hudson record of climate change to
compare with regional (Cronin et al., 2003; Stahle et al.,
1988; Willard and Korejwo, 1999; Willard et al., 2003)
and North Atlantic records (Bond et al., 2001; Keigwin,
1996) will improve our understanding of the forcing for
these changes along the Atlantic seaboard. The unusually
high sedimentation rate (avg. 0.2 cm/yr) in Piermont
Marsh, New York is unique among Hudson marshes
(Merley and Peteet, 2001; Newman et al., 1987; Peteet
and Wong, 1999) and affords an opportunity to inves-
tigate the detailed continuous environmental history of
the Hudson River watershed at bi-decadal to centennial
resolution. Here, we present pollen and spores, charcoal,
loss-on-ignition (LOI), and marsh sediment composition
data for the last 1350 calendar yr.
Using the Piermont record, we address the following
questions: (1) What was the pre-European forest and marsh
composition? (2) Is a climate signal present in the shifts in
pre-European vegetation and charcoal? (3) How does pre-
European variability compare with anthropogenically
induced change? (4) How do organic and inorganic
0033-5894/$ - see front matter D 2005 University of Washington. All rights reserved.
doi:10.1016/j.yqres.2005.01.001
T Corresponding author. Fax: +1 845 365 8154.
E-mail address: [email protected] (D.C. Pederson).
Quaternary Research 63 (2005) 238–249
www.elsevier.com/locate/yqres

sediment composition compare with vegetation shifts and
the charcoal record?
Study location
Piermont Marsh (41800VN, 73855VW), located on the
western shore of the Hudson River and approximately 40
km north of the river’s mouth (Fig. 1), is one of four
National Estuarine Research Reserve (NERR) sites along
the river. It measures 110 ha and is bounded by Piermont
Pier to the north and the Palisades sill to the west, which
rises ~100 m to form Tallman State Park. Mean salinity is
6.0 ppt, and the marsh is categorized as brackish
(Winogrond, 1997). Two creeks, the freshwater Sparkill
and the brackish Crumkill, meander through the marsh
(Fig. 1b). Marsh vegetation is comprised primarily of
Phragmites australis, but Spartina alterniflora, Spartina
patens, Spartina cynosuroides, Schoenoplectus robustus,
Schoenoplectus americanus, Typha angustifolia, Iva fru-
tescens, Chenopodium glaucum (introduced), and Cheno-
podium ambrosioidies (introduced) are present (Blair and
Nieder, 1993; Lehr, 1967). Due to the sharp rise of the
Palisades Sill to the west, Sparkill Creek to the north, and
the river contour to the south, the marsh is circumscribed
with negligible marsh fringe. Because it is so limited
aerially and cannot bexpandQ landward, the marsh area and
its local wetland contribution are relatively constant over
time. It is the northernmost site of Spartina in the Hudson
Estuary, and no native Chenopodiaceae are found in the
marsh flora today. However, dramatic changes in marsh
vegetation have taken place over the last 50 yr with the
advent of invasive species. P. australis colonies have
increased their percent coverage of the marsh from 35 to
40% in 1965 to 66% in 1991 (Winogrond, 1997). A
detailed doctoral thesis study of Piermont Marsh hydrology
demonstrates that our coring site location in high marsh S.
patens/Distichlis is saturated throughout the tidal cycle, in
contrast to the creek margin S. alterniflora vegetation that
is not saturated during ebb tide (F. Montalto, personal
communication, 2003). The lack of channel deposits in the
section indicates no major changes in the courses of the
marsh tributaries at our site.
Figure 1. (a) Hudson Valley region with Piermont Marsh marked with a star. Filled circles designate regional marsh records, and unfilled circles mark upland
records. (b) Aerial view of Piermont Marsh bounded to the north by the pier built in 1854. A star marks the core location. Sparkill Creek is the large tributary
through the northern portion of the marsh. Tallman State Park forms the western boundary to an elevation of ~100 m. (c) Photograph of Tallman State Park
from the core site. In the foreground, the remnant Spartina patens/Distichlis is present with Typha and Phragmites in the background. Tallman mountain rises
to the west.
D.C. Pederson et al. / Quaternary Research 63 (2005) 238–249 239

Local forest composition in promontory Tallman State
Park reflects regional diversity, consisting of a Quercus–
Carya (oak–hickory) assemblage on the more shallow soils.
Northern hardwoods (Acer saccharum (sugar maple), Fagus
americana (American beech), and Betula spp. (birch)) and
southern temperate trees (Liriodendron tulipifera (tulip
poplar), Liquidambar styraciflua (sweet gum)) are found
on more mesic sites. Pinus strobus (white pine) and Tsuga
spp. (hemlock) are also present.
Southeastern New York experiences a mixture of
continental and maritime climates. Mean annual precipita-
tion is 1080 mm. Mean temperatures for January and July in
New York City are �0.48C and 258C, respectively
(www.ncdc.noaa.gov, Central Park Observatory).
Materials and methods
The core site represents the remnant S. patens/Distichlis
vegetation in the northcentral portion of the marsh (Fig. 1c).
The upper 2 mwas taken with a Hiller peat corer in June 2000
about 25 cm away from deeper sediment extractions (i.e., 2–3
m) using the modified Livingston piston corer (Wright et al.,
1984). Due to difficulties with the Livingston corer in
obtaining good recovery in the upper sediments, we used
the Hiller corer for the upper 2 m. Recovery of the study
intervals was 100% (both Livingston and Hiller cores). Field
subsamples were refrigerated prior to analysis. Samples for
pollen analysis and LOI were taken at 4-cm intervals
throughout the 246 cm used in this study. Nomenclature
follows FNAEC (1993). LOI was measured according to
Dean (1974).
All samples for pollen analysis were prepared according
to standard procedures (Faegri and Iversen, 1975; Heusser
and Stock, 1984). Pollen residues were dehydrated in
alcohols and suspended in silicone oil. Pollen and spores
were identified according to the reference collection at
LDEO and reference books (Kapp et al., 2000; Lewis et al.,
1983; Moore and Webb, 1978). For each sample, a
minimum of 300 non-aquatic pollen grains were counted
at 400� magnification. Because Typha (cattail), which was
tallied as an aquatic type, accounts for a large percentage of
the total pollen in portions of the record, a minimum of 300
non-aquatic grains were counted for each sample to gain a
more accurate vegetation signature. Pollen percentages are
based on sums of arboreal and herbaceous pollen. Typha
percentages are based on sums of arboreal, herbaceous, and
aquatic pollen grains. Because the pollen sum includes
upland as well as wetland taxa, interpretation of wetland
development is not the object of this study. Here, we
describe changes in the watershed through time. Compar-
ison with regional lake records is possible, however, since
the upland component of the core is statistically significant
(~300 grains). Spore percentages are based on the sum of
pollen and spores. Pollen diagrams were produced using
Tilia and Tiliagraph (Grimm, 1992).
Separation of pollen to species was achieved for T.
angustifolia, T. latifolia, T. glauca, and Sparganium based
on the morphological work of Finkelstein (2003). T.
angustifolia was counted as a monad, T. latifolia as a
tetrad, and T. glauca as a dyad. Sparganium was differ-
entiated from Typha based on differences in angularity
described by Finkelstein (2003). Phragmites was separated
from other Poaceae pollen grains on the basis of its small
size (Clark and Patterson, 1985). The separations are
featured in Figure 7.
Seventeen macrofossil samples from the top 278 cm of the
core were sent to Lawrence Livermore National Labs (LLNL)
Table 1
Age ranges for 95.4% enclosed area are shown for the calendar used range in calendar calculation
Sample depth (cm) Items analyzed Uncorrected 14C
year B.P. age
Calibrated 2-sigma age
range (cal year A.D.)
Calendar age
(cal yr A.D.)
80–84 4 black Schoenoplectus seeds 145 F 40T 1667–1783 (46%) 1725T88–92 woody long stem modern
96–100 6 black medium Schoenoplectus seeds 270 F 40T 1609–1673 (42%) 1641T92–96 7 black Schoenoplectus seeds 275 F 40T 1608–1671 (40%) 1640T108–112 Schoenoplectus stem 355 F 35 1539–1636 (57%) 1588
120–124 2 Schoenoplectus nodes 520 F 35T 1391–1444 (86%) 1418T132–136a 1 sedge node, 1 Eleocharis seed 515 F 45 1386–1454 (79%) 1420
132–136b 1 Dirca-type seed, 5 yellow Schoenoplectus seeds 600 F 60T 1291–1425 (100%) 1358T140–144 2 sedge nodes, 1 woody fragment 455 F 35 1408–1487 (100%) 1448
148–152 1 black Schoenoplectus, 2 yellow Schoenoplectus
seeds
660 F 70T 1245–1417 (100%) 1331T
168–172 3 charcoal pieces, 1 large Schoenoplectus seed 70 F 40 1876–1917 (44%)
176–180 2 black medium Schoenoplectus seeds,
3 Eleocharis seeds, 1 white Carex seed
785 F 45T 1179–1294 (100%) 1237T
184–188 1 Cladium, 1 Carex, 2 yellow Schoenoplectus seeds 1035 F 45T 894–1043 (92%) 969T188–192 2 sedge nodes, 2 woody fragments 1300 F 35 660–777 (100%) 719
192–196 2 charcoal stems 1030 F 40 940–1043 (84%) 992
214–216 1 Cladium, 5 yellow Schoenoplectus seeds 1210 F 40T 758–897 (81%) 828T276–278 2 Polygonum seeds 1580 F 80T 336–640 (98%) 488T
Relative percent area represented by the calendar range is shown in parentheses ( ). Selected dates are marked by an asterisk (T).
D.C. Pederson et al. / Quaternary Research 63 (2005) 238–249240

for AMS-radiocarbon dating. The depths and types of
macrofossils for all dated samples are presented in Table 1.
Sediment accumulation rates were calculated using linear
interpolation between the 14C dates (Fig. 2). The core top was
estimated at 0 cal yr B.P. (the core was obtained in A.D. 2000,
calendar dates obtained with CALIB 4.4 were adjusted from
A.D. 1950) because there was no indication of disturbance.
Use of microscopic charcoal as a fire indicator has been
the topic of numerous studies (e.g., Clark, 1988; Tinner and
Hu, 2003). Clark (1988) examines the controversies of using
pollen-slide charcoal counts and, using particle motion
theory concludes that the small charcoal particles counted in
most studies (5–10 Am) yield ambiguous charcoal records.
In this study, charcoal pieces N50 Am � 10 Am (500 Am2)
were counted along with pollen grains and exotic Lycopo-
dium. The size criterion was chosen to avoid confusion of
microscopic charcoal with opaque mineral material, which
is typically b50 Am in one dimension (Clark and Patterson,
1984; Parshall and Foster, 2002). The criterion is also in
agreement with Clark’s (1988) assertion that thin-section
charcoal (minimum size = 50 Am) better represents local fire
events (Clark and Robinson, 1993). We note that those
intervals with more charcoal N50 Am also had more small
charcoal fragments (b50 Am). Although charcoal is primar-
ily transported by wind and water, the size used in this study
reflects particles from local origin (b20 km if convection
column reaches 1000 m; Clark, 1988). Identified macro-
fossil charcoal in the samples at various intervals (D. Peteet,
unpublished data, 2002) supports local fires in the marsh
itself. However, because the marsh floods twice a day, it is
possible that some of the wood charcoal reflects fires in the
larger watershed.
Charcoal influx and charcoal/pollen ratios (C/P) were
calculated for the study interval. Linear regression of the
two calculations yields r2 = 0.61, but both are shown for
ease of comparison with other studies (Fig. 3). Calculation
Figure 2. Linear interpolation of sedimentation rates for the Piermont Marsh core. Calculation of sedimentation rates assumes constant accumulation between
dated layers.
Figure 3. Comparison of charcoal influx data (Am2 cm�2 yr�1) with C/P
ratios (charcoal area / # pollen grains). Linear regression of the two datasets
yields r2 = 0.61.
D.C. Pederson et al. / Quaternary Research 63 (2005) 238–249 241

of C/P ratios is conservative because the only criterion for
counting was a minimum area of 500 Am2. C/P ratios were
calculated for each sample as follows:
C=P ¼ charcoal area Am2ð Þ#pollen grains
Results
Lithology, radiocarbon dating, age model, and
sedimentation rates
The lithology for the study section is composed of peat,
muck, and mucky peat (Fig. 4). Although the coring site is
100 m from the current course of Sparkill Creek, there are
no channel deposits of coarser grained sediment in the core.
The absence of any channel deposits supports continuous
peat accumulation.
Radiocarbon dates from the core are mostly in strati-
graphic order (Table 1). Two of seventeen dates were
unusable due to contamination (88–92 cm, 168–172 cm).
Ten of the remaining fifteen dates were used in the age
model. We did not include dates from 108–112 cm, 132–
136a cm, 140–144 cm, 188–192 cm, and 192–196 cm, which
were omitted in favor of using marsh seed dates. Identified
marsh seeds produced in situ have tough outer coats,
impermeable to carbon contamination. Seeds take their
carbon from the atmosphere and reflect the annual produc-
tion rates of 14C more accurately than bulk sediment dates,
woody fragments, or charcoal stems. While macrofossils are
subject to water transport to be incorporated in the peat
profile, the non-seed material (i.e., wood and charcoal stems)
may be contaminated by old carbon from the watershed
itself, a correction that can be as great as 1000 yr in the
Hudson River (Olsen et al., 1978). Radiocarbon dates were
converted to calibrated bcalendarQ dates using CALIB 4.4
(Stuiver and Reimer, 1993). Calendar age range is shown for
95.4% enclosed area (2-sigma).
Because large changes in 14C production for the time
period spanned by this study can result in chronological
uncertainties, several possible relative age ranges exist.
Thus, dates selected for the age model were chosen on the
basis of high relative area under the probability distribution
within the 95.4% area enclosed. Cultural horizons, the most
common being the increase in Ambrosia associated with
permanent settlement, can be correlated to dates from
historical records and have been used in studies focusing
on more recent time scales (Brugam, 1978; Brush et al.,
1982; Clark and Patterson, 1984; Davis, 1983; Davis et al.,
1980; Fuller et al., 1998; Maenza-Gmelch, 1997; Russell et
al., 1993; Willard and Korejwo, 1999). This adds to the
chronologic control for this study.
Pollen assemblages, organic content, and charcoal
The core was divided into five pollen zones based on
visual inspection. Objective zonation using CONISS con-
firms zone selection (Grimm, 1992). Specific zone age is
based on the assumption of a constant accumulation rate
between 14C-dated layers. Ages calculated by linear
interpolation are marked with an asterisk (T).
Zone P-1
Pinus–Quercus zone (A.D.~T653–T1292; 246 to 160
cm). Pinus and Quercus are the major pollen types (Fig. 4).
Pinus is dominant and is composed of both haploxylon and
diploxylon types, with broken grains preventing differ-
Figure 4. Percent data for PiermontMarsh pollen and spores. C/P ratios, forams, and LOI values are also shown. Exaggeration lines (5�) are shown for minor taxa.
D.C. Pederson et al. / Quaternary Research 63 (2005) 238–249242
entiation. Minor arboreal inputs from Tsuga, Betula, and
Picea (spruce) are observed. Carya reaches its maximum
percentage (11%). Polypodiophyta percentages, although
small, are consistently present in this zone.
Herbaceous pollen accounts for 10 to 14% of the pollen
sum. Ambrosia and low-spine Tubuliflorae exhibit sharp
peaks at 208 cm. The total pollen accumulation rate (influx)
reaches minimal values for the entire sequence (Fig. 5). LOI
is variable, ranging between 20 and 40%. Inorganic sedi-
ment mass contributions range from 0.16 to 0.72 g, a
maximum for the study interval (Fig. 6). Organic mass
contributions are much more constant, ranging from 0.10 to
0.17 g. C/P ratios are striking in magnitude when compared
to the rest of the core; maximum values (135–679) are
maintained throughout the zone (Figs. 4 and 6).
Zone P-2
Pinus–Quercus–Typha zone (A.D. ~T1292–1418; 160
cm to 120 cm). Pinus (16 to 36%) and Quercus (18 to 30%)
are the dominant arboreal species, with Pinus declining to
the top of the zone. Rises in Poaceae (6–18%), Ambrosia
(3–11%), and Typha (3–11%) percentages are observed.
Plantago and Rumex appear for the first time. Polypodio-
phyta are consistently present and reach a maximum of
7.8% during this interval.
LOI values for this zone increase and are less variable than
in the previous zone, ranging from 28 to 39%. The inorganic
sediment fraction mass is also less variable than in the
previous zones (0.18 to 0.29 g), while the organic contribu-
tion remains similar to previous zones (0.10 to 0.14 g). C/P
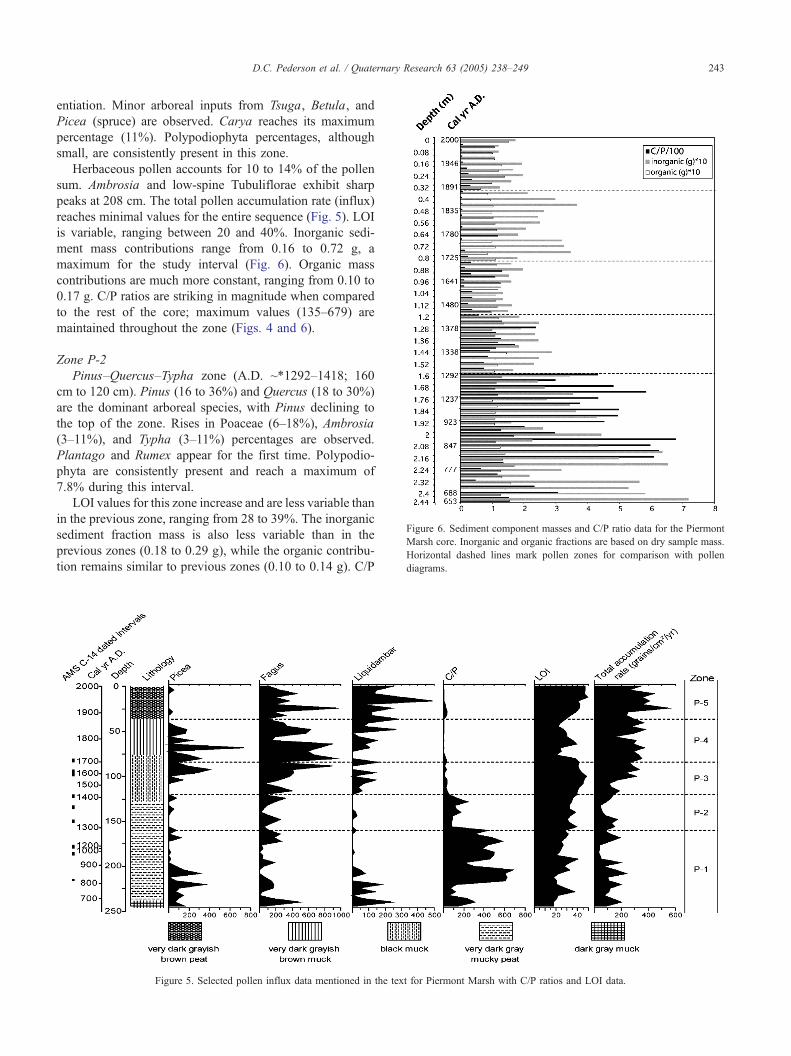
Figure 5. Selected pollen influx data mentioned in the text for Piermont Marsh with C/P ratios and LOI data.
Figure 6. Sediment component masses and C/P ratio data for the Piermont
Marsh core. Inorganic and organic fractions are based on dry sample mass.
Horizontal dashed lines mark pollen zones for comparison with pollen
diagrams.
D.C. Pederson et al. / Quaternary Research 63 (2005) 238–249 243

ratios are moderate and much lower than zone P-1 (57–237).
Total pollen influx is variable and reaches values almost as
low as those observed in the high charcoal zone, P-1.
Zone P-3
Quercus–Pinus–Betula zone (A.D. ~1418–T1697; 120
cm to 84 cm). For the first time in the record, Quercus (23 to
36%) is present in equal and higher percentages than Pinus
(16 to 33%; Fig. 4). Pinus percentages increase slightly at
the top of the zone, as does Picea. Betula also increases
slightly (up to 12%) from zone P-3. Polypodiophyta spores
decline dramatically to zero.
C/P ratios continue to decrease from P-3 (11–37). LOI
increases to a zonal peak of 48% at 96 cm. Both inorganic
and organic fraction masses are relatively consistent for this
zone. Inorganic mass ranges from 0.13 to 0.20 g, and
organic mass ranges from 0.10 to 0.13 g. Decreasing C/P
ratios complement the total pollen influx increase shown
from the bottom to the top of the zone.
Zone P-4
Pinus–Quercus–Ambrosia–Typha zone (A.D.~T1697–T1877; 84 to 36 cm). Pinus and Quercus again are the
dominant arboreal species, but both genera drop signifi-
cantly as Ambrosia, Typha, and Poaceae increase (Fig. 4).
The date of this zone is based on consistently high levels of
Ambrosia (10%) and corresponds to the timing of successful
European settlement (A.D. 1681). Within the zone, there is a
shift among major pollen types, as herbaceous taxa account
for 10 to 51% of the pollen sum. Rumex and Plantago are
more consistently present during this time, and species other
than Ambrosia from the low spine Tubuliflorae family are
consistently seen. A maximum is reached for Chenopodia-
ceae (10%) mid-zone. Pinus decreases sharply from 43 to
13%, Quercus drops to an average of ~15%, and Betula
fluctuates between 4 and 12%.
LOI values generally drop and are more variable
(averaging ~30%) than in the previous zone and peak at
56–60 cm. Inorganic sediment masses increase in this zone
with peaks at 44 and 76 cm, ranging from 0.18 to 0.36 g
(Fig. 6). Organic masses decrease slightly from the previous
zone and range from 0.06 to 0.12 g. C/P ratios reach
minimum values for the record (0–31).
Zone P-5
Quercus–Typha–Poaceae zone (A.D.~T1877–2000); 36to 0 cm). Major pollen types are Typha (38 to 55%),
Quercus (17 to 29%), and Poaceae (11 to 35%). Ambrosia
(4 to 18%) drops off as the previously mentioned taxa
increase. Typha percentages drastically increase. Pinus is
still present in small amounts (9–16%), and Betula reaches a
plateau of ~10% in the zone, which is a maximum for the
entire study section. Plantago reaches a maximum value of
3% at the surface, and Rumex is still present.
LOI values increase to values similar to those in zone
P-4. Inorganic masses drop abruptly from the previous zone
with values from 0.20 to 0.11 g. Organic masses increase
slightly but remain similar to those in previous zones (0.10
to 0.15 g). C/P ratios are higher than zone P-4 and are
comparable to that seen in zone P-3 but decrease toward the
surface.
Discussion
The Piermont Marsh changes in lithology and LOI,
pollen and spores, charcoal, and macrofossils along with 14C
stratigraphy provide us with a high-resolution environmental
history that is a primary record for this region. Additional
cores from the marsh and nearby Hudson marshes (work in
progress) will refine our understanding of the strengths and
limitations of this unique site. Major changes in climate and
human impact characterize the record.
Pre-European Pinus–Quercus forest with droughts
(A.D. ~T653–T1292)
Dominant forest trees at ~A.D. 653 were Pinus and
Quercus species. P. strobus was probably the dominant
Pinus species as it is today, but P. rigida and P. resinosa
were also likely present, as evidenced by both haploxylon
and diploxylon pollen grains. While both P. rigida and P.
resinosa are found in the modern regional landscape, P.
rigida is more common. Other records from the lower
Hudson Valley do not show the prevalence of Pinus (mean
of 35%) seen in the Piermont record (Fig. 4), but the record
from a Staten Island marsh (D.S. Kleinstein, unpublished
data, 2003) does show values as high as 25%. In contrast,
modern small lake records in the region (Loeb, 1989;
Maenza-Gmelch, 1997) do not indicate Pinus percentages
above 10%. This suggests general site differences with
more Pinus growing in the watershed than local lakes
reveal, or an artifact of more fluvial and aerial transport of
Pinus pollen to the marshes than to more protected small
lakes. Future analysis of surface reference samples for
modern pollen–vegetation relations will address this ques-
tion. Quercus includes at least six species (Q. alba, Q.
rubra, Q. velutina, Q. bicolor, Q. prinus, and Q. coccinea),
which are modern components of the Hudson River Valley
(Little, 1971).
Loeb (1989) examined modern surface samples from
several nearby lakes, and the most proximal to Piermont,
Rockland Lake, shows a Quercus-dominated forest with
values varying between 30 and 50% at the surface,
contrasting with the Piermont record of 20% due to dilution
by local marsh taxa such as Poaceae. While Quercus is
typically one of the dominant arboreal taxa in most regional
records (Buell et al., 1966; Carmichael, 1980; Clark and
Patterson, 1985; D.S. Kleinstein, unpublished data, 2003;
Maenza-Gmelch, 1997; Margraf, S.E., unpublished data,
2003; Russell, 1981), co-dominant species differ. To the
north at Mohonk, NY (S.E. Margraf, unpublished data,
D.C. Pederson et al. / Quaternary Research 63 (2005) 238–249244

2003) where mean July temperature is 28C colder than the
Piermont area, Betula is the dominant taxon as it is in some
Massachusetts lakes to the northeast (Fuller et al., 1998).
Betula, Fagus, Tsuga, and Acer were also present in small
amounts at Piermont. The minor presence of Castanea at
this time contrasts with other upland records from NY
(Maenza-Gmelch, 1997; S.E. Margraf, unpublished data,
2003) and Connecticut (Brugam, 1978; Davis, 1969) where
Castanea averages 10%.
Noteworthy increases in Picea are seen here as con-
ditions become dry and increased erosion from the north
probably deposited more buoyant grains such as Picea (Fig.
4). Carya expands in the upper half of the zone, suggestive
of warmer temperatures. Carya requires less moisture than
other warm temperature indicator genera (i.e., Castanea)
(Fowells, 1965). Shuman et al. (2004) demonstrate that mid-
Holocene Carya expansion in New England occurred when
temperatures were almost as warm as today based on
hydrogen–isotope ratios. Forest and/or marsh fires were
dominant in Piermont during this interval, as evidenced by
high charcoal influx (Fig. 3). Pollen influx in the marsh is
minimal, further suggesting loss of biomass and drier
conditions leading to increased upland erosion which was
then deposited in the marsh (Fig. 5). The increase in
charcoal influx suggests several possible causes: (1)
increased fire due to Native American activity, (2) increased
river transport of buoyant material such as charcoal, or (3) a
climate shift resulting in increased mortality due to drought
that favored fire.
Native Americans often settled in river valleys, and those
living in southern New England subsisted more on
agricultural practices than from hunting alone (Cronon,
1983; Williams, 1989). Maintenance of fields and grass-
lands for berries and wild game prior to European settlement
is a possible cause for increased burning (Williams, 1989),
but large wildfires started by Native Americans are
considered unlikely (Day, 1953; Russell, 1983). Natural
disturbance or land clearance and maintenance by Native
Americans in the large river valleys of northeastern North
America (Day, 1953; Williams, 1989) would allow light-
loving species such as Ambrosia to sporadically thrive prior
to European settlement.
It is possible that changes in water transport played a role
in the increase in charcoal and buoyant pine pollen during
the time period coincident with the Medieval Warm Period
(MWP). However, changes in the watershed source over the
last millennium prior to European impact are unlikely, as
geologic factors are insignificant on this time scale. We thus
favor a climatic interpretation for the changes that take place
in the Piermont record from ~A.D. 795–1290, correspond-
ing to the timing of the Medieval Warm Period as defined by
Lamb (1982) to be ~A.D. 800–1200 in Europe and
Greenland. Drier conditions at the landscape scale are
supported by Pinus dominance, large increase in charcoal
influx, and low pollen influx. Because the size criterion used
for quantifying charcoal is based on sizes that yield more
local information, the peaks in the record indicate local fires
(within 20 km). The expansion of more southern temperate
taxa such as Carya and Liquidambar, along with the decline
of Betula, Tsuga, and Alnus, suggests warmer and drier
conditions. Isolated peaks in Poaceae and Ambrosia
percentages also support the drought/increased fire hypoth-
esis, as these taxa are more likely to colonize the landscape
after a disturbance such as fire. The abundance of Ambrosia
pollen (17%) at 208 cm is noteworthy since percent values
of 10% have been related to dates of European settlement;
this sharp increase in Ambrosia is indicative of disturbance
associated with increased charcoal (Clark, 1986; Clark and
Patterson, 1985; Russell and Davis, 2001; Russell et al.,
1993). Other nearby pollen studies show significant
presence of Ambrosia (or Iva) much earlier than the first
date of European settlement, further supporting the dis-
turbance hypothesis for these early peaks (Carmichael,
1980; Clark, 1986). During this time, the only pollen types
showing significant increases in both percent and influx data
are Polypodiophyta and Salix. Increases in Salix and
Polypodiophyta during this interval may reflect colonization
of these species on expanding riverbanks as water level
dropped.
Regional studies along the North Atlantic seaboard
support our drought/fire hypothesis of the major shifts in
Piermont Marsh. To the south along the Atlantic seaboard,
Brush (1986) found warmer, drier conditions with increased
charcoal from A.D. 1000–1200 in cores from Chesapeake
Bay. Cronin et al. (2003) used Mg/Ca based temperature
reconstructions of ostracode shells to identify the first half
of the MWP in their record. Sustained periods of drought
from A.D. 1000 to 1300 are noted using tree-ring
reconstructions from North Carolina (Stahle et al., 1988).
While the periods of drought in each of these studies
corresponds to times of high charcoal in Piermont, the
record presented here reflects the full length of the classic
MWP.
To the north, lake records from Black Rock Forest also
demonstrate increased fire during this interval prior to
European impact (Maenza-Gmelch, 1997). Several ponds in
central Massachusetts show increased C/P ratios during this
interval; these locations are located in upland areas on
poorer soils and are probably more sensitive to drought
(Fuller et al., 1998). Other lake charcoal studies from the
eastern US show that climate is an important influence on
fire regimes (Clark and Royall, 1996; Parshall and Foster,
2002; Swain, 1973). However, many lower-resolution
records from the NE US do not capture the importance of
fire on the landscape during the MWP (Parshall et al., 2003;
Russell et al., 1993).
Other North American records of the MWP have been
demonstrated in the southwestern US (Cook et al., 2004,
Stine, 1994). Midwestern US lake and dune records have
also shown periods of drought during the MWP (Fritz et al.,
2000; Mason et al., 2004). Recent speleothem studies record
high 18O values corresponding to the MWP in New Zealand
D.C. Pederson et al. / Quaternary Research 63 (2005) 238–249 245

(Williams et al., 2004). Documenting the global extent of
this warm interval is important for understanding hemi-
spheric linkages (Broecker, 2001).
Forest Transition (A.D.~T1292–1418)
During the next century, we see increases in more mesic
species (Tsuga, Fagus) as Pinus and Chenopodiaceae
decline. T. angustifolia is present consistently at the site,
possibly indicating fresher conditions (Fig. 7). While this
local marsh change may add more organic material to
deposited sediment, a sharp decrease in inorganic input is
evident from the raw data (Fig. 6). The plateau in organic
mass and the corresponding decrease in inorganic mass
leads us to conclude that the relative increase in LOI is due
not to an increase in organic material but to a decrease in
inorganic material. Charcoal influx decreases suggesting
less fire, and the subsequent landscape stabilization encour-
ages revegetation, reducing erosion, and the inorganic input
to the marsh (Fig. 6). Relative organic content (LOI) rises as
cool and moist conditions prevail with the onset of the Little
Ice Age (LIA; A.D. 1400–1850; Lamb, 1982).
Little Ice Age and early European settlement (A.D. ~1418–
T1697)
An expansion of Quercus and corresponding stabiliza-
tion of Pinus characterizes this pre-European forest.
Expansion of Tsuga forests indicates more available
moisture, and the spread of northern genera such as Picea
and Fagus suggests cooling, coinciding with the occurrence
of the LIA. Lower charcoal influx (Fig. 3) and mineral
content (Fig. 6) in the sediment indicate less drought stress
and erosion of the landscape, further evidencing the
presence of the LIA. Continued expansion of Poaceae and
Ambrosia indicates disturbance by Native Americans and
early Europeans. The Tappan tribe that occupied the
surrounding area during this time period developed a strong
agricultural and fishing society, complemented by winter
hunting and trapping (Haagensen, 1986).
European settlement: Forest clearance, industry, and
beginning of permanent agriculture (A.D. ~T1697–T1877)
The area was colonized by Europeans in A.D. 1681
(Haagensen, 1986). Thus, it is reasonable to attach a date of
A.D. T1697 to the marked, consistent Ambrosia rise. The
Ambrosia rise is found in many pollen records from the
northeast (Brugam, 1978; Carmichael, 1980; Clark, 1986;
Clark and Patterson, 1985; Davis, 1969; Maenza-Gmelch,
1997; Russell and Davis, 2001; Russell et al., 1993). Other
weedy species such as Chenopodiaceae, Plantago, and
Rumex (Fernald, 1970) are also seen in greater abundance
during this time. Decreases in the abundance of trees
characterize the settlement period. Early settlers cleared the
land for farms, homes, fuel, and ships. Dynamic changes in
the local forest after settlement took place as Quercus and
Pinus were felled for construction, fuel, and defense (masts,
forts, etc.). Quercus, Carya, and Castanea were used for
structures and fuel.
The Revolutionary War undoubtedly had a large impact
on population and vegetation in this area. Vegetated shores
along the river such as Stony Point and Fort Montgomery
near the Bear Mountain Bridge were cleared for battles.
Forests were burned to produce charcoal used in iron
production (Cronon, 1983). The population of this area
grew at times with increases in troop numbers (Haagensen,
1986). Rockland County, where Piermont Marsh is located,
supported a population of 6000 in a 1790 census, an
increase from the tally of 219 inhabitants in 1693 (Cole,
1884). This increase is probably a direct result of increased
occupation during and after the war. Historic records of
cold, snowy winters attest to the harsh conditions the people
endured (Schechter, 2002).
The modern period of deforestation to reforestation:
A.D. ~T1877–2000
Deforestation on the landscape is dramatic with reduced
presence of Pinus and Tsuga, as the Quercus forest recovers
slightly in the 20th century. Much wood was needed in New
York City to power steamboats and engines, and a
convenient source would likely be this area because of
proximity and easy river transport (Haagensen, 1986). A
local brick factory in Haverstraw manufactured over 32
million bricks in 1883, which required enormous amounts
of wood (Cole, 1884). The tanning industry used bark from
Figure 7. Pollen size separation data for Poaceae and Typha. Large Poaceae
grains represent native marsh grasses, while small Poaceae grains
correspond to Phragmites establishment.
D.C. Pederson et al. / Quaternary Research 63 (2005) 238–249246

Tsuga, accounting for its dramatic decrease (Russell et al.,
1993). Betula, a disturbance species and less economically
viable, becomes more abundant during this time, a trend
observed in other NE US sites (Russell et al., 1993). These
forest trends are observed in other areas of the northeast and
likely indicate reforestation of cleared lands (Russell et al.,
1993). In the last decade, the wooly adelgid has plagued
Tsuga stand in the NE US, causing further decrease in this
forest species (Orwig et al., 2002).
The anthropogenic influence emerges clearly in local
marsh vegetation dominated primarily by Poaceae and
Typha. A steady rise in Poaceae is visible as trees are felled
but reaches greatest abundance during the last several
decades, a pattern also visible in Jamaica Bay and Saw
Mill Creek, which are NY marshes (Fig. 1a; D.S. Kleinstein,
unpublished data, 2003; Peteet and Liberman, 2001) as well
as in the Hackensack Meadowlands, New Jersey (Fig. 1;
Carmichael, 1980). Recent Poaceae expansion is due to
Phragmites invasion since the 1960s (Winogrond, 1997;
Wong and Peteet, 1999). Clark and Patterson (1985)
separated Poaceae based on size in a Long Island tidal
marsh. Their size criteria were used in this study and support
an increase in Phragmites in recent decades (Fig. 7). Size
separation data also show the presence of Phragmites prior
to European settlement, adding valuable information to the
controversy of the native/introduced status of Phragmites.
While native Phragmites has been present in the local marsh
landscape over time, its recent dominance is attributed to
introduced varieties that vary genotypically from the native
types (Saltonstall, 2002).
Typha abundance in the marsh is maximal during the
20th century and is probably due to increases in eutrophi-
cation both from local and watershed-level nutrient inputs.
Finkelstein (2003) separated Typha species based on
morphology. T. latifolia has traditionally been thought of
as a native species, while T. angustifolia is viewed as
possibly an introduced species. The presence and domi-
nance of T. angustifolia in the Piermont record indicate that
T. angustifolia is not an introduced species. The presence of
T. angustifolia/Sparganium is also documented from the
Hackensack Meadowlands (Carmichael, 1980). Moreover,
the presence of the hybrid T. glauca ~A.D. 800 indicates
that T. angustifolia was present early enough for hybrid-
ization to occur.
Marsh sediment composition and watershed implications
Changes in organic and inorganic components in the
Piermont Marsh sediments are intriguing. The input of
organic material has been relatively constant throughout
(0.06 to 0.15 g), while the inorganic component has
drastically decreased (from 0.72 to 0.11 g) from A.D. 653
to the present (Fig. 6). This inorganic decline is comple-
mented by a relatively consistent proportion of water (62 to
88%) in the samples, suggesting that de-watering of clays is
not a factor for these changes. If core compaction played a
role in sediment characteristics, higher pollen influx would
be evident in the deeper sections of the record (Brugam,
1978). Pollen influx is actually much lower at the base of
the record than at the surface, indicating that compaction is
minimal.
The gradual decrease in inorganic material upcore
suggests several possible mechanisms. Climate change
probably accounts for the signature of watershed erosion
to the marsh because the MWP with drought and high fire
records large inorganic inputs while the cooler, wetter LIA
inputs to the marsh are minimal. A dry, burned landscape is
more susceptible to removal of inorganics than one that is
heavily vegetated, further supporting the drought hypoth-
esis. Another possibility is relative sea level fluctuation, as
Piermont creek banks receive more inorganic matter than
the internal high marsh. Tectonism could also have affected
relative sea level, as the area is faulted (Newman et al.,
1987).
Humans have also affected erosion. European impact is
clearly marked as an abrupt increase in inorganic content
from about A.D. 1700 to 1875, but the magnitude of the rise
is not equivalent to MWP inputs. This landscape clearance
that resulted in higher inorganic supply parallels the
increases in weedy species. Previous estuarine work has
shown drastic increases in sedimentation rates after land
clearance, due to increased runoff and erosion (Brush, 1984,
1989; Brush et al., 1982; Neubauer et al., 2002; Pasternack
et al., 2001).
Subsequent declines in Piermont Marsh inorganic
content in the twentieth century support revegetation of
the watershed. Eutrophication has especially influenced
the expansion of Typha and Phragmites on the marsh
itself.
Conclusions
(1) Pollen stratigraphy from Piermont Marsh reveals the
pre-European forest composition (A.D. 653–1697) as
Pinus–Quercus forest with minor inputs from Tsuga,
Betula, and Carya.
(2) The MWP is present from A.D. 800 to 1300 as
indicated by increases in Pinus and Carya, declines
in Quercus , the inconsistent presence of Picea ,
decreases in drought-sensitive species (Tsuga, Betula,
Alnus), and large increase in fire. Higher inorganic
content (erosion) and low pollen influx during this
interval further support the drought hypothesis.
(3) The subsequent LIA (A.D. 1400–1850) is evident from
Picea peaks, increases in Tsuga and Cyperaceae, and
minimal erosion (low inorganic component) of the
watershed.
(4) European impact in the 18th century is striking with
increases in local marsh species such as Typha. The
spread of weedy genera such as Ambrosia, Plantago,
and Rumex indicates upland disturbance until the 20th
century, when they decline with reforestation.
D.C. Pederson et al. / Quaternary Research 63 (2005) 238–249 247

(5) Charcoal abundance is greatest coincident with the
MWP and suggests that fire frequency is mediated
primarily by climate (drought) in the Hudson watershed.
(6) Inorganic inputs to the marsh are highest at the
initiation of this record, decreasing toward the present.
European impact shows resurgence in the inorganic
fraction, resulting from changes in land use. Continued
research on a suite of Hudson River marshes will
further elucidate the influences of drought and fire in
the Hudson Valley.
Acknowledgments
This research was funded by the Hudson River Founda-
tion, the LDEO Investment Fund, and a Director’s Discre-
tionary Fund grant from NASA. Discussions with Wally
Broecker, Erica Hendy, Neil Pederson, Kirsten Sauer, and
two anonymous reviewers improved the manuscript. Sample
material used in this project was stored in the LDEO Sample
Repository. The National Science Foundation (Grant
OCE00-02380) and the office of Naval Research (Grant
N00014-02-1-0073) provide support for the collection and
curating facilities of the repository. Thanks to Cara Peters
and Lauren Hamill for initial pollen processing. This is
Lamont contribution number 6714.
References
Blair, E.A., Nieder, W.C., 1993. Mapping of the Hudson River NERR:
Creating Tools for Tidal Wetland Research, Management, and
Education. Final report to the Hudson River Foundation. New York,
NY.
Bond, G.C., Kromer, B., Beer, J., Muscheler, R., Evans, M.N., Showers,
W., Hoffman, S., Lotti-Bond, R., Hajdas, I., Bonani, G., 2001.
Persistent solar influence on North Atlantic climate during the
Holocene. Science 294, 2130–2136.
Broecker, W.S., 2001. Was the medieval warm period global? Science 291,
1497–1499.
Brugam, R.B., 1978. Pollen indicators of land-use change in southern
Connecticut. Quaternary Research 9, 349–362.
Brush, G.S., 1984. Patterns of recent sediment accumulation in Chesapeake
Bay (Virginia–Maryland U.S.A.) Tributaries. Chemical Geology 44,
227–242.
Brush, G.S., 1986. Geology and paleoecology of Chesapeake Bay: a long-
term monitoring tool for management. Journal of the Washington
Academy of Sciences 76, 146–160.
Brush, G.S., 1989. Rates and patterns of estuarine sediment accumulation.
Limnology and Oceanography 34, 1235–1246.
Brush, G.S., Martin, E.A., DeFries, R.S., Rice, C.A., 1982. Comparisons of
210Pb and pollen methods for determining rates of estuarine sediment
accumulation. Quaternary Research 18, 196–217.
Buell, M.F., Langford, A.N., Davidson, D.W., Ohmann, L.F., 1966.
The upland forest continuum in northern New Jersey. Ecology 47,
416–432.
Carmichael, D., 1980. A record of environmental change during recent
millenia in the Hackensack tidal marsh, New Jersey. Bulletin of the
Torrey Botanical Club 107, 514–524.
Clark, J.S., 1986. Late-Holocene vegetation and coastal processes at a Long
Island tidal marsh. Journal of Ecology 74, 561–578.
Clark, J.S., 1988. Particle motion and the theory of charcoal analysis:
source area, transport, deposition, and sampling. Quaternary Research
30, 67–80.
Clark, J.S., Patterson III, W.A., 1984. Pollen, Pb-210, and opaque spherules:
an integrated approach to dating and sedimentation in the intertidal
environment. Journal of Sedimentary Petrology 54, 1251–1265.
Clark, J.S., Patterson III, W.A., 1985. The development of a tidal marsh:
upland and oceanic influences. Ecological Monographs 55, 189–217.
Clark, J.S., Robinson, J., 1993. Paleoecology of fire. In: Crutzen, P.J,
Goldhammer, J.G. (Eds.), Fire in the Environment: The Ecological,
Atmospheric and Climatic Importance of Vegetation Fires. John Wiley
and Sons Ltd., New York, pp. 193–214.
Clark, J.S., Royall, P.D., 1996. Local and regional sediment charcoal
evidence for fire regimes in pre-settlement north-eastern North
America. Journal of Ecology 84, 365–382.
Cole, D., 1884. History of Rockland County New York. J.B. Beers and Co.,
New York.
Cook, E.R., Jacoby Jr., G.C., 1977. Tree-ring drought relationships in the
Hudson Valley, New York. Science 198, 399–401.
Cook, E.R., Woodhouse, C., Eakin, C.M., Meko, D.M., Stahle, D.W., 2004.
Long-Term Aridity Changes in the Western United States. Science 306,
1015–1018.
Cronin, T.M., Dwyer, G.S., Kamiya, T., Schwede, S., Willard, D.A.,
2003. Medieval Warm Period, Little Ice Age and 20th century
temperature variability from Chesapeake Bay. Global and Planetary
Change 36, 17–29.
Cronon, W., 1983. Changes in the land: Indians, Colonists, and the Ecology
of New England. Hill and Wang.
Davis, M.B., 1969. Climatic change in southern Connecticut recorded by
pollen deposition at Rogers Lake. Ecology 50, 409–422.
Davis, M.B., 1983. Holocene vegetational history of the eastern
United States. In: Wright, H.E. (Ed.), Late-Quaternary Environments of
the United States, vol. 2. University of Minnesota Press, Minneapolis,
pp. 166–181.
Davis, M.B., Spear, R.W., Shane, L.C.K., 1980. Holocene climate of New
England. Quaternary Research 14, 240–250.
Day, G.M., 1953. The Indian as an ecological factor in the Northeastern
forest. Ecology 34, 329–346.
Dean, W.E., 1974. Determination of carbonate and organic matter in
calcareous sediments and sedimentary rocks by loss on ignition:
comparison with other methods. Journal of Sedimentary Petrology 44,
242–248.
Faegri, K., Iversen, J., 1975. Textbook of Pollen Analysis. Hafner
Publishing Company, New York.
Fernald, M.L., 1970. Gray’s Manual of Botany. Van Nostrand Company,
New York.
Finkelstein, S.A., 2003. Identifying pollen grains of Typha latifolia, Typha
angustifolia, and Typha x glauca. Canadian Journal of Botany 81,
985–990.
(FNAEC) Flora of North America Editorial Committee (Eds.), (1993).
Flora of North America North of Mexico, vols. 7+. Oxford University
Press, New York.
Fowells, H.A. (Ed.), 1965. Silvics of Forest Trees of the Untied States. U.S.
Department of Agriculture Forest Service, Washington, DC.
Fritz, S.C., Ito, E., Yu, A., Laird, K., Engstrom, D.R., 2000. Hydrologic
variation in the Northern Great Plains during the last two millennia.
Quaternary Research 53, 175–184.
Fuller, J.L., Foster, D.R., McLachlan, J.S., Drake, N., 1998. Impact of
human activity on regional forest composition in central New England.
Ecosystems 1, 76–95.
Grimm, E.C., 1992. TILIA and Tilia-Graph Software, Version 2.0. Illinois
State University.
Haagensen, A.M., 1986. Palisades and Snedens Landing. Pilgrimage
Publishing, Tarrytown, NY.
Heusser, L.E., Stock, C.E., 1984. Preparation techniques for concentrating
pollen from marine sediments and other sediments with low pollen
density. Palynology 8, 225–227.
D.C. Pederson et al. / Quaternary Research 63 (2005) 238–249248
Kapp, R.O., Davis, O.K., King, J.E., 2000. Pollen and Spores. American
Association of Stratigraphic Palynologists Foundation Publication.
Keigwin, L., 1996. The Little Ice Age and Medieval Warm Period in the
Sargasso Sea. Science 274, 1504–1508.
Lamb, H.H., 1982. Climate, History and the Modern World. Methuen,
London.
Lehr, J.H., 1967. The marshes at Piermont, New York: a field report.
Sarracenia 11, 31–34.
Lewis, W.H., Vinay, P., Zenger, V.E., 1983. Airborne and Allergenic Pollen
of North America. The Johns Hopkins University Press, Baltimore, MD.
Little Jr., E.L., 1971. Atlas of United States trees: Volume 1 Conifers and
Important Hardwoods. USDA Forest Service Miscellaneous Publication
1146.
Loeb, R.E., 1989. Lake pollen records of the past century in northern New
Jersey and southeastern New York, U.S.A. Palynology 13, 3–19.
Maenza-Gmelch, T.E., 1997. Holocene vegetation, climate, and fire history
of the Hudson Highlands, southeastern New York, USA. The Holocene
7, 25–37.
Mason, J.A., Swinehart, J.B., Goble, R.J., Loope, D.B., 2004. Late-
Holocene dune activity linked to hydrological drought, Nebraska Sand
Hills, USA. The Holocene 14, 209–217.
Merley, M., Peteet, D., 2001. Salt marsh formation in the lower Hudson
River estuary. EOS Transactions AGU 82 (20), S87 (Spring Mtg Suppl,
Abstract B41B-12).
Moore, P.D., Webb, J.A., 1978. An Illustrated Guide to Pollen Analysis.
John Wiley and Sons, New York.
Neubauer, S.C., Anderson, I.C., Constantine, J.A., Kuehl, S.A., 2002.
Sediment deposition and accretion in a mid-Atlantic (U.S.A.) tidal
freshwater marsh. Estuarine, Coastal and Shelf Science 54, 713–727.
Newman, W.S., Cinquemani, L.J., Sperlin, J.A., Marcus, L.F., Pardi, R.,
1987. Holocene neotectonics and the Ramapo Fault sea-level anomaly: a
study of varying marine transgression rates in the Lower Hudson Estuary,
New York and New Jersey. In: Nummendal, D., Pilkey, O.H., Howard,
J.D. (Eds.), Sea Level Fluctuation and Coastal Evolution. Society of
Economic Paleontologists and Mineralogists, Tulsa, pp. 97–111.
Olsen, C.R., Simpson, H.J., Bopp, R.F., Williams, S.C., Peng, T.-H., Deck,
B.L., 1978. A geochemical analysis of the sediments and sedimentation
in the Hudson estuary. Journal of Sedimentary Petrology 48, 401–418.
Orwig, D.A., Foster, D.R., Mausel, D.L., 2002. Landscape patterns of
hemlock decline in New England due to the introduced hemlock woolly
adelgid. Journal of Biogeography 29, 1475–1487.
Parshall, T., Foster, D.R., 2002. Fire on the New England landscape:
regional and temporal variation, cultural and environmental controls.
Journal of Biogeography 29, 1305–1317.
Parshall, T., Foster, D.R., Faison, E., MacDonald, D., Hansen, B.C.S.,
2003. Long-term history of vegetation and fire in pitch pine-oak forests
on Cape Cod, Massachusetts. Ecology 84, 736–748.
Pasternack, G.B., Brush, G.S., Hilgartner, W.B., 2001. Impact of historic
land-use change on sediment delivery to a Chesapeake Bay subestuar-
ine delta. Earth Surface Processes and Landforms 26, 1–19.
Peteet, D.M., Liberman, L., 2001. Millennial Climate and Land use History
from Jamaica Bay Marshes. New York Geologic Society of America
Annual Meeting, Boston, MA., pp. A-453.
Peteet, D.M., Wong, J.K., 1999. Late Holocene environmental change from
NY–NJ estuaries. Abstracts-Northeastern Geological Society of Amer-
ica, p. 65.
Russell, E.W.B., 1981. Vegetation of northern New Jersey before European
settlement. The American Midland Naturalist 105, 1–12.
Russell, E.W.B., 1983. Indian-set fires in the forests of the Northeastern
United States. Ecology 64, 78–88.
Russell, E.W.B., Davis, R.B., 2001. Five centuries of changing forest
vegetation in the Northeastern United States. Plant Ecology 155,
1–13.
Russell, E.W.B., Davis, R.B., Anderson, R.S., Rhodes, T.E., Anderson,
D.S., 1993. Recent centuries of vegetational change in the glaciated
north-eastern United States. Journal of Ecology 81, 647–664.
Saltonstall, K., 2002. Cryptic invasion by a non-native genotype of the
common reed, Phragmites australis, into North America. Proceedings
of the National Academy of Sciences 99, 2445–2449.
Schechter, B., 2002. The Battle for New York. Walker and Company,
New York.
Shuman, B., Newby, P., Huang, Y., Webb III, T., 2004. Evidence for the
close climatic control of New England vegetation history. Ecology 85
(5), 1297–1310.
Stahle, D.W., Cleveland, M.K., Hehr, J.G., 1988. North Carolina climate
change reconstructed from tree rings: A.D. 372 to 1985. Science 240,
1517–1519.
Stine, S., 1994. Extreme and persistent drought in California and Patagonia
during mediaeval time. Nature 369, 546–549.
Stuiver, M., Reimer, P.J., 1993. Extended 14C database and revised CALIB
radiocarbon calibration program. Radiocarbon 35, 215–230.
Swain, A.M., 1973. A history of fire and vegetation in northeastern
Minnesota as recorded in lake sediments. Quaternary Research 3,
383–396.
Tinner, W., Hu, F.S., 2003. Size parameters, size-class distribution and
area–number relationship of microscopic charcoal: relevance for fire
reconstruction. The Holocene 13, 499–505.
Trenberth, K., Overpeck, J., Solomon, S., 2004. Exploring drought and its
implications for the future. EOS 87 (3), 27.
Willard, D.A., Korejwo, D.A., 1999. Holocene Palynology from Marion-
Dufresne cores MD99-2209 and 2207 from Chesapeake Bay: impacts
of climate and historic land-use change. In: Cronin, T.M. (Ed.), Initial
Report on IMAGES V Cruise of the Marion-Dufresne to the
Chesapeake Bay June 20–22, 1999. United States Geological Survey,
Reston, VA, pp. 78–86. Open file report 00-306.
Willard, D.A., Cronin, T.M., Verardo, S., 2003. Late-Holocene climate and
ecosystem history from Chesapeake Bay sediment cores, USA. The
Holocene 13 (2), 201–214.
Williams, M., 1989. Americans and Their Forests. Cambridge Univ. Press.
Williams, P.W., King, D.N.T., Zhao, J.-X., Collerson, K.D., 2004.
Speleothem master chronologies: combined Holocene 18O and 13C
records from the North Island of New Zealand and their palae-
oenvironmental interpretation. The Holocene 14, 194–208.
Winogrond, H.G., 1997. Invasion of Phragmites australis in the
Tidal Marshes of the Hudson River, M.S. thesis. Bard College,
Annandale-on-Hudson, New York.
Wong, J.K., Peteet, D., 1999. Environmental history of Piermont Marsh,
Hudson, River, NY. In: Nieder, W.C., Waldman, J.R. (Eds.), Final
Reports of the Tibor T. Polgar Fellowship Program, 1998. Hudson
River Foundation. Section III. p. 30.
Wright Jr., H.E., Mann, D.H., Glaser, P.H., 1984. Piston corers for peat and
lake sediments. Ecology 65, 657–659.
D.C. Pederson et al. / Quaternary Research 63 (2005) 238–249 249