medicare skilled nursing facility value based purchasing ... and advocacy/finance policy... ·...
TRANSCRIPT

© 2018 DataGen. May not be reproduced or distributed without prior written permission.
Medicare Skilled Nursing Facility Value
Based Purchasing Program Overview
Lauren Davis
Senior Healthcare Policy and Data Analyst
April 18, 2018

© 2018 DataGen. May not be reproduced or distributed without prior written permission.
Today’s Objectives
• Overview of Medicare Skilled Nursing Facility Value
Based Purchasing Program
• Review Methodology
• Review Analysis

© 2018 DataGen. May not be reproduced or distributed without prior written permission.
• Program becomes effective FFY 2019 (October 1, 2018)
• Payment adjustments based on facility-specific performance compared to
national standards
• Funded by SNF payment 2.0% “contribution”
• All SNFs paid under the SNF PPS are eligible (hospital-based, free-
standing, SNF swing beds)
• Performance metrics are determined using historical data
• Measures are established in advance, usually in the SNF rule
Medicare Skilled Nursing Facility (SNF) Value Based Purchasing
(VBP) Program

© 2018 DataGen. May not be reproduced or distributed without prior written permission.
SNF VBP: Program Overview
• Sole measure is SNF 30-Day All-Cause Readmission
measure (SNFRM)– Quality achievement and improvement are both recognized
– SNF performance is compared to national standards
• Raw SNFRM measure scores are inverted
• 60% of program contributions are redistributed back to
SNFs based on a logistic exchange function– Program is not budget neutral nationally
• Bottom 40%+ of skilled nursing facilities must be
penalized

© 2018 DataGen. May not be reproduced or distributed without prior written permission.
SNF 30-Day All-Cause Readmission Measure (SNFRM)
SNFRM estimates risk-standardized rate of all-cause, unplanned hospital readmissions of Medicare SNF beneficiaries within 30 days of discharge from their most recent prior acute hospitalization
• Interim program measure
• Includes beneficiaries with fee-for-service (FFS) Medicare who were inpatients at PPS, Critical Access Hospitals, or Psychiatric Hospitals
• Hospital readmissions are identified through Medicare claims
• Readmissions within 30-day window counted regardless of whether beneficiary is readmitted directly from SNF or had been discharged from SNF
• Risk-adjusted based on patient demographics, principal diagnosis in prior hospitalization, comorbidities, etc.
• Excludes planned readmissions

© 2018 DataGen. May not be reproduced or distributed without prior written permission.
SNFRM

© 2018 DataGen. May not be reproduced or distributed without prior written permission.
SNF VBP Timeframes
• FFY 2019 Program Timeframes
• FFY 2020 Program Timeframes
J F M A M J J A S O N D J F M A M J J A S O N D J F M A M J J A S O N D J F M A M J J A S O N D J F M A M J J A S O N D J F M A M J J A S O N D
Act
ual
Pro
gram
SNFRM Baseline Period SNFRM Performance Period
20182014 2019
Pay
men
t
Ad
just
men
t
2015 2016 2017
J F M A M J J A S O N D J F M A M J J A S O N D J F M A M J J A S O N D J F M A M J J A S O N D J F M A M J J A S O N D J F M A M J J A S O N D
Act
ual
Pro
gram
20192015 2020
Pay
men
t
Ad
just
men
t
2016 2017 2018
SNFRM Baseline Period SNFRM Performance Period

© 2018 DataGen. May not be reproduced or distributed without prior written permission.
SNF VBP Public Reporting
• SNF performance scores ranked publically on Nursing
Home Compare
• There is a two-phase review and correction process
before public reporting
– Quarterly confidential feedback reports to SNF on their
performance
– Preview reports of payment adjustments and ranking
– Reports available using the Quality Improvement Evaluation
System (QIES) and the CASPER reporting application

© 2018 DataGen. May not be reproduced or distributed without prior written permission.
SNFRM Inverted Rate
• SNFRM Inverted Rate = 1 – Facility’s SNFRM Raw Rate
Higher inverted rate = better performance
Lower inverted rate = worse performance
Example: SNF readmissions rate of 20.449%
SNFRM Inverted Rate = 1 – 0.20449
SNFRM Inverted Rate = 0.79551

© 2018 DataGen. May not be reproduced or distributed without prior written permission.
SNF VBP Performance Standards
• Benchmark• High achievement levels
(average performance score for
top 10% of SNFs during
baseline period nationwide)
• Threshold• Minimum achievement levels
(25th percentile of performance
during baseline period
nationwide)
• Improvement threshold• Each specific SNF’s
performance on the SNFRM
measure during the applicable
baseline period
10
CMS' National
Performance Standards[4]
0.79590
Benchmark
0.83601
Threshold
© 2018 DataGen. May not be reproduced or distributed without prior written permission.
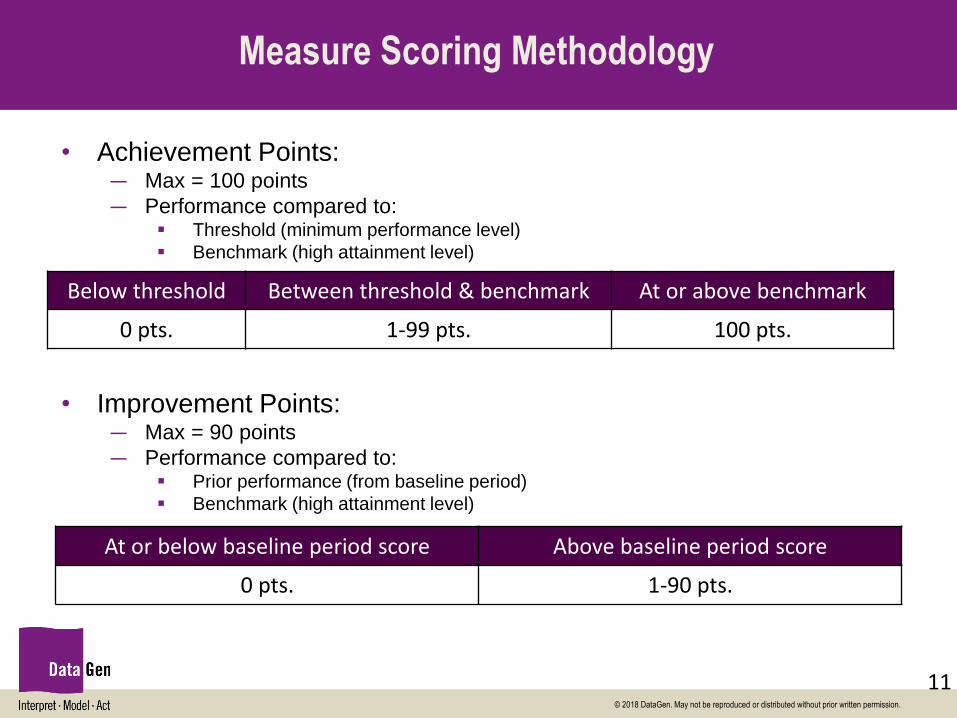
Measure Scoring Methodology
• Achievement Points:— Max = 100 points
— Performance compared to: Threshold (minimum performance level)
Benchmark (high attainment level)
• Improvement Points:— Max = 90 points
— Performance compared to: Prior performance (from baseline period)
Benchmark (high attainment level)
Below threshold Between threshold & benchmark At or above benchmark
0 pts. 1-99 pts. 100 pts.
At or below baseline period score Above baseline period score
0 pts. 1-90 pts.
11

© 2018 DataGen. May not be reproduced or distributed without prior written permission.
SNF Achievement Score = ([9 x )] + 0.5) x 10
SNF VBP Measure Scoring: Achievement Points
42.2251 = Achievement Points
0.81249 - 0.79590
0.83601 - 0.79590
Measure
ID
SNFRM
Achievement
Points
Earned[5]
0-100 Scale
0.81249 42.2251
SNF Performance
Raw Rate
Improvement
Points
Earned[6]
0-90 Scale
0.0000
Performance Period[1]
Measure Name
SNF 30-Day All-Cause
Readmission Measure
Raw Rate
0.18751
Inverted
Rate[3]
0.81249
CMS' National
Performance Standards[4]
0.79590
Benchmark
0.83601
Estimated SNF
Performance
Score[7]
0-100 Scale
42.22510.18751
Threshold
Baseline Period[2]
SNF Performance
Inverted Rate[3]
SNF Achievement Score = ([9 x )] + 0.5) x 10

© 2018 DataGen. May not be reproduced or distributed without prior written permission.
SNF Improvement Score = ([10 x )] - 0.5) x 10
SNF VBP Measure Scoring: Improvement Points
The SNF receives the higher point value of achievement or improvement. In this example, a score of 42.2251 is assigned to the SNFRM measure.
0.81249 – 0.81249
0.83601 - 0.81249
0 = Improvement Points
Measure
ID
SNFRM
Achievement
Points
Earned[5]
0-100 Scale
0.81249 42.2251
SNF Performance
Raw Rate
Improvement
Points
Earned[6]
0-90 Scale
0.0000
Performance Period[1]
Measure Name
SNF 30-Day All-Cause
Readmission Measure
Raw Rate
0.18751
Inverted
Rate[3]
0.81249
CMS' National
Performance Standards[4]
0.79590
Benchmark
0.83601
Estimated SNF
Performance
Score[7]
0-100 Scale
42.22510.18751
Threshold
Baseline Period[2]
SNF Performance
Inverted Rate[3]
SNF Improvement Score = ([10 x )] - 0.5) x 10
In our analysis, improvement is not recognized due to limited data availability

© 2018 DataGen. May not be reproduced or distributed without prior written permission.
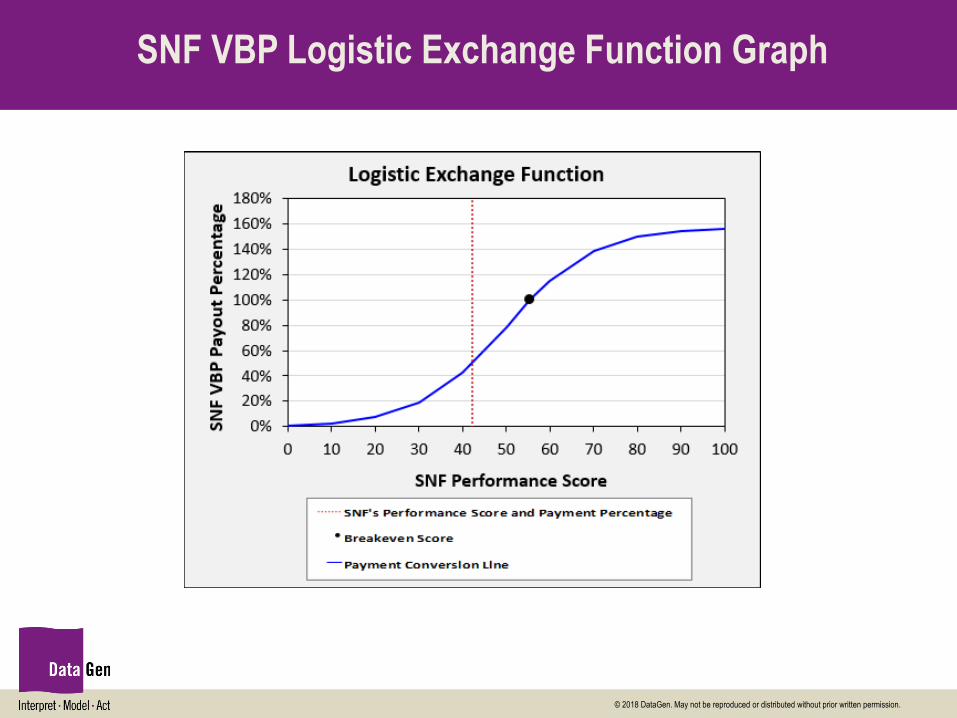
SNF VBP Payment Percentage Calculation
• SNFRM scores for all SNFs nationwide are compared to determine VBP
payouts/impacts
• Comparison of SNFRM scores are plugged into logistic exchange function
• SNF VBP logistic exchange function scaling factor is used to ensure redistribution
of 60% of SNF VBP contribution dollars
SNF VBP Logistic Exchange Function = [ x SNF VBP Logistic Payout Function Scaling Factor]
Payment Percentage
𝑆𝑁𝐹 𝑉𝐵𝑃 𝑆𝑐𝑎𝑙𝑖𝑛𝑔 𝐹𝑎𝑐𝑡𝑜𝑟 × = 𝑺𝑵𝑭 𝑽𝑩𝑷 𝑷𝒂𝒚𝒎𝒆𝒏𝒕 𝑷𝒆𝒓𝒄𝒆𝒏𝒕𝒂𝒈𝒆
1.574 × = 𝑺𝑵𝑭 𝑽𝑩𝑷 𝑷𝒂𝒚𝒎𝒆𝒏𝒕 𝑷𝒆𝒓𝒄𝒆𝒏𝒕𝒂𝒈𝒆
49.6% = 𝑺𝑵𝑭 𝑽𝑩𝑷 𝑷𝒂𝒚𝒎𝒆𝒏𝒕 𝑷𝒆𝒓𝒄𝒆𝒏𝒕𝒂𝒈𝒆
In this example, this SNF would receive 49.6% of their SNF VBP
contribution and would lose from the program.

© 2018 DataGen. May not be reproduced or distributed without prior written permission.
SNF VBP Impact Calculation
• SNF VBP Payout = [SNF 2.0% Program Contribution x SNF VBP Payment Percentage]
• Annual Program Impact = [SNF VBP Payout - SNF 2.0% Program Contribution]
(2.0% X $1,000,000) x 𝟒𝟗. 𝟔% = 𝑺𝑵𝑭 𝑽𝑩𝑷 𝑷𝒂𝒚𝒐𝒖𝒕
$9,920 = 𝑺𝑵𝑭 𝑽𝑩𝑷 𝑷𝒂𝒚𝒐𝒖𝒕
$9,920 - $20,000 = 𝑨𝒏𝒏𝒖𝒂𝒍 𝑷𝒓𝒐𝒈𝒓𝒂𝒎 𝑰𝒎𝒑𝒂𝒄𝒕
For example, assume this SNF’s Medicare Revenue = $1,000,000.
-$10,080 = 𝑨𝒏𝒏𝒖𝒂𝒍 𝑷𝒓𝒐𝒈𝒓𝒂𝒎 𝑰𝒎𝑝𝒂𝒄𝒕
$20,000 x 𝟒𝟗. 𝟔% = 𝑺𝑵𝑭 𝑽𝑩𝑷 𝑷𝒂𝒚𝒐𝒖𝒕

© 2018 DataGen. May not be reproduced or distributed without prior written permission.
• SNF VBP Logistic Exchange Function is used to determine program payouts• SNF VBP Scaling Factor is set at the value that redistributes 60% of SNF contributions (it is
not a budget neutral program)
SNF VBP Logistic Exchange Function Scaling Factor
Calculation
Payout Pre-Scaling/Contribution x Scaling Factor
Actual % Payout x
Contribution
Impact = Actual Payout $ - Contribution
SNFRM
Score ContributionPayout
(Pre-Scaling)
Actual % Payout(Scaling Factor = 1.468932)
Payout(Scaling Factor = 1.468932)
SNF A 42.5343 $100 $32.16 47.24% $47.24
SNF B 6.5456 $100 $1.28 1.88% $1.88
SNF C 4.7898 $100 $1.08 1.58% $1.58
SNF D 75.6789 $100 $92.88 136.43% $136.43
SNF E 61.5221 $100 $75.99 111.63% $111.63
SNF F 27.6764 $100 $9.69 14.23% $14.23
SNF G 21.5146 $100 $5.48 8.04% $8.04
SNF H 15.9723 $100 $3.22 4.73% $4.73
SNF I 70.0486 $100 $88.13 129.46% $129.46
SNF J 92.2851 $100 $98.56 144.78% $144.78
Total $1,000 $408.46 $600
60% of Total $600
Payout Pre-Scaling
xi
x Contribution
© 2018 DataGen. May not be reproduced or distributed without prior written permission.
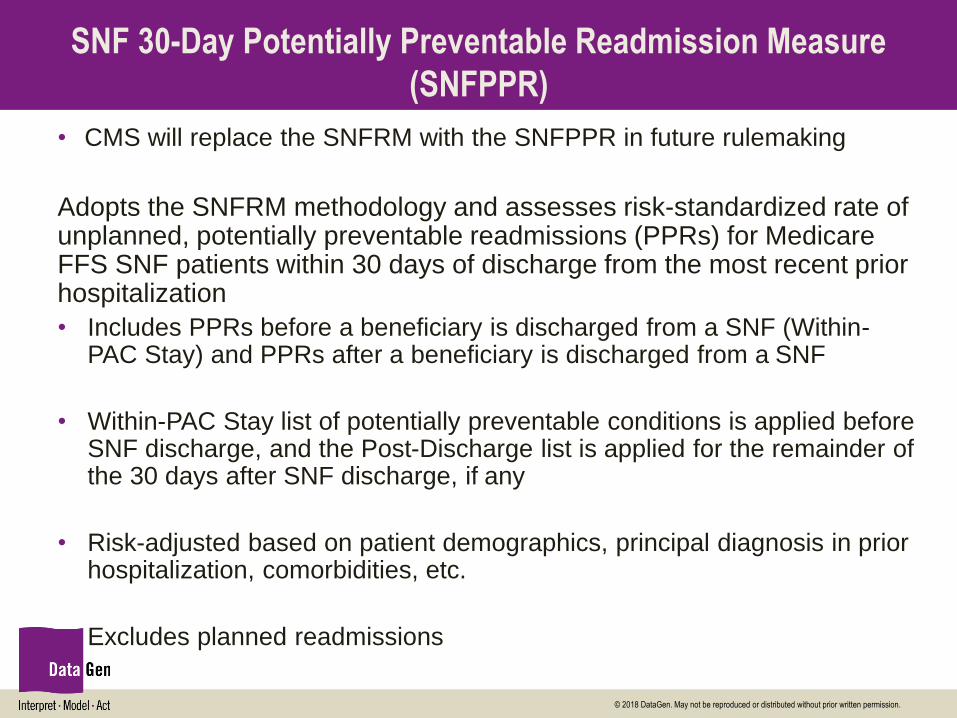
SNF 30-Day Potentially Preventable Readmission Measure
(SNFPPR)
• CMS will replace the SNFRM with the SNFPPR in future rulemaking
Adopts the SNFRM methodology and assesses risk-standardized rate of unplanned, potentially preventable readmissions (PPRs) for Medicare FFS SNF patients within 30 days of discharge from the most recent prior hospitalization
• Includes PPRs before a beneficiary is discharged from a SNF (Within-PAC Stay) and PPRs after a beneficiary is discharged from a SNF
• Within-PAC Stay list of potentially preventable conditions is applied before SNF discharge, and the Post-Discharge list is applied for the remainder of the 30 days after SNF discharge, if any
• Risk-adjusted based on patient demographics, principal diagnosis in prior hospitalization, comorbidities, etc.
• Excludes planned readmissions

© 2018 DataGen. May not be reproduced or distributed without prior written permission.
SNF VBP Impact Analysis Worksheet
Calculation of
SNFRM score
Estimated program
impact calculation
Performance Ranks
Comparison to state
and nation
201710 201710
Measure
ID
SNFRM
A
B
C
D
E
F
G
H
SNFRM Inverted Performance Rate
Estimated SNF Performance Score
Rank within StateRank within U.S.
Logistic Payout Function Scaling Factor 1.574
VBP Payment Percentage [1/(1 + e^(-0.1 X (A - 50)))] X E
Net Gain/Loss ( G - D ) ($22,200)
49.6%
$21,800
Medicare Skilled Nursing Facility Value Based Purchasing (SNF VBP) AnalysisFederal Fiscal Year (FFY) 2019 Estimated Program Performance
Achievement
Points
Earned[5]
0-100 Scale
0.81249 42.2251
SNF Performance
Raw Rate
Improvement
Points
Earned[6]
0-90 Scale
0.0000
Performance Period[1]
Measure Name
SNF 30-Day All-Cause
Readmission Measure
Raw Rate
0.18751
Inverted
Rate[3]
0.81249
Hospital-Based SNF: Sample SNF
Sample Hospital
CMS' National Performance Standards[4]
0.79590
Benchmark
0.83601
Estimated Revenue
VBP Contribution Percentage
SNF VBP
Score
Estimates
42.2251
Estimated SNF
Performance
Score[7]
0-100 Scale
42.22510.18751
Threshold
Baseline Period[2]
SNF Performance
Inverted Rate[3]
SNF Performance Score (Higher of Achievement and Improvement)
SNF VBP
Contribution
AmountProgram Contribution ( B X C ) $44,000
2.00%
$2,201,000
VBP Payout ( F X D )
Estimated
SNF VBP
Program
Impact
0.81249SNF VBP
Performance
Rank 6,777 of 15,404
42.2251
79 of 139
0%
20%
40%
60%
80%
100%
120%
140%
160%
180%
0 10 20 30 40 50 60 70 80 90 100SN
F V
BP
Pa
yo
ut
Pe
rce
nta
ge
SNF Performance Score
Logistic Exchange Function
SNF's Performance Score and Payment Percentage
Breakeven Score
Payment Conversion Line
Print...
© 2018 DataGen. May not be reproduced or distributed without prior written permission.
SNF VBP Logistic Exchange Function Graph

© 2018 DataGen. May not be reproduced or distributed without prior written permission.
SNF VBP Estimated National Performance
The percent impacts shown are estimates using CY 2015 as a performance period and a baseline period. The actual performance period in the FFY 2019 program will be CY 2017 and therefore impacts may change.

© 2018 DataGen. May not be reproduced or distributed without prior written permission.
Collaboration
• Both hospitals and SNFs get penalized by
Medicare for readmissions
• SNFs and hospitals can work together to
decrease readmissions

© 2018 DataGen. May not be reproduced or distributed without prior written permission.
Questions?