medical technology investing...the current climate
Upload: inflection-point-executive-coaching-consulting-for-medtech-biopharma-and-healthcare-services
Post on 14-Jan-2017
286 views
TRANSCRIPT

Venture Healthcare – Industry Update
S V B - P h oen ix C on feren ce
P h oen ix M ed icalD evice C on feren ce
O ctober2 0 1 5

Jon N orris- jn orris@ svb.com 2
Manage West Coast Healthcare Relationshipsfor SVB across the SVB Platform, including
Fund of Funds (Investment as LP)
Direct Equity (Co-Investments and Rights to Invest)
Commercial Bank (Venture/Mezzanine Debt, Asset-based Debt,New Fundings)
Equity Financing Strategy for Early Stage and Venture-BackedCompanies
Industry Thought Leadership
Jon Norris: Managing Director, SVB Capital
Jonathan NorrisManaging Director,HealthcareSilicon Valley Bank
Mobile [email protected]: @jonnysvb
Publications
Trends in Healthcare Investments and Exits (2015)
A Year of Dazzling Returns: 2014 Healthcare Investmentsand Exits (2015)
Trends in Healthcare Investments and Exits (2014)
Strong Momentum in Healthcare (2013)
First Mover Advantage (2012)
Continued Rebound (2012)
Trends in M&A (2011)
Bringing Home the Bacon (2010)
3Jon N orris- jn orris@ svb.com 3
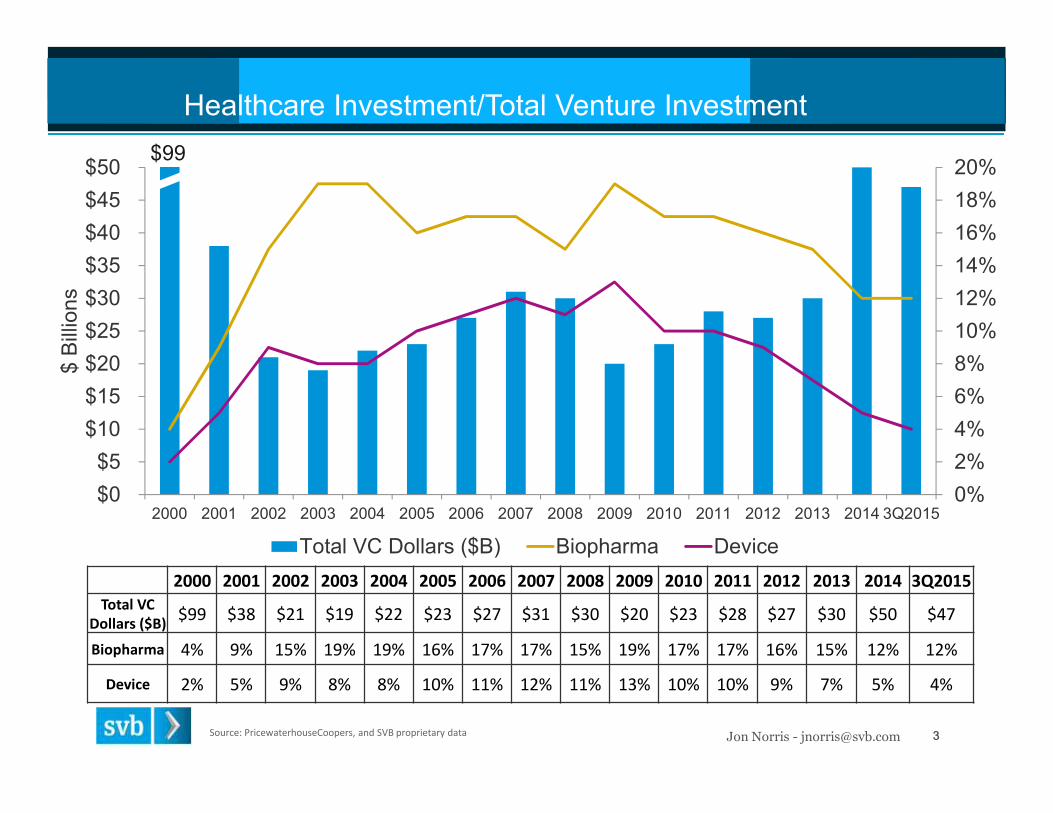
2000 2001 2002 2003 2004 2005 2006 2007 2008 2009 2010 2011 2012 2013 2014 3Q2015Total VC
Dollars ($B)$99 $38 $21 $19 $22 $23 $27 $31 $30 $20 $23 $28 $27 $30 $50 $47
Biopharma 4% 9% 15% 19% 19% 16% 17% 17% 15% 19% 17% 17% 16% 15% 12% 12%
Device 2% 5% 9% 8% 8% 10% 11% 12% 11% 13% 10% 10% 9% 7% 5% 4%
Healthcare Investment/Total Venture Investment
Source: PricewaterhouseCoopers, and SVB proprietary data
0%
2%
4%
6%
8%
10%
12%
14%
16%
18%
20%
$0
$5
$10
$15
$20
$25
$30
$35
$40
$45
$50
2000 2001 2002 2003 2004 2005 2006 2007 2008 2009 2010 2011 2012 2013 2014 3Q2015
$B
illio
ns
Total VC Dollars ($B) Biopharma Device
$99

4Jon N orris- jn orris@ svb.com 4
Historical Trend Data for Device 2000-3Q2015
3Q2015
Source: PricewaterhouseCoopers, NVCA, Thomson Reuters

5Jon N orris- jn orris@ svb.com 5
Device Investment Into Venture - Consistency since 2009
Year Device $ Invested Dollars as % of Total VC
2007 $3.7 Billion 12%
2008 $3.6 Billion 11%
2009 $2.6 Billion 13%
2010 $2.5 Billion 10%
2011 $2.9 Billion 10%
2012 $2.6 Billion 9%
2013 $2.1 Billion 7%
2014 $2.6 Billion 5%
1H2015 $1.3 Billion (stable) 4%
*3Q2015 Device $ Invested: $821M (includes $200M given to Mevion Medical, led by two Chinese investors)

6Jon N orris- jn orris@ svb.com 6
0%
100%
200%
300%
400%
500%
0
1
2
3
4
5
6
7
8
9
10
2005 2006 2007 2008 2009 2010 2011 2012 2013 2014
$B
illi
on
s
Gap in Funding HC $ Fundraised HC $ Invested % Capital Flow Ratio
Source: PricewaterhouseCoopers, Thompson Reuters, and SVB proprietary data
US Healthcare: Venture Dollars Invested and Raised
Jon N orris- jn orris@ svb.com 7
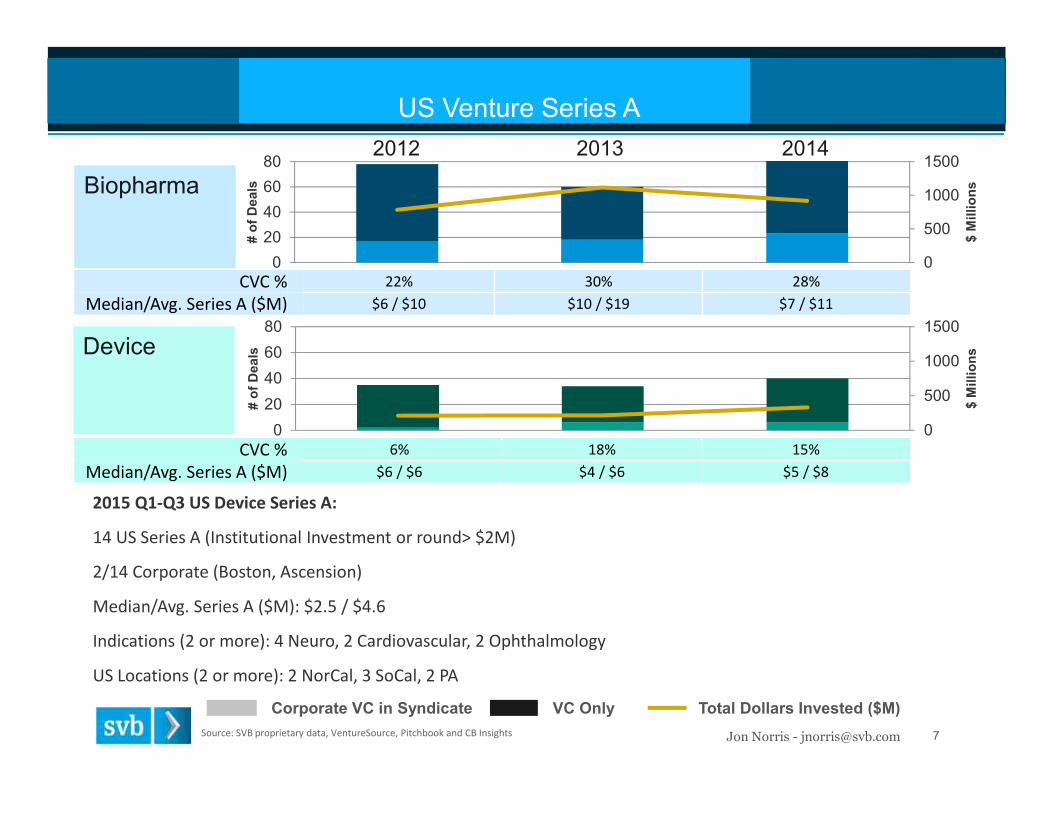
2015 Q1-Q3 US Device Series A:
14 US Series A (Institutional Investment or round> $2M)
2/14 Corporate (Boston, Ascension)
Median/Avg. Series A ($M): $2.5 / $4.6
Indications (2 or more): 4 Neuro, 2 Cardiovascular, 2 Ophthalmology
US Locations (2 or more): 2 NorCal, 3 SoCal, 2 PA
0
500
1000
1500
0
20
40
60
80
$M
illio
ns
#o
fD
eals
0
500
1000
1500
0
20
40
60
80
$M
illio
ns
#o
fD
eals
US Venture Series A
Source: SVB proprietary data, VentureSource, Pitchbook and CB Insights
Device
Biopharma
CVC % 6% 18% 15%
Median/Avg. Series A ($M) $6 / $6 $4 / $6 $5 / $8
CVC % 22% 30% 28%
Median/Avg. Series A ($M) $6 / $10 $10 / $19 $7 / $11
2012 2013 2014
Total Dollars Invested ($M)VC OnlyCorporate VC in Syndicate
Jon N orris- jn orris@ svb.com 8
0
4
8
12
16
20
24
#o
fD
ea
ls
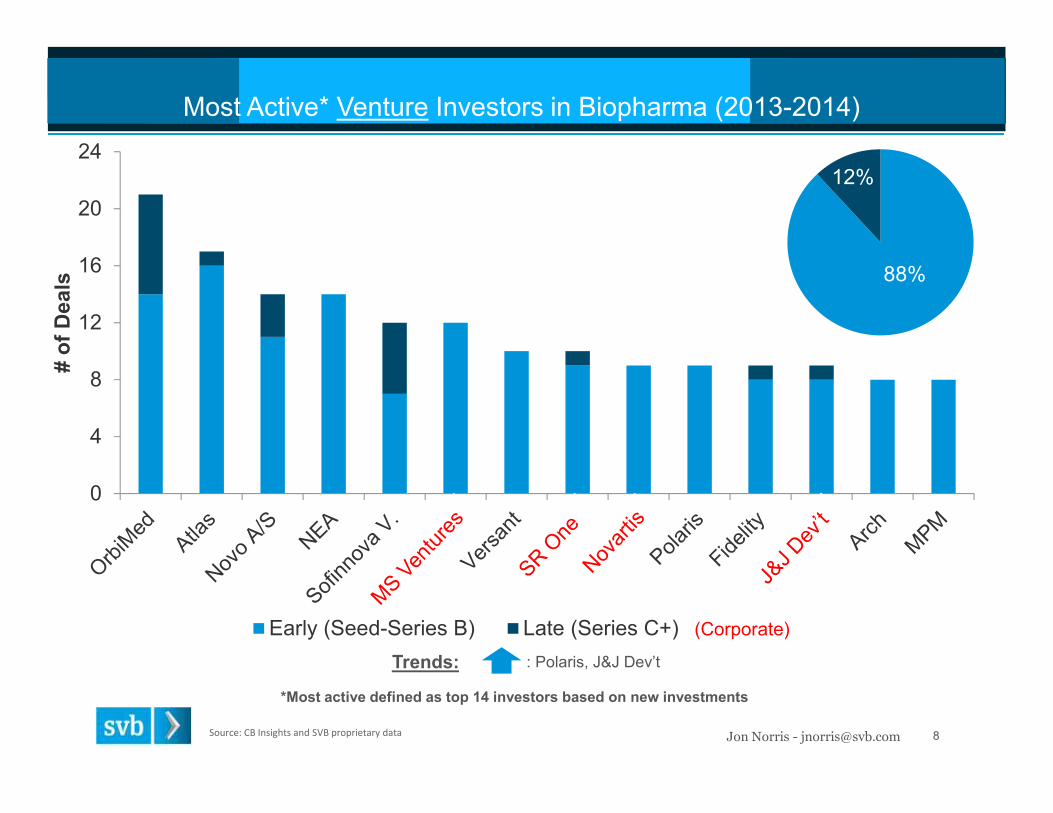
Early (Seed-Series B) Late (Series C+)
*Most active defined as top 14 investors based on new investments
Most Active* Venture Investors in Biopharma (2013-2014)
(Corporate)
Source: CB Insights and SVB proprietary data
12%
88%
: Polaris, J&J Dev’tTrends:

Jon N orris- jn orris@ svb.com 9
0
1
2
3
4
5
6
7
8
9
10
Early (Seed-Series B) Late (Series C+)
64%
36%
Most Active* Venture Investors in Device (2013-2014)
(Corporate)
Source: CB Insights and SVB proprietary data
: Sofinnova P., Sightline, Kearny, BioStar, Emergent, LightstoneTrends:
*Most active defined as top 13 investors based on new investments
#o
fD
ea
ls
Jon N orris- jn orris@ svb.com 10
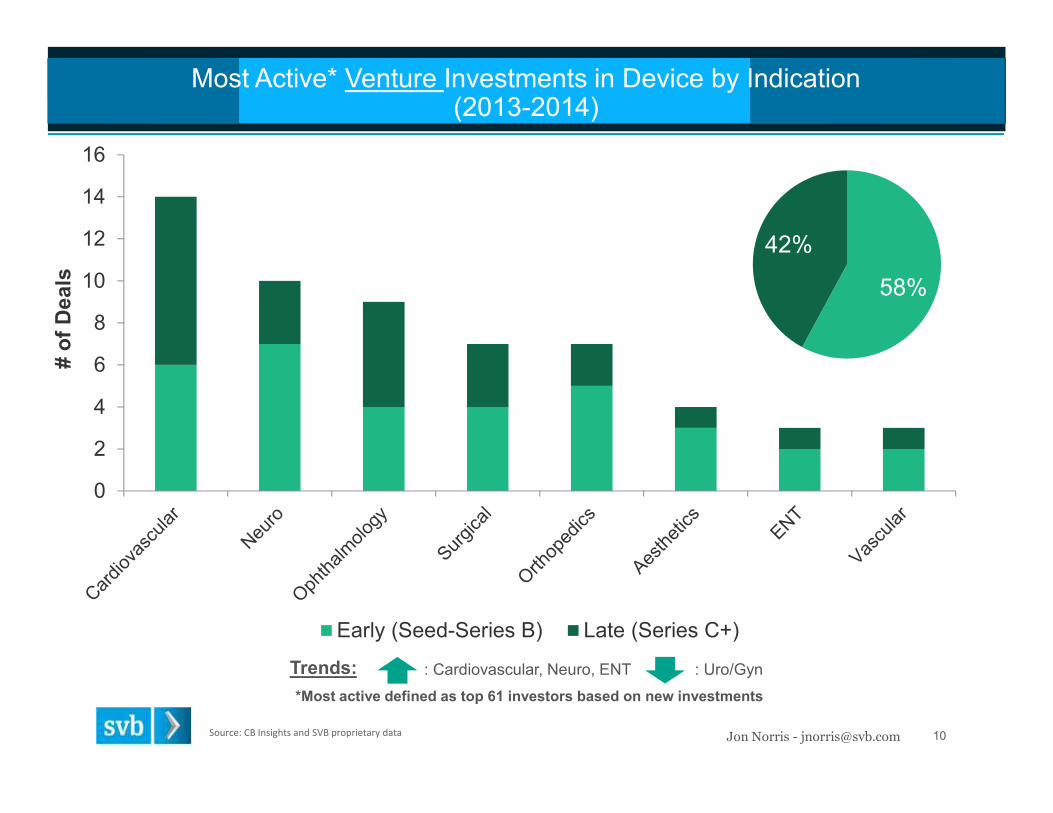
0
2
4
6
8
10
12
14
16
Early (Seed-Series B) Late (Series C+)
*Most active defined as top 61 investors based on new investments
Most Active* Venture Investments in Device by Indication(2013-2014)
: Cardiovascular, Neuro, ENT : Uro/GynTrends:
58%
42%
Source: CB Insights and SVB proprietary data
#o
fD
ea
ls

Jon N orris- jn orris@ svb.com 11
Most Active* Venture Investments in Device by Location (2013-2014)
*Most active defined as top 61 investors based on new investments (duplicate investments removed)
Source: CB Insights and SVB proprietary data
Northern CA,32
Southern CA,11
OUS, 9
MN, 5
WA, 3
MA, 3
2
1
1
1
1
1
1
1
OUS Countries
Ireland
Canada
India
Finland
China
UnitedKingdomFrance
Germany
12Jon N orris- jn orris@ svb.com 12
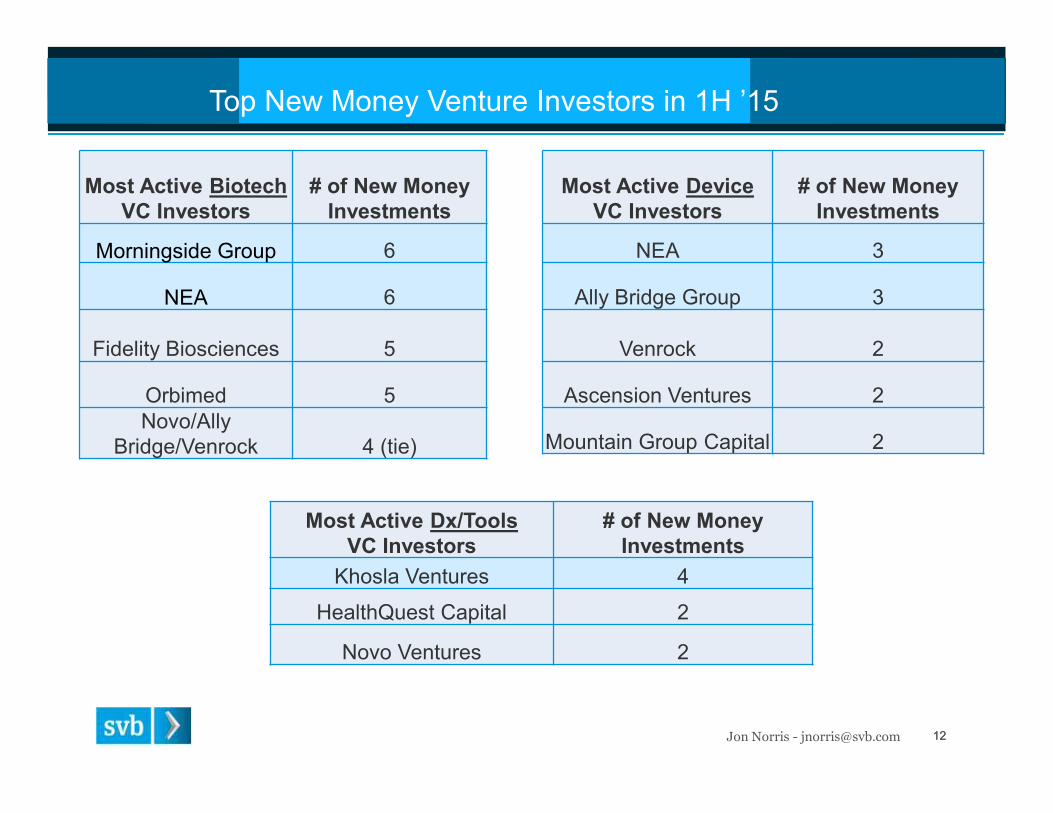
Top New Money Venture Investors in 1H ’15
Most Active BiotechVC Investors
# of New MoneyInvestments
Morningside Group 6
NEA 6
Fidelity Biosciences 5
Orbimed 5Novo/Ally
Bridge/Venrock 4 (tie)
Most Active DeviceVC Investors
# of New MoneyInvestments
NEA 3
Ally Bridge Group 3
Venrock 2
Ascension Ventures 2
Mountain Group Capital 2
Most Active Dx/ToolsVC Investors
# of New MoneyInvestments
Khosla Ventures 4
HealthQuest Capital 2
Novo Ventures 2

13Jon N orris- jn orris@ svb.com 13
Q3 ‘15 Device Update
Q3 ‘15 Device Update:4 Deals raising more than $100M rounds in Q3
Top deal in first half was only $57M.6/10 Deals w/ Cross Over participation, versus 3/10 in Q2.
Not your typical BioPharma crossovers like RA and Rock Springs –examples include Longwood, Third Point, Seneca and Woodford.
5/10 Deals included Corporate Venture, way up over previous years and upover Q2 (2/10)
One deal with Boston, and a few with JJDC, but includes less knownplayers like Sino, Santen, Intersect Partners, Healthcor, and Hoya.
Endavor Vision did three new deals in Q3 (Reshape, Gynesonics, andCeQur).
Swiss based firm that raised over $100M+ Medtech fund in late 2014Final Take away:
New $ moving in to the sector – be prepared for lots of China interestin 2016 (really, we mean it this time!)
Jon N orris- jn orris@ svb.com 14
0
5
10
15
20
25
#o
fD
eals
Biopharma Medical Device Tools/Dx
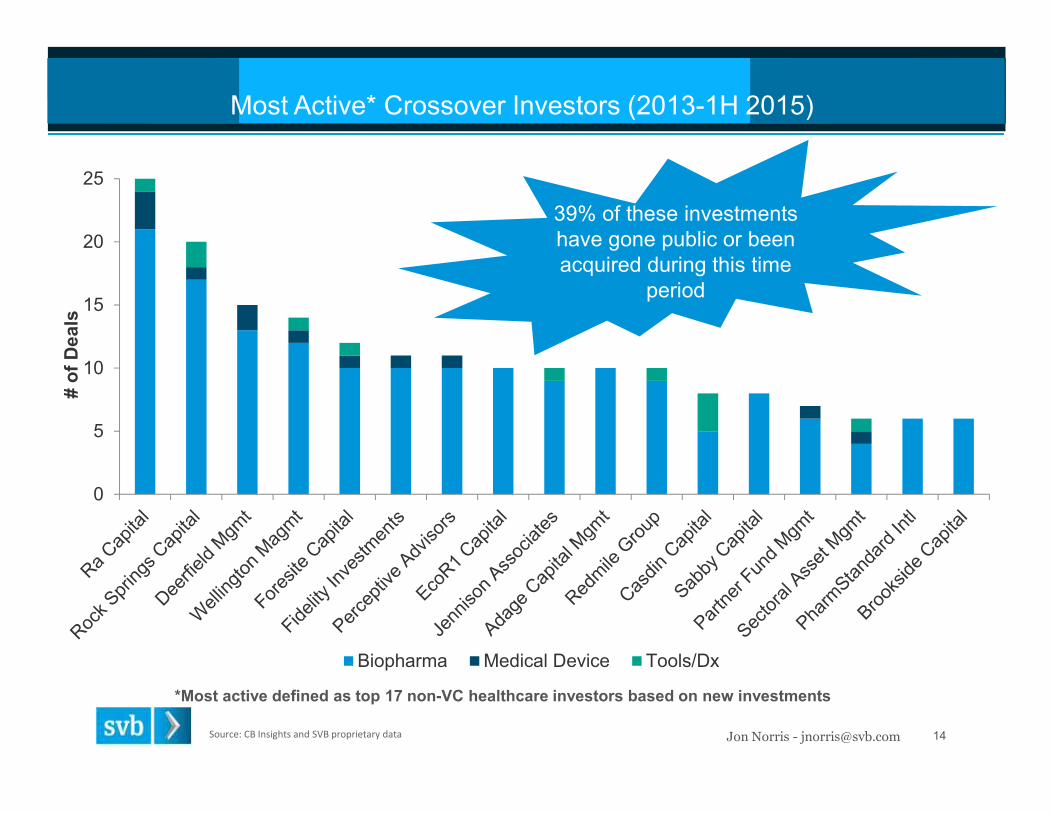
Most Active* Crossover Investors (2013-1H 2015)
Source: CB Insights and SVB proprietary data
*Most active defined as top 17 non-VC healthcare investors based on new investments
39% of these investmentshave gone public or beenacquired during this time
period

15Jon N orris- jn orris@ svb.com 15
Device Pre Money Valuations in Private Device Companies2012 – 3Q2015
Jon N orris- jn orris@ svb.com 16
0
10
20
30
40
50
60
70
80
90
2005 2006 2007 2008 2009 2010 2011 2012 2013 2014 3Q2015
#o
fB
igE
xit
s
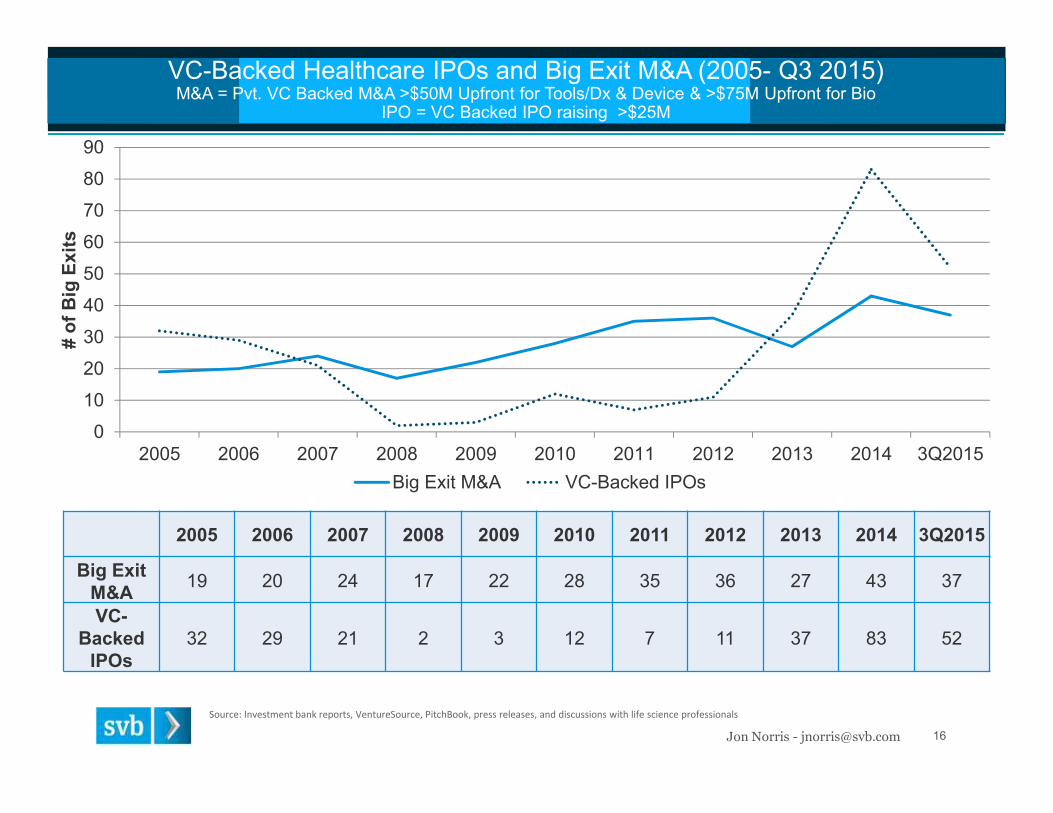
Big Exit M&A VC-Backed IPOs
VC-Backed Healthcare IPOs and Big Exit M&A (2005- Q3 2015)M&A = Pvt. VC Backed M&A >$50M Upfront for Tools/Dx & Device & >$75M Upfront for Bio
IPO = VC Backed IPO raising >$25M
Source: Investment bank reports, VentureSource, PitchBook, press releases, and discussions with life science professionals
2005 2006 2007 2008 2009 2010 2011 2012 2013 2014 3Q2015
Big ExitM&A
19 20 24 17 22 28 35 36 27 43 37
VC-Backed
IPOs32 29 21 2 3 12 7 11 37 83 52

Jon N orris- jn orris@ svb.com 17
0
2
4
6
8
10
12
14
16
18
20
22
2005 2006 2007 2008 2009 2010 2011 2012 2013 2014 3Q2015
To
tal
Va
lue
($B
illi
on
s)
Big Exit Upfront Payments Big Exit Milestones to be Earned Pre-Money IPO Value
*Potential distribution calculated as 75% of Upfront Payments, 25% of Milestones, and 75% of Pre-Money IPO Value
Potential Distributions* From VC-Backed IPOs and M&A (2005 – Q3 2015)
Source: Investment bank reports, VentureSource, press releases, CB Insights, and discussions with life science professionals
2015: Projected numbers outpace 2013and approach last year’s record returns

Jon N orris- jn orris@ svb.com 18
VC Backed Device Exits by Quarter 2013 – Q32015
• Device IPOs: 4/7 IPOs in 1H’15 had <$11M Rev in Previous 12 months
• Q3: 9 M&A, with 5/9 companies Non-Approved; 3 CE Mark Only
Source: CB Insights, press releases, and SVB proprietary data
Q1 Q2 Q3 Q4 Total
2013 IPO 0 0 0 2 2
M&A 1 2 6 2 11
2014 IPO 1 5 1 3 10
M&A 2 9 5 2 18
2015 IPO 3 4 3 10
M&A 0 4 9 13

Jon N orris- jn orris@ svb.com 19
VC-Backed Device Exits by Stage (2009 – 3Q2015)
Source: Press releases, CB Insights, and SVB proprietary data
0
2
4
6
8
10
12
14
16
18
20
2009 2010 2011 2012 2013 2014 3Q2015
#o
fB
igE
xit
s
Non-Approved CE Mark U.S. Commercial
Represents number of IPOs
Represents Big Exit M&A
1 1
2
1
2
1 2 7
1 2 8

Jon N orris- jn orris@ svb.com 20Source: Press releases, CB Insights, and SVB proprietary data
VC-Backed Device Exits by Indication 2014- Q32015
0
1
2
3
4
5
6
7
8
9
10
#o
fC
om
pan
ies
Non-Approved CE Mark U.S. Commercial
Represents number of IPOs
Represents Big Exit M&A
1 1
1
1
1
2 3
2
1
1 1

Jon N orris- jn orris@ svb.com 21
0
200
400
600
0
4
8
12
16
20
Deal
Siz
e($
M)
0
200
400
600
0
4
8
12
16
20
2005 2006 2007 2008 2009 2010 2011 2012 2013 2014
Deal
Siz
e($
M)
VC-Backed Big Exit M&A
Biopharma
Device
2005 2006 2007 2008 2009 2010 2011 2012 2013 2014
#ofB
igE
xits
Upfront $: Median ($M) 66 132 89 150 323 160 130 95 130 180
Total Deal $: Median 101 150 121 250 405 200 155 195 220 185
Upfront $: Median ($M) 230 410 346 200 200 158 208 155 200 225
Total Deal $: Median 230 435 346 285 403 380 407 350 440 413
Avg. Upfront ($M)Avg. Total Deal Value ($M)# of Structured Deals
Source: Investment bank reports, press releases, anddiscussions with life science professionals
#ofB
igE
xits
2015 Q1-Q3 Device Big Exit M&A:
Deals (Structured/Unstructured): 14 (8/6)
Upfront Median/Avg. ($M): $163 / $199
Total Deal Median/Avg. ($M): $227 / $272

Jon N orris- jn orris@ svb.com 22
VC- Backed Device M&A >$50M
SVB Proprietary Data: Private Venture Backed Big ExitsAverage Multiple calculated at 85% of value divided by venture equity
2009-Q3’15Number of
ExitsStage:
Dev/CE/USAverage Years
to Exit
Vascular 18 1/6/11 7
Imaging 6 0/0/6 10
Cardiovascular 22 7/8/7 6.6
Surgical 16 1/2/13 7.7
Neuro 4 2/2/0 5
Orthopedics 7 0/0/7 7.3
Ophthalmology 6 1/2/3 6.7
Aesthetics 4 0/0/4 4.8
OVERALL AVERAGES 7.0
Jon N orris- jn orris@ svb.com 23
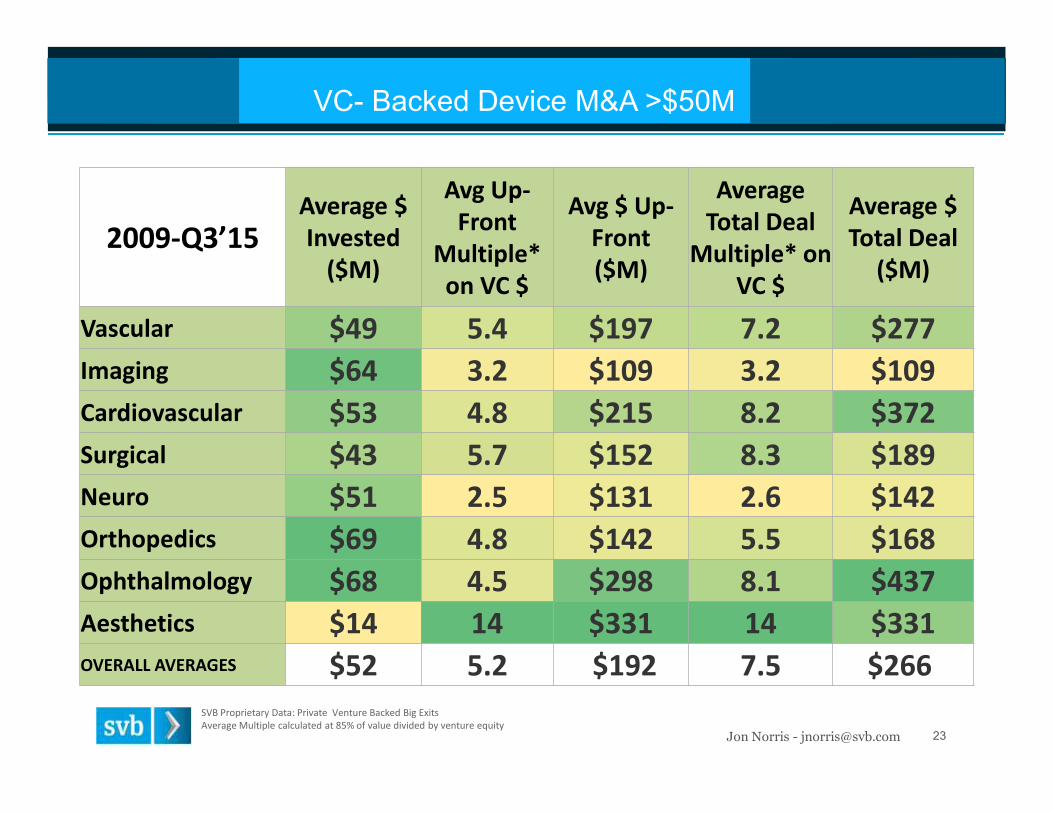
VC- Backed Device M&A >$50M
SVB Proprietary Data: Private Venture Backed Big ExitsAverage Multiple calculated at 85% of value divided by venture equity
2009-Q3’15Average $Invested
($M)
Avg Up-Front
Multiple*on VC $
Avg $ Up-Front($M)
AverageTotal Deal
Multiple* onVC $
Average $Total Deal
($M)
Vascular $49 5.4 $197 7.2 $277
Imaging $64 3.2 $109 3.2 $109
Cardiovascular $53 4.8 $215 8.2 $372
Surgical $43 5.7 $152 8.3 $189
Neuro $51 2.5 $131 2.6 $142
Orthopedics $69 4.8 $142 5.5 $168
Ophthalmology $68 4.5 $298 8.1 $437
Aesthetics $14 14 $331 14 $331OVERALL AVERAGES $52 5.2 $192 7.5 $266

Jon N orris- jn orris@ svb.com 24
Top Acquirers – VC Backed M&A (2009-Q32015)
Acquirer Car
dio
vasc
ula
r
Vas
cula
r
Surg
ical
Ne
uro
Op
hth
alm
olo
gy
Ort
ho
ped
ics
Oth
er
Re
spir
ato
ry
Uro
/Gyn
ENT
Met
abo
lic
SUM
Medtronic (Covidien) 6 6 10 2 0 0 0 1 1 0 0 26
Boston Scientific 5 1 0 1 0 0 1 1 1 0 0 10
Abbott 3 1 0 0 2 0 0 0 0 0 0 6
CR Bard 1 2 2 0 0 0 0 0 0 0 0 5
Stryker 0 1 0 0 0 3 0 0 0 0 0 4
Johnson & Johnson 0 1 0 0 0 0 0 0 0 1 1 3
St. Jude 2 0 0 1 0 0 0 0 0 0 0 3
Allergan 0 0 0 0 2 0 1 0 0 0 0 3
TOTAL 17 12 12 4 4 3 2 2 2 1 1
Jon N orris- jn orris@ svb.com 25
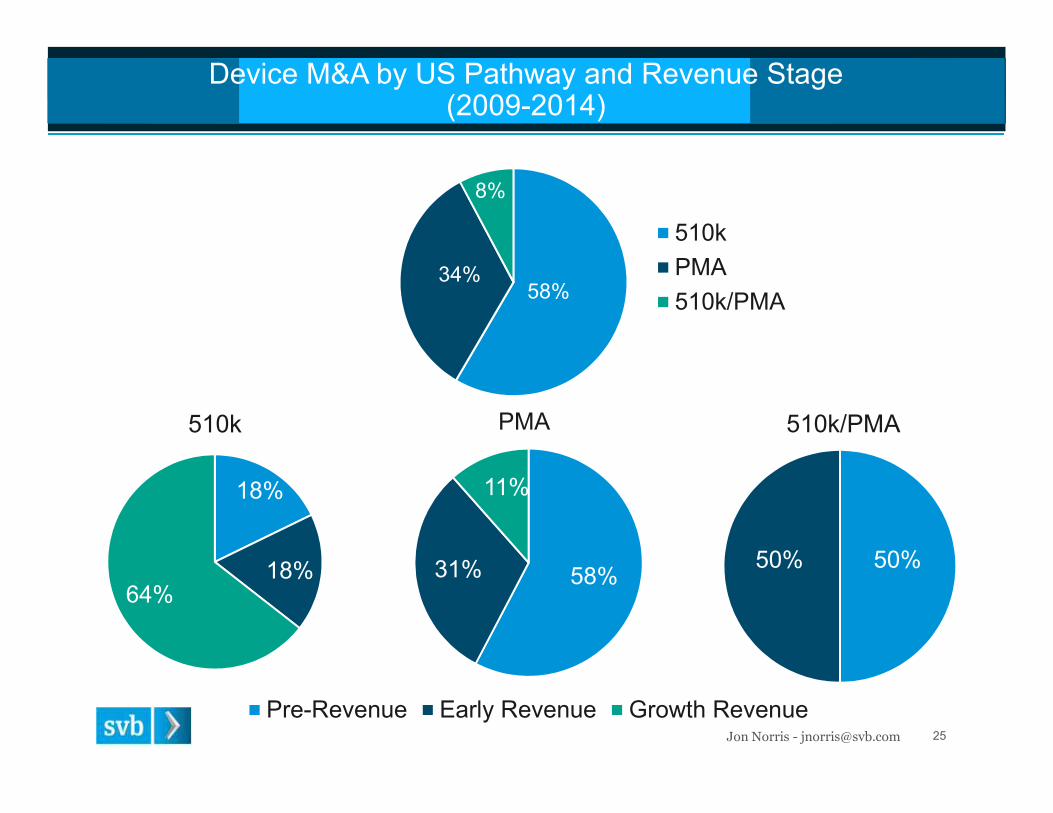
Device M&A by US Pathway and Revenue Stage(2009-2014)
50%50%
510k/PMA
18%
18%64%
510k
58%31%
11%
PMA
Pre-Revenue Early Revenue Growth Revenue
58%34%
8%
510k
PMA
510k/PMA

Jon N orris- jn orris@ svb.com 26
Device M&A: Analysis by US Pathway(2009-2014)
N = 45 N = 26 N = 6
510k PMA 510k/PMAMedian Time to Exit (Years) 6.5 6.8 6.2
Median $ Invested (MMs) $33.0 $62.0 $43.0
Median Up-Front $ Value (MMs) $120.0 $193.0 $85.0
Median Total Deal $ Value (MMs) $132.0 $325.0 $120.0
Median Upfront Multiple 3.68x 2.62x 2.35xMedian Total Multiple 3.76x 5.60x 2.73x

Jon N orris- jn orris@ svb.com 27
Device M&A: Values by Revenue Stage(2009-2014)
510k n = 8 n = 8 n = 29
MMs Pre-Revenue Early Revenue Growth Revenue
Median Up-Front $ Value $83.0 $90.0 $135.0
Median Total Deal $ Value $100.0 $110.0 $150.0
Median Time to Exit (Years) 3.4 7.0 6.8
PMA n = 15 n = 8 n = 3
MMs Pre-Revenue Early Revenue Growth Revenue
Median Up-Front $ Value $193.0 $188.0 $230.0
Median Total Deal $ Value $325.0 $393.0 $255.0
Median Time to Exit (Years) 5.3 8.8 11.1
Thank you!!!
28S V B - P h oen ix C on feren ce

Medical Device Market Update
October 2015 CONFIDENTIAL

Average Revenue
Multiple (2) 5.81x 4.03x 3.76x 2.85x 4.53x 3.41x 3.85x 3.99x 4.19x 3.38x
Average Deal Value
(Excl. Mega Deals) (3) $216 $1,124 $1,193 $462 $370 $792 $630 $368 $517 $902
$6
$45
$37
$11$14
$28
$20
$11$14 $22
$38
$5
$19
$9
$73
$47
$19
$87
30
40
31
23
38
35
3129
27
24
0
10
20
30
40
50
$0
$10
$20
$30
$40
$50
$60
$70
$80
$90
2006 2007 2008 2009 2010 2011 2012 2013 2014 2015
Excluding Mega Mergers, Average Transaction Sizes are at Their Highest Levels Since 2008
Med
ical
Dev
ice
M&
AV
olu
me
(1)
Dea
lV
olu
me
($b
n)
Trends in M&A Volume
Representsmega-deals
________________________Source: Wall Street research, Company filings and FactSet.Note: Transaction values include earnouts as disclosed. Valtech Cardio excludes earnouts (~$560mm incremental value at time of announcement).(1) Historical statistics through 2012 per Wall Street research report dated 12/22/14. 2013 through 2015 per FactSet, Company filings and Wall Street research.(2) Historical statistics through 2014 per Wall Street research report dated 12/22/14. 2015 per FactSet, Company filings and Wall Street research.(3) Excludes Guidant, Synthes, Bausch & Lomb (take private and sale), Biomet (take private and sale), Covidien and CareFusion.
#o
fD
eals
2015 YTD:
Dentsply / Sirona
St. Jude / Thoratec
Hill-Rom / Welch Allyn
Cardinal / J&J Cordis
Greatbatch / Lake Region
Boston Scientific / EndoAMS
Cyberonics / Sorin
Straumann / Neodent
Medtronic / Twelve
XIO Group / Lumenis
Edwards / CardiaQ
Heartware/ ValtechCardio
Integra / TEI
Allergan / AqueSys
Medtronic / RF Surgical
Abbott / Tendyne
St. Jude / SpinalModulation
Steris / General Econopak
Medtronic /Medina
Atricure / nContact
Medtronic / Aptus
Medtronic / Lazarus
TransEnterix / SOFARRobotics
Medtronic / CardioInsight
1

NA NA NA NA NA 4.70x NA NA NA NA NA NA NA NA2015 EV/Rev:
$929
$458$400
$300$250 $235
$175 $175 $150$110 $100 $100 $99 $93
$0
$100
$200
$300
$400
$500
$600
$700
$800
$900
$1,000
4.38x 6.86x ~3.00x 2.49x ~2.15x 3.30x 1.60x 1.66x 5.75x 4.50x2015 EV/Rev:
$5,560
$3,400
$2,050$1,944 $1,730 $1,650
$1,400
$510 $478 $312
$0
$1,000
$2,000
$3,000
$4,000
$5,000
$6,000
________________________Source: Press Releases and Wall Street Research(1) Includes potential earnouts.(2) Excludes potential earnouts.
2015 Transactions To Date
Twelve SOFARRobotics
Lat
erS
tag
e/
Co
mm
erci
al
Dea
lV
alu
e($
mm
)
Mean: $1,903mm
Mean: $256mm
(1)
(1)
(1)
(2)
(2)
(2) (2)
(2) (2)
Dea
lV
alu
e($
mm
)
Ear
lyS
tag
e
2

Selected Pre-PMA Medical Device Precedent Transactions
________________________Source: Company website, filings, Wall Street research, and FactSet as of 10/16/15.(1) Future payments tied to regulatory milestones were undisclosed.(2) Represents approximate values assuming the pre-announcement Heartware closing price of $81.81 to imply upfront and future earn-out payments.(3) Abbott acquired the remainder of the equity of Tendyne that it did not own for $225mm, or a transaction value of $250mm plus milestone payments.
DateAnnounced
Acquiror TargetTarget Public
vs. PrivateCE Mark Upfront Value
PotentialEarnout
TotalConsideration
Earnout as a % ofTotal
10/04/15 AtriCure nContact Private $99 $50 $149 33.6%
09/03/15 Allergan AqueSys Private 300 NA 300 NA
09/01/15 Heartware Valtech Cardio Private 360 569 929 61.2%
08/25/15 Medtronic Twelve Private 408 50 458 10.9%
07/30/15 Abbott Tendyne Private 250 NA 250 NA
07/10/15 Edwards Lifesciences CardiAQ Valve Technologies Private 350 50 400 12.5%
08/19/13 St. Jude Medical Endosense Private 171 161 332 48.5%
07/15/13 Abbott OptiMedica Private 250 150 400 37.5%
06/07/13 St. Jude Medical Spinal Modulation Private 40 300 340 88.2%
11/08/12 Boston Scientific Vessix Vascular Private 125 300 425 70.6%
10/08/12 Boston Scientific Rhythmia Medical Private 90 175 265 66.0%
03/09/12 Boston Scientific Cameron Health Private 150 1200 1350 88.9%
12/20/11 Bard Lutonix Private 225 100 325 30.8%
01/19/11 Boston Scientific Atritech Private 100 275 375 73.3%
11/22/10 Medtronic Ardian Private 800 NA 800 NA
11/19/10 Boston Scientific Sadra Medical Private 193 193 386 50.0%
09/03/10 St. Jude Medical CardioMEMS Private 60 375 435 86.2%
07/07/10 Alcon LenSx Lasers Private 362 383 745 51.4%
09/10/09 Abbott Labs Evalve Private 356 90 446 20.2%
09/02/09 Abbott Labs Visiogen Private 400 0 400 0.0%
06/02/09 ev3 Chestnut Medical Private 75 75 150 50.0%
02/23/09 Medtronic CoreValve Private 700 150 850 17.6%
02/23/09 Medtronic Ventor Private 325 0 325 0.0%
02/13/09 Thoratec Heartware (terminated) Public 282 0 282 0.0%
01/12/09 Medtronic Ablation Frontiers Private 225 NA 225 NA
12/22/08 St. Jude Medical MediGuide Private 300 0 300 0.0%
09/25/08 Medtronic CryoCath Public 378 0 378 0.0%
06/16/08 Medicis Liposonix Private 150 150 300 50.0%
Mean $275 $206 $451 40%
Median 250 150 378 48%
(1)
(2)
(1)(3)
3

Top 50 Device Companies – Then vs. NowCompany MV ($mm)
1 Medtronic $60,0372 Boston Scientific 29,6963 Alcon 24,6364 Guidant 23,1225 Zimmer 19,6696 Stryker 19,4217 St. Jude Medical 15,0438 Becton Dickinson 14,3669 Synthes Inc 12,879
10 Biomet Inc. 10,96411 C. R. Bard 6,69712 Varian Medical 5,77413 Kinetic Concepts 5,22114 DENTSPLY 4,53015 Hillenbrand 3,44516 Bausch & Lomb 3,43217 Cytyc 3,08018 Edwards Lifesciences 2,45219 Cooper Companies 2,31220 Inamed 2,27121 Teleflex 2,10022 Respironics 1,92623 ResMed 1,74424 STERIS 1,64125 Advanced Medical Optics 1,52526 Sybron Dental 1,41127 Intuitive Surgical 1,37028 Mentor 1,36729 Arrow 1,36230 Integra LifeSciences 1,07831 Kyphon 1,06532 Given Imaging 99433 Wright Medical 96534 Haemonetics 93735 CONMED 82436 Adv. Neuromodulation Systems 80337 Laserscope 78938 Symmetry Medical 698
39 Syneron Medical (1) 692
40 ArthroCare 68641 Align Technology 65442 IntraLase 629
43 Orthofix (1) 614
44 Analogic 61345 Datascope 587
46 SurModics (1) 573
47 Foxhollow Technologies 54748 Aspect Medical Systems 51049 Thoratec 50450 Cyberonics 495
10Y
ears
Ag
o(1
2/31
/04
)
To
day
________________________Source: Market values per FactSet as of 12/31/04 and 10/16/15. Note: Excludes Abbott, Johnson & Johnson and Baxter. Except for LivaNova, excludes announcedpending acquisitions. (1) Publicly traded today but not the public Top 50 medical device companies.
• Of the Top 50 standalone U.S. device companies U.S.
ten years ago, 24 (48%) have been acquired or taken
private
• Mid-cap companies that were sub-$10bn then
were slightly more vulnerable with 20 (50%)
out of 40 acquired or taken private
• P/E multiples for the remaining constituents have
compressed by >20% since their peak
• Over 50% of Today’s Top 50 constituents are new
entrants of the list
• Some IPOs / spin-off’s have been introduced
then acquired within the 10 year cycle (e.g.,
Covidien, AGA Medical, Tornier)
• Six were recent IPOs (Glaukos, Nevro, LDR,
K2M, Inogen, Penumbra)
Shaded companies since acquired / taken private ornew Top 50 entrants
Company MV ($mm)1 Medtronic $104,7632 Stryker 37,6673 Becton Dickinson 29,3434 Boston Scientific 22,9415 Zimmer 20,0406 St. Jude Medical 19,1597 Intuitive Surgical 17,3008 Edwards Lifesciences 16,2659 C. R. Bard 14,481
10 Dentsply 7,92211 ResMed 7,89012 Varian Medical Systems 7,60913 Cooper Companies 7,01714 Dexcom 6,66915 Sirona Dental 5,76916 Teleflex 5,37517 Align Technology 4,85718 Abiomed 4,25019 Steris 4,00320 LivaNova 3,36821 Hill-Rom Holdings 3,01522 NuVasive 2,42723 Cantel Medical 2,36524 Globus Medical 2,21125 Integra LifeSciences 2,20726 Wright Medical 2,16727 Masimo 2,09128 ICU Medical 1,77529 Insulet 1,75930 Haemonetics 1,64531 OSI Systems 1,63932 Natus Medical 1,46233 Penumbra 1,46034 Greatbatch 1,39635 CONMED 1,37336 Halyard Health 1,34037 Nevro 1,23938 Merit Medical 1,06739 Analogic 1,06540 NxStage 1,00241 Endologix 94242 Conformis 91443 Inogen 87744 K2M 77845 Heartware 76446 LDR 76447 Cynosure 74048 Glaukos 73349 AtriCure 62150 Vascular Solutions, Inc. 594
4

$1,986
$7,028
$5,242
$1,311
$860
$1,849$2,085
$1,074$1,323
$1,838
$2,648
13
25
29
8 7
18
10
7
14
19
21
0
5
10
15
20
25
30
35
$0
$2,000
$4,000
$6,000
$8,000
2005 2006 2007 2008 2009 2010 2011 2012 2013 2014 2015YTD
IPOs FOs Converts No. of Offerings
The Equity Issuance Market Remains Active
________________________Source: Wall Street research, Company filings and FactSet as of 10/16/15.Note: Excludes deals below $25mm. Current market capitalization per FactSet. If over-allotment period still open, deals assume over-allotment fully exercised.
Dea
lV
olu
me
($m
m)
Nu
mb
ero
fO
ffering
s
• Positive equity marketenvironment and recoveredvaluations allowed issuers to tapthe market
• Strongest new issuance market since 2007
• 18 IPOs (excluding Biomet), 19 Follow-ons and 3 Converts since 2014
• Investor receptivenessexpected to continue
• Several IPOs in thepipeline / on the road
1 2 3
5

Pricing Date Issuer Deal ValuePerform. vsRussell2000
09/18/15 $75.9 (71.3%)
08/13/15 92.0 (30.6%)
08/04/15 231.5 1.1%
07/08/15 117.0 (11.1%)
06/30/15 16.0 (54.8%)
06/11/15 57.5 (15.8%)
06/02/15 103.0 (15.2%)
06/02/15 276.0 (6.5%)
05/28/15 41.8 (12.8%)
02/26/15 69.4 (26.6%)
02/02/15 130.4 0.3%
01/29/15 86.8 (33.2%)
10/29/14 51.9 95.8%
05/14/14 111.9 2.2%
04/16/14 48.0 (71.7%)
04/14/14 56.4 (76.5%)
02/24/14 98.7 5.9%
02/13/14 94.1 (9.8%)
01/24/14 86.3 (56.7%)
11/20/13 90.0 (57.7%)
11/07/13 67.3 136.7%
11/06/13 161.0 49.1%
10/29/13 46.9 (34.4%)
05/09/13 130.0 9.2%
04/25/13 98.3 (61.6%)
Mean $96.9 (16.3%)Median 88.4 (15.5%)
02/13/15 $632.5 (11.4%)
06/04/14 201.0 (15.1%)
05/28/14 230.0 (51.6%)
12/05/13 86.0 (24.1%)
02/07/13 115.0 (3.7%)
Mean $252.9 (21.2%)Median 201.0 (15.1%)
________________________Source: Wall Street research, Company filings and FactSet as of 10/16/15.Note: Excludes deals below $25mm. Current market capitalization per FactSet. If over-allotment period still open,deals assume over-allotment fully exercised. Filed IPOs assume maximum size and launched IPOs assumemidpoint of range.(1) Zimmer acquired Biomet for $13.4bn on 04/24/14.(2) Valeant acquired Bausch & Lomb for $8.7bn on 05/27/13.
Init
ialP
ub
lic
Off
erin
gs
Sin
ce20
13
Las
t25
Fo
llo
w-O
nO
ffer
ing
sL
ast
5C
on
vert
ible
Deb
tO
ffer
ing
s
Medical Device’s Equity Issuance ActivityPricing Date Issuer Deal Value
Current MarketValue ($mm)
Perform. vsRussell2000
Filed [$1,000.0] NA NA
09/17/15 138.0 $1,460 37.6%
06/30/15 155.3 914 43.0%
06/24/15 124.2 826 36.6%
06/12/15 55.2 173 16.5%
06/04/15 109.5 286 (15.9%)
01/29/15 65.0 200 28.3%
01/28/15 41.7 72 (44.9%)
01/28/15 90.0 340 8.0%
11/18/14 36.2 283 (55.4%)
11/05/14 144.9 1,239 147.2%
10/28/14 86.3 104 (62.7%)
07/23/14 63.3 547 77.2%
05/07/14 147.4 778 20.7%
Acquired (1) [100.0] NA NA
04/25/14 55.0 60 (69.8%)
04/15/14 89.7 119 (55.6%)
03/19/14 80.5 165 (43.2%)
02/27/14 84.2 496 15.4%
02/13/14 72.2 877 180.7%
11/13/13 138.0 247 (49.7%)
10/08/13 86.3 764 66.5%
Acquired (2) [100.0] NA NA
Mean $90.8 $447 12.8%Median 36.2 286 15.4%
6
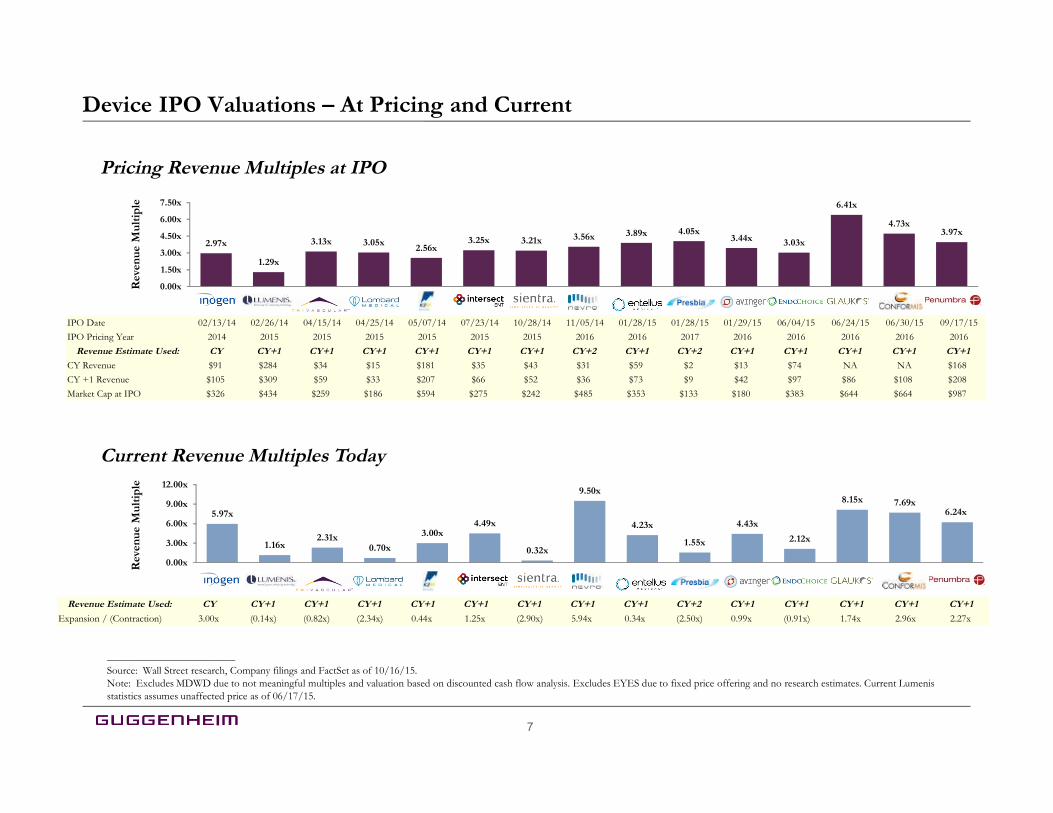
Revenue Estimate Used: CY CY+1 CY+1 CY+1 CY+1 CY+1 CY+1 CY+1 CY+1 CY+2 CY+1 CY+1 CY+1 CY+1 CY+1
Expansion / (Contraction) 3.00x (0.14x) (0.82x) (2.34x) 0.44x 1.25x (2.90x) 5.94x 0.34x (2.50x) 0.99x (0.91x) 1.74x 2.96x 2.27x
5.97x
1.16x2.31x
0.70x
3.00x4.49x
0.32x
9.50x
4.23x
1.55x
4.43x
2.12x
8.15x 7.69x6.24x
0.00x
3.00x
6.00x
9.00x
12.00x
IPO Date 02/13/14 02/26/14 04/15/14 04/25/14 05/07/14 07/23/14 10/28/14 11/05/14 01/28/15 01/28/15 01/29/15 06/04/15 06/24/15 06/30/15 09/17/15
IPO Pricing Year 2014 2015 2015 2015 2015 2015 2015 2016 2016 2017 2016 2016 2016 2016 2016
Revenue Estimate Used: CY CY+1 CY+1 CY+1 CY+1 CY+1 CY+1 CY+2 CY+1 CY+2 CY+1 CY+1 CY+1 CY+1 CY+1
CY Revenue $91 $284 $34 $15 $181 $35 $43 $31 $59 $2 $13 $74 NA NA $168
CY +1 Revenue $105 $309 $59 $33 $207 $66 $52 $36 $73 $9 $42 $97 $86 $108 $208
Market Cap at IPO $326 $434 $259 $186 $594 $275 $242 $485 $353 $133 $180 $383 $644 $664 $987
2.97x
1.29x
3.13x 3.05x2.56x
3.25x 3.21x 3.56x 3.89x 4.05x3.44x 3.03x
6.41x
4.73x3.97x
0.00x
1.50x
3.00x
4.50x
6.00x
7.50x
INGN LMNS TRIV EVAR KTWO XENT SIEN NVRO ENTL LENS AVGR GI GKOS CFMS PEN
Device IPO Valuations – At Pricing and Current
________________________Source: Wall Street research, Company filings and FactSet as of 10/16/15.Note: Excludes MDWD due to not meaningful multiples and valuation based on discounted cash flow analysis. Excludes EYES due to fixed price offering and no research estimates. Current Lumenisstatistics assumes unaffected price as of 06/17/15.
Pricing Revenue Multiples at IPO
Rev
enu
eM
ult
iple
Rev
enu
eM
ult
iple
Current Revenue Multiples Today
7