medical pharmacy & oncology trend report™
TRANSCRIPT

MEDICAL PhArMACy & ONCOLOGy TrEND rEPOrT™
2012 ThIrD EDITION
MAGELLAN PhArMACy SOLuTIONS/ICOrE hEALThCArE www.ICOrEhEALThCArE.COM/TrENDS
A Benchmark for Medical Pharmacy

It is our pleasure to present you with Magellan Pharmacy Solution’s 2012 Medical Pharmacy & Oncology Trend Report™. This is the third edition of this report, and it has been enhanced this year by showing additional data regarding site of service, which is a significant threat to the cost of medications paid under the medical benefit. As we have discussed in the past, various reports exist to describe specialty and oral chemotherapy products paid under the pharmacy benefit; however, no other source exists for direct measures of injectables paid under a payor’s medical benefit, where top drugs such as Neulasta, Remicade, Avastin, Rituxan, Procrit and Aranesp are almost entirely paid. We are excited to continue to be your sole source for these important benchmarking and trending statistics.
In recent years, we’ve seen the trend for traditional oral pharmacy products with essentially no trend (and, in fact, negative trends in well managed plans) when compared with specialty products, where trends are approximately 20 percent for self-administered injectables and double digits for provider-administered products. This finding will continue to prevail, in part due to the oncology pipeline, paired with traditional oral medications losing patents. According to a recent report, by the end of 2013 specialty products will be about 40 percent of total drug spend, and medical benefit injectables will comprise nearly a quarter
of total spend, as shown in the illustration below.
To understand these costs and trends and the payor management initiatives used this year to improve the quality and cost of care compared with previous years, we surveyed 50 top U.S. commercial health plans representing 157.2 million lives. We then evaluated the paid claim files of health plans’ medical benefit injectables such that benchmarks and trends could be determined over the past three years.
We want to offer special thanks to the payor executives who served on this year’s Magellan Pharmacy Solution Medical Pharmacy & Oncology Trend Report™ advisory board. It was their input into the overall objective, content and design that allowed us to offer this comprehensive report.
Sincerely,
Kjel A. Johnson, Pharm.D.Senior Vice President, Strategy & Business Development, Magellan Pharmacy Solutions
Medical Pharmacy – The Future of Specialty and Overall Pharmacy Drug Management
2 LETTEr TO Our rEADErS
● Specialty ● Medical ● Traditional ● Specialty ● Medical ● Traditional
75%60%
14%
22%
11% 18%
ReferencesBerkrot, Bill. U.S. drug spending slows; hits $307 billion in 2010: report. Reuters. http://www.reuters.com/article/2011/04/19/us-drug-spending-idUSTRE73I4G920110419.Express Scripts Inc. 2010 Drug Trend Report. 2011. Medco Health Solutions Inc. Medco 2011 Drug Trend Report. 2011.
2010 2013

CONTENTS 3
Medical Pharmacy & Oncology Trend Report™
4 2012 Survey Methodology and Demographics Magellan Pharmacy Solutions' Medical Pharmacy & Oncology Trend Report™ combines primary survey research data collection with secondary data analysis of medical injectable and oncology claims.
6 Report Summary and Conclusions
7 Payor Survey Data A survey conducted among health plan executives provides a real-world view of current payor coverage strategies and tactics.
MedicAl BenefiT dRug fORMulARy
PROvideR ReiMBuRSeMenT
BenefiT deSign
diSTRiBuTiOn chAnnel MAnAgeMenT
uTilizATiOn MAnAgeMenT
OPeRATiOnAl iMPROveMenTS
35 Health Plan Claims Data Magellan Pharmacy Solutions' analysis of medical injectable and oncology claims allows for a practical interpretation of the drivers related to trend and spend for these products.
TRend dRiveRS
MAnAgeMenT Of SPend dRiveRS
nATiOnAl PROvideR TRendS
OTheR AnAlySeS fOR 2012
45 Product Pipeline and Legislative Trends This section discusses biosimilar and phase 2/3 clinical trial agents by key tumor type, along with a summary of 2012 key legislative outcomes.
dRug PiPeline
Key legiSlATive OuTcOMeS — 2012
58 Glossary
ContributorsMichael H. Waterbury PRESIDENT, IcORE HEAlTHcARE
Erika I. Ruiz-Colon DIREcTOR, SAlES AND STRATEGIc OPERATIONS
Kayla Killian PROJEcT MANAGER
Rob Louie, R.Ph. VIcE PRESIDENT, clINIcAl MEDIcAl PHARMAcy
Jason Peterson, R.Ph. clINIcAl PHARMAcIST
Jeanine Boyle, J.D., M.P.H. HEAlTH cARE REfORM STRATEGy
Michele Marsico DIREcTOR, ANAlyTIcS
Mary Talberg DIREcTOR, IT fINANcIAl INfORMATION MANAGEMENT
Payor Advisory BoardRoger Muller, M.D., FACEP MARKET MEDIcAl DIREcTOR — UNITED HEAlTHcARE
Mona Chitre, Pharm.D. DIREcTOR Of clINIcAl SERVIcES — ExcEllUS BlUE cROSS BlUE SHIElD
Chris Ciano, R.Ph. DIREcTOR Of clINIcAl PROGRAMS — fORMERly WITH MEDMETRIcS HEAlTH PARTNERS
Samir Mistry, Pharm.D. clINIcAl cONSUlTANT — fORMERly WITH BlUE cROSS BlUE SHIElD Of KANSAS cITy
Steve Marciniak, R.Ph. DIREcTOR, PHARMAcy PROGRAMS — PRIORITy HEAlTH
Kristy Pezzino, Pharm.D. clINIcAl PHARMAcIST — HEAlTH AllIANcE MEDIcAl PlAN
Gary Tereso, Pharm.D., BCPS DIREcTOR Of PHARMAcy — HEAlTH NEW ENGlAND
figures may be reprinted with the following citation: Magellan Pharmacy Solutions' Medical Pharmacy & Oncology Trend Report™, ©2012. used with permission.
Published by:Magellan Pharmacy Solutions6870 Shadowridge dr., Suite 111Orlando, fl 32812Tel: 866-66i-corefax: [email protected]
Publishing StaffPUBlISHER
Kjel A. Johnson, Pharm.d.
MEDIA DIREcTOR
Erika I. Ruiz-Colon
MEDIA MANAGER
Kayla Killian
©2012 Magellan Pharmacy Solutions. Magellan Pharmacy Solutions' 2012 Medical Pharmacy & Oncology Trend ReportTM is published in conjunction with Krames StayWell. All rights reserved. All trademarks are the property of their respective owners. Printed in the U.S.A.
The content — including text, graphics, images and information obtained from third parties, licensors and other material (“content”) — is for informational purposes only. The content is not intended to be a substitute for professional medical advice, diagnosis or treatment.

TrEND rEPOrT 2012
2012 Survey Methodology and Demographics
survey was deployed to the sample audience via a secure browser-based software program hosted by Magellan Health Services, Magellan Pharmacy Solutions' parent company.
The data collection took place over a three-week period dur-ing June and July 2012. following data collection, the results were validated, aggregated and analyzed for reporting herein.
for purposes of this report, survey results are primarily reported on a "percentage of lives" basis. Weighting indi-vidual responses in this manner provides an indication of the potential marketplace impact of payor policies on the number of covered member lives, in addition to the percent-age of payors incorporating any one policy. Survey results are also reported, at times, with the health plans stratified into large- and small-sized plans, defined as 500,000 or more lives and fewer than 500,000 lives, respectively.
In certain cases, base sizes are small and care should be used when interpreting the data. Rarely, some percentages may add to slightly more or less than 100 percent due to rounding effects.
A total of 50 individual survey responses were received. As noted in the table below, these 50 health plans manage 157.2 million lives, a slight increase over the 153.2 million covered lives reported in 2011.
Sixty-four percent of the health plan organizations that responded in 2012 also provided responses to the 2011 sur-vey. When evaluating year-to-year trends, the entire sample of 2012 respondents is compared with the respondents in
The methodology for this third edition of Magellan Pharmacy Solutions' Medical Pharmacy & Oncology Trend Report™ was developed with guidance from our payor advisory board.
This report employs a combination of primary and secondary research methodologies to deliver a compre-hensive view of payor perceptions and health plan actions related to medical injectables, including those used for chemotherapy and cancer supportive care, rheumatology and immunotherapy. • The first section of the report was derived from a custom market research survey conducted among commercial health plan medical directors and pharmacy directors. The Web survey was designed to gather feedback about how managed care organizations operate around six key management drivers for medical injectable drugs identified by Magellan Pharmacy Solutions and our payor advisory board.
• The second section of the report was derived from secondary analyses of health plan medical paid claims data. An exciting enhancement to this year’s report is that the claims data are from various sites of service, regardless of where the drug was infused or administered. In addition, this year’s report evaluates multiple lines of business (lOB) (i.e., commercial, Medicare, managed Medicaid) to provide a more comprehensive view of key oncology and medical injectable trends among health plans.
hEALTh PLAN SurvEy METhODOLOGyAs in our previous edition, the target list of payors consisted of the top 160 U.S. commercial health plans based on number of lives covered. The sample was stratified based on covered lives, national versus regional plans, geographic dispersion and medical versus pharmacy executives.
Research topics were developed in conjunction with our payor advisory board and aligned with the six key medical injectable drug management drivers. The survey questions were defined, and some questions were revised to provide greater specificity over the 2011 survey version. The poten-tial effect of the changes has been noted where appropri-ate in the results. The questions were pretested, and the
4 METhODOLOGy
SurvEy rESPONDENT COMPOSITIONCOuNT LIvES % OF LIvES % OF PLANS
less than 500,000 16 3,816,000 2% 32%
500,000 to 999,999 13 8,393,000 5% 26%
1,000,000 to 4,999,999 13 30,620,000 20% 26%
5,000,000 or more 8 114,400,000 73% 16%
TOTAL 50 157,229,000 100% 100%
TrEND rEPOrT 2010TrEND rEPOrT 20125METhODOLOGy
2011. The demographic composition of this year's respon-dents is not as consistent as the composition of the base in the prior two years.
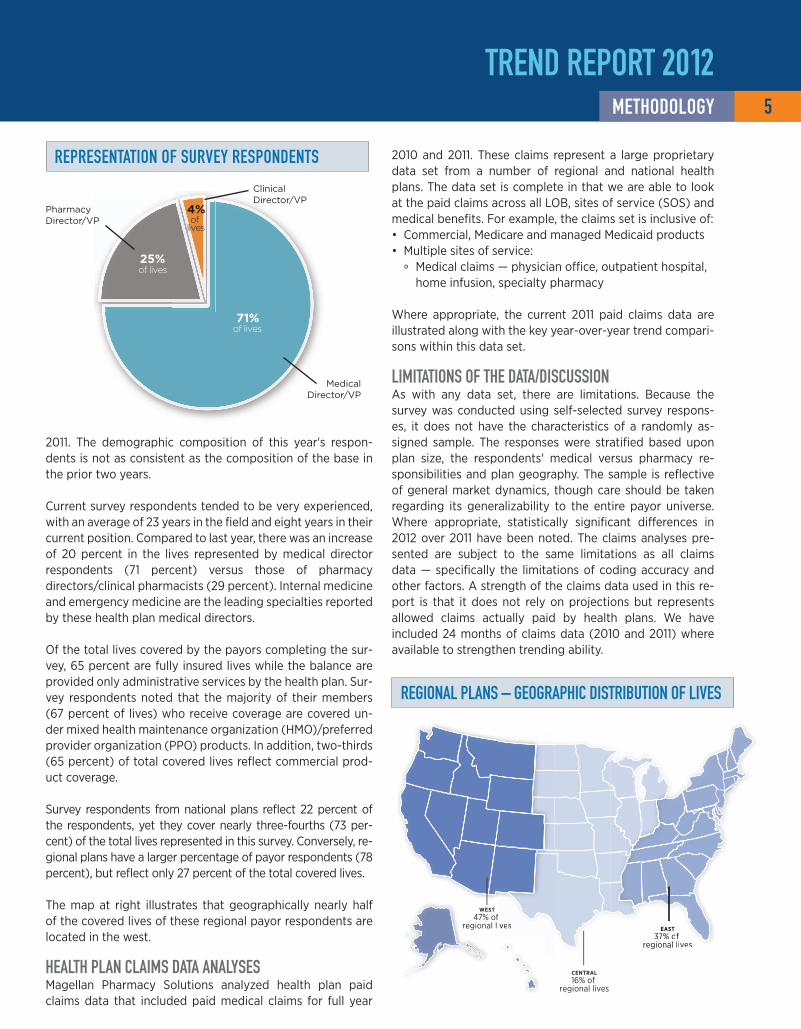
current survey respondents tended to be very experienced, with an average of 23 years in the field and eight years in their current position. compared to last year, there was an increase of 20 percent in the lives represented by medical director respondents (71 percent) versus those of pharmacy directors/clinical pharmacists (29 percent). Internal medicine and emergency medicine are the leading specialties reported by these health plan medical directors.
Of the total lives covered by the payors completing the sur-vey, 65 percent are fully insured lives while the balance are provided only administrative services by the health plan. Sur-vey respondents noted that the majority of their members (67 percent of lives) who receive coverage are covered un-der mixed health maintenance organization (HMO)/preferred provider organization (PPO) products. In addition, two-thirds (65 percent) of total covered lives reflect commercial prod-uct coverage.
Survey respondents from national plans reflect 22 percent of the respondents, yet they cover nearly three-fourths (73 per-cent) of the total lives represented in this survey. conversely, re-gional plans have a larger percentage of payor respondents (78 percent), but reflect only 27 percent of the total covered lives.
The map at right illustrates that geographically nearly half of the covered lives of these regional payor respondents are located in the west.
hEALTh PLAN CLAIMS DATA ANALySESMagellan Pharmacy Solutions analyzed health plan paid claims data that included paid medical claims for full year
2010 and 2011. These claims represent a large proprietary data set from a number of regional and national health plans. The data set is complete in that we are able to look at the paid claims across all lOB, sites of service (SOS) and medical benefits. for example, the claims set is inclusive of: • commercial, Medicare and managed Medicaid products • Multiple sites of service:
° Medical claims — physician office, outpatient hospital, home infusion, specialty pharmacy
Where appropriate, the current 2011 paid claims data are illustrated along with the key year-over-year trend compari-sons within this data set.
LIMITATIONS OF ThE DATA/DISCuSSIONAs with any data set, there are limitations. Because the survey was conducted using self-selected survey respons-es, it does not have the characteristics of a randomly as-signed sample. The responses were stratified based upon plan size, the respondents' medical versus pharmacy re-sponsibilities and plan geography. The sample is reflective of general market dynamics, though care should be taken regarding its generalizability to the entire payor universe. Where appropriate, statistically significant differences in 2012 over 2011 have been noted. The claims analyses pre-sented are subject to the same limitations as all claims data — specifically the limitations of coding accuracy and other factors. A strength of the claims data used in this re-port is that it does not rely on projections but represents allowed claims actually paid by health plans. We have included 24 months of claims data (2010 and 2011) where available to strengthen trending ability.
25%
71%
4%of
lives
of lives
of lives
rEPrESENTATION OF SurvEy rESPONDENTS
clinical director/vP
Pharmacy director/vP
Medical director/vP
CENTRAL16% of
regional lives
EAST37% of
regional lives
WEST47% of
regional lives
ives
ves EAST37% of
regional li
rEGIONAL PLANS – GEOGrAPhIC DISTrIbuTION OF LIvES

report Summary and Conclusions
6 ExECuTIvE SuMMAry
TrEND rEPOrT 2012
Magellan Pharmacy Solutions’ 2012 Medical Pharmacy & Oncology Trend Report™ evaluated injectable quality and cost management tools and trends of medical benefit injectables, defined as injectable drugs that are adminis-tered by providers at various sites of service and are paid under the medi-cal benefit. The results of this study are a combination of findings from senior leaders at commercial payors as well as paid claims across key lines of business and sites of service.
Key findings of this report include: • A significant increase in trend was found when compared to the previous trend. This was due to several factors, most notably the lack of any top 25 drug losing patent protection. Increases in price and utilization are also drivers of this increased trend. The year-over-year cost increase per 1 million lives was 16 percent for the top 25 therapies.
• A significant increase in formulary management for metastatic breast cancer was measured; this is likely due to the change in U.S. food and Drug Administration (fDA) labeling of Avastin and the approvals of some of the newer high-cost agents like Perjeta and Halavan. The significant increase in formulary management for prostate cancer drugs is a result of the approval of drugs such as Jevtana and Provenge, whose treatment cost is in excess of $90,000.
• fewer plans are receiving rebates for medical benefit drugs today than in the past. This is thought to be a result of the restructuring of key rebate opportunities for biological response modifiers paid under this benefit.
• Nearly a doubling of lives under a variable fee schedule reimbursement scheme was seen compared to the previous year; such a strategy employs reference pricing rather than fixed increases or discounts to average sales price (ASP) or average wholesale price (AWP). for plans using ASP-based reimbursement, an increase from ASP + 11 to ASP + 18 percent was seen. We suspect this is in an effort to curb referrals of patients to higher-cost facility administration sites, and this is supported by the large number of changes to provider reimbursement that occurred during the measurement period.
• for newly approved drugs that have not yet been assigned a J code, about half of lives subject the drug to ASP pricing, which is wholesale acquisition price (WAc)-based; a quarter hold.
• coinsurances increased from 20 to 26 percent and average copays increased from $46 to $75, demonstrating the plans’ interests in increasing member cost contributions.
• Palliative care programs are increasing and are expected to continue to do so.
• A third of payors reported that network provider practices were being purchased by health systems in their service areas.
• Utilization management for medical injectables increased year over year from about 70 percent of covered lives to nearly all covered lives as payors attempt to better manage the quality and cost of oncology and rheumatology care. Most commonly, this was accomplished by requiring
authorizations for use and by using criteria based upon fDAlabel, compendia listing and appropriate use of concomitant medications. criteria were generally developed internally and defended with external reviews.
• About half of payors use fDAlabel to edit medical injectable claims, and nearly 40 percent use no edits whatsoever.
• changes in the administration site of service were identified as a key threat, but this problem was largely unaddressed by payors last year.
• The top five diagnoses were responsible for a quarter of the total spend; orthopedic diagnoses were over half the top 10 diagnosis codes.
• As in the past, just over half of all medical benefit drug costs were related to the treatment of cancer.
• An eightfold increase in the use of unclassified (“dump”) billing codes was found last year, which is likely the result of many new drug approvals.
We believe you will find this report useful and unique, as it is the only detailed drug trend report available for those medicines administered by providers and billed under the medi-cal benefit. you may access the data and additional copies of this report at www.icorehealthcare.com/trends.

PAyOr SurvEy DATA

0%
10%
20%
30%
40%
50%
60%500,000 Lives and UpUnder 500,000 Lives
20122011
44% 44%
52%
43%
% o
f R
esp
on
de
nts
Have formulary in place
In this year’s study of commercial payors, health plans cov-ering about two-thirds of lives (63 percent) operate with established medical benefit injectable drug formulary for at least some therapeutic classes, which is not statistically dif-ferent from the 75 and 65 percent of covered lives reported by payors in 2010 and 2011, respectively. Among payors reporting formularies (n = 19, 65 million lives), the provider network generally complied with the plans' formulary, which is consistent with 2010 and 2011. The likelihood of having a formulary was the same for small and large pay-ors. See Figure 1, Medical Benefit Injectable Formularies in Place Overall, and Figure 2, Medical Benefit Injectable For-mularies in Place by Size of Health Plan.
Of the 95 million members most likely to be subjected to medical formulary requirements, most were for all prod-ucts listed. further, we found that formulary management increased when compared to 2011 for nearly all categories of products listed. We asked which biologic response mod-ifiers (BRMs) are subjected to a medical formulary. A wide array of BRMs were included, specifically Enbrel, Humira, Orencia, Procrit, Remicade and Rituxan, which was con-sistent with 2011. See Figure 3, Therapeutic Classes with a Medical Formulary Currently in Place.
Medical benefit Drug Formulary
FIG. 1 | FOrMuLArIES IN PLACE OvErALL
FIG. 2 | FOrMuLArIES IN PLACE by PLAN SIzE
PAyOr SurvEy DATA 8 MEDICAL bENEFIT DruG FOrMuLAry
*n = 19 payors, 65 million lives
0%
25%
50%
75%
100%NoYes*
Generally, the providers use the products on the formulary
Formulary for injectable/infusible drugs
6%
55%
37%
63%% o
f To
tal
Liv
es

9
Medical Pharmacy & Oncology Trend Report™
0% 25% 50% 75% 100%
2011 2012
Chemotherapy
Biologic Response Modifiers (e.g., Orencia, Remicade, etc.)
Hemophilia
Colony-Stimulating Agents (G-CSFs)
Chemotherapy-Induced Nausea and Vomiting (CINV)
Intravenous Immune Globulin (IVIG)
Erythropoiesis-Stimulating Agents (ESAs)99%99%
89%97%
77%97%
57%97%
76%96%
74%93%
64%100%
% of Total Lives
To better understand the extent to which formular-ies impact individual chemotherapeutics, we identi-fied seven cancers whose treatments were commonly listed by payors as being under formulary manage-ment. The increase in the portion of lives under for-mulary for metastatic breast cancer is likely due to the fDA change in Avastin label, while the increase in the prostate cancer is likely due to the approval of Provenge, a costly therapy. See Figure 4, Common Cancer Types Where Payors Have at Least Some Medi-cal Drug Formulary in Place.
CANCEr TyPE 2010 % OF LIvES
2011 % OF LIvES
2012 % OF LIvES
% ChANGE FrOM 2011
Non-small cell lung cancer 100% 100% 44% -56%Metastatic breast cancer 63% 49% 98% 100%Prostate cancer 63% 49% 97% 98%Non-Hodgkin's lymphoma 63% 46% 44% -4%Multiple myeloma 63% 46% 48% 4%Renal-cell carcinoma 63% 46% 44% -4%leukemia 63% 46% 45% -2%
FIG. 4 | COMMON CANCEr TyPES uNDEr FOrMuLAry
FIG. 3 | ThErAPEuTIC CLASSES wITh A MEDICAL FOrMuLAry CurrENTLy IN PLACE
n = 12 payors, 94 million lives (2010) n = 12 payors, 57 million lives (2011)
n = 13 payors, 58 million lives (2012)
n = 28 payors, 100 million lives (2011) n = 21 payors, 95 million lives (2012)
PAyOr SurvEy DATAMEDICAL bENEFIT DruG FOrMuLAry

carrying forward the methodology used in Magellan Phar-macy Solutions' 2011 Medical Pharmacy & Oncology Trend Report™, the trend appears to demonstrate that payors are becoming more sophisticated in and likely to establish pref-erential pricing for drugs paid under the medical benefit. In addition, plans appear to be more capable of moving market shares to preferred medical benefit injectable products. In some cases, the preferred medical benefit injectable prod-uct has a manufacturer’s rebate available to the health plan.
In 2012, plans covering 51 percent of the lives note receiv-ing rebates on medical injectable products. This is similar to 2010 (56 percent) but down from 2011 (76 percent). This year, proportionally more smaller payors (fewer than 500,000 lives) have established a rebate contract for at least one medical injectable product, which is an increase from 2011 (57 percent versus 48 percent). See Figure 5, Rebates Received from Drug Manufacturers That Are Mainly Paid on the Medical Benefit Overall, and Figure 6, Rebates Received from Drug Manufacturers That Are Mainly Paid on the Medical Benefit by Size of Health Plan.
49%51%of lives
of lives
no, we do not receive rebates
yes, we receive rebates
PAyOr SurvEy DATA
FIG. 5 | rEbATES rECEIvED OvErALL
10 MEDICAL bENEFIT DruG FOrMuLAry
n = 29 payors, 82 million lives (2010) n = 31 payors, 116 million lives (2011) n = 27 payors, 78 million lives (2012)
0%
20%
40%
60%
80%500,000 Lives and UpUnder 500,000 Lives
201220112010
35%
59%
48%
77%
57%
51%
52%
43%
% o
f R
esp
on
de
nts
Yes, we receive rebates
FIG. 6 | rEbATES rECEIvED by PLAN SIzE

11
Medical Pharmacy & Oncology Trend Report™
32% 56%of lives
9%of lives
3%of lives
of lives
Manufacturers' price increases
drug utilization increases
no responseTesting increases
PAyOr SurvEy DATA
FIG. 8 | KEy DrIvEr OF ONCOLOGy COSTS
FIG. 7 | ThErAPEuTIC CLASSES wITh rEbATES
MEDICAL bENEFIT DruG FOrMuLAry
n = 29 payors, 37 million lives (2011) n = 27 payors, 78 million lives (2012)
Nearly all payors (85 percent) who reported receiv-ing rebates for medical benefit injectables report receiving them for BRM products. A wide array of BRMs were included, specifically Actemra, cimzia, Humira, Orencia, Procrit and Remicade. See Fig-ure 7, Therapeutic Classes Where Payors Receive Injectable/Infusible Product Rebates.
This year we asked what payors think is the key driver of oncology costs. Plans covering 56 percent of lives reported manufacturers' price increases, followed by drug utilization increases, reported by plans covering 32 percent of lives. See Figure 8, Key Driver of Oncology Costs.
0% 20% 40% 60% 80% 100%
Proprietary
Biologics (e.g., Orencia, Remicade, etc.)
Erythropoiesis-Stimulating Agents (ESAs)
Chemotherapy-Induced Nausea and Vomiting (CINV)
Colony-Stimulating Agents (G-CSFs)
Intravenous Immune Globulin (IVIG)
Hemophilia
Chemotherapy
Other N/A
N/A
% of Total Lives
2011 2012
14%
14%
29%
22%
36%
37%
25%
29%
54%
99%
45%
58%
39%
9%23%

PAyOr SurvEy DATA 12 PrOvIDEr rEIMburSEMENT
FIG. 10 | rEIMburSEMENT APPrOACh by PLAN SIzE
Typically, providers purchase oncolytics and other infusible/injectable agents from a distributor, administer the drug to patients in their offices and then bill the patient’s insur-ance carrier for reimbursement of the drug and associated administration costs under the patient’s medical benefit. This method of distribution is commonly referred to as "phy-sician buy and bill." About six of every 10 covered lives in the survey are covered by plans that reimburse providers for medical benefit injectables based upon a percentage higher than the average sales price (ASP) plus methodology. This is fairly consistent with 2010 and 2011 findings, support-ing the hypothesis that many of the payors migrating to this method of reimbursement have done so following the Medicare Modernization Act (MMA) of 2005. See Figure 9, Reimbursement Approach and the Extent of Discounts Used by Payors to Reimburse for Drugs Paid Under the Medical Benefit.
There was a decrease this year for the average wholesale price (AWP) minus–based reimbursement methodology to about one in five covered lives. That decrease was offset by an increase in the variable fee schedule (VfS)-based meth-odology for reimbursement to about one in four covered lives. This appears to be partly due to experimental error resulting from a different sample of responders. The number of lives for which providers are reimbursed under an AWP plus has trended to zero. It is possible that payors using tight ASP-based reimbursement are realizing several unintended consequences of such an approach: namely, the selection of higher-cost products (“more cost, more plus”) and referrals to hospital outpatient for drug administration. New this year was the emergence of the risk reimbursement methodology to 3 percent of covered lives, up from 0 percent the past two years for large plans (more than 500,000 lives). See Figure 10, Reimbursement Approach and the Extent of Discounts Used by Payors to Reimburse for Drugs Paid Under the Medi-cal Benefit by Size of Health Plan.
Provider reimbursement
FIG. 9 | rEIMburSEMENT APPrOACh OvErALL
0%
10%
20%
30%
40%
50%
60%
70%
RiskAWP PlusVFSAWP MinusASP Plus
57% 55%
26%
17% 15%
25%
1% 0% 0% 3%
% o
f To
tal
Liv
es
2011 2012
0%
10%
20%
30%
40%
50%
60%
70%
RiskAWP PlusVFSAWP MinusASP Plus
% o
f R
esp
on
de
nts
500,000 Lives and UpUnder 500,000 Lives
69%
19%
12% 13%
0% 0%0% 3%
58%
26%

13
PAyOr SurvEy DATAPrOvIDEr rEIMburSEMENT
The weighted mean percentage higher than ASP reported this year was 18 percent, up from 11 percent last year. At the time the MMA reimbursement changes occurred for Medi-care patients, the community Oncology Alliance (cOA), a nonprofit organization dedicated to community oncology practice, stated that ASP plus 12 percent would be the mini-mum reimbursement to cover provider-administered drugs and administration cost.1 Today, the average ASP-based reimbursement appears to be well above that threshold. AWP-minus reimbursement, on average, is with a 47 percent discounting of AWP, substantially lower than the previous year. It is difficult to imagine such discounts off AWP since (based largely upon drug mix) a 40 percent discount off AWP is approximately ASP plus zero. See Figure 11, Range of Reimbursement Methodology Percentage in Place for Inject-ables Paid Under the Medical Benefit.
The survey required payors to divide 100 points across each of the sources they use to set reimbursement strategies. On a weighted average basis, commercial payors are rely-ing more on their own internal resources than on vendors, which is consistent with last year’s report. Specifically, their provider contracting departments, medical and pharmacy directors, and finance teams are influential, combined with assistance from the centers for Medicare & Medicaid Ser-vices (cMS). Other sources of influence in the development of payor reimbursement strategies include vendors, such as a health plan’s reimbursement consultant, specialty phar-macy, pharmacy benefit manager (PBM) and other com-panies. See Figure 12, How Payors Develop Their Medical Benefit Drug Reimbursement Strategies.
1 Okon T., coplon S. and Kube D. “Problems facing cancer care with Medicare’s Definition of Average Selling Price.” Community Oncol. 2004;1(1):59-63. www.oncologypractice.com/co/journal/articles/0101059a.pdf. Accessed September 4, 2012.
FIG. 11 | rEIMburSEMENT PErCENTAGE IN PLACE
FIG. 12 | DEvELOPMENT OF rEIMburSEMENT STrATEGIES
n = 54 payors, 130 million lives (2011) n = 45 payors, 137 million lives (2012)
n = 47 payors, 142 million lives (2012)
Medical Pharmacy & Oncology Trend Report™
0%
20%
40%
60%
80%
100%
OtherVendorInternal/CMS
90%87%
10% 12%0% 1%
We
igh
ted
Me
an
2011 2012
Re
imb
urs
em
en
t P
erc
en
tag
e
ASP Plus AWP Minus
AWP Plus
Low HighWeighted Mean
-80%
-60%
-40%
-20%
0%
20%
40%
60%
80%
100%
2012201120122011
100%
6%0% 0% 0%11%
25%18%
-22%
-75%
-19%
-47%
PAyOr SurvEy DATA
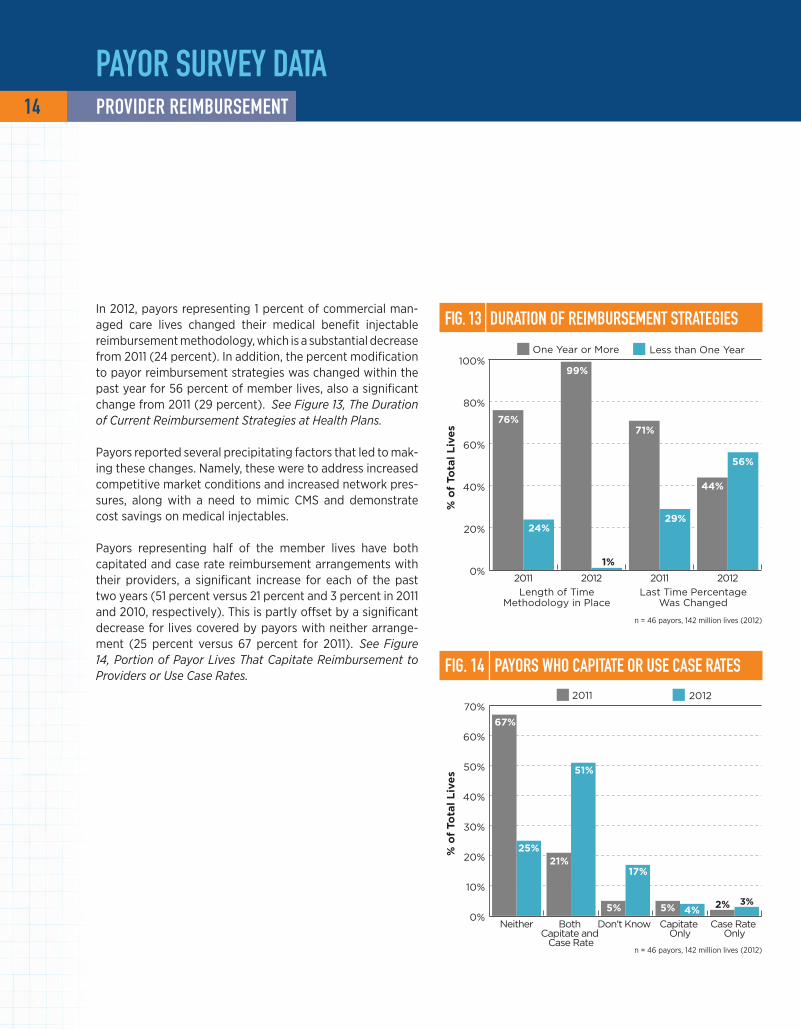
In 2012, payors representing 1 percent of commercial man-aged care lives changed their medical benefit injectable reimbursement methodology, which is a substantial decrease from 2011 (24 percent). In addition, the percent modification to payor reimbursement strategies was changed within the past year for 56 percent of member lives, also a significant change from 2011 (29 percent). See Figure 13, The Duration of Current Reimbursement Strategies at Health Plans.
Payors reported several precipitating factors that led to mak-ing these changes. Namely, these were to address increased competitive market conditions and increased network pres-sures, along with a need to mimic cMS and demonstrate cost savings on medical injectables.
Payors representing half of the member lives have both capitated and case rate reimbursement arrangements with their providers, a significant increase for each of the past two years (51 percent versus 21 percent and 3 percent in 2011 and 2010, respectively). This is partly offset by a significant decrease for lives covered by payors with neither arrange-ment (25 percent versus 67 percent for 2011). See Figure 14, Portion of Payor Lives That Capitate Reimbursement to Providers or Use Case Rates.
FIG. 13 | DurATION OF rEIMburSEMENT STrATEGIES
FIG. 14 | PAyOrS whO CAPITATE Or uSE CASE rATES
14 PrOvIDEr rEIMburSEMENT
n = 46 payors, 142 million lives (2012)
n = 46 payors, 142 million lives (2012)
0%
20%
40%
60%
80%
100%
2012201120122011
76%
24%
99%
71%
29%
1%
44%
56%%
of
Tota
l L
ive
s
Length of TimeMethodology in Place
Last Time PercentageWas Changed
One Year or More Less than One Year
0%
10%
20%
30%
40%
50%
60%
70%
Case Rate Only
Capitate Only
Don't Know Both Capitate and
Case Rate
Neither
67%
25%21%
51%
5% 5%
17%
4%2% 3%
% o
f To
tal
Liv
es
2011 2012

15
Medical Pharmacy & Oncology Trend Report™
FIG. 15 | PAyOrS whO INITIATED PILOT PrOGrAMS
n = 46 payors, 142 million lives (2012)
n = 46 payors, 142 million lives (2012)
further, payors who represent more than half of covered lives in 2012 have begun to explore pilot programs that look at bundled payments for services with large, in-network oncology groups, an increase over last year of one-third of covered lives. See Figure 15, Payors Who Initiated Pilot Programs.
This year we asked what reimbursement strategies payors use for newly released injectable drugs (no J code assigned). Nearly half of covered lives are in plans with an ASP plus/minus percent strategy, and an additional one-quarter each for AWP plus/minus percent and WAc plus/minus percent strategies. See Figure 16, Reimbursement Method for Newly Approved Medical Benefit Injectables.
0%
25%
50%
75%
100%
20122011
64%
36%
47%
53%
% o
f To
tal
Liv
es
No, we have not initiated programs
Yes, we initiated pilot programs to look at bundled payments for services within large, in-network oncology groups
PAyOr SurvEy DATAPrOvIDEr rEIMburSEMENT
26%
45%of lives
6%of lives
23%of lives
of lives
ASP +/-%
AWP +/-%
Other
WAc +/-%
FIG. 16 | rEIM. FOr NEwLy APPrOvED INjECTAbLES

PAyOr SurvEy DATA 16 bENEFIT DESIGN
compared with the past two years, there was a significant decrease in the proportion of plans (both small and large) that required neither a drug copay amount nor drug coin-surance for medical injectables, although smaller plans were far less likely to require member contribution. Of those that do require member contribution, it looks to be for either a drug coinsurance only (35 percent) or a drug copay only (22 percent), with fewer payors requiring both a copay and a coinsurance (17 percent). See Figure 17, Pre-dominant Member Contribution for Injectables Paid Under the Medical Benefit Overall, and Figure 18, Predominant Member Contribution for Injectables Paid Under the Medi-cal Benefit by Size of Health Plan.
benefit DesignFIG. 17 | CONTrIbuTION rEquIrEMENTS OvErALL
FIG. 18 | CONTrIbuTION rEquIrEMENTS by PLAN SIzE
0%
10%
20%
30%
40%
50%
RequireBoth
Copay$ Only
Coinsurance% Only
RequireNeither
43%41%
26% 27%
21% 20% 20%18%
22%
10%
17%
35%
% o
f R
esp
on
de
nts
2010 20122011
0%
10%
20%
30%
40%
50%
RequireBoth
Copay$ Only
Coinsurance % Only
RequireNeither
% o
f R
esp
on
de
nts
500,000 Lives and UpUnder 500,000 Lives
50%
40%
12.5% 12.5%13%
25%27%
20%
n = 46 payors, 142 million lives (2012)
n = 46 payors, 142 million lives (2012)

17
PAyOr SurvEy DATAbENEFIT DESIGN
Members subject to coinsurances for medical benefit inject-able drugs are being asked to slightly increase their share of contribution this year, with the average being 26 per-cent of the claim cost in 2012 versus 20 percent in 2011 and 17 percent in 2010. The larger payors have a wider range at the upper end than the smaller plans. Most payors (75 percent) noted they would maintain the same coinsur-ance levels through the remainder of 2012. See Figure 19, Reported Coinsurance Amounts for Medical Benefit Injectables.
There appears to be an increase in copays for medical ben-efit injectable drugs. An average copay of $75 was reported in 2012, up from $46 in 2011, but this may be due in part to a high copay for a single large plan. Regarding copays for medical injectables, most payors (83 percent) stated they will maintain the current level of copay for the remainder of 2012. See Figure 20, Reported Copay Amounts for Medical Benefit Injectables.
Many medical injectable benefit claims are in excess of $3,000 per dose. This is concerning because when the mem-ber contribution exceeds $2,500 per year, out-of-pocket member medication compliance is impacted. A new design seems to be emerging in which coinsurances are applied to a maximum capped amount, generally between $2,500 and $3,000 annually.
Medical Pharmacy & Oncology Trend Report™
FIG. 19 | rEPOrTED COINSurANCE AMOuNTS
n = 25 payors, 91 million lives (2010)n = 22 payors, 76 million lives (2011)n = 24 payors, 97 million lives (2012)
n = 23 payors, 64 million lives (2010)n = 18 payors, 77 million lives (2011)
n = 18 payors, 105 million lives (2012)
FIG. 20 | rEPOrTED COPAy AMOuNTS
26%
21%
26%
20% 20%
20%
17%18% 17%
Co
insu
ran
ce P
erc
en
tag
e
0%
5%
10%
15%
20%
25%
30%
500,000 Lives and Up
Under 500,000 Lives
All Lives
2010 2011 2012
$75 $75$77
$46 $45$44 $46
$26
$43
Co
pay A
mo
un
t
$0
$20
$40
$60
$80
500,000 Lives and Up
Under 500,000 Lives
All Lives
2010 2011 2012

PAyOr SurvEy DATA 18 bENEFIT DESIGN
FIG. 21 | MEMbEr COST rEquIrEMENTS OvErALL
FIG. 22 | MEMbEr COST rEquIrEMENTS by PLAN SIzE
0%
25%
50%
75%
100%
20122011
29%
31%
40%
23%
18%
59%% o
f To
tal
Liv
es
Yes, my plan has different member cost-share requirements by state
Do not operate in more than one state
No, my plan does not have different member cost-share requirements by state
looking across service areas, fewer than one in four cov-ered lives is subject to different member cost-share require-ments based on the state in which they are treated. This was seen only with plans larger than a half million lives because smaller payors either don’t operate in more than one state or do not have different requirements across their service areas. See Figure 21, Variable Member Cost Share Require-ments Across Different Plan Service Areas Overall, and Fig-ure 22, Variable Member Cost Share Requirements Across Different Plan Service Areas by Size of Plan.
0%
10%
20%
30%
40%
50%
60%
Do not operate in more than
one state
Yes, my plan has different member cost-
share requirements by state
No, my plan does not have different
member cost-share requirements by state
% o
f R
esp
on
de
nts
500,000 Lives and UpUnder 500,000 Lives
44%
7%
53%
0%
56%
40%
n = 46 payors, 142 million lives (2012)
n = 46 payors, 142 million lives (2012)

19
Medical Pharmacy & Oncology Trend Report™
0%
10%
20%
30%
40%
50%
60%
32%
56%
24%
49%
% o
f R
esp
on
de
nts
500,000 Lives and Up
Under 500,000 Lives
2012 2013
FIG. 24 | COINSurANCE AMOuNTS PrOjECTED FOr 2013
n = 34 payors, 104 million lives
0%
5%
10%
15%
20%
25%
30%
35%
40%
500,000 Livesand Up
Under 500,000Lives
All Lives
20%
5% 5%
20%
10%
18%
33%33% 33%
Co
insu
ran
ce P
erc
en
tag
e
Low Weighted Mean High
n = 46 payors, 142 million lives (2012)
PAyOr SurvEy DATA
The survey asked payors to think ahead through the remainder of 2012 and into 2013 and to consider the likelihood of change to coinsurance responsibility for their membership. larger payors continue to be more likely to have members with a medical benefit inject-able coinsurance compared with smaller payors. Both small and large payors reported the percentage of their membership with coinsurance responsibility in 2012 was consistent with projections reported from the 2011 survey, suggesting projections of changes to benefits are robust. looking forward, regardless of size, payors overall intend to increase the percentage of members with a coinsurance. See Figure 23, Per-centage of Member Lives Subject to a Coinsurance for Medical Injectables by Size of Plan.
further, among payors reporting coinsurances for 2013, the projected percentage assigned to medical benefit injectables is 20 percent. In 2012, the reported coin-surance amount was 22 percent, and 20 percent for 2011. See Figure 24, Reported Coinsurance Amounts Projected for Medical Benefit Injectables in 2013.
At times, payors employ coinsurances to put more “skin in the game” for their members for drugs cov-ered under the medical benefit. However, the tactic loses some punch once maximum out-of-pocket annual contributions are reached. A weighted aver-age of 74 percent of covered lives has an annual cap on members’ coinsurance out of pocket, with the weighted mean at $3,003 per year. This is an increase from 2011 of 53 percent of the lives, with a cap on coinsurance out of pocket and an average of $2,076 per year.
bENEFIT DESIGN
FIG. 23 | MEMbErS SubjECT TO A COINSurANCE by PLAN SIzE

0%
10%
20%
30%
40%
50%
42%
48%
28%22%
% o
f M
em
be
rs
500,000 Lives and Up
Under 500,000 Lives
2012 2013
PAyOr SurvEy DATA
Payors with more than 500,000 members report that the portion of their membership that has a medical benefit injectable copay will remain about the same in 2013. Payors with fewer than 500,000 members report that a smaller portion of their membership will have a copay in 2013. Of note, the large payors reported a lower percentage of members subject to a copay in 2012 (42 percent) as compared with their 2012 projec-tions in last year's survey (50 percent). They project 48 percent of their members will be subjected to a medical benefit injectable copay in 2013. Small payors reported a much higher percentage of members sub-ject to a copay in 2012 (28 percent) as compared with their 2012 projections (17 percent) in last year’s survey. They project 22 percent will be subjected to copays in 2013. See Figure 25, Percentage of Members Subject to a Copay for Medical Injectables by Size of Plan.
Among payors anticipating copays for 2013, the aver-age amounts range from $20 to $150, with $60 being the weighted mean. Of note, members within smaller health plans have a higher copay on average. See Fig-ure 26, Reported Copay Amounts for Medical Benefit Injectables in 2013.
FIG. 25 | MEMbErS SubjECT TO A COPAy by PLAN SIzE
FIG. 26 | COPAy AMOuNTS PrOjECTED FOr 2013
20 bENEFIT DESIGN
n = 22 payors, 82 million lives
n = 46 payors, 142 million lives (2012)
$0
$25
$50
$75
$100
$125
$150
$175
$200
500,000Lives and Up
Under 500,000Lives
All Lives
$150 $150
$100
$60 $60
$97
$30
$20 $20
Co
pay
Am
ou
nt
Low Weighted Mean High

21
Medical Pharmacy & Oncology Trend Report™
PAyOr SurvEy DATAbENEFIT DESIGN
OrAL vErSuS INTrAvENOuSAbout half the covered lives in the survey are subject to contribution parity, which is similar to the level reported last year (54 percent). Parity is noted primarily in relation to oral versus Part B/Part D intravenously administered. This is likely a result of states that have enacted or have pending legislation looking to equalize member contribu-tions for oral and IV products. States and employers alike are looking to equalize the member contribution regardless of whether the drug is paid under the medical or pharmacy benefit. See Figure 27, Member Contribution Parity Between IV and Oral Products with Similar Indications.
In 72 percent of the lives in which member contribution par-ity exists, respondents noted it is due to state law. Those payors who do not currently report contribution parity com-monly indicated that they were working toward oral versus IV contribution parity for 2013. Moreover, plans that were most interested in this parity are the same plans that are looking to establish medical homes and accountable care organizations. See Figure 28, Member Contribution Parity Mandated by State Law.
FIG. 28 | PArITy MANDATED by STATE LAw
FIG. 27 | MEMbEr CONTrIbuTION PArITy
28%
72%of lives
of lives
0%
20%
40%
60%
80%
No, we do not have membercontribution parity
Yes, we have membercontribution parity
54% 52%
46%48%
% o
f L
ive
s
2011 2012
n = 15 payors, 56 million lives
no, this is not mandated by
state law
yes, this is mandated by state law

PAyOr SurvEy DATA
Genomic testing continues to play an important role in determining patient potential for positive treatment out-comes. HER2 testing2 in advance of breast cancer therapy and KRAS testing3 in advance of colorectal cancer therapy are the norm for four of every five members across health plans. Six in 10 members are subject to an Oncotype Dx4 test, should the need arise, but only about one in three would need a cD4 count5 if receiving therapy for HIV. Other tests for which payors are contemplating coverage rules include those for the breast cancer susceptibility genes (BRcA) and epidermal growth factor receptor (EGfR). Since testing can vary significantly with these assays, fewer than half the payors reported having a relationship with a reference lab for these tests; the highest was reported at 49 percent for KRAS testing. See Figure 29, Portion of Health Plans That Have a Relationship with a Reference Laboratory to Conduct Genomic Tests.
Most members of commercial health plans (78 percent of covered lives) were enrolled in plans that featured estab-lished National committee for Quality Assurance HEDIS (Healthcare Effectiveness Data and Information Set) cancer screening or prevention programs, a slight but insignificant decrease from 2011. Breast and colorectal cancer screen-ings, along with medical assistance with smoking cessation, are part of the 2013 HEDIS measures. This is clearly driven by the large plans, as 22 percent of the payor respondents reported not having programs in place.
While breast cancer and colorectal cancer screening pro-grams (54 percent of covered lives) continue as the most commonly available to members, this year’s survey results were markedly different from previous years. Prostate can-cer detection and smoking cessation programs were offered to slightly less than half the members. We are not aware of why this observation occurred. Prevention programs were nearly always developed internally at the health plans. See Figure 30, HEDIS Cancer Screening or Prevention Programs in Place, and Figure 31, Specific HEDIS Prevention Programs Established.
FIG. 29 | rELATIONShIPS wITh LAbS ESTAbLIShED
FIG. 31 | hEDIS PrEvENTION PrOGrAMS ESTAbLIShED
FIG. 30 | SCrEENING Or PrEvENTION PrOGrAMS IN PLACE
More information on these tests may be accessed at:KRAS – www.kras-info.comHER2 – www.herceptin.com/hcp/testing/index.htmlOncotype Dx – www.oncotypedx.comcD4 count – www.cd4.org 2 KRAS (Kirsten RNA associated rat sarcoma 2 virus gene) testing is a new biomarker being used to select the best treatment for individual colorectal patients. 3 HER2 (human epidermal growth factor receptor 2) testing is an important predictive and prognostic factor in breast cancer. 4 Oncotype Dx testing is a unique diagnostic test available to both breast cancer and colon cancer patients to help with treatment decisions. 5 cD4 testing measures the number of helper T cells to analyze the prognosis of patients infected with HIV.
n = 39 payors, 119 million lives (2010)n = 37 payors, 127 million lives (2011)n = 26 payors, 85 million lives (2012)
n = 109 million lives (2012)
22 bENEFIT DESIGN
% o
f L
ive
s
NoYes
0%
20%
40%
60%
80%
100%
201220112010
62%
38%
83%
19%
78%
22%
% o
f L
ive
s
2011 2012
0%
20%
40%
60%
80%
100%
OtherCD4 Count
HER2 Testing
Oncotype DX
KRAS Testing
62% 62%
91%
61% 60%
93%
1%11%
79%
6%
% o
f L
ive
s
2010 20122011
0%
20%
40%
60%
80%
100%
SmokingPrevention(NSCLC)
PSA Testing(Prostate CA)
Colonoscopy(CRC)
Mammography(BCA)
100% 100%98%
54% 54%
82%77%
53%
65%
44%
59%
43%

23
Medical Pharmacy & Oncology Trend Report™
PAyOr SurvEy DATA
compliance with mammography and colonoscopy screen-ing programs continued to show improvement over previous survey years. The large increase in the percentage of mem-bers complying with prostate-specific antigen (PSA) testing (59 percent in 2011) was not observed in the 2012 survey (28 percent). year-over-year changes for mammography, colo-noscopy and smoking cessation were within experimental error limits. See Figure 32, Most Recent Percentage of Mem-ber Compliance by Cancer Screening Program.
The 2012 survey noted a marked increase in the percentage of covered lives provided with an option for palliative care programs (74 percent versus 55 percent in 2011). Respon-dents offering such benefits report that their programs tend to include case management, care management, hospice and other palliative care options. See Figure 33, Palliative Care Programs Provided for Membership.
FIG. 33 | PALLIATIvE CArE PrOGrAMS PrOvIDED
n = 39 payors, 119 million lives (2010)n = 37 payors, 127 million lives (2011)n = 26 payors, 85 million lives (2012)
bENEFIT DESIGN
FIG. 32 | MEMbEr COMPLIANCE by SCrEEN PrOGrAM
% o
f L
ive
s
2010 20122011
0%
10%
20%
30%
40%
50%
60%
70%
80%
PSA Testing(Prostate CA)
SmokingPrevention(NSCLC)
Colonoscopy(CRC)
Mammography(BCA)
68%72%
79%
54%
64%58%
21%17%
35%29%
59%
28%
0%
25%
50%
75%
100%
201220112010
26%
74%
55%
45%
45%
55%% o
f To
tal
Liv
es
NoYes

PAyOr SurvEy DATA
FIG. 35 | uSE OF rIDEr FOr END-OF-LIFE bENEFIT
Again this year, we saw a statistically significant increase in the number of members offered a separate benefit for these palliative care programs, whereas most were covered under the medical benefit in previous years. See Figure 34, Pallia-tive Care Program Coverage.
Although members receiving insurance from payors who have separate end-of-life benefits increased significantly this year, the results were skewed by one large payor. Again this year, few payors allow the plan sponsor to purchase a separate rider for this coverage. The most common number of days of hospice care included in this benefit was slightly less than three months, which was similar to that reported in 2010. See Figure 35, Use of Rider for End-of-Life Benefit.
24 bENEFIT DESIGN
0%
20%
40%
60%
80%
100%
20122011
72%
28%
36%
64%
% o
f C
ove
red
Liv
es
NoYes
FIG. 34 | PALLIATIvE CArE PrOGrAM COvErAGE
n = 25 payors, 65 million lives (2010)n = 30 payors, 84 million lives (2011)
n = 44 payors, 109 million lives (2012)
0%
25%
50%
75%
100%
Programs covered as a general medical benefit
Programs covered as a separate benefit
201220112010
57%
43%
80%
20%
53%
47%
% o
f L
ive
s

25
Medical Pharmacy & Oncology Trend Report™
PAyOr SurvEy DATA
Of those plans that offer end-of-life/palliative care programs for their membership, 10 percent reported they measure member participation in this benefit and know the actual portion of members who qualify and participate, although these payors account for just 4 percent of covered lives. The self-reported weighted average percentage of participation was 2 percent among membership. The vast majority of payors measure this; they just do not have a handle on the utilization of the benefit top of mind. See Figure 36, Portion of Payors Who Know the Percentage of Eligible Members Who Actually Participated in These Palliative Care Programs in the Last Year.
consistent with previous years, approximately one-third of payors reported that their employer groups were becom-ing a significant driver in the development of future drug benefit designs; we see this effect continuing through 2012. In addition, this year, payors noted their employer groups are interested in learning about cancer management, medi-cal management, curtailing growth in specialty spend, data utilization and increased cost sharing. Specific to oncology, employers are requesting payors to provide cost-control initiative programs that ensure appropriate use, access and methods to provide more benefit with less cost. See Fig-ure 37, Level of Employer Engagement with Health Plans in Developing Benefit Designs by Size of Plan.
FIG. 36 | PAyOrS MONITOrING MEMbEr PArTICIPATION
FIG. 37 | LEvEL OF EMPLOyEr ENGAGEMENT
bENEFIT DESIGN
0%
20%
40%
60%
80%
100%
Measure and know percentage
Do not measure
Measure, but don't know percentage
63%
88%
43%
23%
47%
13%2% 10%9%
% o
f L
ive
s
2010 20122011
0%
10%
20%
30%
40%
50%
60%
70%
Less engaged than last year at this time
More engaged than last year at this time
No difference
% o
f R
esp
on
de
nts
500,000 Lives and UpUnder 500,000 Lives
69%
31% 32%
68%
0% 0%
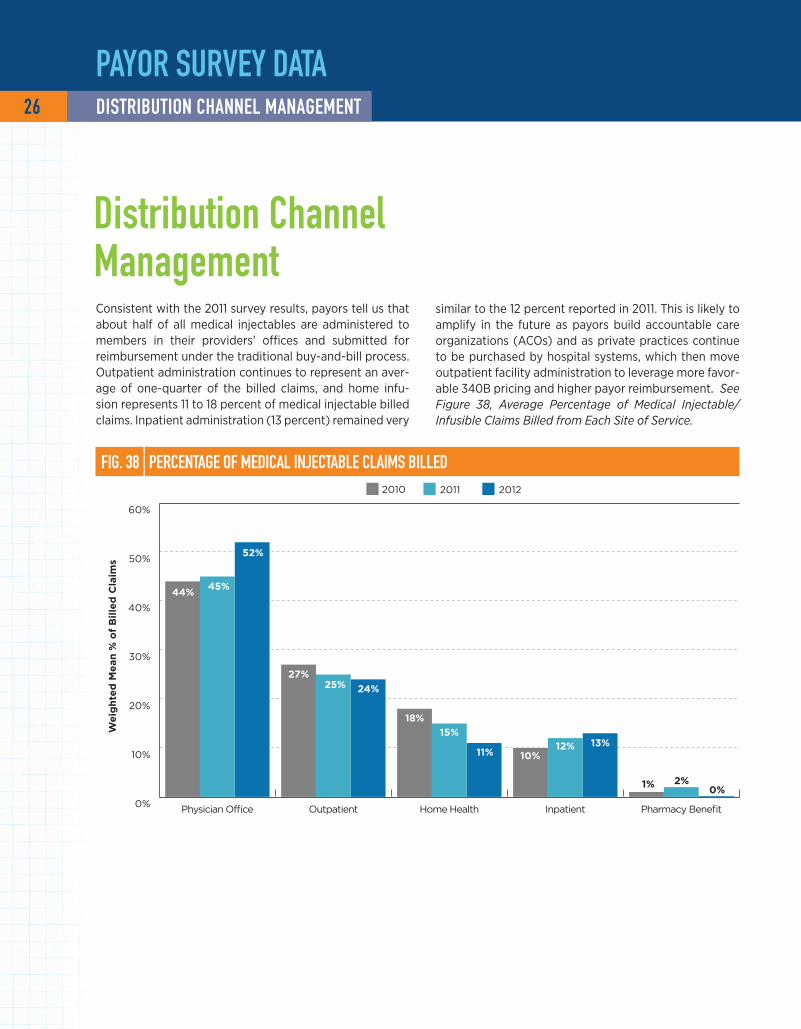
consistent with the 2011 survey results, payors tell us that about half of all medical injectables are administered to members in their providers’ offices and submitted for reimbursement under the traditional buy-and-bill process. Outpatient administration continues to represent an aver-age of one-quarter of the billed claims, and home infu-sion represents 11 to 18 percent of medical injectable billed claims. Inpatient administration (13 percent) remained very
FIG. 38 | PErCENTAGE OF MEDICAL INjECTAbLE CLAIMS bILLED
Distribution Channel Management
26 DISTrIbuTION ChANNEL MANAGEMENT
PAyOr SurvEy DATAW
eig
hte
d M
ean
% o
f B
ille
d C
laim
s
2010 20122011
0%
10%
20%
30%
40%
50%
60%
Pharmacy BenefitInpatientHome HealthOutpatientPhysician Office
44%45%
52%
27%25%
15%12%
18%
10%11%
1% 2%0%
13%
24%
similar to the 12 percent reported in 2011. This is likely to amplify in the future as payors build accountable care organizations (AcOs) and as private practices continue to be purchased by hospital systems, which then move outpatient facility administration to leverage more favor-able 340B pricing and higher payor reimbursement. See Figure 38, Average Percentage of Medical Injectable/Infusible Claims Billed from Each Site of Service.

27
Medical Pharmacy & Oncology Trend Report™
FIG. 39 | DruG vOLuME DISTrIbuTED IN PhySICIAN OFFICE
PrIMAry bILLING PrOCESSESwEIGhTED AvErAGE vOLuME 2011 wEIGhTED AvErAGE vOLuME 2012
INFuSED ChEMO DruGS INFuSED NONChEMO DruGS INFuSED ChEMO DruGS INFuSED NONChEMO DruGS
Physician buy and bill (provider uses stock and bills plan)
64% 38% 60% 36%
Specialty pharmacy provider (SPP) (a pharmacy or distributor ships to provider's office and provider does not bill for the drug)
25% 44% 32% 51%
Other 6% 7% 6% 10%
Brown bag (member takes drug to the provider's office for administration)
5% 11% 1% 1%
DISTrIbuTION ChANNEL MANAGEMENT
PAyOr SurvEy DATA
The survey asked payors to describe distribution channels for chemotherapies as well as other nonchemotherapy infused drugs billed under the medical benefit. When pro-viders administer infused chemotherapies in their office, 60 percent of the volume is billed through a buy-and-bill process, in which the provider purchases the drug and then invoices the payor for reimbursement under the patient medical benefit.
Specialty pharmacies provide approximately one-third of the chemotherapeutic drugs infused in the provider’s office; this channel serves a minor portion of chemotherapy
acquisition for good reason, as specialty pharmacy acqui-sition costs are 17 percent higher on a weighted average basis than in the provider’s office. Moreover, approximately 20 percent of drugs shipped to a provider’s office fail to be used due to, for example, changes in dose, therapy, duration of therapy, benefit changes or enrollment in pal-liative care programs. finally, higher claim cost can occur as partial-vial use is not possible when billing the 11-digit National Drug codes (NDcs) used by specialty pharma-cies. See Figure 39, Percentage of Medical Injectable/Infused Drug Volume Distributed to Members Through Vari-ous Billing Processes.

67%
33%
FIG. 40 | PrACTICES PurChASED by hOSPITAL SySTEMS
no
yes
One-third of survey respondents report they are seeing oncology practices in their service area being purchased by hospital systems. Of those, most said it is occurring in a relatively small percentage of oncology practices. The most common reason reported was practice financials. See Fig-ure 40, Practices Purchased by Hospital Systems.
n = 43 payors
n = 11 payors
0%
10%
20%
30%
40%
50%
41-50%31-40%21-30%10-20%<10%
46%
18% 18%
0%
18%
% o
f R
esp
on
de
nts
Percentage of Practices
IF yES, why?
Practice financials 50%
Hospital is building an accountable care organization
21%
Practice quality of life 21%
28 DISTrIbuTION ChANNEL MANAGEMENT
PAyOr SurvEy DATA

29
Medical Pharmacy & Oncology Trend Report™
8%
92%of lives
of lives
FIG. 42 | uTILIzATION MANAGEMENT TOOLS by CLASS
ThErAPEuTIC CLASS PrIOr AuThOrIzATION
DISEASE MANAGEMENT
STEP EDIT rEquIrEMENTS
CLINICAL PAThwAy GuIDELINES
CASE MANAGEMENT
DIFFErENTIAL rEIMburSEMENT
FAILurE OF GENErIC FIrST
NCCN GuIDELINES
FOrMuLAry PrESENCE NONE
Intravenous immune globulin (IVIG) 83% 53% 37% 15% 38% 9% 8% 50% 46% 0%
chemotherapy 82% 67% 57% 17% 39% 22% 8% 84% 11% 8%Erythropoiesis-stimulating agents (ESAs) 81% 50% 44% 18% 35% 11% 8% 56% 47% 1%
colony-stimulating agents (G-cSfs) 79% 63% 44% 17% 34% 9% 8% 55% 11% 3%
Biologic response modifiers (e.g., Orencia, Remicade, etc.)
94% 64% 57% 18% 35% 51% 12% 49% 51% 1%
Hemophilia 83% 67% 58% 3% 36% 8% 8% 44% 49% 9%chemotherapy-induced nausea and vomiting (cINV) 31% 64% 44% 16% 38% 46% 13% 56% 13% 11%
n = 35 payors, 99.5 million lives
Utilization management (UM) is a valuable tool that health plans employ to encourage appropriate use and dosing and to monitor site-of-service dynamics. In 2012, 92 percent of members were enrolled in plans that have implemented utilization management programs for provider-administered injectables. Most payors use prior authoriza-tion (PA) as the primary utilization management tool. See Figure 41, Managing Utilization of Injectable/Infusible Products Administered by a Provider.
Inspection of selected classes of medical injectables found that those with the most management (i.e., subjected to PA for at least 50 per-cent of members) included all the agents listed in figure 42 except those for hemophilia treatments. Even more so than in previous years, guidelines developed by the National comprehensive cancer Network (NccN) were the most commonly used tools to ensure appropriate use for chemotherapies; case management and disease management were also commonly employed. In 2012, use of clinical pathways for chemo-therapy increased (17 percent of covered lives) versus only 8 percent in 2011; importantly, pathway programs were largely pilot studies and not implemented across the majority of the plans’ membership. Drugs used for hemophilia were least likely to be subjected to PAs, although formularies and step edits were used to manage utilization for nearly half of the lives studied. chemotherapy-induced nausea and vomit-ing accounted for the most lives in which no restrictions were noted, likely due to the low cost of generics coupled with coverage rules on Aloxi. See Figure 42, Utilization Management Tools Used for Medical Injectable/Infusible Products in the Specific Therapeutic Classes.
utilization Management
FIG. 41 | MANAGING uTILIzATION OF PrODuCTS
no, we do not manage utilization of provider-administered injectables
yes, we manage
utilization of provider-
administered injectables
PAyOr SurvEy DATAuTILIzATION MANAGEMENT
Medical Pharmacy & Oncology Trend Report™

FIG. 43 | CANCErS SubjECTED TO MEDICAL uTILIzATION TOOLS
2010 % OF LIvES
2011 % OF LIvES
2012 % OF LIvES
yEAr-OvEr-yEAr % ChANGE
Metastatic breast cancer 59% 70% 97% 39%
Prostate cancer 59% 94% 97% 3%
Multiple myeloma 56% 62% 95% 53%
Non-Hodgkin's lymphoma 49% 66% 95% 44%
leukemia 48% 69% 95% 38%
Renal-cell carcinoma 54% 75% 95% 27%
Non-small cell lung cancer 85% 83% 95% 14%
Payors in 2012 reported markedly increased use of utiliza-tion management tools for all major cancer types (95 per-cent of covered lives were reported for all other surveyed cancer therapies). As noted earlier, PA, NccN guideline adherence, edits, genetic tests prior to initial therapy, claims edits for appropriate diagnosis and retrospective drug utili-zation review continue to be common methods that payors employ. See Figure 43, Cancer Types Most Commonly Sub-jected to Medical Utilization Tools.
Avastin, Remicade and Rituxan continue to be the most commonly reported agents subjected to PA (nearly half of covered lives). As in the past, case management continues to be a smaller, but important, tool health plans employ to monitor utilization. Interestingly, use of disease manage-ment and differential reimbursement was limited to only four large payors (35 to 50 percent of lives covered). Aloxi, cerezyme, Eloxatin, Gemzar and Herceptin were associ-ated with the highest use of clinical pathways as a manage-ment tool, consistent with the use of genomic testing prior to therapy. Similar to 2010 and 2011, few payors reported not using any medical injectable management tools or con-trols. See Figure 44, Management Tools Used for Common Medical Injectable Therapies.
FIG. 44 | MANAGEMENT TOOLS FOr COMMON ThErAPIES by PErCENT OF LIvES
DruGS PrIOr AuThOrIzATION
CASE MANAGEMENT
DISEASE MANAGEMENT
CLINICAL PAThwAy GuIDELINES
DIFFErENTIAL rEIMburSEMENT
STEP EDIT rEquIrEMENTS
FAILurE OF GENErIC FIrST
NCCN GuIDELINES NONE
# rESPONDENTS N = 31 N = 8 N = 4 N = 10 N = 4 N = 10 N = 9 N = 19 N = 11
Remicade 90% 39% 49% 9% 35% 51% 7% 45% 1%
Rituxan 88% 40% 49% 3% 35% 46% 7% 60% 3%
Avastin 87% 40% 49% 3% 35% 8% 3% 85% 3%
Erbitux 87% 40% 49% 3% 35% 8% 2% 85% 3%
Herceptin 86% 40% 49% 16% 35% 9% 2% 72% 3%
Abraxane 76% 40% 49% 10% 35% 8% 4% 85% 8%
Gemzar 75% 40% 49% 16% 35% 8% 3% 75% 8%
cerezyme 55% 43% 49% 20% 35% 8% 3% 46% 1%
Alimta 47% 39% 49% 3% 35% 10% 2% 62% 8%
Aloxi 46% 40% 49% 17% 35% 9% 3% 55% 8%
Zometa 43% 39% 49% 4% 35% 8% 2% 56% 8%
Eloxatin 41% 40% 49% 16% 35% 8% 2% 62% 9%
Taxotere 41% 40% 50% 3% 35% 8% 3% 70% 9%n = 31 payors, 99 million lives (2012)
PAyOr SurvEy DATA 30 uTILIzATION MANAGEMENT
31
Medical Pharmacy & Oncology Trend Report™
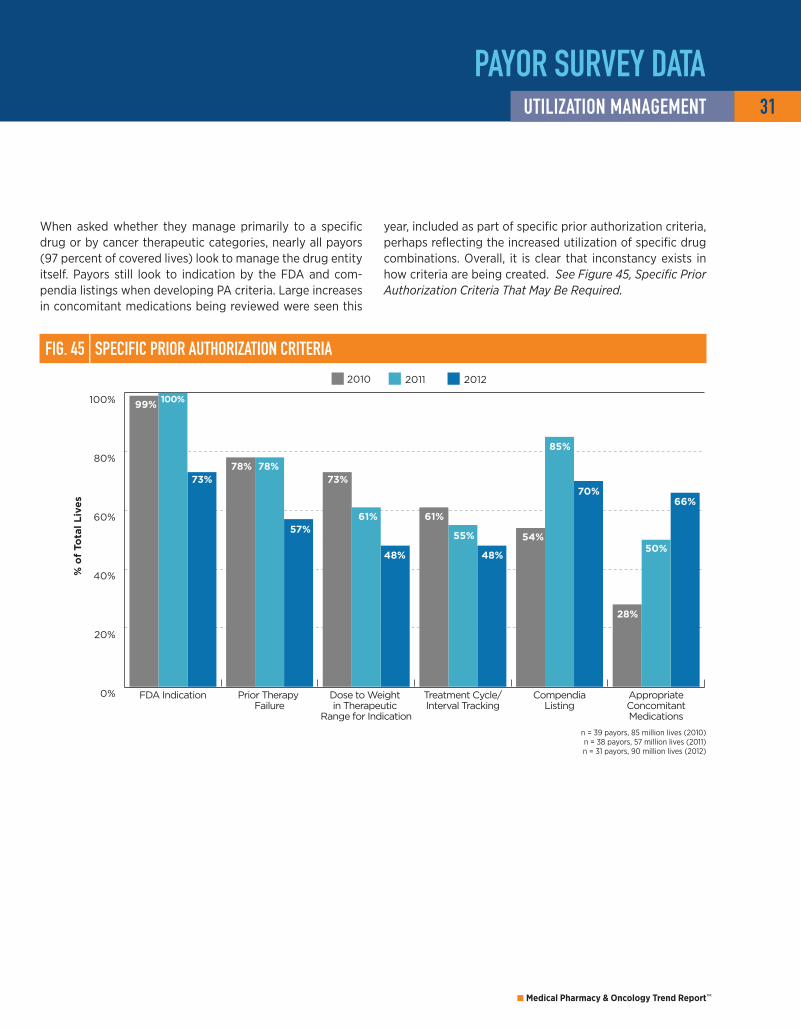
When asked whether they manage primarily to a specific drug or by cancer therapeutic categories, nearly all payors (97 percent of covered lives) look to manage the drug entity itself. Payors still look to indication by the fDA and com-pendia listings when developing PA criteria. large increases in concomitant medications being reviewed were seen this
FIG. 45 | SPECIFIC PrIOr AuThOrIzATION CrITErIA
% o
f To
tal
Liv
es
2010 20122011
0%
20%
40%
60%
80%
100%
AppropriateConcomitantMedications
CompendiaListing
Treatment Cycle/Interval Tracking
Dose to Weight in Therapeutic
Range for Indication
Prior Therapy Failure
FDA Indication
99% 100%
73%78% 78%
57%
48% 48%
85%
61% 61%
54%55%
28%
50%
66%70%
73%
year, included as part of specific prior authorization criteria, perhaps reflecting the increased utilization of specific drug combinations. Overall, it is clear that inconstancy exists in how criteria are being created. See Figure 45, Specific Prior Authorization Criteria That May Be Required.
n = 39 payors, 85 million lives (2010)n = 38 payors, 57 million lives (2011)n = 31 payors, 90 million lives (2012)
PAyOr SurvEy DATAuTILIzATION MANAGEMENT
Medical Pharmacy & Oncology Trend Report™

When asked about top concerns regarding medical inject-ables in 2012, more than one-third of payors mentioned the overall cost as the most significant concern. Benefit cover-age was the next most commonly mentioned concern (21 percent). Also, we asked payors to define the key driver of oncology cost increases. Manufacturer pricing action was noted by plans representing two-thirds of the lives; the bal-ance believe the driver is related to increased drug utiliza-tion, as described earlier in this report. See Figure 46, Top Medical Injectable Concerns in 2012.
Virtually all payors noted their PA criteria, as well as medical policy development and execution, are created internally. Simi-lar to previous years, therapeutic or oncology treatment guide-lines are frequently developed externally to the plan, often utilizing the expertise of the oncologist community. See Figure 47, Where Management Services Are Developed at Health Plans.
FIG. 46 | TOP MEDICAL INjECTAbLE CONCErNS IN 2012
MEDICAL INjECTAbLE CONCErN % OF PAyOrS
Overall, increased costs 37%
Appropriate utilization 21%
New biologics 12%
Oncologics 12%
Integration of medical injectables with oral pharmacy management
4%
FIG. 47 | whErE MANAGEMENT SErvICES ArE DEvELOPED
0% 20% 40% 60% 80% 100%
Development of oncology treatment guidelines
Therapeutic guidelines
Written adherence to oncology treatment guidelines
Implementation of oncology treatment guidelines
PA execution/implementation
Medical policy development
PA criteria development 1%4%
2%4%
4%
0%
0%
4%
% of Total Lives
Internal External None
64%
32%
63%
37%
42%49%
9%
26%43%
31%
95%
94%
96%
PAyOr SurvEy DATA 32 uTILIzATION MANAGEMENT

33
Medical Pharmacy & Oncology Trend Report™
12%
88%of lives
of lives
Operational Improvements
FIG. 48 | POST-CLAIM EDITS CONDuCTED
FIG. 49 | IMPLEMENTATION OF POST-CLAIM EDITS
internal
not conducting
edits 0%
external vendor
Payors continue to use post-claim edits for provider- administered injectables paid under the member’s medi-cal benefit. Such edits are recommended to mitigate fraud, waste, billing errors, and off-standard-of-care use. We con-tinue to see the portion of payors with medical pharmacy edits to be low. Payors have commented that while existing edit tools may capture severe outliers, detailed content is needed to optimize the opportunity. claims reviews con-ducted to monitor fDA label indications are performed for more than half of covered lives. Appropriate dosing regi-mens overall, as well as appropriate weight-based medi-cations, were monitored in 43 and 39 percent of covered lives, respectively. Additional edits are designed to assess off-label or off-standard-of-care use and to mitigate claim pricing errors. Of those conducting reviews, nearly all are developed and conducted by internal health plan staff. See Figure 48, Post-Claim Edits Conducted on Medical Injectable Claims, and Figure 49, Implementation of Post-Claim Edits.
0% 10% 20% 30% 40% 50% 60%
Adherence totreatment guidelines
Adherence to treatmentpathway requirements
Accuracy ofclaims pricing
Not conducting edits
Appropriate dosing inweight-based medications
Appropriatedosing regimens
FDA labelindications
% of Total Lives
39%
39%
8%
52%
17%
43%
1%
PAyOr SurvEy DATAOPErATIONAL IMPrOvEMENTS
Medical Pharmacy & Oncology Trend Report™

12%
50%of lives
of lives
10%of lives
29%of lives
Radiation oncology treatments generally fall within the medical benefit at health plans. figure 50 illustrates that radiation oncology, regardless of whether for diagnostic or treatment purposes, is being managed by health plans for half (50 percent) of the covered lives represented in the 2012 survey. See Figure 50, Health Plans That Manage Radiation Oncology Benefits.
FIG. 50 | MANAGE rADIATION ONCOLOGy bENEFITSyes, for treatment only
yes, overall
no, not managing utilization
yes, for diagnostic only
FIG. 51 | PrOGrAMS TO ENCOurAGE SITE OF SErvICE ShIFT
0% 20% 40% 60% 80% 100%
55% 45%
39% 61%
58% 42%
% of Total Lives
NoYes
does your health plan have programs in place to encourage a shift of care for medical injectables
from one site of service to another?
After implementation of a fee schedule in the outpatient setting, has your plan seen a shift toward patients being
treated at a hospital or infusion center?
do you have a fee schedule for infusion centers or hospitals?
More than half of members were enrolled in payors who have implemented programs to manage untoward site of service shifts, although the success of these programs is generally not known. Programs such as differential reim-bursement or mandated specialty pharmacy use have been implemented to encourage the provision of care in the provider or home setting and away from the inpatient or outpatient hospital setting. After implementation of a fee schedule in the outpatient setting, nearly one-quarter of
members were subjected to a shift toward being treated at a hospital or infusion center. See Figure 51, Programs to Encourage Site of Service Shift.
Approximately 58 percent of payors’ lives have a fee sched-ule for infusion centers or hospitals, although the robust-ness of these schedules is highly variable because they are commonly based upon a “percentage of charges” model in which the center or hospital develops a charge master.
PAyOr SurvEy DATA 34 OPErATIONAL IMPrOvEMENTS

hEALTh PLAN CLAIMS DATA

hEALTh PLAN CLAIMS DATA 36 TrEND DrIvErS
FIG. 52 | TOP 25 MEDICAL bENEFIT SPECIALTy DruGS (ALL LINES OF buSINESS AND SITES OF SErvICE)CALCuLATED COST PEr uNIT
2011 2010
DruG rANKING j CODE uNITS PEr 1 M LIvES ALLOwED PEr 1 M LIvES ALLOwED PEr 1 M LIvES % ChANGE
Remicade 1 J1745 249,815 $85.25 $21,297,483 $16,831,355 27%
Neulasta 2 J2505 5,874 $3,104.59 $18,237,283 $15,551,250 17%
Avastin 3 J9035 222,317 $79.16 $17,599,624 $16,797,540 5%
Rituxan 4 J9310 21,296 $671.05 $14,290,797 $12,373,250 15%
lucentis 5 J2778 27,843 $407.13 $11,335,601 $7,216,687 57%
Herceptin 6 J9355 115,398 $78.76 $9,089,341 $8,145,277 12%
Eloxatin 7 J9263 756,958 $11.01 $8,337,577 $4,705,059 77%
Taxotere 8 J9171 274,058 $22.94 $6,286,493 $6,542,993 -4%
Gammagard 9 J1569 82,693 $75.43 $6,237,738 $5,043,225 24%
Alimta 10 J9305 96,918 $57.80 $5,601,882 $4,565,757 23%
Advate 11 J7192 1,005,650 $4.52 $4,541,021 $5,474,438 -17%
Gamunex 12 J1561 52,334 $81.52 $4,266,216 $4,068,691 5%
Gemzar 13 J9201 26,653 $151.47 $4,037,249 $4,225,284 -4%
Tysabri 14 J2323 267,670 $14.67 $3,925,521 $2,349,569 67%
Aloxi 15 J2469 139,470 $25.17 $3,510,232 $2,841,468 24%
Erbitux 16 J9055 53,051 $63.11 $3,347,783 $3,214,451 4%
Zometa 17 J3487 12,402 $258.09 $3,200,741 $3,528,521 -9%
Velcade 18 J9041 69,772 $43.93 $3,065,380 $2,553,969 20%
Procrit 19 Q4081 - ESRD 1,682,534 $1.79 $3,005,084 $3,573,004 -16%
Orencia 20 J0129 118,427 $25.11 $2,973,499 $2,374,323 25%
Aranesp 21 J0881 849,327 $3.48 $2,956,802 $3,351,996 -12%
xolair 22 J2357 80,550 $34.47 $2,776,283 $2,764,605 0%
Procrit 23 J0885 - Non-ESRD 236,246 $11.57 $2,733,007 $2,960,842 -8%
Synvisc-One 24 J7325 148,521 $16.50 $2,450,895 $1,603,979 53%
Treanda 25 J9033 108,234 $22.15 $2,396,887 $1,327,114 81%
Total $167,500,416 $143,984,647 16%
Based on analysis of paid medical benefit injectable claims from 2011, a 1-million-life commercial plan will have averaged $251 million in medical benefit injectable costs in 2011 across all sites of service. Of that, the top 25 medical drugs com-prised more than 69 percent of the total medical injectable spend. Total medical pharmacy cost increased by 7 percent. In 2011, Remicade was the largest overall spend per 1 million insured lives, and had a year-over-year increase of 27 percent.
There was a continued decrease in provider utilization trend of Avastin for metastatic breast cancer (mBc). lucentis again had a significant upward trend due to continued marketing to physicians. Eloxitan, Tysabri and Synvisc had greater than 50 percent increases in spend while Taxotere, Gemzar, Advate, Zometa and all ESAs had negative cost trends. See Figure 52, Top 25 Medical Benefit Specialty Drugs by Allowed Amount per 1 Million Lives (All Lines of Business and Sites of Service).
Trend Drivers
37
Medical Pharmacy & Oncology Trend Report™
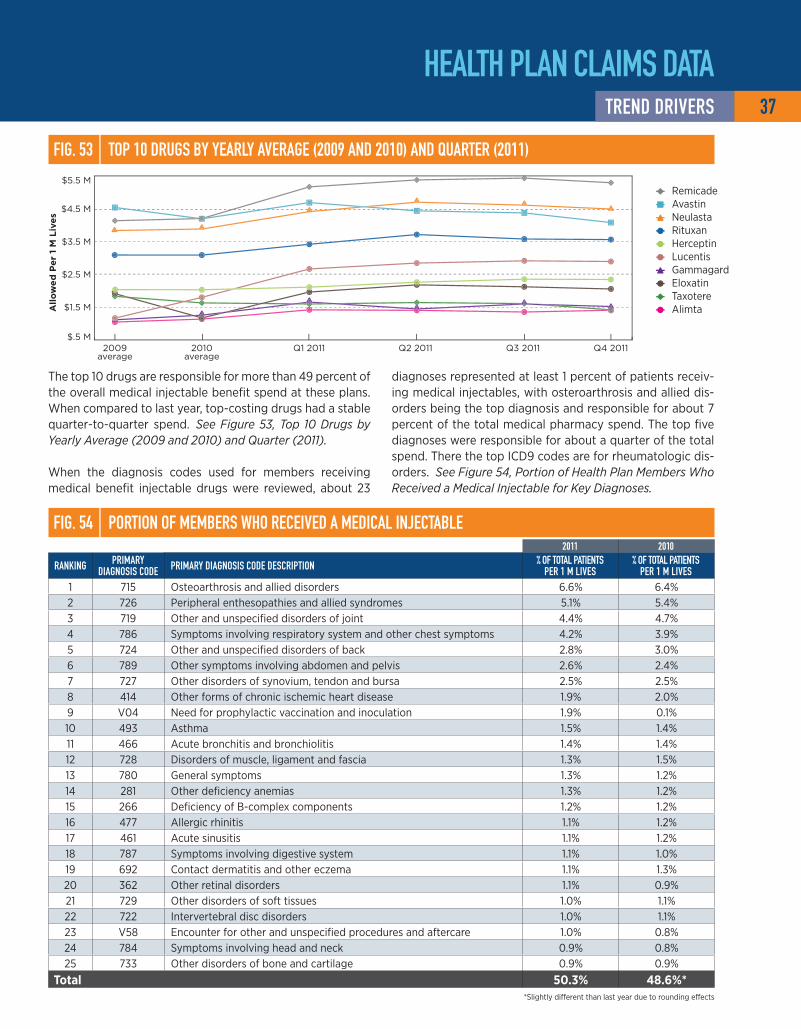
FIG. 53 | TOP 10 DruGS by yEArLy AvErAGE (2009 AND 2010) AND quArTEr (2011)
hEALTh PLAN CLAIMS DATATrEND DrIvErS
FIG. 54 | POrTION OF MEMbErS whO rECEIvED A MEDICAL INjECTAbLE 2011 2010
rANKING PrIMAry DIAGNOSIS CODE PrIMAry DIAGNOSIS CODE DESCrIPTION % OF TOTAL PATIENTS
PEr 1 M LIvES% OF TOTAL PATIENTS
PEr 1 M LIvES1 715 Osteoarthrosis and allied disorders 6.6% 6.4%2 726 Peripheral enthesopathies and allied syndromes 5.1% 5.4%3 719 Other and unspecified disorders of joint 4.4% 4.7%4 786 Symptoms involving respiratory system and other chest symptoms 4.2% 3.9%5 724 Other and unspecified disorders of back 2.8% 3.0%6 789 Other symptoms involving abdomen and pelvis 2.6% 2.4%7 727 Other disorders of synovium, tendon and bursa 2.5% 2.5%8 414 Other forms of chronic ischemic heart disease 1.9% 2.0%9 V04 Need for prophylactic vaccination and inoculation 1.9% 0.1%10 493 Asthma 1.5% 1.4%11 466 Acute bronchitis and bronchiolitis 1.4% 1.4%12 728 Disorders of muscle, ligament and fascia 1.3% 1.5%13 780 General symptoms 1.3% 1.2%14 281 Other deficiency anemias 1.3% 1.2%15 266 Deficiency of B-complex components 1.2% 1.2%16 477 Allergic rhinitis 1.1% 1.2%17 461 Acute sinusitis 1.1% 1.2%18 787 Symptoms involving digestive system 1.1% 1.0%19 692 contact dermatitis and other eczema 1.1% 1.3%20 362 Other retinal disorders 1.1% 0.9%21 729 Other disorders of soft tissues 1.0% 1.1%22 722 Intervertebral disc disorders 1.0% 1.1%23 V58 Encounter for other and unspecified procedures and aftercare 1.0% 0.8%24 784 Symptoms involving head and neck 0.9% 0.8%25 733 Other disorders of bone and cartilage 0.9% 0.9%
Total 50.3% 48.6%**Slightly different than last year due to rounding effects
The top 10 drugs are responsible for more than 49 percent of the overall medical injectable benefit spend at these plans. When compared to last year, top-costing drugs had a stable quarter-to-quarter spend. See Figure 53, Top 10 Drugs by Yearly Average (2009 and 2010) and Quarter (2011).
When the diagnosis codes used for members receiving medical benefit injectable drugs were reviewed, about 23
diagnoses represented at least 1 percent of patients receiv-ing medical injectables, with osteroarthrosis and allied dis-orders being the top diagnosis and responsible for about 7 percent of the total medical pharmacy spend. The top five diagnoses were responsible for about a quarter of the total spend. There the top IcD9 codes are for rheumatologic dis-orders. See Figure 54, Portion of Health Plan Members Who Received a Medical Injectable for Key Diagnoses.
$.5 M
$1.5 M
$2.5 M
$3.5 M
$4.5 M
$5.5 M
2009average
2010average
Q1 2011 Q2 2011 Q3 2011 Q4 2011
All
ow
ed
Pe
r 1
M L
ive
s
RemicadeAvastinNeulastaRituxanHerceptinLucentis GammagardEloxatinTaxotereAlimta
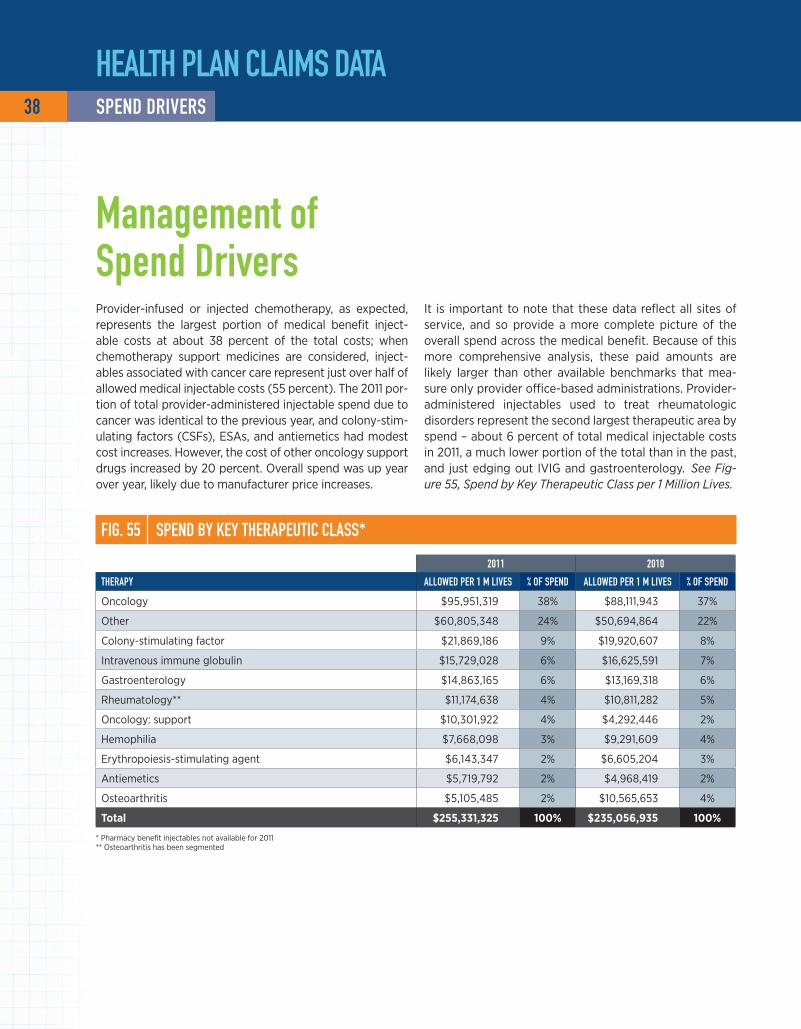
Provider-infused or injected chemotherapy, as expected, represents the largest portion of medical benefit inject-able costs at about 38 percent of the total costs; when chemotherapy support medicines are considered, inject-ables associated with cancer care represent just over half of allowed medical injectable costs (55 percent). The 2011 por-tion of total provider-administered injectable spend due to cancer was identical to the previous year, and colony-stim-ulating factors (cSfs), ESAs, and antiemetics had modest cost increases. However, the cost of other oncology support drugs increased by 20 percent. Overall spend was up year over year, likely due to manufacturer price increases.
It is important to note that these data reflect all sites of service, and so provide a more complete picture of the overall spend across the medical benefit. Because of this more comprehensive analysis, these paid amounts are likely larger than other available benchmarks that mea-sure only provider office-based administrations. Provider-administered injectables used to treat rheumatologic disorders represent the second largest therapeutic area by spend – about 6 percent of total medical injectable costs in 2011, a much lower portion of the total than in the past, and just edging out IVIG and gastroenterology. See Fig-ure 55, Spend by Key Therapeutic Class per 1 Million Lives.
Management of Spend Drivers
FIG. 55 | SPEND by KEy ThErAPEuTIC CLASS*
2011 2010
ThErAPy ALLOwED PEr 1 M LIvES % OF SPEND ALLOwED PEr 1 M LIvES % OF SPEND
Oncology $95,951,319 38% $88,111,943 37%
Other $60,805,348 24% $50,694,864 22%
colony-stimulating factor $21,869,186 9% $19,920,607 8%
Intravenous immune globulin $15,729,028 6% $16,625,591 7%
Gastroenterology $14,863,165 6% $13,169,318 6%
Rheumatology** $11,174,638 4% $10,811,282 5%
Oncology: support $10,301,922 4% $4,292,446 2%
Hemophilia $7,668,098 3% $9,291,609 4%
Erythropoiesis-stimulating agent $6,143,347 2% $6,605,204 3%
Antiemetics $5,719,792 2% $4,968,419 2%
Osteoarthritis $5,105,485 2% $10,565,653 4%
Total $255,331,325 100% $235,056,935 100%
* Pharmacy benefit injectables not available for 2011 ** Osteoarthritis has been segmented
hEALTh PLAN CLAIMS DATA 38 SPEND DrIvErS

39
Medical Pharmacy & Oncology Trend Report™
1.1%
1.7%
25.3%
40.4%
23.0%
8.6%
Across all lines of business, hematologists and oncolo-gists together order and administer the most medical benefit injectable drugs, representing just less than 50 percent of the total spend. Rheumatology is also a key medical specialty. Other provider specialties mentioned include urology and various others. See Figure 56, Spend per 1 Million Lives by Provider Specialty.
In a year-over-year assessment of claims to determine what specialties are ordering medical benefit injectables, a lower portion appears to be ordered by oncologists in 2011 when compared with 2010. This is consistent with previous years and was absorbed by an increase in pre-scribing by rheumatologists, radiation oncologists and hematologists. See Figure 57, Claims per 1 Million Lives by Provider Specialty.
National Provider Trends
FIG. 57 | CLAIMS by PrOvIDEr SPECIALTy
2011 2010 2011 2010SPECIALTy uNITS PEr 1 M LIvES % ChANGE CLAIMS PEr 1 M LIvES % ChANGE
Other 4,278,967 3,512,842 -16.1% 289,710 232,749 -21.7%
Oncology 1,625,971 1,937,091 21.8% 52,910 67,560 24.5%
Hematology 2,066,931 1,157,807 78.5% 58,465 39,258 48.9%
Rheumatology 350,190 166,082 110.9% 18,234 12,578 45.0%
Urology 58,508 41,297 41.7% 9,010 6,338 42.2%
Radiation oncology 89,631 50,650 77.0% 2,235 1,683 32.8%
Total 8,470,198 6,865,768 430,565 360,165
Rheumatology $10,736,210 (38.1% of change)
Hematology $31,484,151 (38.1% of change)
Urology $2,069,079
(23.2% of change)
Oncology $28,655,482
(-37.2% of change)
Radiation Oncology $1,312,018
(40.4% of change)
Other $50,359,882 (35.7% of change)
hEALTh PLAN CLAIMS DATANATIONAL PrOvIDEr TrENDS
FIG. 56 | SPEND by PrOvIDEr SPECIALTy

FIG. 58 | SPEND AND uTILIzATION PEr 1 MILLION LIvES by SITE OF SErvICE*
rANKING j CODE brAND NAME ALLOwED PEr 1 M LIvES 2011 TOTAL $/CLAIM 2010 TOTAL $/CLAIM 2009 TOTAL $/CLAIM
1 J1745 Remicade $24,052,942 $3,943 $3,765 $3,711
2 J2505 Neulasta $19,820,310 $3,306 $3,309 $3,405
3 J9035 Avastin* $19,544,584 $2,297 $3,248 $3,784
4 J9310 Rituxan $15,862,675 $5,411 $5,218 $5,228
5 J2778 lucentis $12,958,535 $2,045 $2,071 $2,088
6 J9355 Herceptin $9,678,854 $2,939 $2,516 $2,562
7 J9263 Eloxatin $9,125,364 $3,591 $3,658 $3,888
8 J1569 Gammagard $7,021,631 $4,049 $4,409 $4,779
9 J9171 Taxotere $6,779,615 $2,398 $2,308 $2,622
10 J9305 Alimta $6,201,325 $5,019 $5,044 $5,338
PErCENT OF CLAIM
hOSPITAL hOME INFuSION/SPP OThEr (ESrD, CLINICS, ETC.) MEDICAL OFFICE
brAND NAME rANKING 2009 2010 2011 2009 2010 2011 2009 2010 2011 2009 2010 2011
Remicade 1 23% 20% 23% 12% 8% 7% 1% 0% 0% 64% 71% 69%
Neulasta 2 24% 30% 31% 2% 1% 1% 1% 1% 2% 72% 68% 67%
Avastin 3 20% 18% 18% 3% 2% 1% 1% 1% 1% 76% 79% 81%
Rituxan 4 25% 32% 36% 2% 1% 1% 1% 1% 1% 71% 66% 63%
lucentis 5 1% 0% 1% 8% 4% 3% 0% 0% 0% 91% 96% 95%
Herceptin 6 23% 28% 36% 1% 0% 0% 2% 2% 1% 74% 70% 63%
Eloxatin 7 28% 29% 38% 2% 0% 0% 2% 1% 2% 68% 69% 59%
Gammagard 8 22% 19% 18% 63% 66% 65% 1% 0% 0% 14% 15% 17%
Taxotere 9 22% 28% 31% 2% 1% 0% 1% 1% 1% 75% 71% 68%
Alimta 10 30% 38% 42% 2% 0% 0% 2% 2% 2% 66% 60% 56%*$ per claim drop was a result of shift in sight of service, off-label use and the fDA decision to revoke the approval of the breast cancer indication for Avastin.
Injectable therapies billed under the patient’s medical ben-efit are typically administered through one of four main channels: the hospital, facility outpatient, home infusion or the provider’s office. Additional infusions are given in other sites of service, with ESAs administered at dialysis centers serving as a key example. looking at the top 10 drugs by annual allowed amount per 1 million lives in 2011, administration in the hospital setting generally results in twice the amount of what a provider-administered inject-able delivered in the provider’s office would cost. There has been some migration in the market with provider groups
beginning to send patients to hospitals for their therapy administration, which has the potential to increase costs of care significantly over time as this continues. While top 10 medications such as Remicade, Avastin, lucentis and Gam-magard were relatively stable in site of service mix, can-cer drugs such as Neulasta, Rituxan, Herceptin, Eloxatin, Taxotere and Alimta had material increases in portions of drug administered in the hospital, and this was a result of the cannibalization of office administration. See Figure 58, Spend and Utilization per 1 Million Lives by Site of Service.
40 NATIONAL PrOvIDEr TrENDS
hEALTh PLAN CLAIMS DATA

41
Medical Pharmacy & Oncology Trend Report™
NATIONAL PrOvIDEr TrENDS
Medical benefit injectable drugs are commonly used for mul-tiple indications, and we found wide variations in the indica-tions of high-spend medical benefit injectable products. The data listed illustrate the top five diagnoses for the top six highest-cost drugs to payors: Remicade, Neulasta, Avastin, Rituxan, lucentis and Herceptin. for comparison, the 2010 data are presented as well. Nonspecific IcD9 codes con-
tinue to be used by providers for high-cost medications. As a result, this continues to drive the need to have claim sys-tems with sophisticated edits and utilization review because these nondescript codes are not providing payors with the data needed to validate how these drugs are being used for their members. See Figure 59, Top Six Diagnosis Codes for Key Medical Benefit Drugs.
FIG. 59 | TOP SIx DIAGNOSIS CODES
DESCrIPTION CODE ALLOwED PEr 1 M LIvES CLAIMS PEr 1 M LIvES2011 2010 % ChANGE 2011 2010 % ChANGE
Regional enteritis 555 $7,285,402 $5,787,732 26% 1,614 1,261 28%
Rheumatoid arthritis and other inflammatory polyarthropathies 714 $6,460,182 $5,699,470 13% 2,117 1,895 12%Ulcerative colitis 556 $3,001,320 $1,919,806 56% 625 455 37%
Psoriasis and similar disorders 696 $2,470,860 $2,093,268 18% 612 537 14%Ankylosing spondylitis and other inflammatory spondylopathies 720 $739,626 $534,229 38% 210 156 34%
ReM
ica
de
DESCrIPTION CODE ALLOwED PEr 1 M LIvES CLAIMS PEr 1 M LIvES2011 2010 % ChANGE 2011 2010 % ChANGE
Diseases of white blood cells 288 $5,032,150 $3,298,293 53% 1,792 1,176 52%Encounter for other and unspecified procedures and aftercare V58 $3,403,913 $2,402,215 42% 951 606 57%Malignant neoplasm of female breast 174 $3,274,479 $3,356,197 -2% 930 923 1%convalescence V66 $1,135,374 $918,824 24% 337 291 16%Malignant neoplasm of trachea, bronchus and lung 162 $1,095,074 $1,214,710 -10% 383 390 -2%
Neu
lasT
ahEALTh PLAN CLAIMS DATA
DESCrIPTION CODE ALLOwED PEr 1 M LIvES CLAIMS PEr 1 M LIvES2011 2010 % ChANGE 2011 2010 % ChANGE
Encounter for other and unspecified procedures and aftercare V58 $5,358,521 $4,029,285 33% 777 553 40%Malignant neoplasm of trachea, bronchus and lung 162 $3,094,423 $2,780,706 11% 447 442 1%Malignant neoplasm of colon 153 $2,961,138 $2,535,443 17% 823 741 11%Malignant neoplasm of brain 191 $2,119,552 $1,300,605 63% 314 226 39%Malignant neoplasm of female breast 174 $1,780,998 $2,853,309 -38% 240 498 -52%
aVa
sTiN
DESCrIPTION CODE ALLOwED PEr 1 M LIvES CLAIMS PEr 1 M LIvES2011 2010 % ChANGE 2011 2010 % ChANGE
Other malignant neoplasms of lymphoid and histiocytic tissue 202 $6,145,634 $5,442,542 13% 1,210 1,135 7%Encounter for other and unspecified procedures and aftercare V58 $2,867,759 $2,128,068 35% 469 327 44%Rheumatoid arthritis and other inflammatory polyarthropathies 714 $1,590,571 $1,324,958 20% 236 200 18%lymphoid leukemia 204 $1,295,580 $1,018,095 27% 269 234 15%lymphosarcoma and reticulosarcoma 200 $1,071,189 $826,271 30% 224 190 18%
RiTu
xaN
DESCrIPTION CODE ALLOwED PEr 1 M LIvES CLAIMS PEr 1 M LIvES2011 2010 % ChANGE 2011 2010 % ChANGE
Other retinal disorders 362 $12,287,640 $7,166,424 71% 6,052 3,460 75%Diabetes mellitus 250 $232,614 $20,646 1,027% 114 10 1,061%Osteoarthrosis and allied disorders 715 $5,656 $2,832 100% 3 1 174%Glaucoma 365 $4,736 $4,621 2% 3 2 22%Other disorders of eye 379 $4,490 $6,219 -28% 2 3 -29%
luce
NTi
s
DESCrIPTION CODE ALLOwED PEr 1 M LIvES CLAIMS PEr 1 M LIvES2011 2010 % ChANGE 2011 2010 % ChANGE
Malignant neoplasm of female breast 174 $6,376,438 $6,277,958 2% 2,415 2,659 -9%Encounter for other and unspecified procedures and aftercare V58 $2,757,859 $1,601,429 72% 711 467 52%Malignant neoplasm of esophagus 150 $108,954 $14,756 638% 28 4 592%Secondary malignant neoplasm of other specified sites 198 $79,010 $51,087 55% 32 24 29%Malignant neoplasm of stomach 151 $55,312 $27,449 102% 25 13 95%
HeR
cePT
iN
Medical Pharmacy & Oncology Trend Report™
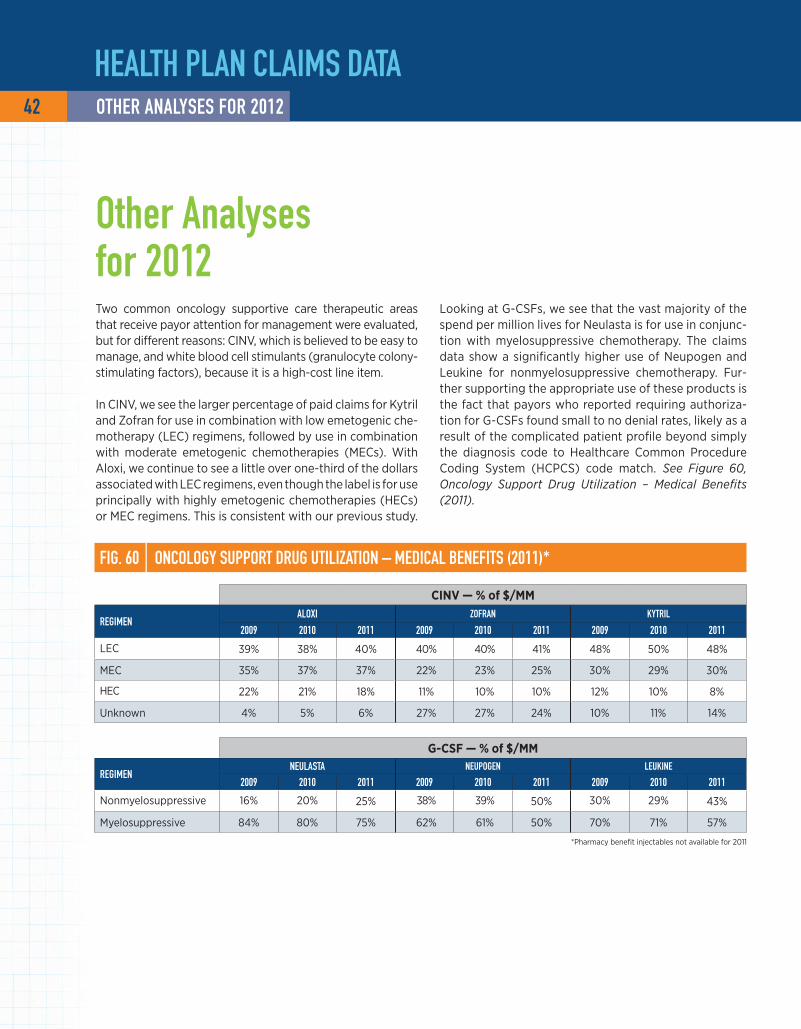
42 OThEr ANALySES FOr 2012
Two common oncology supportive care therapeutic areas that receive payor attention for management were evaluated, but for different reasons: cINV, which is believed to be easy to manage, and white blood cell stimulants (granulocyte colony-stimulating factors), because it is a high-cost line item.
In cINV, we see the larger percentage of paid claims for Kytril and Zofran for use in combination with low emetogenic che-motherapy (lEc) regimens, followed by use in combination with moderate emetogenic chemotherapies (MEcs). With Aloxi, we continue to see a little over one-third of the dollars associated with lEc regimens, even though the label is for use principally with highly emetogenic chemotherapies (HEcs) or MEc regimens. This is consistent with our previous study.
hEALTh PLAN CLAIMS DATA
FIG. 60 | ONCOLOGy SuPPOrT DruG uTILIzATION – MEDICAL bENEFITS (2011)*
ciNV — % of $/MM
rEGIMENALOxI zOFrAN KyTrIL
2009 2010 2011 2009 2010 2011 2009 2010 2011
lEc 39% 38% 40% 40% 40% 41% 48% 50% 48%
MEc 35% 37% 37% 22% 23% 25% 30% 29% 30%
HEc 22% 21% 18% 11% 10% 10% 12% 10% 8%
Unknown 4% 5% 6% 27% 27% 24% 10% 11% 14%
G-csF — % of $/MM
rEGIMENNEuLASTA NEuPOGEN LEuKINE
2009 2010 2011 2009 2010 2011 2009 2010 2011
Nonmyelosuppressive 16% 20% 25% 38% 39% 50% 30% 29% 43%
Myelosuppressive 84% 80% 75% 62% 61% 50% 70% 71% 57%
*Pharmacy benefit injectables not available for 2011
looking at G-cSfs, we see that the vast majority of the spend per million lives for Neulasta is for use in conjunc-tion with myelosuppressive chemotherapy. The claims data show a significantly higher use of Neupogen and leukine for nonmyelosuppressive chemotherapy. fur-ther supporting the appropriate use of these products is the fact that payors who reported requiring authoriza-tion for G-cSfs found small to no denial rates, likely as a result of the complicated patient profile beyond simply the diagnosis code to Healthcare common Procedure coding System (HcPcS) code match. See Figure 60, Oncology Support Drug Utilization – Medical Benefits (2011).
Other Analyses for 2012

43
Medical Pharmacy & Oncology Trend Report™
hEALTh PLAN CLAIMS DATAOThEr ANALySES FOr 2012
FIG. 61 | uNCLASSIFIED CODES – MEDICAL bENEFIT Two years of paid claims across all lines of business were also analyzed to compare the portion of classified and unclassified codes paid at commercial payors. Included in this comparison were the classic “dump” codes, such as J3490, J3535, J3590, J7699, J7199, J7599, J7799, J8498, J8499, J8597, J8999 and J9999. In fact, significant increases in drugs paid under these codes were seen in 2011. This may have been the result of a larger number of cancer drug approvals in 2011 than 2010. We believe this is in line with what is to be expected, as these codes were established for drugs newly approved that do not yet have a Medicare HcPcS code assigned.6 See Figure 61, Unclassified Codes – Medical Benefit.
uNclassiFied classiFied2010
Allowed per 1 M lives $690,094 $228,338,685
claims per 1 M lives 3,528 776,273
% of total spend 0.3% 99.7%
2011
Allowed per 1 M lives $6,605,245 $255,496,357
claims per 1 M lives 17,821 693,881
% of total spend 2.5% 97.5%
6 fDA Approved Drugs. centerWatch website. www.centerwatch.com/drug-information/fda-approvals/default.aspx?Drugyear=2010. Accessed January 8, 2013.
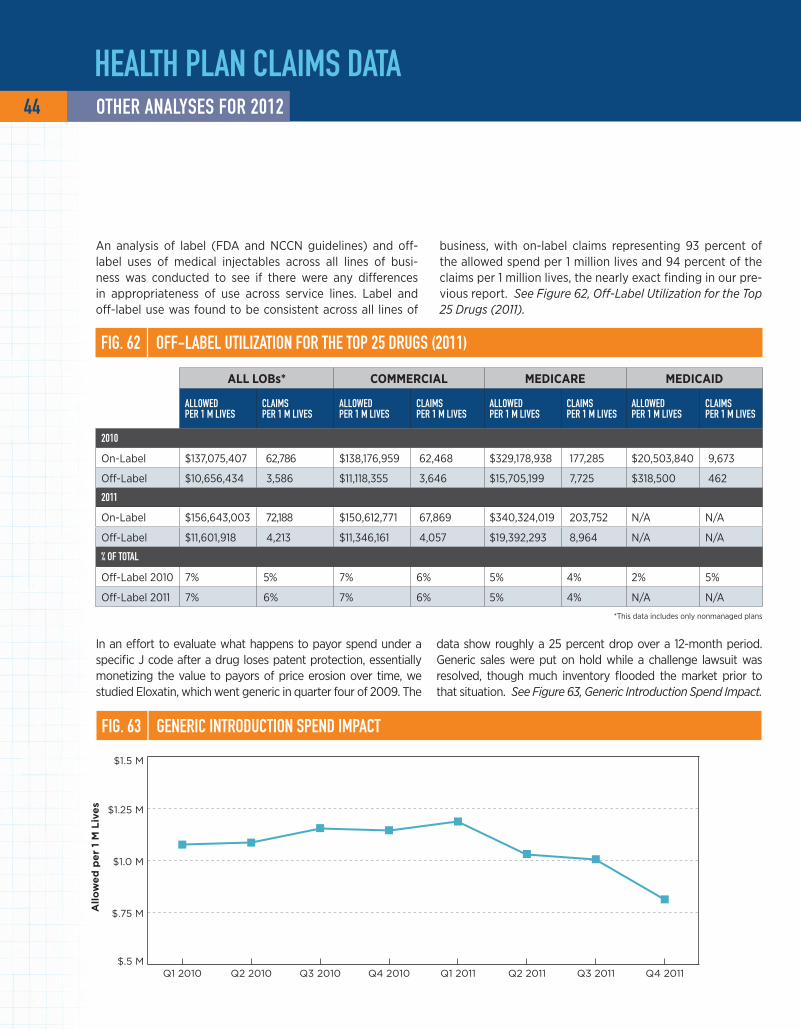
All
ow
ed
pe
r 1
M L
ive
s
$.5 M
$.75 M
$1.0 M
$1.25 M
$1.5 M
Q4 2011Q3 2011Q2 2011Q1 2011Q4 2010Q3 2010Q2 2010Q1 2010
hEALTh PLAN CLAIMS DATA
An analysis of label (fDA and NccN guidelines) and off-label uses of medical injectables across all lines of busi-ness was conducted to see if there were any differences in appropriateness of use across service lines. label and off-label use was found to be consistent across all lines of
In an effort to evaluate what happens to payor spend under a specific J code after a drug loses patent protection, essentially monetizing the value to payors of price erosion over time, we studied Eloxatin, which went generic in quarter four of 2009. The
data show roughly a 25 percent drop over a 12-month period. Generic sales were put on hold while a challenge lawsuit was resolved, though much inventory flooded the market prior to that situation. See Figure 63, Generic Introduction Spend Impact.
FIG. 63 | GENErIC INTrODuCTION SPEND IMPACT
FIG. 62 | OFF-LAbEL uTILIzATION FOr ThE TOP 25 DruGS (2011)
all lOBs* cOMMeRcial MedicaRe Medicaid
ALLOwED PEr 1 M LIvES
CLAIMS PEr 1 M LIvES
ALLOwED PEr 1 M LIvES
CLAIMS PEr 1 M LIvES
ALLOwED PEr 1 M LIvES
CLAIMS PEr 1 M LIvES
ALLOwED PEr 1 M LIvES
CLAIMS PEr 1 M LIvES
2010
On-label $137,075,407 62,786 $138,176,959 62,468 $329,178,938 177,285 $20,503,840 9,673
Off-label $10,656,434 3,586 $11,118,355 3,646 $15,705,199 7,725 $318,500 462
2011
On-label $156,643,003 72,188 $150,612,771 67,869 $340,324,019 203,752 N/A N/A
Off-label $11,601,918 4,213 $11,346,161 4,057 $19,392,293 8,964 N/A N/A
% OF TOTAL
Off-label 2010 7% 5% 7% 6% 5% 4% 2% 5%
Off-label 2011 7% 6% 7% 6% 5% 4% N/A N/A
*This data includes only nonmanaged plans
business, with on-label claims representing 93 percent of the allowed spend per 1 million lives and 94 percent of the claims per 1 million lives, the nearly exact finding in our pre-vious report. See Figure 62, Off-Label Utilization for the Top 25 Drugs (2011).
44 OThEr ANALySES FOr 2012

PrODuCT PIPELINE AND LEGISLATIvE TrENDS

Although 2011 proved to be a big year, with more than 11 new injectables receiving approval by the fDA, only seven new enti-ties were approved in the first half of 2012. Among the most anticipated was Genentech’s Perjeta, which was approved to treat HER2+ breast cancer. The fDA surprised many by making a decision on Perjeta in six months rather than the standard 10 months. Perjeta, approved to work in combination with Her-ceptin and Taxotere, appears to prolong the time before the aggressive HER2+ cancer worsens compared with Herceptin
and chemotherapy alone. In the study upon which the fDA based its approval, patients treated with Perjeta, Herceptin and Taxotere exhibited an increase in median progression-free survival time of 6.1 months compared with those treated with just Herceptin and Taxotere. Overall survival rates are not yet available, but those who received the combination with Perjeta experienced a 38 percent reduction in the risk of their disease worsening or death. See Figure 64, 2012 FDA-Approved Inject-able Drugs/Indications – Specialty and Oncology.
Drug Pipeline
FIG. 64 | 2012 FDA-APPrOvED INjECTAbLE DruGS
DruG MANuFACTurEr INDICATION APPrOvAL
Voraxaze (glucarpidase) BTG International Treatment of toxic plasma methotrexate concentrations January
Bydureon (exenatide) Amlin Type 2 diabetes mellitus January
Omontys (peginesatide) Affymax Anemia due to chronic kidney disease March
Elelyso (taliglucerase alfa) Pfizer Gaucher disease May
Perjeta (pertuzumab) Genentech Breast cancer June
Kyprolis (carfilzomib) Onyx Multiple myeloma July
Zaltrap (ziv-aflibercept) Sanofi colorectal cancer AugustSource: fDA-approved drugs. centerWatch website. www.centerwatch.com/
drug-information/fda-approvals. Accessed August 31, 2012.
PrODuCT PIPELINE AND LEGISLATIvE TrENDS 46 DruG PIPELINE
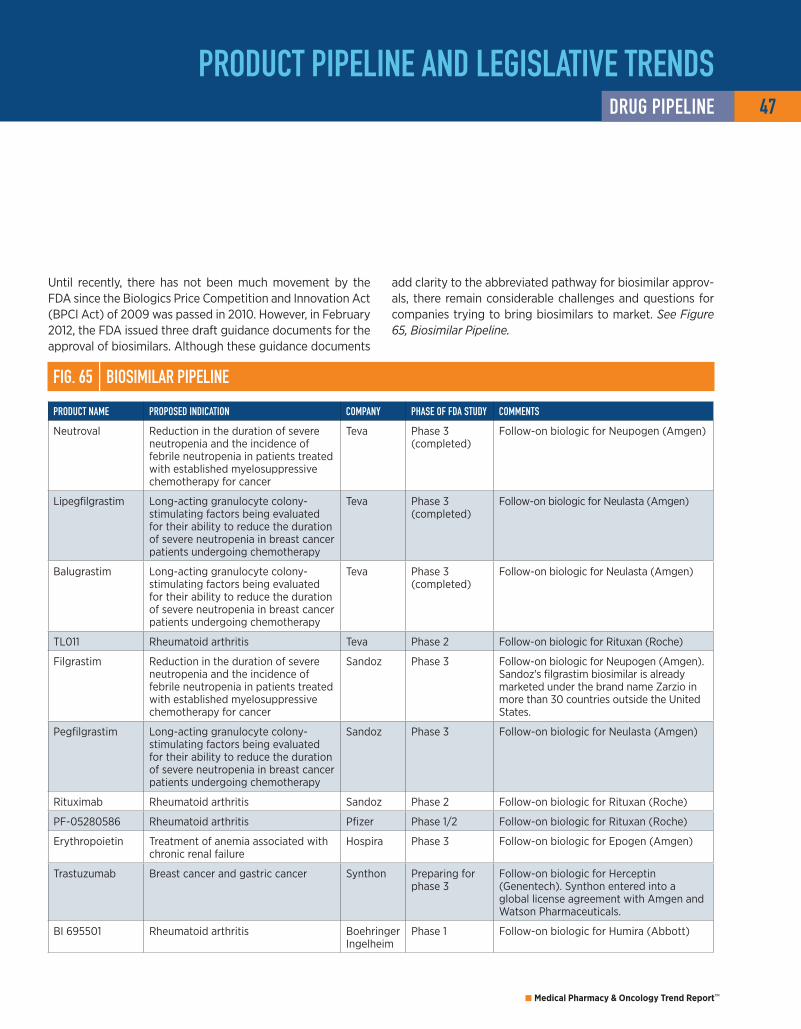
47
Medical Pharmacy & Oncology Trend Report™
Until recently, there has not been much movement by the fDA since the Biologics Price competition and Innovation Act (BPcI Act) of 2009 was passed in 2010. However, in february 2012, the fDA issued three draft guidance documents for the approval of biosimilars. Although these guidance documents
add clarity to the abbreviated pathway for biosimilar approv-als, there remain considerable challenges and questions for companies trying to bring biosimilars to market. See Figure 65, Biosimilar Pipeline.
FIG. 65 | bIOSIMILAr PIPELINE
PrODuCT NAME PrOPOSED INDICATION COMPANy PhASE OF FDA STuDy COMMENTS
Neutroval Reduction in the duration of severe neutropenia and the incidence of febrile neutropenia in patients treated with established myelosuppressive chemotherapy for cancer
Teva Phase 3 (completed)
follow-on biologic for Neupogen (Amgen)
lipegfilgrastim long-acting granulocyte colony-stimulating factors being evaluated for their ability to reduce the duration of severe neutropenia in breast cancer patients undergoing chemotherapy
Teva Phase 3 (completed)
follow-on biologic for Neulasta (Amgen)
Balugrastim long-acting granulocyte colony-stimulating factors being evaluated for their ability to reduce the duration of severe neutropenia in breast cancer patients undergoing chemotherapy
Teva Phase 3 (completed)
follow-on biologic for Neulasta (Amgen)
Tl011 Rheumatoid arthritis Teva Phase 2 follow-on biologic for Rituxan (Roche)
filgrastim Reduction in the duration of severe neutropenia and the incidence of febrile neutropenia in patients treated with established myelosuppressive chemotherapy for cancer
Sandoz Phase 3 follow-on biologic for Neupogen (Amgen). Sandoz's filgrastim biosimilar is already marketed under the brand name Zarzio in more than 30 countries outside the United States.
Pegfilgrastim long-acting granulocyte colony-stimulating factors being evaluated for their ability to reduce the duration of severe neutropenia in breast cancer patients undergoing chemotherapy
Sandoz Phase 3 follow-on biologic for Neulasta (Amgen)
Rituximab Rheumatoid arthritis Sandoz Phase 2 follow-on biologic for Rituxan (Roche)
Pf-05280586 Rheumatoid arthritis Pfizer Phase 1/2 follow-on biologic for Rituxan (Roche)
Erythropoietin Treatment of anemia associated with chronic renal failure
Hospira Phase 3 follow-on biologic for Epogen (Amgen)
Trastuzumab Breast cancer and gastric cancer Synthon Preparing for phase 3
follow-on biologic for Herceptin (Genentech). Synthon entered into a global license agreement with Amgen and Watson Pharmaceuticals.
BI 695501 Rheumatoid arthritis Boehringer Ingelheim
Phase 1 follow-on biologic for Humira (Abbott)
PrODuCT PIPELINE AND LEGISLATIvE TrENDSDruG PIPELINE

FIG. 66 | PIPELINE DruGS IN vArIOuS PhASES OF STuDy FOr KEy CANCEr TyPES
In 2012, non-small cell lung cancer (NSclc) overtook breast cancer in the clinical research field with close to 120 agents in either phase 2 or 3 trials. New agents, as well as new indications, for existing drugs are being developed across all indications and lines of therapy. There has also been an increase in the number of clinical trials for agents used to treat breast cancer and non-Hodgkin's lymphoma. Personalized medicine has become an important focus in
the development of these new drugs used to treat can-cer. Many of the targeted agents in the pipeline will require accompanying genetic tests to ensure the medicine is tai-lored to the patient's specific genetic makeup. This will result in greater efficacy with less toxicity to the patient. See Figure 66, Pipeline Drugs in Various Phases of Study for Key Cancer Types, and Figure 67, Selected Phase 3 Products by Key Cancer Type.
Adapted with permission from Oncology Business Review.Pipeline Online™. www.oncbiz.com. Accessed August 31, 2012.
PrODuCT PIPELINE AND LEGISLATIvE TrENDS
0 20 40 60 80 100 120
Hepatocellular carcinoma
Glioblastoma multiforme
Prostate
Melanoma
Pancreatic
Ovarian
Colorectal
Non-Hodgkin's lymphoma
Non-small cell lung cancer
Breast
Product Indications
Phase 2 Phase 3
81 30
78 38
41 17
32 23
31 18
30 8
27 15
25 18
24 6
17 12
48 DruG PIPELINE

49
Medical Pharmacy & Oncology Trend Report™
FIG. 67 | SELECTED PhASE 3 PrODuCTS by CANCEr TyPE
BReasT
PrODuCT NAME CLASS ArEA(S) OF STuDy
Afinitor mTOR inhibitor first-line metastatic breast cancer
Aromasin aromatase inhibitor breast cancer
arzoxifene selective estrogen receptor modulator (SERM)
breast cancer
Avastin antivascular endothelial growth factor (anti-VEGf) monoclonal antibody
adjuvant breast cancer (HER2+); adjuvant breast cancer (HER2-); second-line metastatic breast cancer; first-line metastatic breast cancer (HER2+); first-line metastatic breast cancer (HER2-)
denosumab antireceptor activator of nuclear factor kappa-B ligand (RANKl) antibody
adjuvant breast cancer
faslodex oestrogen receptor antagonist first-line metastatic breast cancer
Herceptin antibody drug conjugate adjuvant breast cancer (HER2+)
iniparib poly (ADP-ribose) polymerase (PARP)inhibitor
first-line metastatic breast cancer (triple negative)
Ixempra epothilone adjuvant breast cancer
Myocet nonpegylated liposomal doxorubicin first-line metastatic breast cancer (HER2+)
neratinib ErbB1 and ErbB2 inhibitor first-line metastatic breast cancer (HER2+)
NeuVax immunotherapy (peptide-based) adjuvant breast cancer (HER2+)
Orazol bisphosphonate (oral) adjuvant breast cancer
ramucirumab anti-VEGf monoclonal antibody second-line metastatic breast cancer
Stimuvax immunotherapy second-line metastatic breast cancer
Tavocept chemoprotective agent first-line metastatic breast cancer
Tovok epidermal growth factor receptor (EGfR)/HER2 inhibitor
first-line metastatic breast cancer
trastuzumab emtansine antibody drug conjugate second-line metastatic breast cancer (HER2+)
Tykerb ErbB2 and EGfR dual kinase inhibitor adjuvant breast cancer; first-line metastatic breast cancer
Votrient (+ Tykerb) multiple tyrosine kinase inhibitor inflammatory breast cancer
xeloda fluoropyrimidine (oral) adjuvant breast cancer
Zometa bisphosphonate breast cancer
PrODuCT PIPELINE AND LEGISLATIvE TrENDSDruG PIPELINE

PrODuCT PIPELINE AND LEGISLATIvE TrENDS
NON-sMall cell luNG caNceR (Nsclc)
PrODuCT NAME CLASS ArEA(S) OF STuDy
Abraxane microtubule inhibitor second-line metastatic NSclc
Alimta antimetabolite (a folic acid antagonist) NSclc
ARQ 197 (+ erlotinib) c-Met kinase inhibitor second-line metastatic NSclc
Avastin anti-VEGf monoclonal antibody adjuvant NSclc; NSclc with previously treated central nervous system metastases
custirsen clusterin inhibitor first-line metastatic NSclc
Erbitux anti-EGfR monoclonal antibody NSclc; second-line metastatic NSclc
erlotinib tablets HER1/EGfR tyrosine kinase inhibitor second-line metastatic NSclc
GSK1572932A immunotherapy NSclc
iniparib poly (ADP-ribose) polymerase inhibitor squamous NSclc
Iressa EGfR tyrosine kinase inhibitor NSclc
lucanix immunotherapy NSclc
MAGE-A3 antigen-specific cancer immunotherapeutic first-line metastatic NSclc
motesanib diphosphate anti-VEGf receptors 1, 2 and 3 (VEGfR 1-3) (oral) first-line metastatic NSclc
motesanib diphosphate VEGfR 1-3, platelet-derived growth factor receptor (PDGfR), c-Kit inhibitor (oral)
first-line metastatic NSclc
necitumumab EGfR inhibitor NSclc
Nexavar multiple tyrosine kinase inhibitor first-line metastatic NSclc
Opaxio microtubule inhibitor NSclc
Ostarine selective androgen receptor modulator (SARM) NSclc
Pf-00299804 pan-HER inhibitor first-line metastatic NSclc
ramucirumab anti-VEGfR-2 monoclonal antibody NSclc
Stimuvax immunotherapy NSclc
Sutent multiple tyrosine kinase inhibitor NSclc
talactoferrin dendritic cell-mediated immunotherapy (DcMI) third-line metastatic NSclc; first-line metastatic NSclc
Tarceva HER1/EGfR inhibitor adjuvant NSclc
Tavocept chemoprotective agent NSclc
Telcyta glutathione S-transferase P1-1 (GST P1-1) agonist NSclc (platinum resistant)
tivantinib (+ erlotinib) c-Met inhibitor second-line metastatic NSclc
Tovok EGfR/HER2 inhibitor NSclc
Vargatef multiple tyrosine kinase inhibitor (VEGfR; fibroblast growth factor receptor, fGfR; PDGfR)
NSclc
Zaltrap VEGf-A inhibitor second-line metastatic NSclc
50 DruG PIPELINE
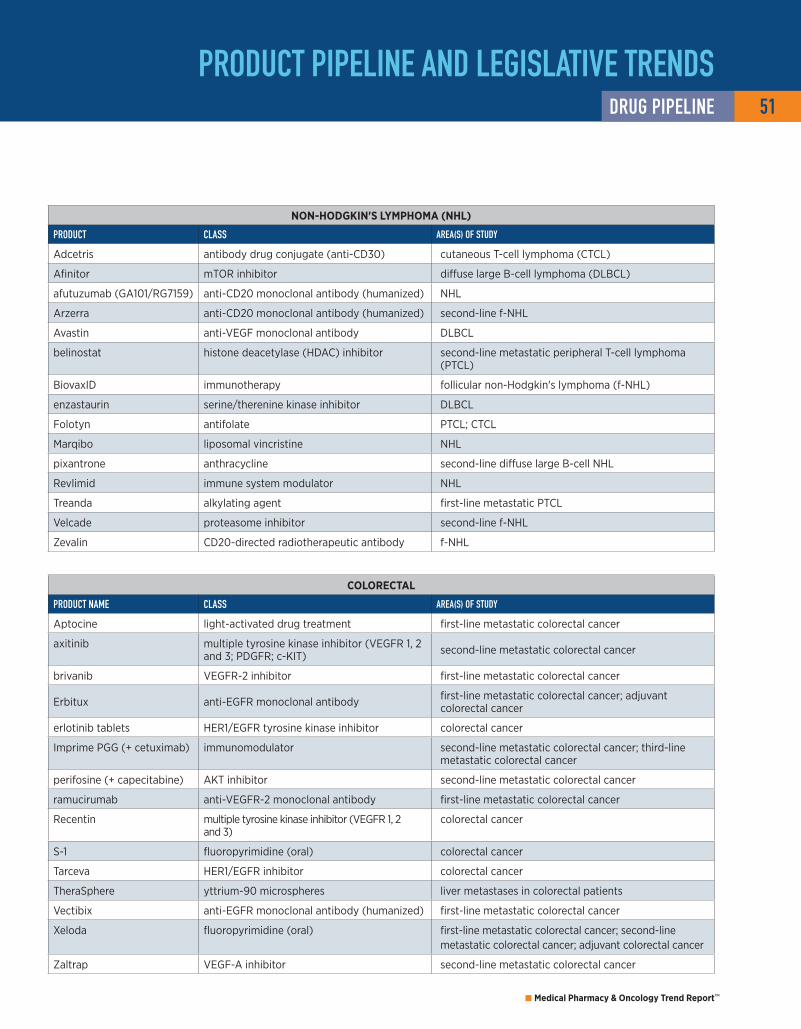
51
Medical Pharmacy & Oncology Trend Report™
PrODuCT PIPELINE AND LEGISLATIvE TrENDS
cOlORecTal
PrODuCT NAME CLASS ArEA(S) OF STuDy
Aptocine light-activated drug treatment first-line metastatic colorectal cancer
axitinib multiple tyrosine kinase inhibitor (VEGfR 1, 2 and 3; PDGfR; c-KIT) second-line metastatic colorectal cancer
brivanib VEGfR-2 inhibitor first-line metastatic colorectal cancer
Erbitux anti-EGfR monoclonal antibody first-line metastatic colorectal cancer; adjuvant colorectal cancer
erlotinib tablets HER1/EGfR tyrosine kinase inhibitor colorectal cancer
Imprime PGG (+ cetuximab) immunomodulator second-line metastatic colorectal cancer; third-line metastatic colorectal cancer
perifosine (+ capecitabine) AKT inhibitor second-line metastatic colorectal cancer
ramucirumab anti-VEGfR-2 monoclonal antibody first-line metastatic colorectal cancer
Recentin multiple tyrosine kinase inhibitor (VEGfR 1, 2 and 3)
colorectal cancer
S-1 fluoropyrimidine (oral) colorectal cancer
Tarceva HER1/EGfR inhibitor colorectal cancer
TheraSphere yttrium-90 microspheres liver metastases in colorectal patients
Vectibix anti-EGfR monoclonal antibody (humanized) first-line metastatic colorectal cancer
xeloda fluoropyrimidine (oral) first-line metastatic colorectal cancer; second-line metastatic colorectal cancer; adjuvant colorectal cancer
Zaltrap VEGf-A inhibitor second-line metastatic colorectal cancer
NON-HOdGkiN's lyMPHOMa (NHl)
PrODuCT CLASS ArEA(S) OF STuDy
Adcetris antibody drug conjugate (anti-cD30) cutaneous T-cell lymphoma (cTcl)
Afinitor mTOR inhibitor diffuse large B-cell lymphoma (DlBcl)
afutuzumab (GA101/RG7159) anti-cD20 monoclonal antibody (humanized) NHl
Arzerra anti-cD20 monoclonal antibody (humanized) second-line f-NHl
Avastin anti-VEGf monoclonal antibody DlBcl
belinostat histone deacetylase (HDAc) inhibitor second-line metastatic peripheral T-cell lymphoma (PTcl)
BiovaxID immunotherapy follicular non-Hodgkin's lymphoma (f-NHl)
enzastaurin serine/therenine kinase inhibitor DlBcl
folotyn antifolate PTcl; cTcl
Marqibo liposomal vincristine NHl
pixantrone anthracycline second-line diffuse large B-cell NHl
Revlimid immune system modulator NHl
Treanda alkylating agent first-line metastatic PTcl
Velcade proteasome inhibitor second-line f-NHl
Zevalin cD20-directed radiotherapeutic antibody f-NHl
DruG PIPELINE

PrODuCT PIPELINE AND LEGISLATIvE TrENDS
OVaRiaN
PrODuCT CLASS ArEA(S) OF STuDy
alkeran alkylating agent ovarian cancer
AMG 386 (paclitaxel) fc-peptide fusion protein targeting angiopoietins (peptibody)
second-line metastatic ovarian cancer
Avastin anti-VEGf monoclonal antibody first-line metastatic ovarian cancer; second-line metastatic platinum-sensitive ovarian cancer
erlotinib tablets HER1/EGfR tyrosine kinase inhibitor ovarian cancer
farletuzumab IgG1 monoclonal antibody (humanized) second-line metastatic ovarian cancer
Hycamtin topoisomerase inhibitor first-line metastatic ovarian cancer
iniparib PARP inhibitor platinum-sensitive and platinum-resistant ovarian cancer
Karenitecin highly lipophilic camptothecin ovarian cancer
Opaxio microtubule inhibitor ovarian cancer
patupilone epothilone ovarian cancer
phenoxodiol multiple signal transduction regulator ovarian cancer
Tarceva HER1/EGfR inhibitor ovarian cancer
Vargatef multiple tyrosine kinase inhibitor (VEGfR, fGfR, PDGfR)
ovarian cancer
yondelis marine-derived antitumoral agent second-line metastatic ovarian cancer
PaNcReaTic
PrODuCT CLASS ArEA(S) OF STuDy
ganitumab insulin-like growth factor-1 receptor (IGf-1R) inhibitor (monoclonal antibody)
pancreatic cancer
larotaxel taxane (semi-synthetic) pancreatic cancer
mastinib multiple tyrosine kinase inhibitor pancreatic cancer
PN401 (formerly vistonuridine) uridine prodrug pancreatic cancer
S-1 fluoropyrimidine (oral) pancreatic cancer
MelaNOMa
PrODuCT CLASS ArEA(S) OF STuDy
Abraxane microtubule inhibitor first-line metastatic melanoma
Allovectin immunotherapy first-line metastatic melanoma
BRf113683 BRAf inhibitor first-line metastatic melanoma
Delcath system drug delivery platform first-line metastatic melanoma in the liver
GSK1120212 MEK inhibitor first-line metastatic melanoma
GSK2118436 BRAf inhibitor first-line metastatic melanoma
MAGE-A3 antigen-specific cancer immunotherapeutic first-line metastatic melanoma
Nexavar multiple tyrosine kinase inhibitor melanoma
Oncophage immunotherapy first-line metastatic melanoma
Pegintron PEG recombinant alpha-2b interferon melanoma
talimogene laherparepvec (formerly OncoVEx GM-cSf)
modified herpes-simplex 1 virus injected directly into tumor
first-line metastatic melanoma
yervoy anti-cTlA4 monoclonal antibody (humanized) adjuvant melanoma; second-line metastatic melanoma
Zedaxin immune system modulator melanoma
52 DruG PIPELINE

53
Medical Pharmacy & Oncology Trend Report™
PrODuCT PIPELINE AND LEGISLATIvE TrENDS
GliOBlasTOMa MulTiFORMe (GBM)
PrODuCT NAME CLASS ArEA(S) OF STuDy
Avastin anti-VEGf monoclonal antibody GBM; second-line metastatic GBM
cintredekin besudotox Il-13 interleukin-13 (Il-13) and PE38 recombinant protein
GBM
NovoTTf-100A System tumor treating fields therapy first-line metastatic GBM
Recentin multiple tyrosine kinase inhibitor (VEGf 1, 2 and 3)
second-line metastatic GBM
Temodar alkylating agent first-line metastatic GBM
saRcOMa
PrODuCT NAME CLASS ArEA(S) OF STuDy
AVE8062 vascular disrupting agent sarcoma
Mepact macrophage activator osteosarcoma
ridaforolimus mTOR inhibitor soft tissue or bone sarcoma
TH-30 hypoxia-activated prodrug first-line metastatic soft tissue sarcoma
yondelis marine-derived antitumoral agent second- and third-line metastatic soft tissue sarcoma; first-line metastatic soft tissue sarcoma
Zymafos ifosfamide metabolite first-line metastatic soft tissue sarcoma
PROsTaTe
PrODuCT NAME CLASS ArEA(S) OF STuDy
Alpharadin alpha-emitting radiopharmaceutical treatment of bone metastases in hormone refractory prostate cancer (HRPc)
Avastin anti-VEGf monoclonal antibody HRPc
custirsen clusterin inhibitor first-line metastatic castration-resistant prostatecancer (cRPc)
custirsen (+ cabazitaxel) clusterin inhibitor second-line metastatic cRPc
DcVax immunotherapy prostate cancer
enzalutamide (formerly MDV3100) oral androgen receptor antagonist first-line metastatic prostate cancer
Jevtana taxane first-line HRPc
MDV3100 SARM HRPc
OGx-427 Hsp27 inhibitor first-line metastatic prostate cancer
orteronel nonsteroidal androgen synthesis inhibitor (oral) first-line metastatic cRPc
phenoxodiol multiple signal transduction regulator prostate cancer
Revlimid immune system modulator prostate cancer
Sutent multiple tyrosine kinase inhibitor HRPc
Zaltrap VEGf-A inhibitor first-line metastatic HRPc
Zytiga inhibitor of the steroidal enzyme 17 alpha-hydroxylase/c17,20 lyase (oral)
first-line metastatic HRPc
DruG PIPELINE
PrODuCT PIPELINE AND LEGISLATIvE TrENDS 54 KEy LEGISLATIvE OuTCOMES
2012 ONCOLOGy POLICy uPDATESlegislative, regulatory and marketplace changes continue to affect oncology care and practice management. At the eleventh hour, congress once again prevented the double-digit sustainable growth rate (SGR) reductions. The Ameri-can Tax Relief Act (ATRA) held the 2012 conversion factor the same in 2013 and for the short term avoided the 2 percent across-the-board cut that would affect physician payments required by sequestration. congress must act to prevent the 2 percent across-the-board cuts in March 2013.
As in years past, congress avoided the significant physician fee schedule cuts for the short term, one year, but did noth-ing to address the longer term problems with the sustain-able growth rate formula. However, some congressional members continue to pursue a longer term fix.
While states scramble to make critical decisions related to health care reform, federal issues, such as the physi-cian payment fix and sequestration, further the uncertainty under which oncologists must practice. Uncertainty will continue throughout 2013 and 2014 as states prepare for health care reform and/or expand state Medicaid eligibil-ity. The following is a review of significant policy and mar-ketplace trends facing oncology providers today, including health care reform, molecular diagnostics and biosimilars, and experimental payment models.
hEALTh CArE rEFOrM STATuS: 2012Supreme Court DeCiSionOn June 28, 2012, the Supreme court upheld the Afford-able care Act (AcA), with the exception of the mandated Medicaid expansion. The court found that 1) the individual mandate is constitutional under congress’s taxing author-ity and 2) Medicaid expansion is constitutional only if states are not penalized or do not have existing Medicaid funding threatened if they choose not to comply with the expan-sion requirements. This converts the mandated health care reform Medicaid expansion (to 133 percent of the fed-eral poverty level [fPl] for all individuals, including able- bodied adults) to an optional state expansion.
Since the court generally upheld the AcA, attention turns to the states for key decisions regarding Medicaid expan-sion and implementation of the health benefit exchanges. late in 2012, the Department of Health and Human Ser-vices finally issued proposed rules related to the essen-tial health benefits and other operating details for the health exchanges. final regulations are expected early in 2013. As open enrollment in October of 2013 draws near, states are scrambling to implement plans for health ben-efit exchanges. for the initial years of the state exchanges, more than half of states are anticipated to rely on feder-ally run state health exchanges. While the exchanges will be run federally, the benchmarks which guide the essential health benefits in the state will be based on state-selected benchmarks.
meDiCaiD expanSionIn August 2012, HHS announced that there is no dead-line for states to make a decision regarding the Medicaid expansion — states may expand Medicaid eligibility at any time. further, states may drop the expansion population at any time, providing flexibility for states and uncertainty for providers.
late in 2012, HHS clarified the statute does not allow for the enhanced federal Medical Assistance Percentage (fMAP), not offered to states for the newly eligible population, will not be available if a state expands its Medicaid program to a level below the 133 percent threshold. Depending on the federal policies and state action, the end result could be a scenario in which a group of the most vulnerable patients could fall in a gap between state Medicaid eligibility and federal subsidies through the exchange.
Governors from conservative Southern states (florida, lou-isiana, Mississippi, South carolina and Texas) have publicly announced they do not intend to participate in the expan-sion. However, these announcements are largely political in nature. Medicaid expansion will likely be debated in state legislatures throughout the end of 2012 and 2013.
Key Legislative Outcomes – 2012
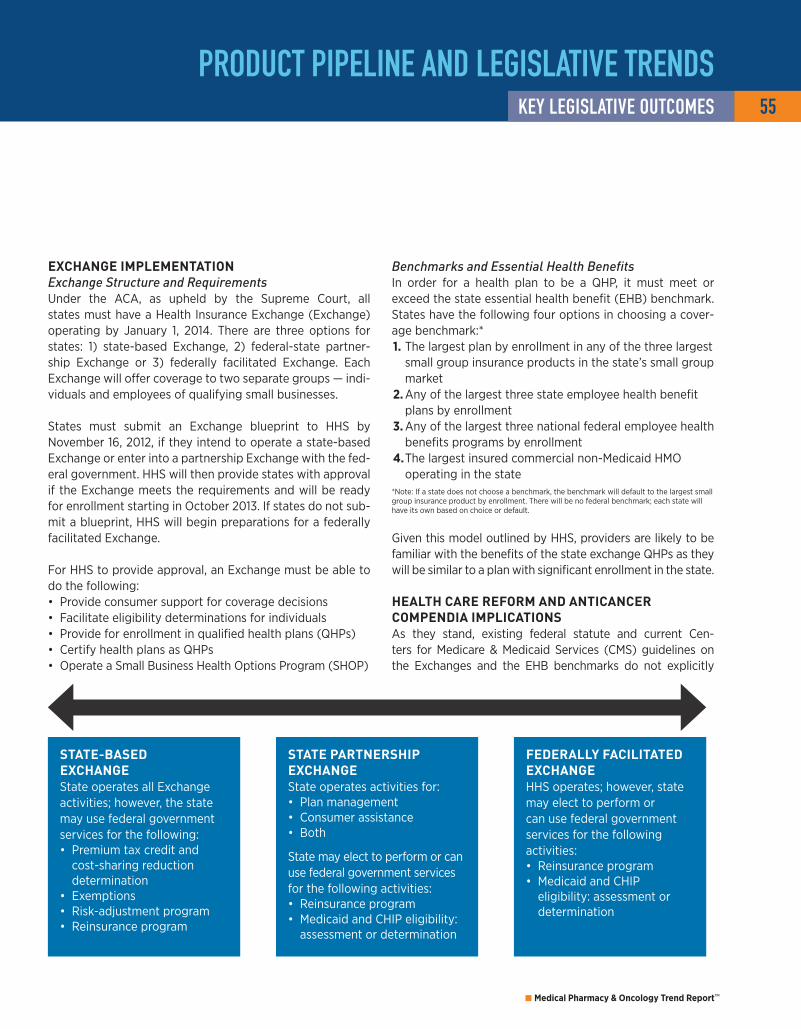
55
Medical Pharmacy & Oncology Trend Report™
PrODuCT PIPELINE AND LEGISLATIvE TrENDSKEy LEGISLATIvE OuTCOMES
exChange implementationExchange Structure and RequirementsUnder the AcA, as upheld by the Supreme court, all states must have a Health Insurance Exchange (Exchange) operating by January 1, 2014. There are three options for states: 1) state-based Exchange, 2) federal-state partner-ship Exchange or 3) federally facilitated Exchange. Each Exchange will offer coverage to two separate groups — indi-viduals and employees of qualifying small businesses.
States must submit an Exchange blueprint to HHS by November 16, 2012, if they intend to operate a state-based Exchange or enter into a partnership Exchange with the fed-eral government. HHS will then provide states with approval if the Exchange meets the requirements and will be ready for enrollment starting in October 2013. If states do not sub-mit a blueprint, HHS will begin preparations for a federally facilitated Exchange.
for HHS to provide approval, an Exchange must be able to do the following: • Provide consumer support for coverage decisions • facilitate eligibility determinations for individuals • Provide for enrollment in qualified health plans (QHPs) • certify health plans as QHPs • Operate a Small Business Health Options Program (SHOP)
Benchmarks and Essential Health BenefitsIn order for a health plan to be a QHP, it must meet or exceed the state essential health benefit (EHB) benchmark. States have the following four options in choosing a cover-age benchmark:*1. The largest plan by enrollment in any of the three largest
small group insurance products in the state’s small group market
2. Any of the largest three state employee health benefit plans by enrollment
3. Any of the largest three national federal employee health benefits programs by enrollment
4. The largest insured commercial non-Medicaid HMO operating in the state
*Note: If a state does not choose a benchmark, the benchmark will default to the largest small group insurance product by enrollment. There will be no federal benchmark; each state will have its own based on choice or default.
Given this model outlined by HHS, providers are likely to be familiar with the benefits of the state exchange QHPs as they will be similar to a plan with significant enrollment in the state.
health Care reform anD antiCanCer CompenDia impliCationSAs they stand, existing federal statute and current cen-ters for Medicare & Medicaid Services (cMS) guidelines on the Exchanges and the EHB benchmarks do not explicitly
State-baSeD exChangeState operates all Exchange activities; however, the state may use federal government services for the following: • Premium tax credit and cost-sharing reduction determination
• Exemptions • Risk-adjustment program • Reinsurance program
feDerally faCilitateD exChangeHHS operates; however, state may elect to perform or can use federal government services for the following activities: • Reinsurance program • Medicaid and cHIP eligibility: assessment or determination
State partnerShip exChangeState operates activities for: • Plan management • consumer assistance • Both
State may elect to perform or can use federal government services for the following activities: • Reinsurance program • Medicaid and cHIP eligibility: assessment or determination

PrODuCT PIPELINE AND LEGISLATIvE TrENDS 56 KEy LEGISLATIvE OuTCOMES
address compendia protections in oncology. The lack of clarity regarding compendia coverage could put access to compendia-listed oncology care at risk for the health exchange benefit population.
Federal Medicare/Medicaid compendia standard: At this time, no policy at the federal level, as currently defined, compels the plans in the Exchanges to apply the Medicare/Medicaid anticancer compendia coverage standards to the EHB package in the qualified health plans. It is unclear at this time the extent to which cMS has the authority to require the state exchange plans to extend coverage for compendia-listed therapeutics if they are not included in the selected state benchmark plan.
state Mandates for anticancer compendia coverage: States operating a state-based Exchange could follow two paths to cover compendia-listed oncolytics. The first and most expedient would be for the state to select a bench-mark plan that currently includes mandated coverage for compendia-listed anticancer uses. cMS could further address this issue in the context of state mandates in sub-sequent guidance.
The second path would be for the state legislature to apply existing or new compendia language to the state bench-mark. State legislatures could apply the same language to state health benefit exchange laws during the upcoming legislative session in January 2013. Through this route, the legislative mandates may not apply in the initial 2014/2015 plan years based on the existing HHS direction regarding state mandates. However, it is unclear whether compen-dia coverage considerations are considered a mandate in this sense. further clarification regarding state mandates is expected in subsequent cMS guidance late in 2012 or 2013.
NEw FrONTIErS: MOLECuLAr DIAGNOSTICS AND bIOSIMILArSevolution of payor poliCieS in moleCular DiagnoStiCSGiven the continued advancements in molecular diagnos-tics and the explosion of new targeted therapeutics, pol-icy making related to molecular diagnostics continues to evolve. companion diagnostics are molecular laboratory tests that typically screen certain patient types as candi-dates for targeted therapeutics. Increased knowledge of the human genome is one main reason for the growth in this area. As knowledge of the human genome is translated into clinical applications — identifying patients who have a clinically significant genetic marker or mutation — ther-
apy can be effectively targeted, resulting in more efficient treatment practices and an increase in the significance of molecular diagnostics.
Use of genetic/genomic testing has rapidly increased in recent years, and consequently, payors and providers have begun to question the coding, coverage and reimburse-ment of genetic testing, as well as the overall management of molecular diagnostics and the related companion ther-apeutics. Over the past two years, the American Medical Association (AMA) created a new section of current proce-dural terminology (cPT) codes to better identify molecular diagnostic tests. The AMA will implement the new specific code section in 2013, but it is unclear how reimbursement of molecular diagnostics will change. Due to the coding changes, payors, including cMS, have begun to reevaluate how they cover and pay for these tests.
further clarification of the cMS plan regarding molecu-lar diagnostics is expected toward the end of 2012. The decisions by cMS regarding these tests could affect provider reimbursement as well as patient coinsurance obligations. furthermore, as these tests are more clearly identified by payors, payors will likely begin to specify more management of the molecular testing, as well as the related therapeutics.
In 2013, providers should look for more payor manage-ment regarding molecular diagnostics. likewise, treatment guidelines and recommendations regarding molecular test-ing are expected in 2013.
bioSimilarS poliCy DevelopmentThe Biologics Price competition and Innovation Act of 2009 amended the Public Health Service Act to create an abbre-viated licensure pathway for products that are biosimilar to a biological reference product licensed by the fDA. Bio-similars are also referred to as follow-on biologics. In early 2012, the fDA released three draft guidance documents on the regulation of biosimilars and the interchangeability of follow-on biologics. The guidance documents begin to define terms such as “biosimilar” and “interchangeabil-ity.” These terms will be important as stakeholders look to develop policies for management of follow-on biolog-ics and their reference products. To date, the fDA has not finalized these draft guidance documents.
On a related note, cMS does not make distinctions between biosimilars and biosimilars that are interchangeable in its policies to date. cMS policies to date indicate that the pay-

57
Medical Pharmacy & Oncology Trend Report™
PrODuCT PIPELINE AND LEGISLATIvE TrENDSKEy LEGISLATIvE OuTCOMES
ment amount for physician-administered biosimilar prod-ucts will be determined based on the average sales price (ASP) of all the national drug codes (NDcs) assigned to the Healthcare common Procedure coding System (HcPcS) code for the reference product (original product) and the new biosimilar product, regardless of interchangeability.
MArKETPLACE: ExPErIMENTAL PAyMENT SySTEMScommercial payors, most notably United Health care (UHc) in oncology, have been experimenting for a number of years with payment reform concepts to manage costs such as gain sharing, risk sharing, shared savings, bundled payments, global capitation and newer arrangements like care coordina-tion through medical homes. In 2012, under authority granted through the Affordable care Act, cMS has gotten into the game as well. Such initiatives are directed through the cMS center for Medicare & Medicaid Innovation (cMMI).
cMMI is engaged in a number of different types of pay-ment reform programs and demonstrations, including, but not limited to, accountable care organizations (AcOs) with shared savings, bundled payments currently focusing on post-acute care and other financial alignment initiatives (e.g., state demonstrations to integrate care for the dual eligible population), care coordination and Medicaid incen-tives for the prevention of chronic diseases. Under each type of program or demonstration, there are various stakehold-ers engaged in ongoing activities to improve quality of care and health outcomes, while controlling increasing costs. Among the numerous cMMI demonstrations, pilots and grants, cMMI has awarded only one oncology-related grant. While Medicare has not focused on oncology initially, cMS is sure to expand in oncology in the coming years.
The initial oncology grant was awarded for a national oncol-ogy medical home pilot project, the first of many such projects in Medicare, and continued experimentation com-mercially. Payment experimentation across the health care system and specifically in oncology continues to evolve and move beyond chemotherapeutics. In August 2012, 21st century Oncology announced a radiation oncology bundled payment agreement with one of the nation’s largest oncol-ogy group practices and Humana Inc., one of the nation’s largest payors.
onCology meDiCal home grantcMMI awarded a $19.7 million grant to a group of oncology practices organized as Innovative Oncology Business Solu-tions. The practices are some of the largest in the country, including florida Infusion, Tennessee Oncology and prac-
tices in Georgia, Maine, New Mexico and Pennsylvania. The goal of the project is to test a model of care delivery focused on the medical home, or gatekeeper, for newly diagnosed or relapsed Medicare and Medicaid beneficiaries and commer-cially insured patients with breast, lung or colorectal cancer. The idea of the medical home has been studied by John Sprandio in Pennsylvania and modeled in demonstration in commercial plans, such as Blue cross and Blue Shield of Michigan and United. The goal is to reduce unnecessary and avoidable hospitalizations and emergency room visits, seek a reduction in unnecessary diagnostic or radiation/imaging testing, and provide patient education on treatment proto-cols, treatment plan choices and end of life. Interestingly, the project is seen as a business driver in that the demonstration aims to hire 115 new positions across the seven practices.
raDiation onCology DemonStrationRecently, 21st century Oncology, a florida-based radia-tion group, reached an agreement with Humana Inc. to provide the first bundled payment methodology for radia-tion oncology treatments. The contract covers more than 130 employed radiation oncologists in 16 states and uses the same methodology the Radiation Therapy Alliance is proposing to cMS. Bundled payments will be used for 13 cancer types, including prostate, breast and lung, with an ultimate goal of having episode-based payments in place for all major cancer types. The bundles are based on diag-nosis codes for IcD-9 (International Statistical classification of Diseases and Related Health Problems), and the payment encompasses patient consultation, computed tomography scans and other imaging needed to plan the patient’s radia-tion therapy, radiation dosimetry, treatment delivery and follow-up for 90 days.
As one of the nation’s leading authorities in the manage-ment of specialty pharmaceuticals, including high-cost oral and infused/injected anticancer therapies, Magellan Pharmacy Solution has been closely following these dem-onstrations, as well as several high-profile commercial path-way projects, including those focused on the bundling of cancer care products and services. All these initiatives occur at a time when AcOs continue to evolve with public and private payors alike. All the payment experimentation may lead to significant changes in the payment and structure of payor-provider relationships across payment settings. This payor experimentation is context for Medicare debates set to begin following the November elections, given the physi-cian fee fix and sequestration; some stakeholders are argu-ing that bigger changes than a temporary “physician fix” to the Medicare physician-fee schedule is needed.

TrEND rEPOrT 2012 58 GLOSSAry
AcA . . . . . . . . . . . . . . . . . . . . . . . . . . . . . . . . . . .Affordable care Act
AcO . . . . . . . . . . . . . . . . . . . . . . . . . accountable care organization
AMA . . . . . . . . . . . . . . . . . . . . . . . . . American Medical Association
ASP . . . . . . . . . . . . . . . . . . . . . . . . . . . . . . . . . . . . average sales price
AWP . . . . . . . . . . . . . . . . . . . . . . . . . . . . . . . average wholesale price
BcA . . . . . . . . . . . . . . . . . . . . . . . . . . . . . . . . . . . . . . . . .breast cancer
BPcI Act . . . . . Biologics Price competition and Innovation Act
BRcA . . . . . . . . . . . . . . . . . . . . . breast cancer susceptibility gene
BRM . . . . . . . . . . . . . . . . . . . . . . . . . . . . biologic response modifier
cA . . . . . . . . . . . . . . . . . . . . . . . . . . . . . . . . . . . . . . . . . . . . . . . . . cancer
cHIP . . . . . . . . . . . . . . . . . . . children's Health Insurance Program
cINV . . . . . . . . . . . chemotherapy-induced nausea and vomiting
cMMI . . . . . . . . . . . . center for Medicare & Medicaid Innovation
cMS . . . . . . . . . . . . . . centers for Medicare & Medicaid Services
cOA . . . . . . . . . . . . . . . . . . . . . . . . .community Oncology Alliance
cPT . . . . . . . . . . . . . . . . . . . . . . . . . current procedural terminology
cRc . . . . . . . . . . . . . . . . . . . . . . . . . . . . . . . . . . . . . colorectal cancer
cRPc . . . . . . . . . . . . . . . . . . . . . castrate-resistant prostate cancer
cSf . . . . . . . . . . . . . . . . . . . . . . . . . . . . . . .colony-stimulating factor
cTcl . . . . . . . . . . . . . . . . . . . . . . . . . . . cutaneous T-cell lymphoma
cTlA4 . . . . . . . . . . . . . . . . . . . .cytotoxic T-lymphocyte antigen 4
DcMI . . . . . . . . . . . . . . . dendritic cell mediated immunotherapy
DlBcl . . . . . . . . . . . . . . . . . . . . . . . diffuse large B-cell lymphoma
EGfR . . . . . . . . . . . . . . . . . . . . . epidermal growth factor receptor
EHB . . . . . . . . . . . . . . . . . . . . . . . . . . . . . . . essential health benefit
ESA . . . . . . . . . . . . . . . . . . . . . . . erythropoiesis-stimulating agent
ESRD . . . . . . . . . . . . . . . . . . . . . . . . . . . . . . end-stage renal disease
fDA . . . . . . . . . . . . . . . . . . . . U.S. food and Drug Administration
fGfR . . . . . . . . . . . . . . . . . . . . . fibroblast growth factor receptor
fMAP . . . . . . . . . . . . . . . . federal Medical Assistance Percentage
f-NHl . . . . . . . . . . . . . . . . . . . follicular non-Hodgkin's lymphoma
fPl . . . . . . . . . . . . . . . . . . . . . . . . . . . . . . . . . . federal Poverty level
GBM . . . . . . . . . . . . . . . . . . . . . . . . . . . . . . glioblastoma multiforme
G-cSf . . . . . . . . . . . . . . . . granulocyte colony-stimulating agent
or colony-stimulating factor
GM-cSf . . . . . . . . . . . . . . . . . . . . . . . . . . granulocyte-macrophage
colony-stimulating factor
GST . . . . . . . . . . . . . . . . . . . . . . . . . . . . . . glutathione S-transferase
HcPcS . . . . . . . Healthcare common Procedure coding System
HDAc . . . . . . . . . . . . . . . . . . . . . . . . . . . . . . . . . . histone deacetylase
HEc . . . . . . . . . . . . . . . . . . . . . .highly emetogenic chemotherapy
HEDIS . . . . . Healthcare Effectiveness Data and Information Set
HER . . . . . . . . . . . . . . . . . . . . . . . . . . . . . . . . . . human EGf receptor
HHS . . . . . . . . . . . . . Department of Health and Human Services
HMO . . . . . . . . . . . . . . . . . . . . . . health maintenance organization
HRPc . . . . . . . . . . . . . . . . . . . hormone refractory prostate cancer
IcD . . . . . . . . . . . . . . . . . . International classification of Diseases
IGf-1R . . . . . . . . . . . . . . . . . . insulin-like growth factor-1 receptor
Il-13 . . . . . . . . . . . . . . . . . . . . . . . . . . . . . . . . . . . . . . . . . interleukin-13
IV . . . . . . . . . . . . . . . . . . . . . . . . . . . . . . . . . . . . . . . . . . . . . intravenous
IVIG. . . . . . . . . . . . . . . . . . . . . . . . . . . intravenous immune globulin
KRAS . . . . . . Kirsten RNA associated rat sarcoma 2 virus gene
lEc . . . . . . . . . . . . . . . . . . . . . . . . . low emetogenic chemotherapy
lOB. . . . . . . . . . . . . . . . . . . . . . . . . . . . . . . . . . . . . . . lines of business
mBc . . . . . . . . . . . . . . . . . . . . . . . . . . . . . . metastatic breast cancer
MEc . . . . . . . . . . . . . . . . . . moderate emetogenic chemotherapy
Glossary

59
Medical Pharmacy & Oncology Trend Report™
TrEND rEPOrT 2012GLOSSAry
MMA . . . . . . . . . . . . . . . . . . . . . . . . . . . Medicare Modernization Act
NccN . . . . . . . . . . . . . National comprehensive cancer Network
NDc . . . . . . . . . . . . . . . . . . . . . . . . . . . . . . . . . . . national drug code
NHl . . . . . . . . . . . . . . . . . . . . . . . . . . . . . non-Hodgkin's lymphoma
NSclc . . . . . . . . . . . . . . . . . . . . . . . . . . . non-small cell lung cancer
PA . . . . . . . . . . . . . . . . . . . . . . . . . . . . . . . . . . . . . . prior authorization
PARP . . . . . . . . . . . . . . . . . . . . . . . .poly (ADP-ribose) polymerase
PBM . . . . . . . . . . . . . . . . . . . . . . . . . . . . pharmacy benefit manager
PDGfR . . . . . . . . . . . . . . platelet-derived growth factor receptor
PPO . . . . . . . . . . . . . . . . . . . . . . . .preferred provider organization
PSA . . . . . . . . . . . . . . . . . . . . . . . . . . . . . . . prostate-specific antigen
PTcl . . . . . . . . . . . . . . . . . . . . . . . . . . . peripheral T-cell lymphoma
QHP . . . . . . . . . . . . . . . . . . . . . . . . . . . . . . . . . qualified health plans
RANKl . . . receptor activator of nuclear factor kappa-B ligand
SARM . . . . . . . . . . . . . . . selective androgen receptor modulator
SERM . . . . . . . . . . . . . . . . selective estrogen receptor modulator
SGR . . . . . . . . . . . . . . . . . . . . . . . . . . . . . . . sustainable growth rate
SHOP . . . . . . . . . . . . . . . . small business health options program
SOS . . . . . . . . . . . . . . . . . . . . . . . . . . . . . . . . . . . . . . . . . site of service
SPP . . . . . . . . . . . . . . . . . . . . . . . . . . . specialty pharmacy provider
UM . . . . . . . . . . . . . . . . . . . . . . . . . . . . . . . . utilization management
VEGf . . . . . . . . . . . . . . . . . . . . vascular endothelial growth factor
VfS . . . . . . . . . . . . . . . . . . . . . . . . . . . . . . . . . . variable fee schedule
WAc . . . . . . . . . . . . . . . . . . . . . . . . . . wholesale acquisition price

PRSRT STD US Postage
PAID Long Prairie MN
Permit # 871
ICORE Healthcare
6870 Shadowridge Dr., Suite 111
Orlando, FL 32812
2012 ThIrD EDITION www.ICOrEhEALThCArE.COM/TrENDS© 2012. Magellan Pharmacy Solutions. Printed in the U.S.A.
10370M
A Benchmark for Medical PharmacyMAGELLAN PhArMACy SOLuTIONS' MEDICAL PhArMACy & ONCOLOGy TrEND rEPOrT™