medical complexity and complications of patients with traumatically induced doc
TRANSCRIPT
Medical Complexity and Complications of Patients with
Traumatically Induced Disorders of Consciousness
Brian D. Greenwald, MD [email protected]
Medical Director Center for Head Injuries Associate Medical Director
JFK Johnson Rehabilitation Institute Clinical Associate Professor
Rutgers Robert Wood Johnson Medical School
Overview
! Definition ! Outcomes ! Assessment ! Medical Complications ! Mortality

Disorders of Consciousness

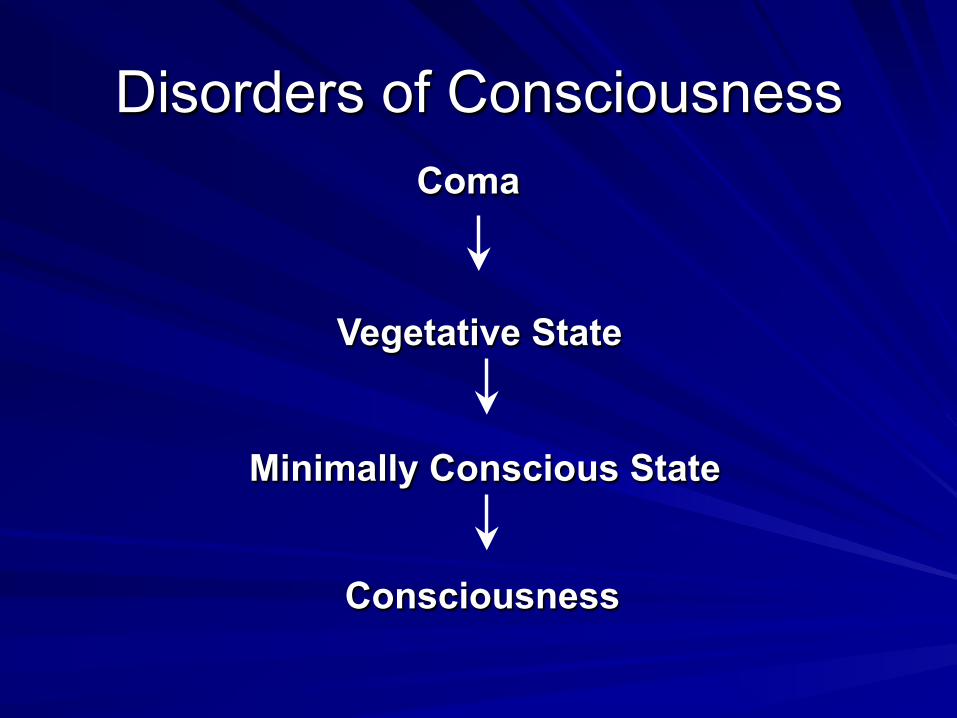
Disorders of Consciousness Coma
Vegetative State
Minimally Conscious State
Consciousness
Disorders of Consciousness
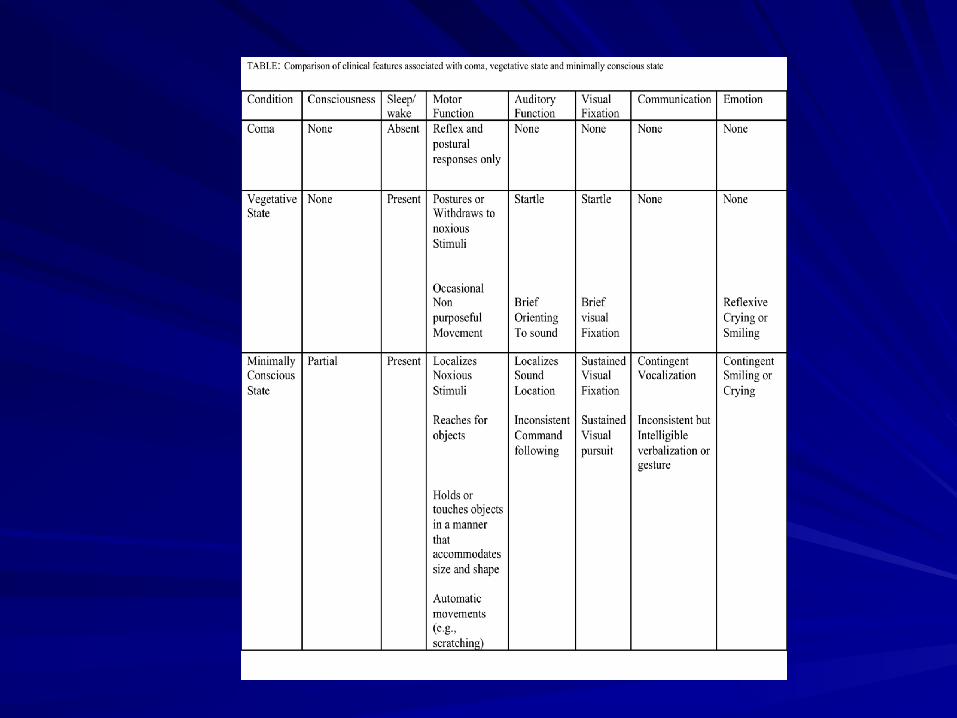
§ Coma – No eye opening – No command following – No recognizable words – No intentional movement – Absence of paralytic agents – Coma results from severe, diffuse dysfunction
of the cerebral cortices and/or underlying white matter.
Disorders of Consciousness
§ Vegetative State/ Unresponsive Wakefulness Syndrome – evidence of functional restoration of the
reticular system (e.g. eye opening/wakefulness)
– No evidence of awareness of self or environment
– No purposeful or voluntary behavior that is sustained or reproducible to stimuli
– May see non-voluntary movement – No evidence of language comprehension or
expression
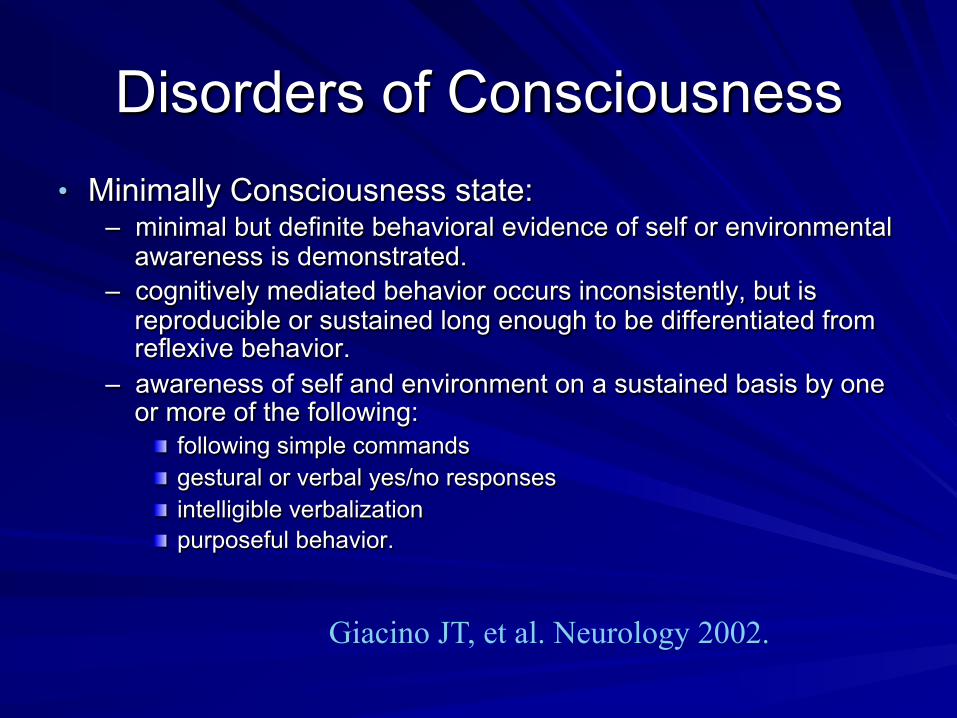
Disorders of Consciousness • Minimally Consciousness state:
– minimal but definite behavioral evidence of self or environmental awareness is demonstrated.
– cognitively mediated behavior occurs inconsistently, but is reproducible or sustained long enough to be differentiated from reflexive behavior.
– awareness of self and environment on a sustained basis by one or more of the following: ! following simple commands ! gestural or verbal yes/no responses ! intelligible verbalization ! purposeful behavior.
Giacino JT, et al. Neurology 2002.

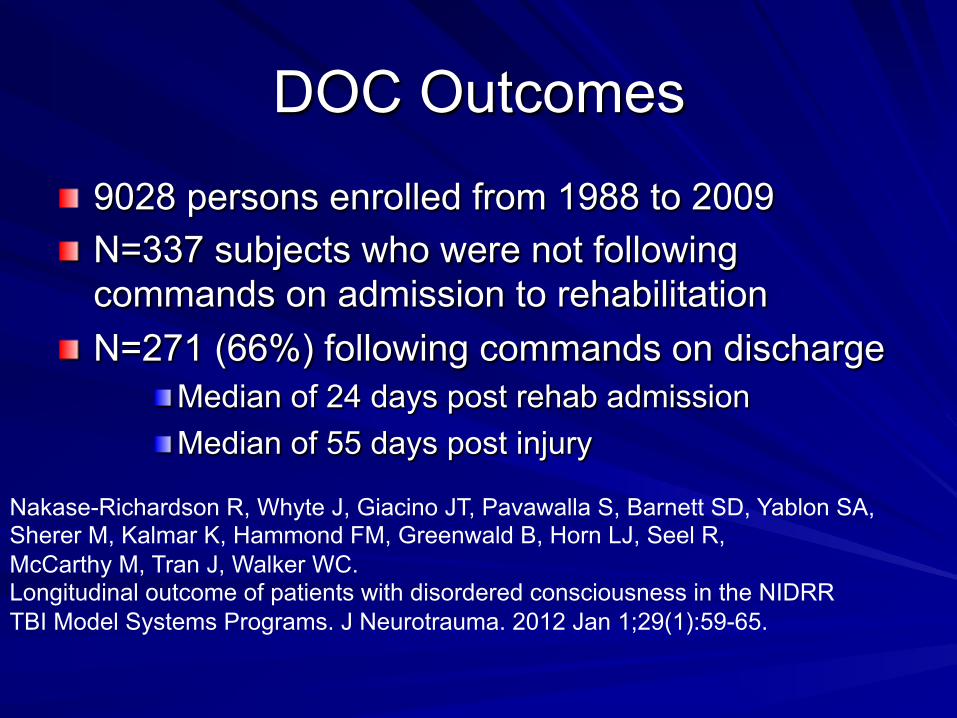
DOC Outcomes ! 9028 persons enrolled from 1988 to 2009 ! N=337 subjects who were not following
commands on admission to rehabilitation ! N=271 (66%) following commands on discharge
! Median of 24 days post rehab admission ! Median of 55 days post injury
Nakase-Richardson R, Whyte J, Giacino JT, Pavawalla S, Barnett SD, Yablon SA, Sherer M, Kalmar K, Hammond FM, Greenwald B, Horn LJ, Seel R, McCarthy M, Tran J, Walker WC. Longitudinal outcome of patients with disordered consciousness in the NIDRR TBI Model Systems Programs. J Neurotrauma. 2012 Jan 1;29(1):59-65.

DOC Outcomes
! Ninety-one (23%) of these subjects also emerged from PTA during inpatient rehabilitation
! Of the 128 who did not regain ability to
follow commands during acute rehabilitation 76% had at 5-year follow-up

DOC Outcomes
! Of 337 with at least 1 follow-up visit, 28 (8%) had died by 2.1 years (mean) from discharge.
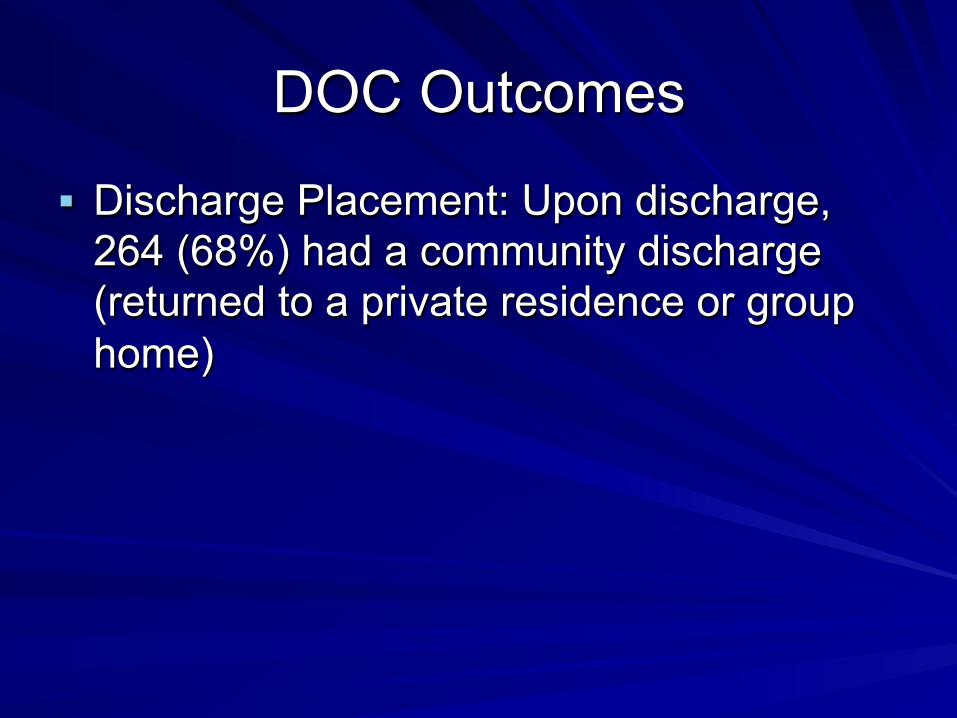
DOC Outcomes
§ Discharge Placement: Upon discharge, 264 (68%) had a community discharge (returned to a private residence or group home)

DOC Outcomes
• At 1 or more of the follow-up intervals: – (19.6%) were capable of living without in-
house supervision – (18.7%) demonstrated employment potential
either in competitive or sheltered workshop environments

How can I wake this patient up?

Where are they in Spectrum of DOC?
! Rule out locked in syndrome
Disorders of Consciousness Coma
Vegetative State
Minimally Conscious State
Consciousness
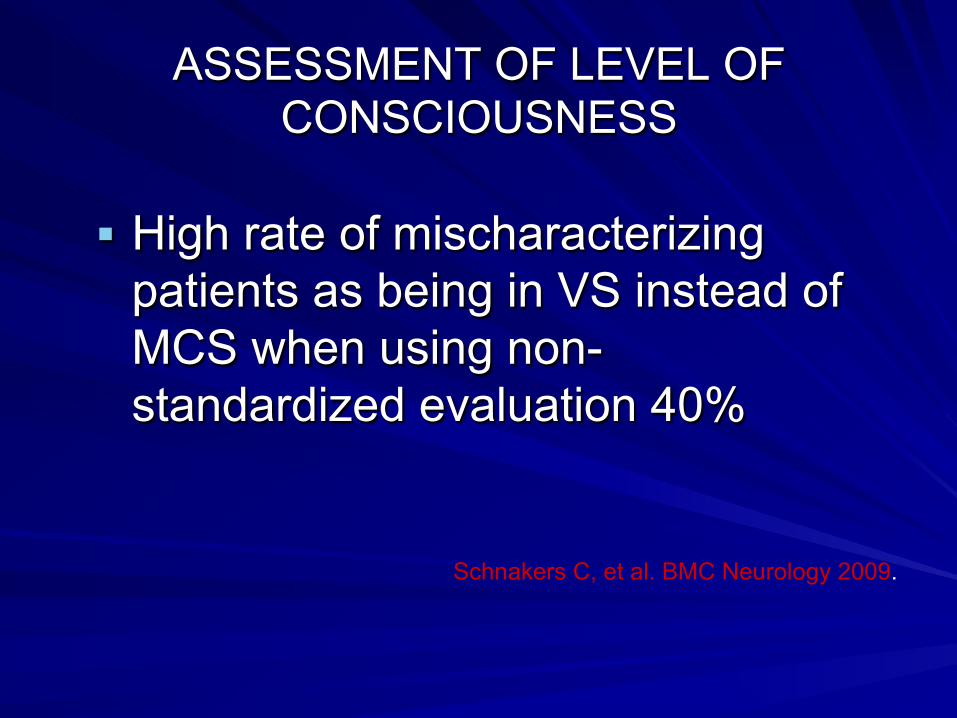
ASSESSMENT OF LEVEL OF CONSCIOUSNESS
§ High rate of mischaracterizing patients as being in VS instead of MCS when using non-standardized evaluation 40%
Schnakers C, et al. BMC Neurology 2009.
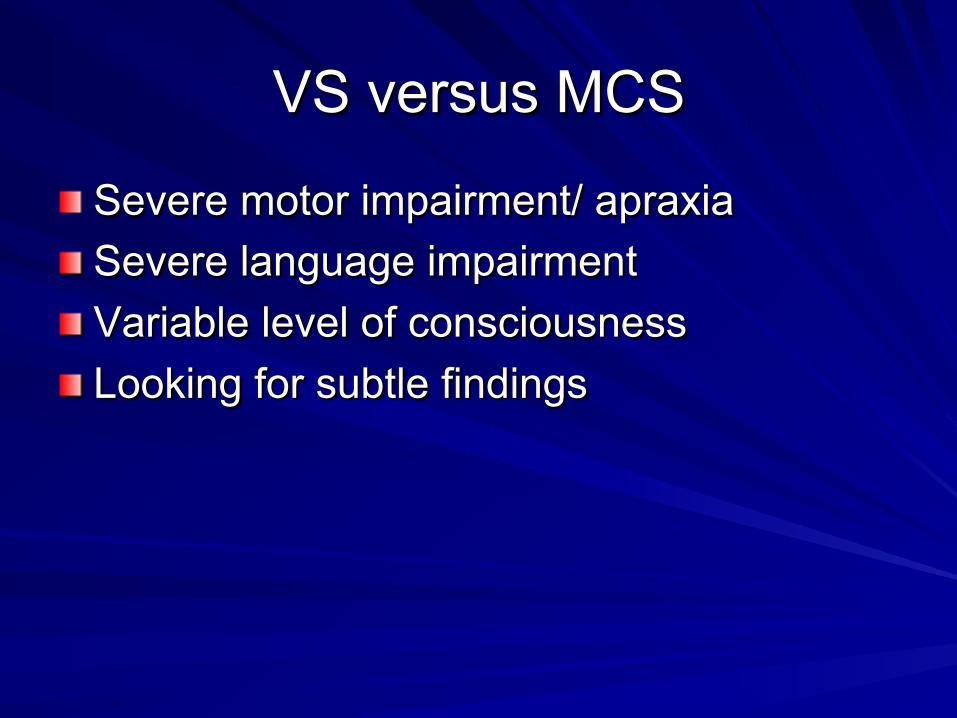
VS versus MCS
! Severe motor impairment/ apraxia ! Severe language impairment ! Variable level of consciousness ! Looking for subtle findings
JFK COMA RECOVERY SCALE-REVISED (CRS-R)
! Developed to measure small clinical changes in patients functioning at very low level with TBI and Non-TBI.
! Provides reliable, valid, assessment of progress or lack of progress in low level brain injured patients.

JFK COMA RECOVERY SCALE-REVISED (CRS-R)
§ Assesses: – Auditory – Visual – Motor – Oromotor/ Verbal – Communication – Arousal – Consistent reproducible responses and evidence or
awareness of environment
PATIENTS WITH DISORDERS OF CONSCIOUSNESS WILL RARELY
IMPROVE UNTIL MEDICAL ISSUES STABILIZE
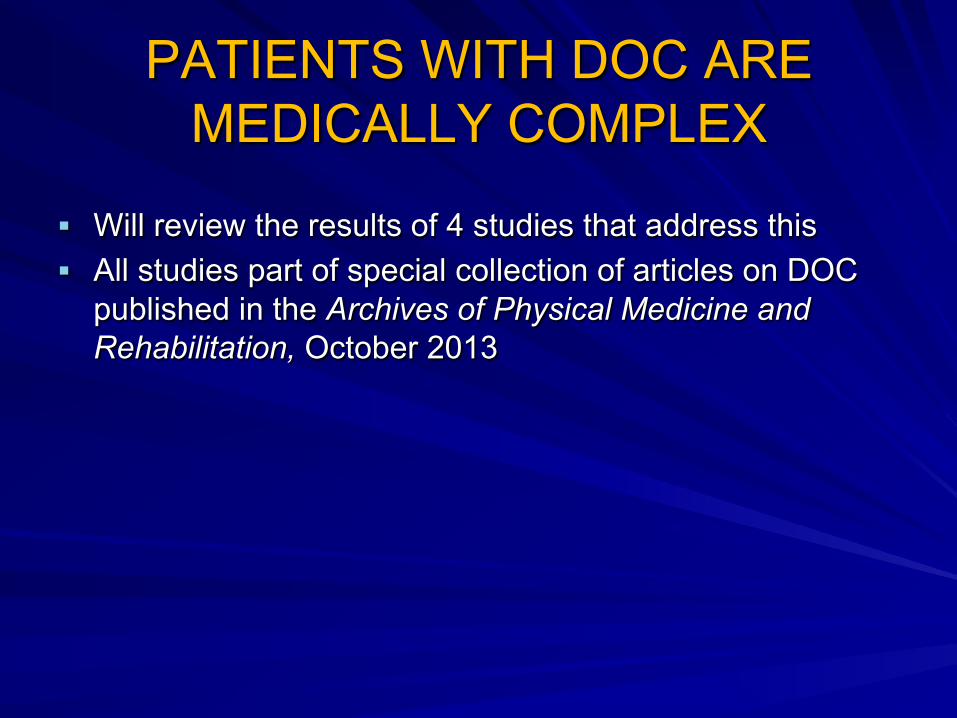
PATIENTS WITH DOC ARE MEDICALLY COMPLEX
§ Will review the results of 4 studies that address this § All studies part of special collection of articles on DOC
published in the Archives of Physical Medicine and Rehabilitation, October 2013

Nakase-Richardson R, et al. Do rehospitalization rates differ among injury
severity levels in the NIDRR TBI Model Systems Program?
Arch Phys Med Rehabil, 2013; 94(10): 1884-90.
§ Aims – Compare incidence and nature of rehospitalization rates at 1-year post-injury for persons with DOC compared to moderate and severe TBI without DOC.
– Describe rehospitalization rate of persons with DOC over time.

Methods: Subjects
§ Population: 9028 TBI Rehab Admits (1998-2009) – Excluded: – 155 - missing motor score on Rehab DRS – 1062 - missing or not due for 1-year follow-up – 78 - missing ER GCS – 2235 - ER GCS 13-15
§ Study Sample N=5528 – N=769 had moderate TBI (ER GCS 9-12) – N=4363 Severe TBI (ER GCS 3-8) – N=366 DOC status at RehAdm

Procedure
§ Prospective recruitment and evaluation – TBI Model System Criteria
§ Chart review – Trained TBIMS Staff – Acute Care Hospitalization
§ Prospective Tracking – Neurologic and Rehabilitation Course – Discharge Status/Outcomes
§ Annual 1, 2, & 5 Year Follow-up • Coding for Maximum of 5 Hospitalizations During
Follow-Up Interval

Subject Demographics
MODERATE N=769
SEVERE N=4,363
DOC
N=366 Age (quartiles) 24/37/51 21/29/43 21/28/41 Male 73% 76% 73% Race
White 56% 69% 67% Black 30% 19% 22% Hispanic 10% 8% 8% Other 4% 4% 3%
Education <12 years 55% 52% 52% ≥ 12 years 45% 48% 48%
Cause of Injury N Motor (%) 39% 64% 66%
ED GCS 10/11/12 3/3/6 3/3/6 Rehab Admit GCS
14/14/15 13/14/15 7/9/10
Acute LOS 9/15/24 12/19/29 21/31/42 Rehab LOS 12/17/28 14/22/35 29/48/74
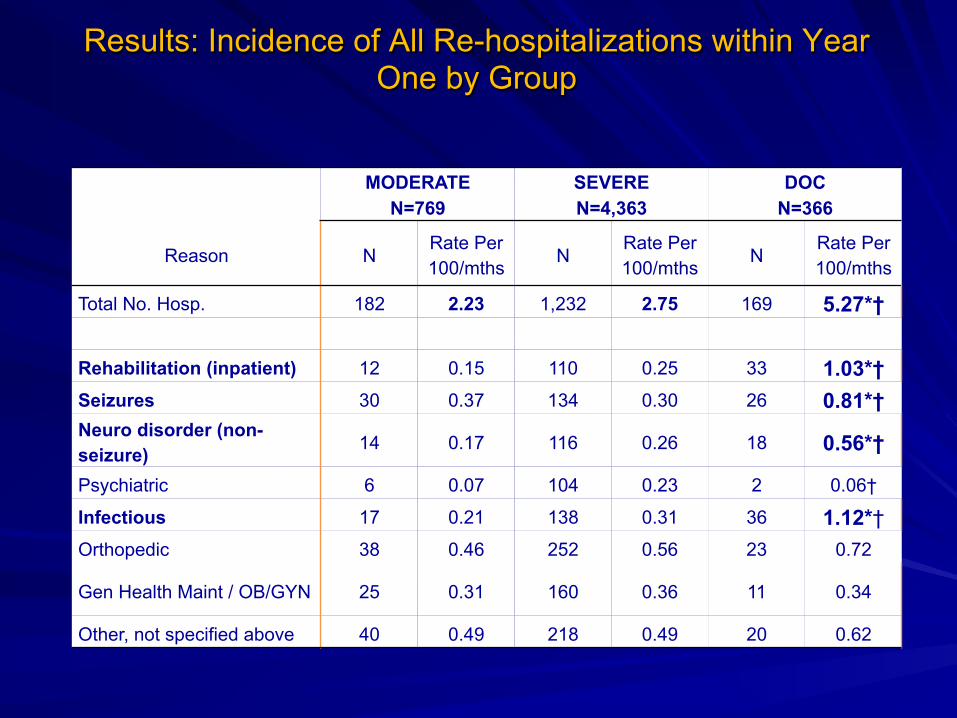
Results: Incidence of All Re-hospitalizations within Year One by Group
MODERATE N=769
SEVERE N=4,363
DOC N=366
Reason N Rate Per 100/mths
N Rate Per 100/mths
N Rate Per 100/mths
Total No. Hosp. 182 2.23 1,232 2.75 169 5.27*†
Rehabilitation (inpatient) 12 0.15 110 0.25 33 1.03*† Seizures 30 0.37 134 0.30 26 0.81*† Neuro disorder (non-seizure) 14 0.17 116 0.26 18 0.56*†
Psychiatric 6 0.07 104 0.23 2 0.06†
Infectious 17 0.21 138 0.31 36 1.12*† Orthopedic 38 0.46 252 0.56 23 0.72
Gen Health Maint / OB/GYN 25 0.31 160 0.36 11 0.34
Other, not specified above 40 0.49 218 0.49 20 0.62

DOC Subgroup
Year 1 N=285
Year 2 N=245
Year 5 N=134
Complete Follow-up
N=108
Number Admits
Rate per 100/mos
Number Admits
Rate per 100/mos
Number Admits
Rate per 100/mos
Number Admits Rate
Total No. Hosp. 169 4.94 120 4.08 48 2.99 151 2.33
Reason
Rehabilitation (inpt) 40 0.59 17 0.58 2 0.12 26 0.40
Seizures 20 0.29 18 0.61 8 0.50 18 0.28
Neuro disorder (non-seizure) 8 0.12 7 0.24 5 0.31 12 0.18
Psychiatric 20 0.30 9 0.32 3 0.19 10 0.15
Infectious 24 0.36 13 0.44 8 1.45 19 0.31
Orthopedic 21 0.31 25 0.85 1 0.18 17 0.26
Gen Hlth Maint or OB/GYN 15 0.22 10 0.34 13 0.80 23 0.35
Other not specified above 21 0.30 21 0.71 8 0.49 26 0.40
Results: Incidence of Re-hospitalization for DOC subgroup available at follow-up and the N=108 with consistent follow-up.
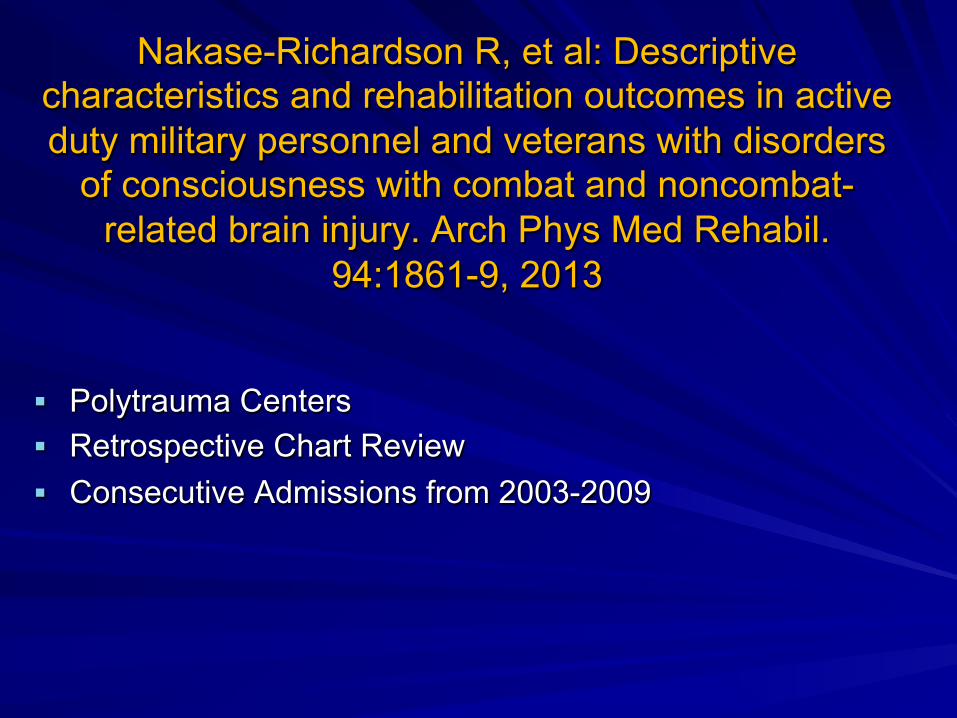
Nakase-Richardson R, et al: Descriptive characteristics and rehabilitation outcomes in active duty military personnel and veterans with disorders
of consciousness with combat and noncombat-related brain injury. Arch Phys Med Rehabil.
94:1861-9, 2013
§ Polytrauma Centers § Retrospective Chart Review § Consecutive Admissions from 2003-2009
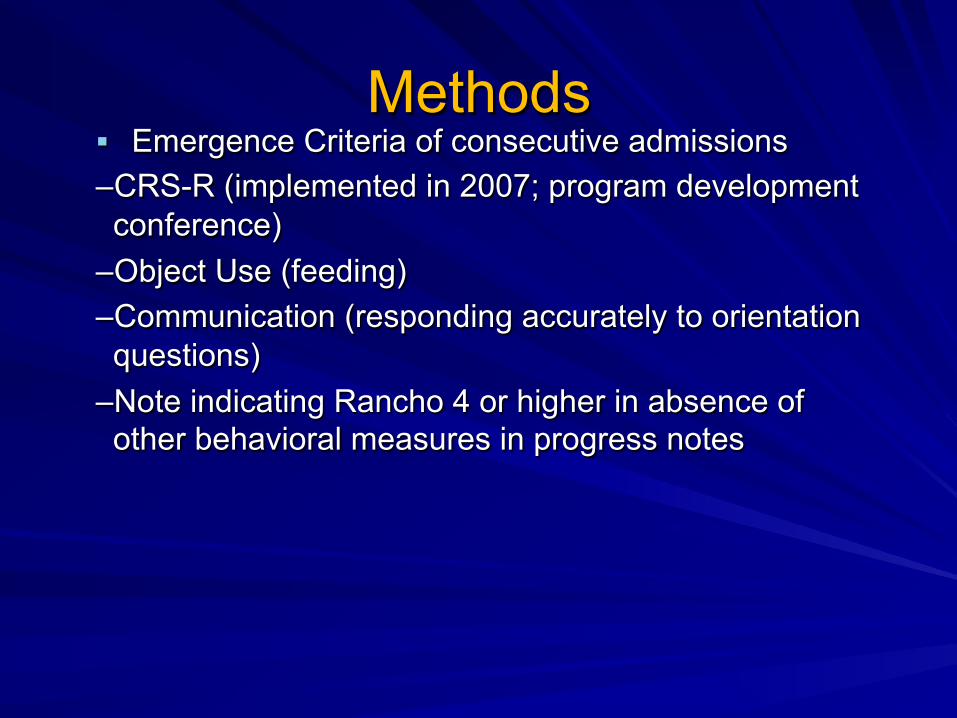
Methods § Emergence Criteria of consecutive admissions – CRS-R (implemented in 2007; program development conference)
– Object Use (feeding) – Communication (responding accurately to orientation questions)
– Note indicating Rancho 4 or higher in absence of other behavioral measures in progress notes

ECP Participant Characteristics
Mechanism of Injury § Trauma
– Blast Injury – 22% – Non-Blast – 64.2%
! MVC ! GSW ! Fall
§ Non-Traumatic – 12.2% – Anoxia – Stroke – Intracranial Infection
Demographics § Gender (93.5% male) § Age (quartiles)
– 22/25/31
§ Education – – 73.4% High School
§ Marital Status – 42.7% Married – 48.4% Single – 7.3% Other
PRC BI 2003-2009 (N= 1,654) ECP (N=121)
Active Duty & Veteran Status
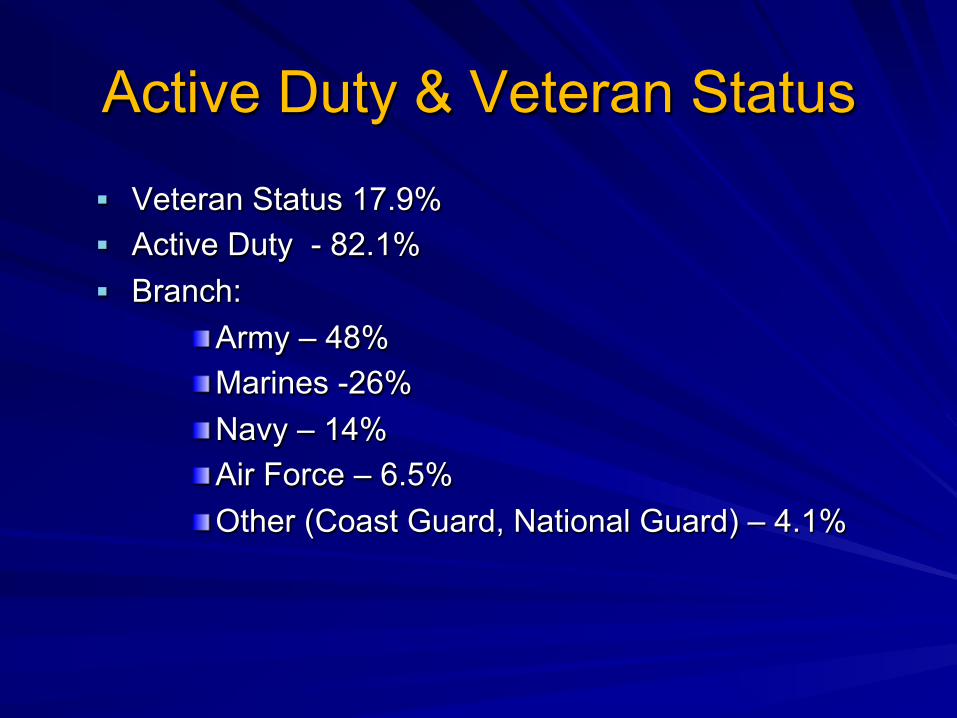
§ Veteran Status 17.9% § Active Duty - 82.1% § Branch:
! Army – 48% ! Marines -26% ! Navy – 14% ! Air Force – 6.5% ! Other (Coast Guard, National Guard) – 4.1%

Overall Sample N=122
Trauma-Blast N=29
Trauma-Other N=67
Non-Trauma N=16
Spasticity 70% (62-78) 70% (52-86) 76% (66-86) 88% (71-100)
Dysautonomia 34% (25-42) 48% (30-66) 27% (16-37) 38% (14-61)
Seizure 30% (22-38) 45% (27-63) 21% (11-31) 19% (0-38)
Shunt Placement 25% (18-33) 31% (14-48) 28% (18-39) 12% (0-28)
Intracranial Infection 22% (15-30) 48% (30-66) 12% (4-20) 0% (--)
Heterotopic Ossification
16% (10-23) 31% (14-48) 10% (3-18) 13% (0-29)
PE/DVT 14% (8-20) 21% (6-35) 13% (5-22) 0% (--)
Filter Placement 41% (33-49) 55% (37-72) 40% (29-52) 6% (0-18)
Anticoagulation 84% (77-90) 90% (79-100) 82% (73-91) 75% (54-96)
PE/DVT w/Prophylaxis
11% (4-14) 17% (3-31) 10% (3-18) 6% (0-18)
Rehab Vent 11% (4-14) 17% (3-31) 10% (3-18) 6% (0-18)Nakase-Richardson R, McNamee S, Howe LLS, Massengale J, Peterson M, Barnett SD, Harris O, McCarthy M, Tran J, Scott S, Cifu DX. Descriptive Characteristics and Rehabilitation Outcomes in Active Duty Military Personnel and Veterans with Disorders of Consciousness With Combat- and Non-Combat- Related Brain Injury. Archives of Physical Medicine and Rehabilitation, 2013; 94(10): 1861-9

Ganesh S, et al: Medical co-morbidities in disorders of consciousness patients and their
association with functional outcomes. Arch Phys Med Rehabil. 94:1899-907, 2013
§ 68 subjects from 4 urban rehab facilities § At least 28 days of unconsciousness § Medical complications extracted from medical records § One-year FIM outcome scores also recorded
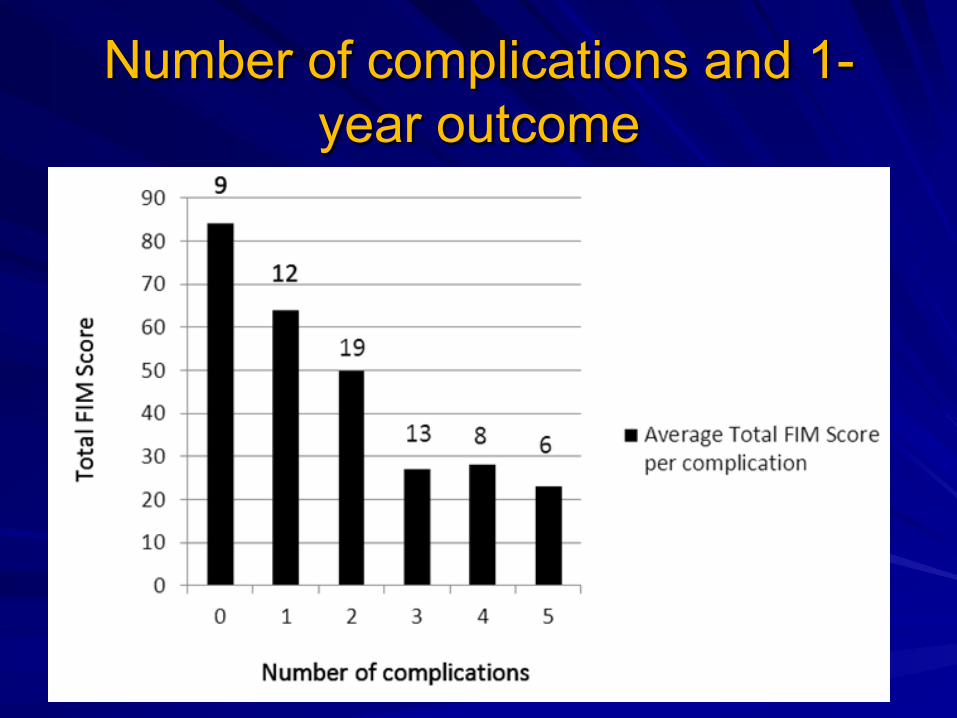
Number of complications and 1-year outcome
Whyte J, et al: Medical complications during inpatient rehabilitation among patients with
traumatic disorders of consciousness. Arch Phys Med Rehabil, 94(10):1877-1883, 2013
§ Data collected as part of RCT of amantadine vs. placebo (Giacino, Whyte, Bagiella, et al. Placebo-controlled trial of amantadine for severe traumatic brain injury. N Engl J Med, 366(9): 819-26, 2012
§ Recorded as “adverse events” § No difference based on treatment assignment, so all
events tallied

“ADVERSE EVENT”
§ New onset of symptom, sign, or abnormal laboratory finding; or
§ Worsening of existing symptom, sign, or abnormal laboratory finding
§ Adverse events rated for their severity, and “serious adverse events” defined as transfer to acute care or major medical/surgical procedure
§ 468 events over 6 weeks, or about .4/week/patient

Characteristics of the Sample N = 184
Demographics
Age: (mean/SD) 36.4 (15.4)
Male: (N/%) 133 (72.3%)
Hispanic/Latino 16 (8.7%)
Race: Asian 2 (1.1%)
Black/African American 16 (8.7%)
White 160 (87)
Other 6 (3.3)
Injury Characteristics
Time from injury to randomization (med/IQ range) 47 (37 – 65)
Time from admission to randomization (med/IQ range) 12 (6 – 19)
Baseline DRS score (mean/SD) 22.0 (2.1)
Baseline CRS-R score (mean/SD) 9.4 (4.1)

Complications per Patient

Most Common Medical Complications
Medical Complication Number of
Events Percent of all
Events Percent "severe"
Hypertonia/spasticity* 39 8.3 12.8
Agitation/aggression* 30 6.4 6.7
Urinary Tract Infection 30 6.4 3.3
Insomina/sleep disturbance* 29 6.2 3.4
Motor restlessness/hyperkinesia* 22 4.7 9.0
Vomiting 20 4.3 10.0 Other abnormal laboratory finding (including 8 cases of hyponatremia) 17 3.6 5.9
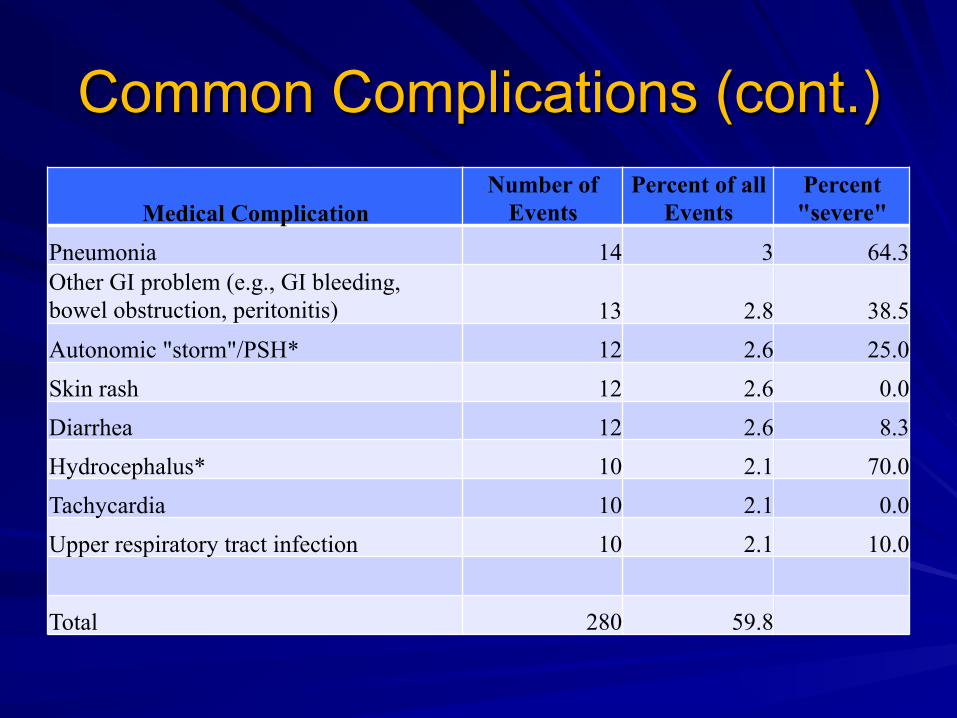
Common Complications (cont.)
Medical Complication Number of
Events Percent of all
Events Percent "severe"
Pneumonia 14 3 64.3 Other GI problem (e.g., GI bleeding, bowel obstruction, peritonitis) 13 2.8 38.5 Autonomic "storm"/PSH* 12 2.6 25.0 Skin rash 12 2.6 0.0 Diarrhea 12 2.6 8.3 Hydrocephalus* 10 2.1 70.0 Tachycardia 10 2.1 0.0 Upper respiratory tract infection 10 2.1 10.0
Total 280 59.8

Acute Care Hospitalizations Diagnosis Number of Hospitalizations Pneumonia 7* Gastritis/gastrointestinal bleeding 2 Osteomyelitis 1 Intracranial bleeding 1 Deterioration in consciousness 1 Cellulitis/sepsis 2* Corneal infiltrate (worsened) 1 Jejunal tube replacement 1 Bowel obstruction 2 Paroxysmal Sympathetic Hyperactivity 1
* - One additional patient in each category was treated in an integrated ICU without transfer

Hospitalizations (cont.) Diagnosis Number of Hospitalizations Hydrocephalus/shunting 2 Tremor 1 Cardiac arrest 1# Change in craniectomy site 1 Urinary tract infection/sepsis 1 Anemia, leg swelling 1 Vomiting/possible aspiration 1 Increased white blood cell count/seizures 1 Infection/hydrocephalus 1 Peritonitis 2 Total 31
# - death
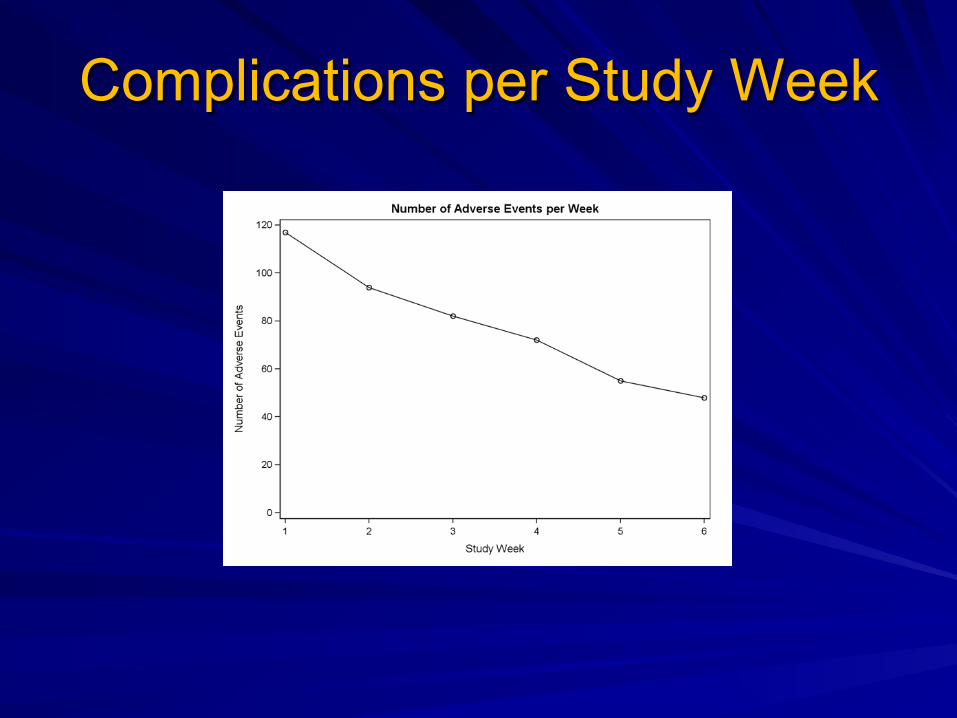
Complications per Study Week
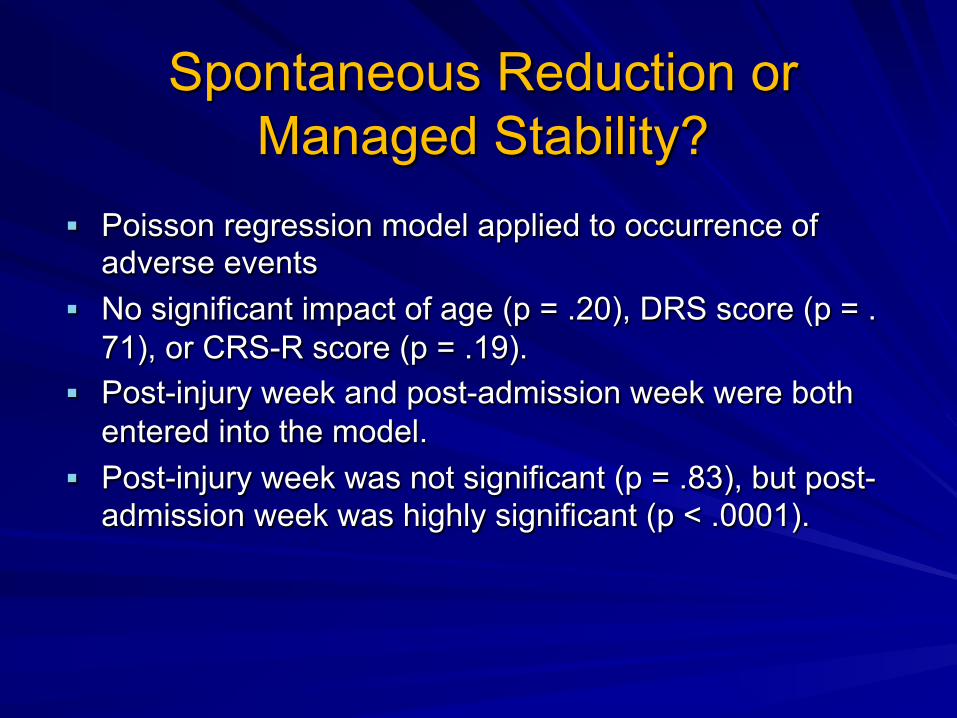
Spontaneous Reduction or Managed Stability?
§ Poisson regression model applied to occurrence of adverse events
§ No significant impact of age (p = .20), DRS score (p = .71), or CRS-R score (p = .19).
§ Post-injury week and post-admission week were both entered into the model.
§ Post-injury week was not significant (p = .83), but post-admission week was highly significant (p < .0001).

Limitations § Underestimation
– A substantial minority of the study subjects had already returned from an acute care transfer when they were enrolled (and 14.7% were transferred during the study)
– Chronically unstable patients excluded – Complications already stable under management not
counted § Overestimation
– Close monitoring – Some “complications” are expected (e.g.,
restlessness/agitation)

What we Know
§ Active management, not the mere passage of time, appears important for controlling rate of complications
§ Occurrence of more complications is associated with worse outcomes at 1 year

What we don’t know § Relevance of etiology of DOC § Is high rate of medical complications related to DOC? § Is poor outcome of those with more complications due to
the effects of those complications per se? or do particularly severe injuries produce both frequent complications and poor outcome?

Mortality following Traumatic Brain Injury among Individuals Unable to Follow Commands at the Time of Rehabilitation Admission: A NIDRR TBI
Model Systems Study.
Greenwald BD, Hammond F, Harrison-Felix CL, Nakase- Richardson R, Howe LL, Kreider S. J Neurotrauma. 2015
Mar 25. [Epub ahead of print]
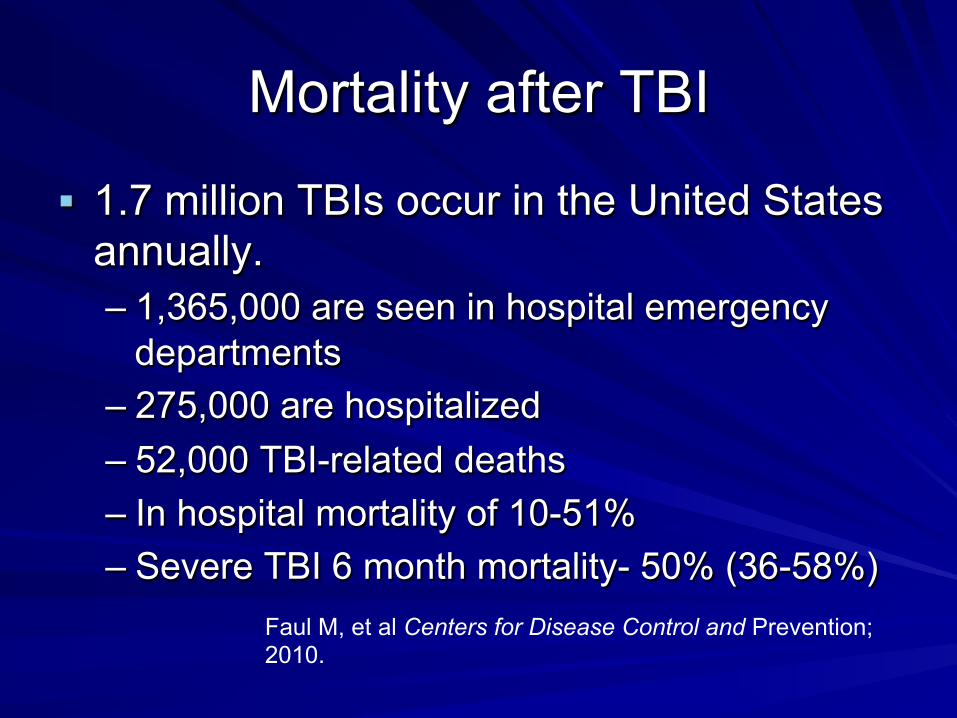
Mortality after TBI
§ 1.7 million TBIs occur in the United States annually. – 1,365,000 are seen in hospital emergency
departments – 275,000 are hospitalized – 52,000 TBI-related deaths – In hospital mortality of 10-51% – Severe TBI 6 month mortality- 50% (36-58%)
Faul M, et al Centers for Disease Control and Prevention; 2010.

Mortality after TBI ! Cohort of individuals with moderate to severe
TBI have a 1.5-3 X’s greater likelihood of death relative to the general population using standard mortality ratio (SMR)
! Patient's with Moderate to Severe TBI have a decrease life expectancy of 6.7 years
! Life expectancy further reduced if impaired mobility, swallow, tracheostomy

TBI Model Systems
! Traumatic Brain Injury Model Systems (TBIMS) national database (NDB)
! Funded by the US Department of Education via the National Institute on Disability and Rehabilitation Research since 1987
! The TBIMS NDB contains information on subjects treated within the 20 TBIMS centers funded between 1988 and 2012, which are located around the US
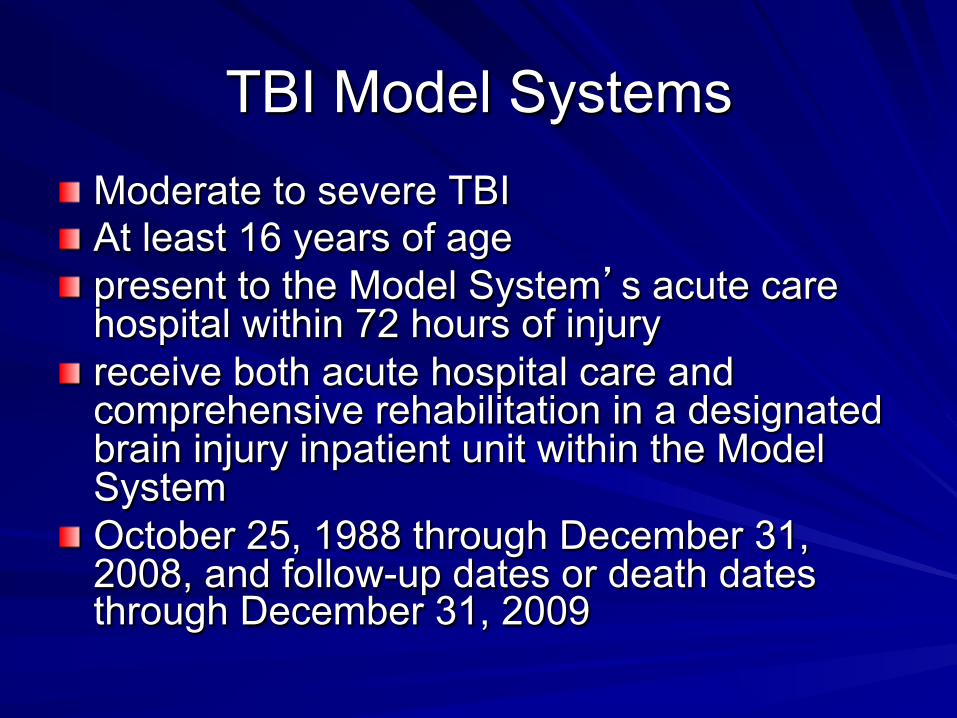
TBI Model Systems ! Moderate to severe TBI ! At least 16 years of age ! present to the Model System’s acute care
hospital within 72 hours of injury ! receive both acute hospital care and
comprehensive rehabilitation in a designated brain injury inpatient unit within the Model System
! October 25, 1988 through December 31, 2008, and follow-up dates or death dates through December 31, 2009
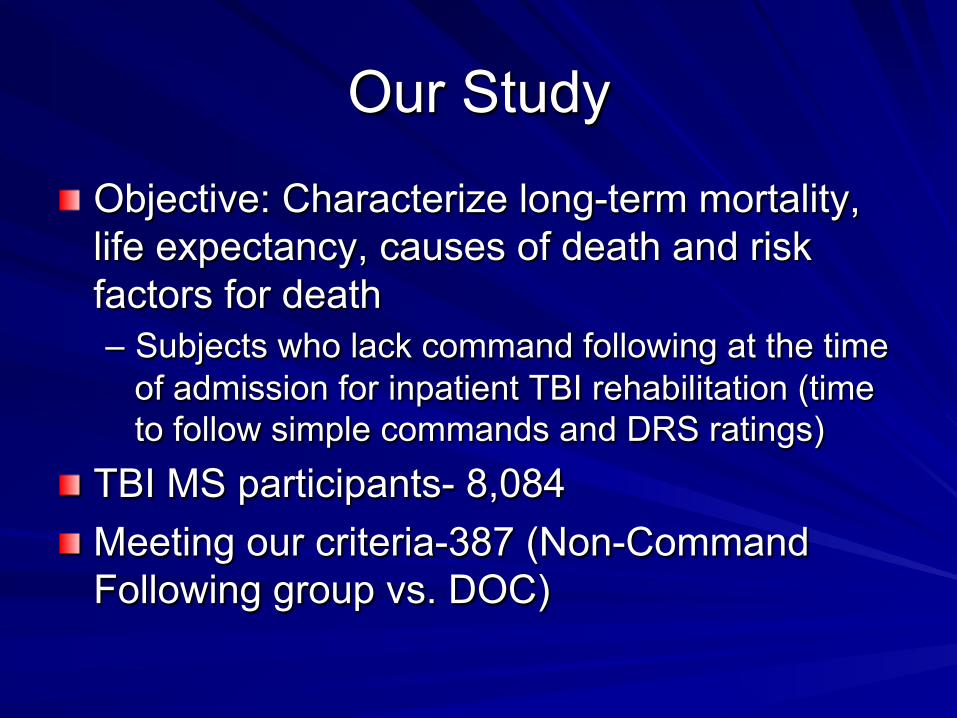
Our Study
! Objective: Characterize long-term mortality, life expectancy, causes of death and risk factors for death – Subjects who lack command following at the time
of admission for inpatient TBI rehabilitation (time to follow simple commands and DRS ratings)
! TBI MS participants- 8,084 ! Meeting our criteria-387 (Non-Command
Following group vs. DOC)

Standardized Mortality Ratio
! SMR is calculated by number of deaths in a population divided by the expected number in the general population. Controls for gender, race and age.
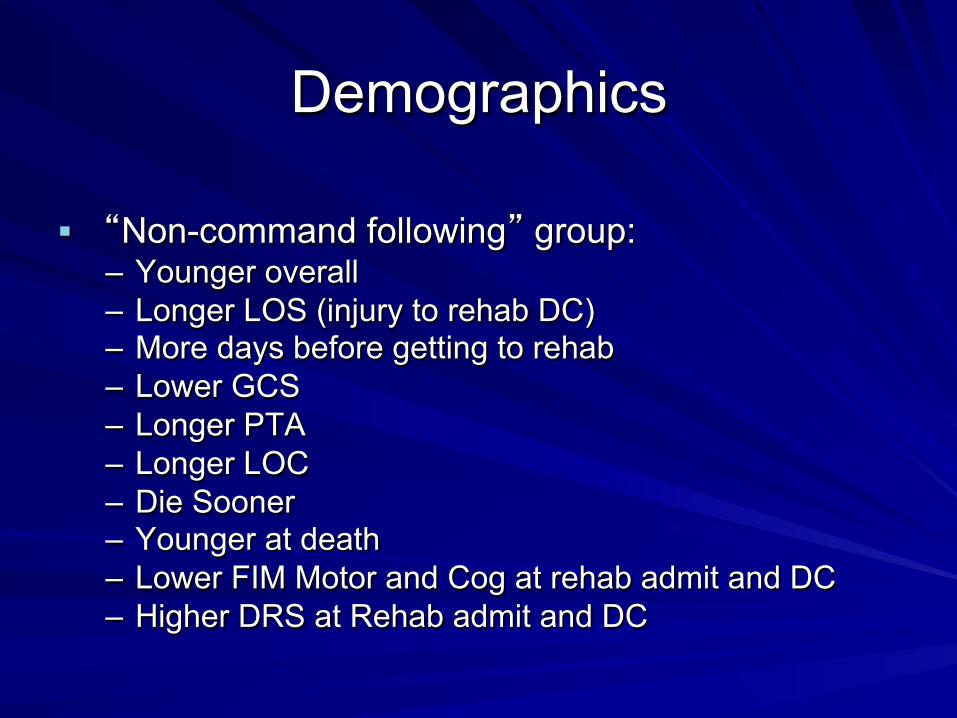
Demographics § “Non-command following” group:
– Younger overall – Longer LOS (injury to rehab DC) – More days before getting to rehab – Lower GCS – Longer PTA – Longer LOC – Die Sooner – Younger at death – Lower FIM Motor and Cog at rehab admit and DC – Higher DRS at Rehab admit and DC

Comparison of Mortality by Group Assignment
Entire Samplen = 8,084
Non Command Followingn = 387
Command followingn = 7,697
Observed deaths 781 (9.7%) 50 (12.9%) 731 (9.5%)
Expected deaths 348 7 341
Standardized Mortality Ratio (SMR)
2.24 6.9 2.14
SMR Upper Confidence Limit (CL)
2.09 4.99 1.99
SMR Lower CL 2.40 8.81 2.30
Mean Life Expectancy reduction
6.6 years 12.2 years 6.2 years
Mean days to death 1,462.27 (SD 1,382.5)
1,124.62 (SD 1,367.64)
1,485.37 (SD 1,381.42)
Mean age at death 60.24 (SD 18.98) 49.30 (SD 17.09) 60.99 (SD 18.88)
DOC group was younger and dies sooner

Death Occurrence by Follow-Up Time Interval
Time Period of Death Occurrence
Entire Samplen = 8,084
Non-Command Followingn = 387
Command Followingn = 7,697
Between Rehabilitation Discharge & 1 Year
171 (22%) 18 (36%) 153 (21%)
Between 1 & 2 years post-injury
141 (18%) 10 (20%) 131 (18%)
Between 2 & 5 years post-injury
236 (30%) 12 (24%) 224 (31%)
Between 5 & 10 years post-injury
167 (21%) 7 (14%) 224 (22%)
After 10 years post-injury 66 (8%) 3 (6%) 63 (9%)

Non-Command Following Group dies sooner following rehabilitation
discharge than their respective Command Following group, most
markedly noted for the two youngest age groups.

Standard Mortality Ratios by
Comparison Group FullSample Non-Command Following Command Following
Cause SMR Lower Upper SMR Lower Upper SMR Lower Upper
Circulatory 1.3 1.11 1.49 4.58 1.74 7.41 1.25 1.05 1.44
External 3.58 2.94 4.23 1.45 -0.56 3.47 3.67 3.01 4.34
Respiratory 3.61 2.93 4.29 17.81 5.47 30.15 3.39 2.73 4.06
Pneumonia 6.37 4.64 8.11 44.28 5.47 83.1 5.84 4.17 7.51AspiraGonPneumonia 14.11 9.06 19.16 38.04 36.52 112.6 13.81 8.79 18.84
Sepsis 10.32 7.34 13.3 49.54 0.99 98.1 9.59 6.69 12.5NervousSystem 2.42 1.47 3.37 12.61 -4.87 30.09 2.26 1.34 3.18
DigesGve 1.76 1.03 2.5 NA NA NA 1.81 1.05 2.56
Seizures 35.29 19.82 50.75 133.74 -17.6 285.09 31.23 16.38 46.08
Mental 2.71 1.38 4.04 18.37 -7.09 43.84 2.42 1.15 3.69

Mortality
! The Non-Command Following Group has higher mortality for circulatory, all respiratory, and pneumonia specific causes than the moderate to severe TBI groups
! The Non-Command Following Group relative to the general population (similar age, gender and race/ethnicity) was: – over 4 times more likely to die of circulatory conditions – 44 times more likely to die of pneumonia – 38 times more likely to die of aspiration pneumonia
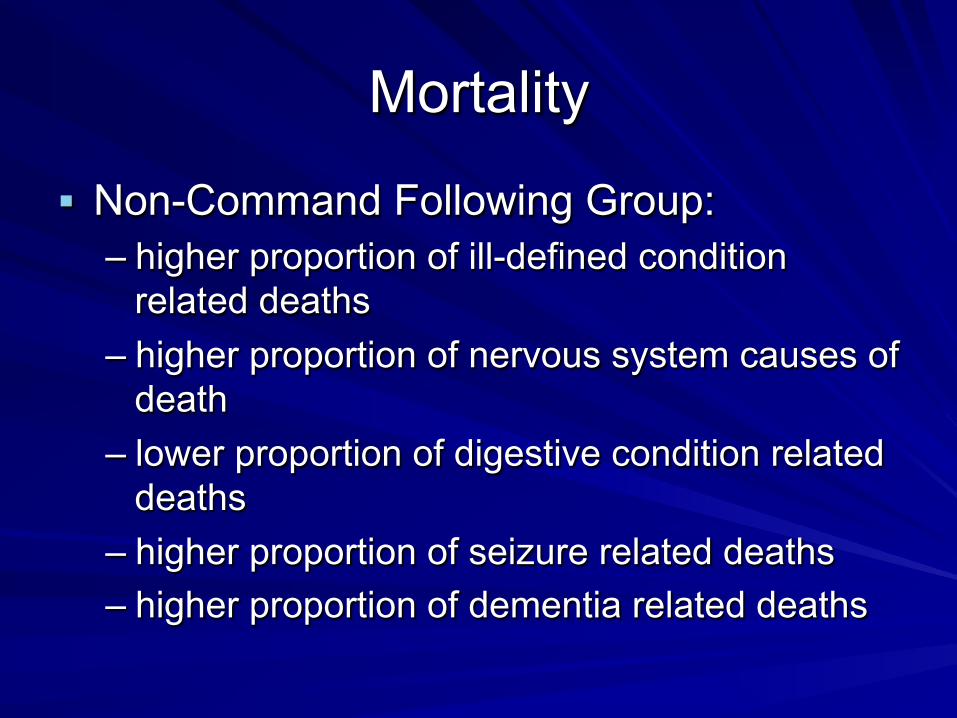
Mortality
§ Non-Command Following Group: – higher proportion of ill-defined condition
related deaths – higher proportion of nervous system causes of
death – lower proportion of digestive condition related
deaths – higher proportion of seizure related deaths – higher proportion of dementia related deaths

Strengths and limitations
§ Strengths: – Large sample size with extensive data about
each subject § Limitations:
– Generalizability questions: ! Patients admitted to a TBIMS hospital ! TBIMS acute rehab setting ! Follow-up decreases over time
Future research needs
§ Better understanding systemic changes that increase risk of complication and death both short term and long term – Immune changes – Autonomic changes
§ Medical management strategies to prevent premature death in this population
Conclusion
! This study adds to the literature on mortality, life expectancy, and risk factors for death and causes of death after moderate to severe TBI.
! Results could aid in long-term life planning, resource allocation and prevention of untimely death in individuals after TBI.
Summary
! Possible to have a good outcome even if patient initially had DOC on admit to rehabilitation
! Patients with DOC on admission to rehabilitation have significantly more medical complications than patients with moderate to severe TBI
! Patients with DOC have increased risk of mortality relative to patients with moderate to severe TBI
Summary
! Many of the medical complications are brain injury specific and warrant management by individuals with specialized expertise as well as easy access to testing to evaluate for these complication subspecialists to assist with management.

Thank You