medi-cal drg year 3 · 15/06/2015 · agenda. 1. drg background . 2. year 1 actual 3. year 3...
TRANSCRIPT
Medi-Cal DRG Year 3
Provider Training W561 6/11 & 6/15 2015 Darrell Bullocks, Dawn Weimar
©2015 Xerox Corporation. All rights reserved. Xerox® and Xerox Design® are trademarks of Xerox Corporation in the United States and/or other countries.
Agenda
1. DRG Background 2. Year 1 Actual 3. Year 3 Updates 4. Billing Points 5. Provider Education
June 2015 2
DRG Background
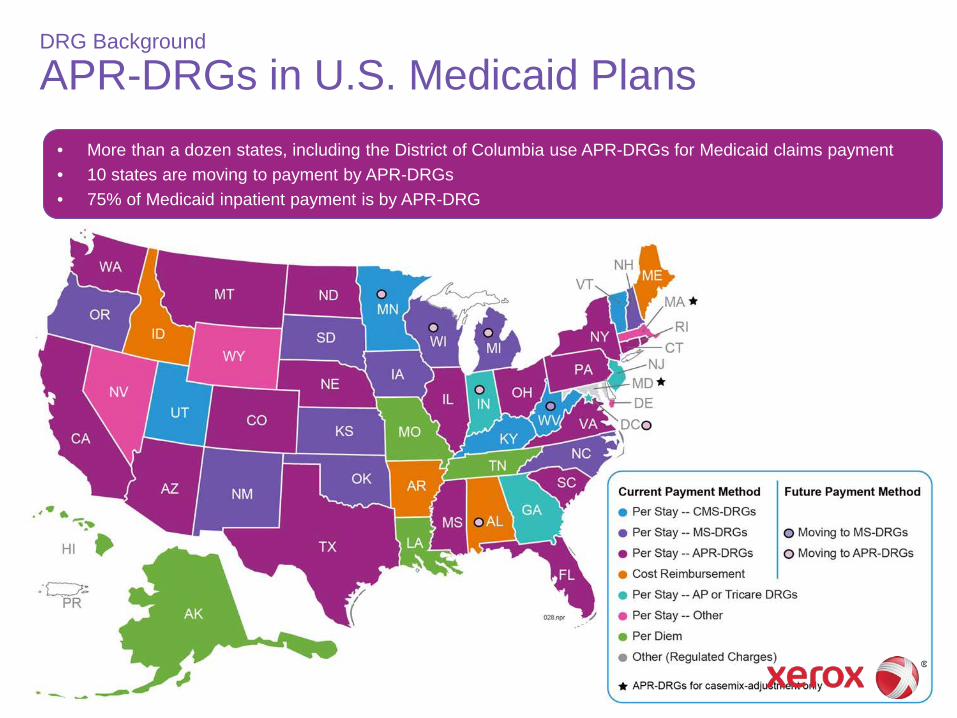
APR-DRGs in U.S. Medicaid Plans • More than a dozen states, including the District of Columbia use APR-DRGs for Medicaid claims payment • 10 states are moving to payment by APR-DRGs • 75% of Medicaid inpatient payment is by APR-DRG
DRG Background
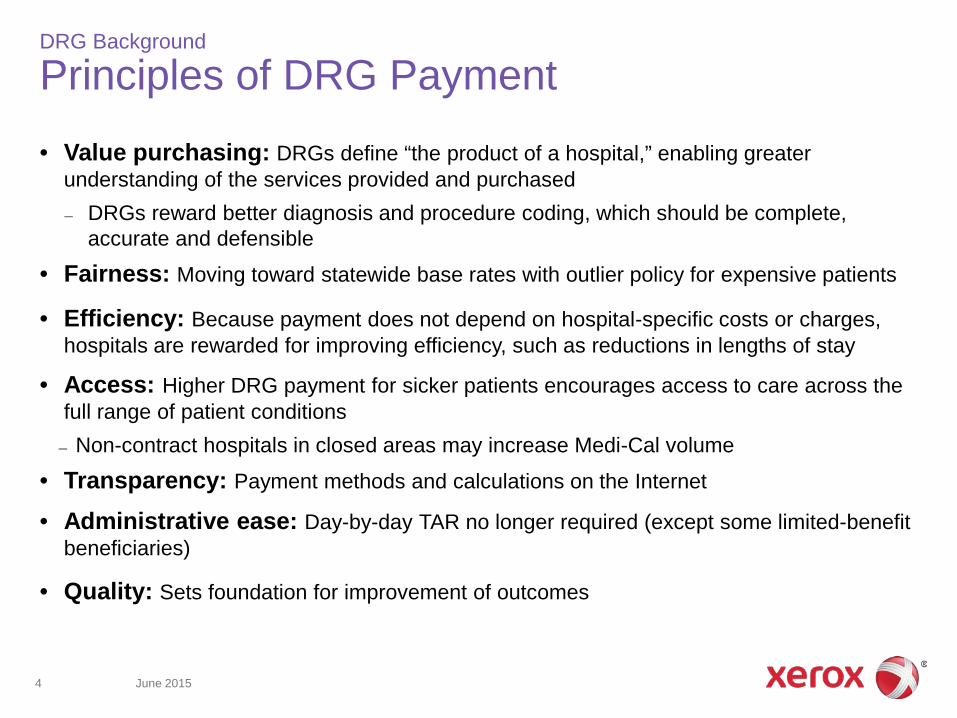
Principles of DRG Payment • Value purchasing: DRGs define “the product of a hospital,” enabling greater
understanding of the services provided and purchased – DRGs reward better diagnosis and procedure coding, which should be complete,
accurate and defensible
• Fairness: Moving toward statewide base rates with outlier policy for expensive patients
• Efficiency: Because payment does not depend on hospital-specific costs or charges, hospitals are rewarded for improving efficiency, such as reductions in lengths of stay
• Access: Higher DRG payment for sicker patients encourages access to care across the full range of patient conditions
– Non-contract hospitals in closed areas may increase Medi-Cal volume
• Transparency: Payment methods and calculations on the Internet
• Administrative ease: Day-by-day TAR no longer required (except some limited-benefit beneficiaries)
• Quality: Sets foundation for improvement of outcomes
June 2015 4
DRG Background
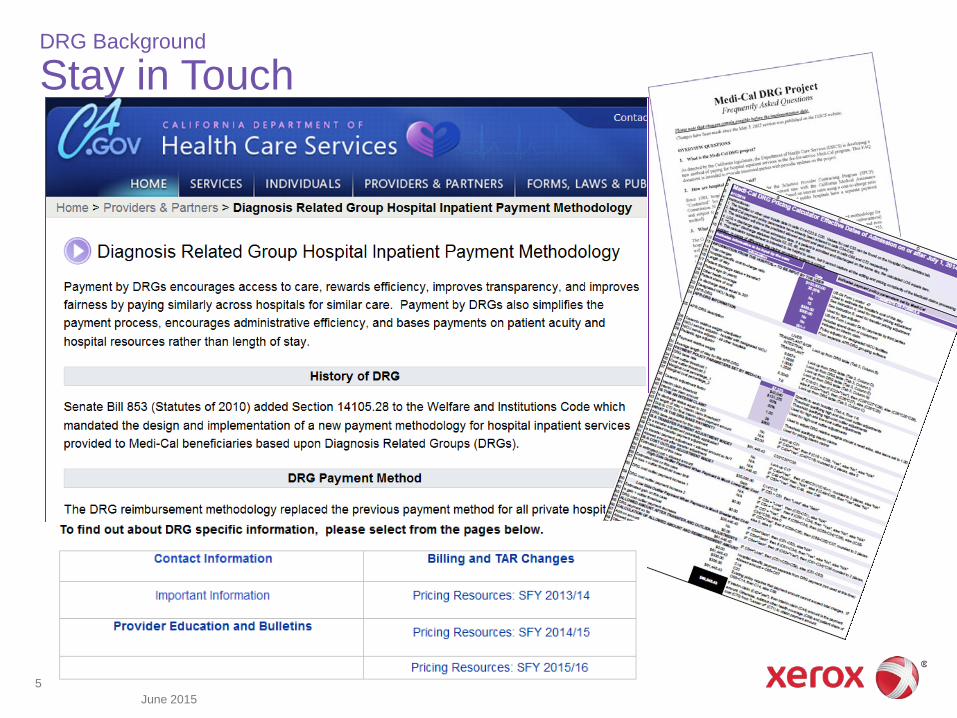
Stay in Touch
5 June 2015
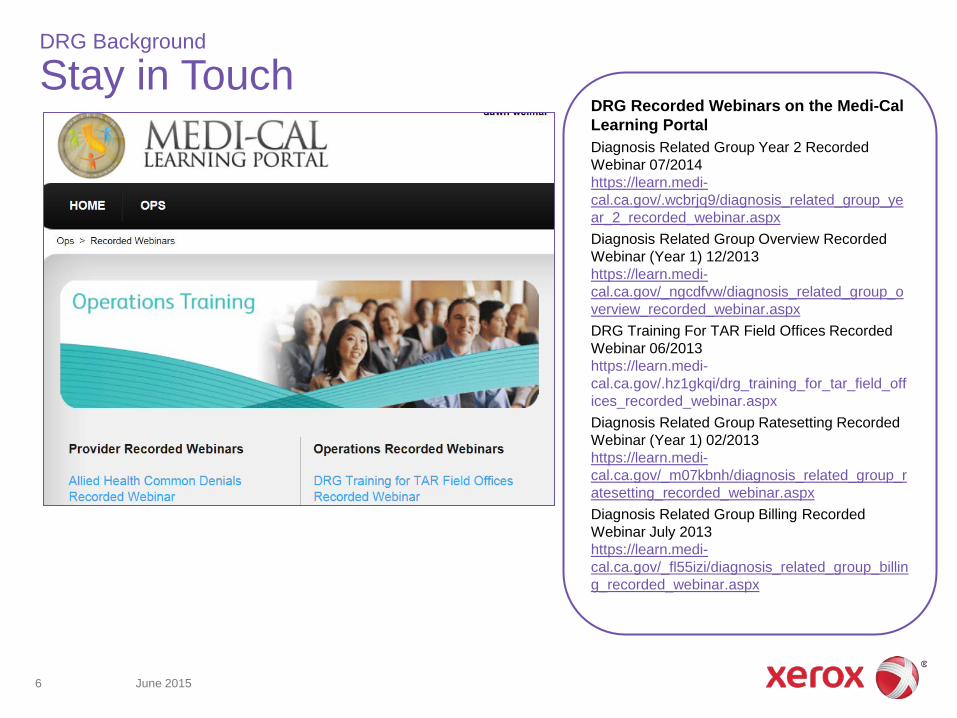
DRG Background
Stay in Touch DRG Recorded Webinars on the Medi-Cal Learning Portal Diagnosis Related Group Year 2 Recorded Webinar 07/2014 https://learn.medical.ca.gov/.wcbrjq9/diagnosis_related_group_ye ar_2_recorded_webinar.aspx Diagnosis Related Group Overview Recorded Webinar (Year 1) 12/2013 https://learn.medical.ca.gov/_ngcdfvw/diagnosis_related_group_o verview_recorded_webinar.aspx DRG Training For TAR Field Offices Recorded Webinar 06/2013 https://learn.medical.ca.gov/.hz1gkqi/drg_training_for_tar_field_off ices_recorded_webinar.aspx Diagnosis Related Group Ratesetting Recorded Webinar (Year 1) 02/2013 https://learn.medical.ca.gov/_m07kbnh/diagnosis_related_group_r atesetting_recorded_webinar.aspx Diagnosis Related Group Billing Recorded Webinar July 2013 https://learn.medical.ca.gov/_fl55izi/diagnosis_related_group_billin g_recorded_webinar.aspx
June 2015 6
DRG Background
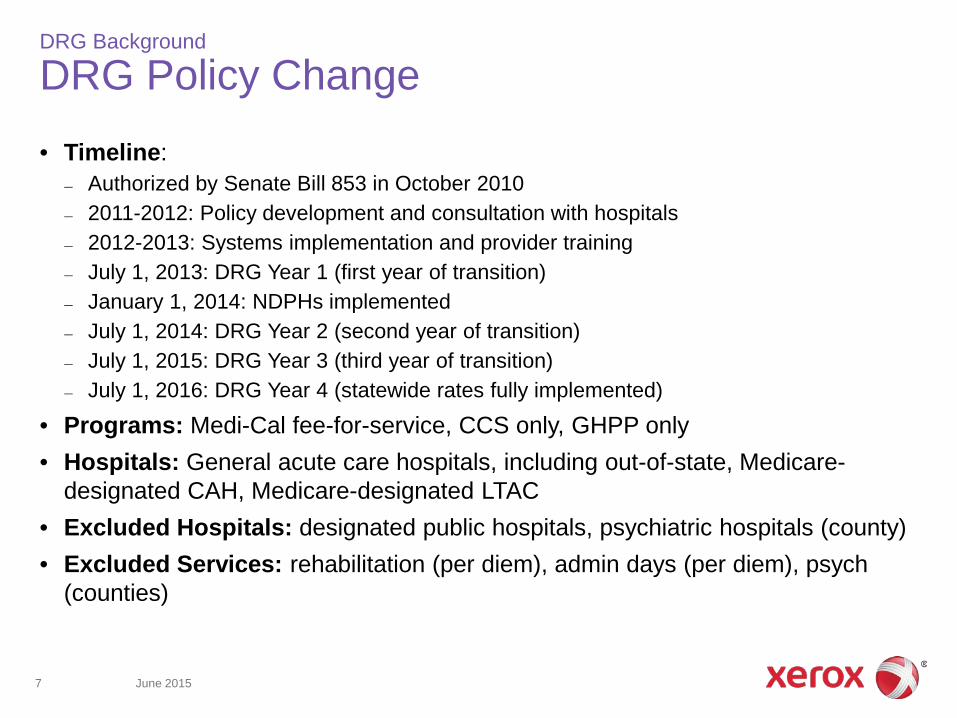
DRG Policy Change
• Timeline: – Authorized by Senate Bill 853 in October 2010 – 2011-2012: Policy development and consultation with hospitals – 2012-2013: Systems implementation and provider training – July 1, 2013: DRG Year 1 (first year of transition) – January 1, 2014: NDPHs implemented – July 1, 2014: DRG Year 2 (second year of transition) – July 1, 2015: DRG Year 3 (third year of transition) – July 1, 2016: DRG Year 4 (statewide rates fully implemented)
• Programs: Medi-Cal fee-for-service, CCS only, GHPP only • Hospitals: General acute care hospitals, including out-of-state, Medicare-
designated CAH, Medicare-designated LTAC • Excluded Hospitals: designated public hospitals, psychiatric hospitals (county) • Excluded Services: rehabilitation (per diem), admin days (per diem), psych
(counties)
June 2015 7
DRG Background
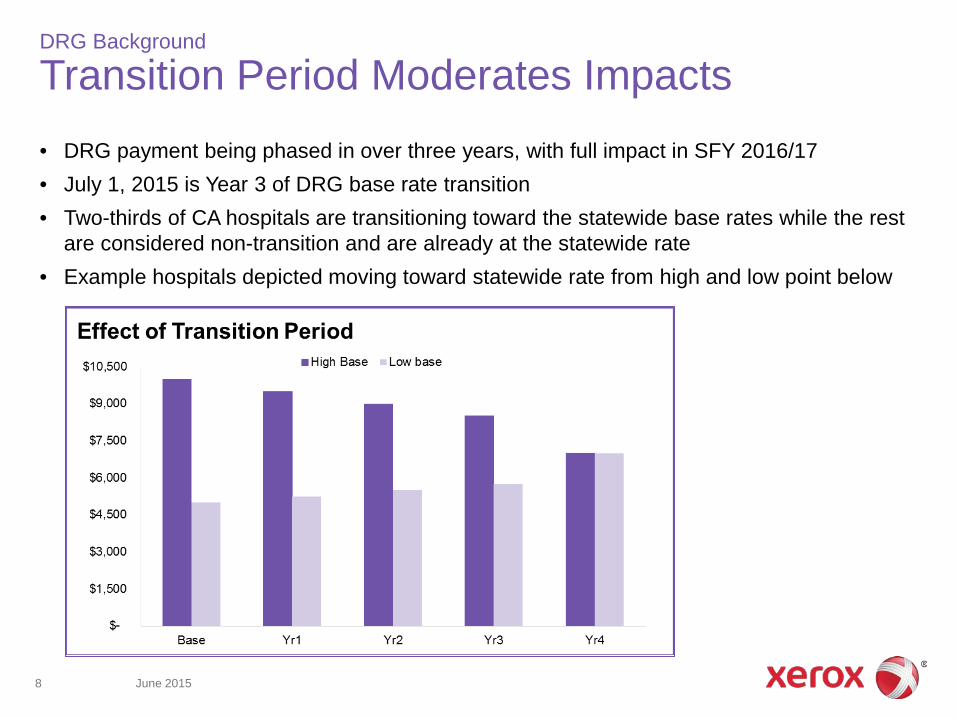
Transition Period Moderates Impacts • DRG payment being phased in over three years, with full impact in SFY 2016/17 • July 1, 2015 is Year 3 of DRG base rate transition • Two-thirds of CA hospitals are transitioning toward the statewide base rates while the rest
are considered non-transition and are already at the statewide rate • Example hospitals depicted moving toward statewide rate from high and low point below
June 2015 8
Agenda
1. Medi-Cal DRG Background 2. Year 1 Actual 3. Year 3 Updates 4. Billing Points 5. Provider Education
June 2015 9
Year 1 Actual
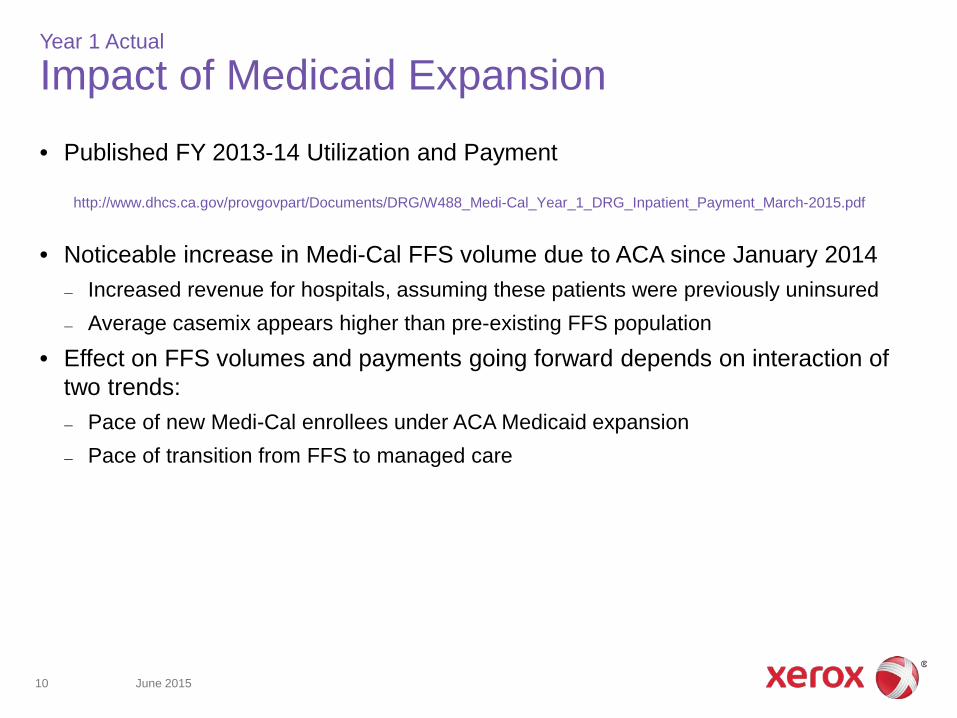
Impact of Medicaid Expansion • Published FY 2013-14 Utilization and Payment
http://www.dhcs.ca.gov/provgovpart/Documents/DRG/W488_Medi-Cal_Year_1_DRG_Inpatient_Payment_March-2015.pdf
• Noticeable increase in Medi-Cal FFS volume due to ACA since January 2014 – Increased revenue for hospitals, assuming these patients were previously uninsured – Average casemix appears higher than pre-existing FFS population
• Effect on FFS volumes and payments going forward depends on interaction of two trends: – Pace of new Medi-Cal enrollees under ACA Medicaid expansion – Pace of transition from FFS to managed care
June 2015 10
Year 1 Actual
How Claims Were Paid
http://www.dhcs.ca.gov/provgovpart/Pages/DRG-Important-Info.aspx
June 2015 11
Year 1 Actual
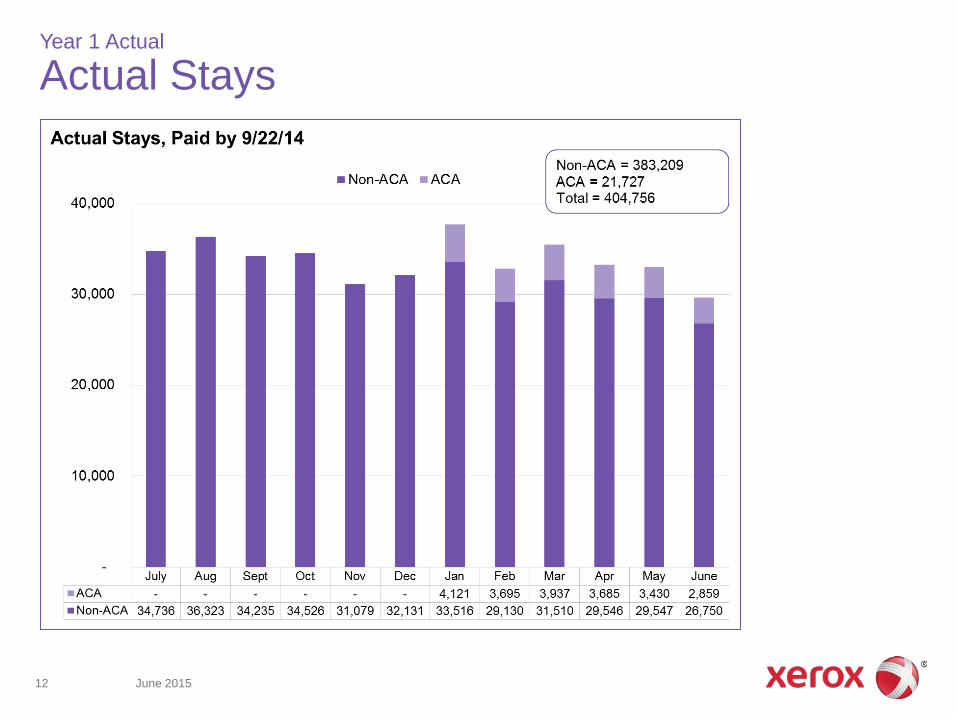
Actual Stays
June 2015 12
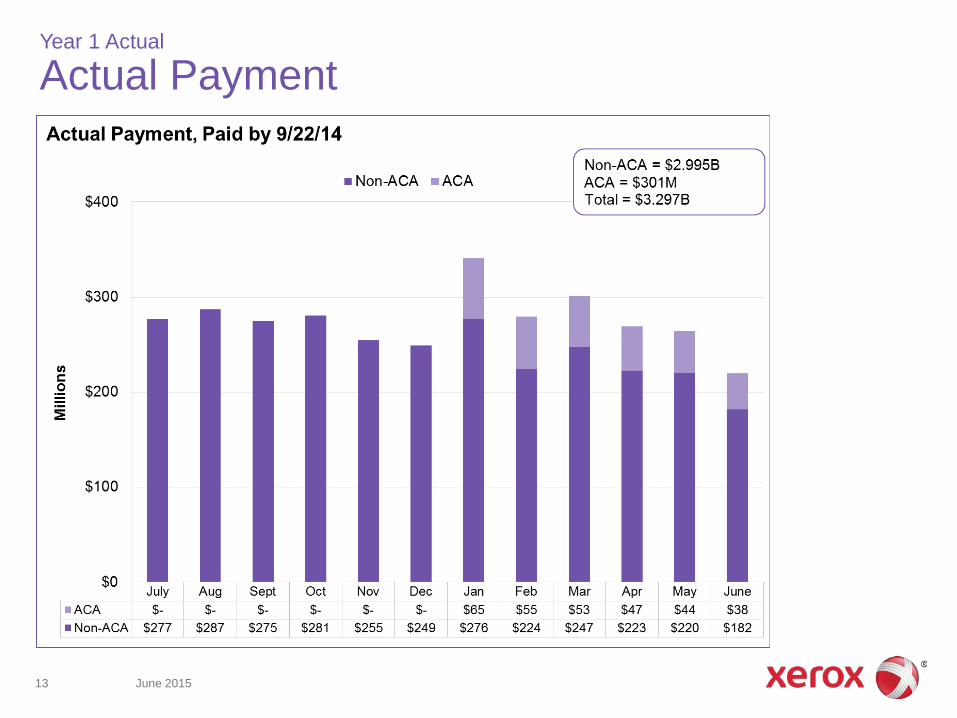
Year 1 Actual
Actual Payment
June 2015 13
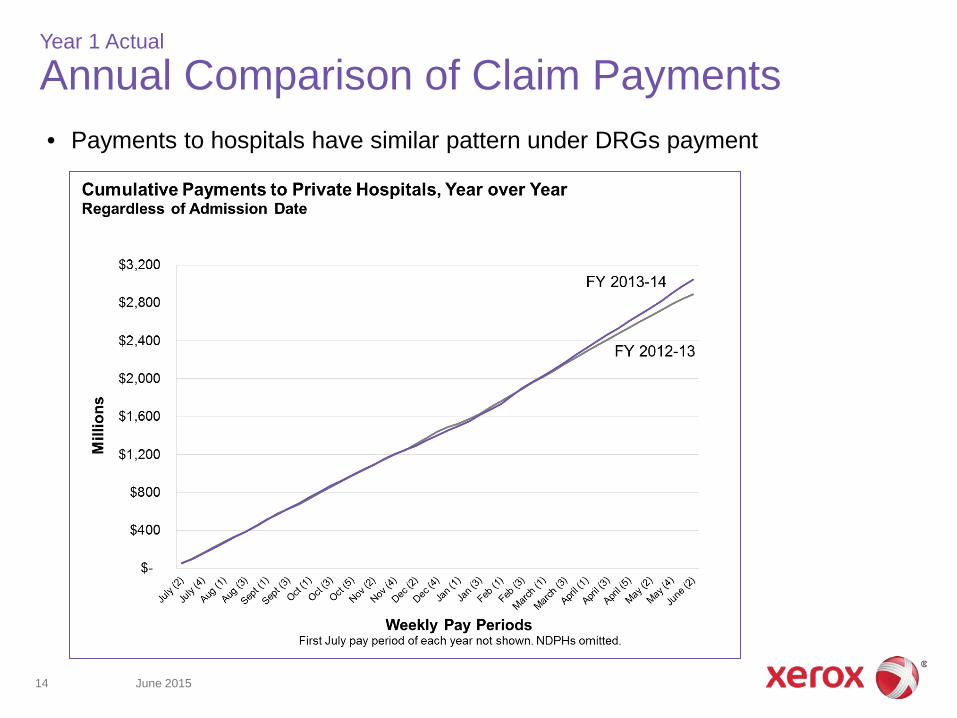
Year 1 Actual
Annual Comparison of Claim Payments • Payments to hospitals have similar pattern under DRGs payment
June 2015 14
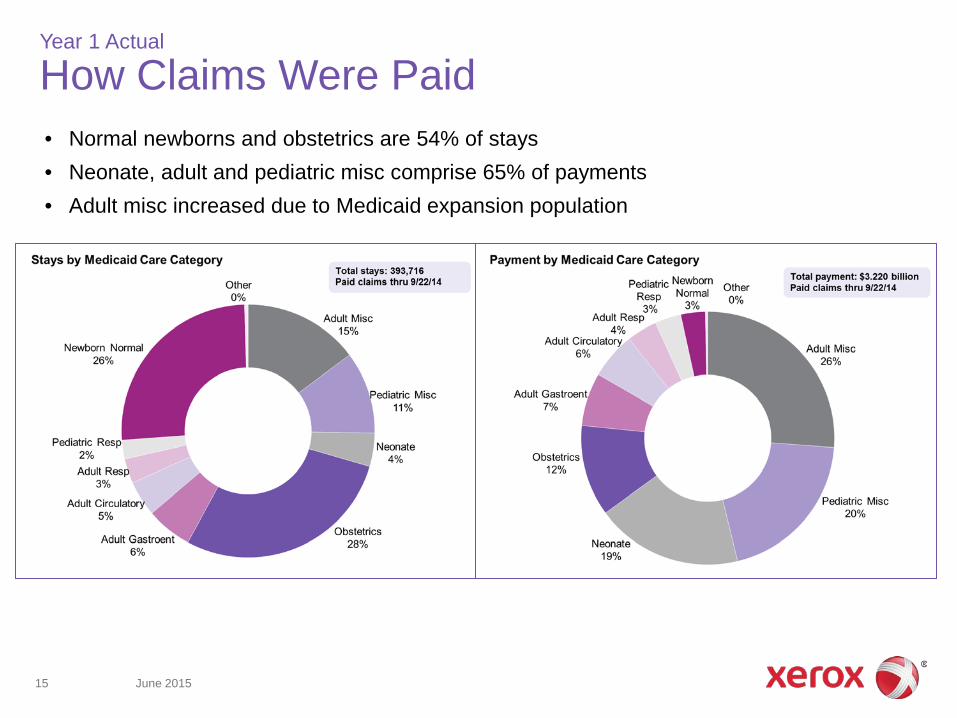
Year 1 Actual
How Claims Were Paid • Normal newborns and obstetrics are 54% of stays • Neonate, adult and pediatric misc comprise 65% of payments • Adult misc increased due to Medicaid expansion population
June 2015 15
Year 1 Actual
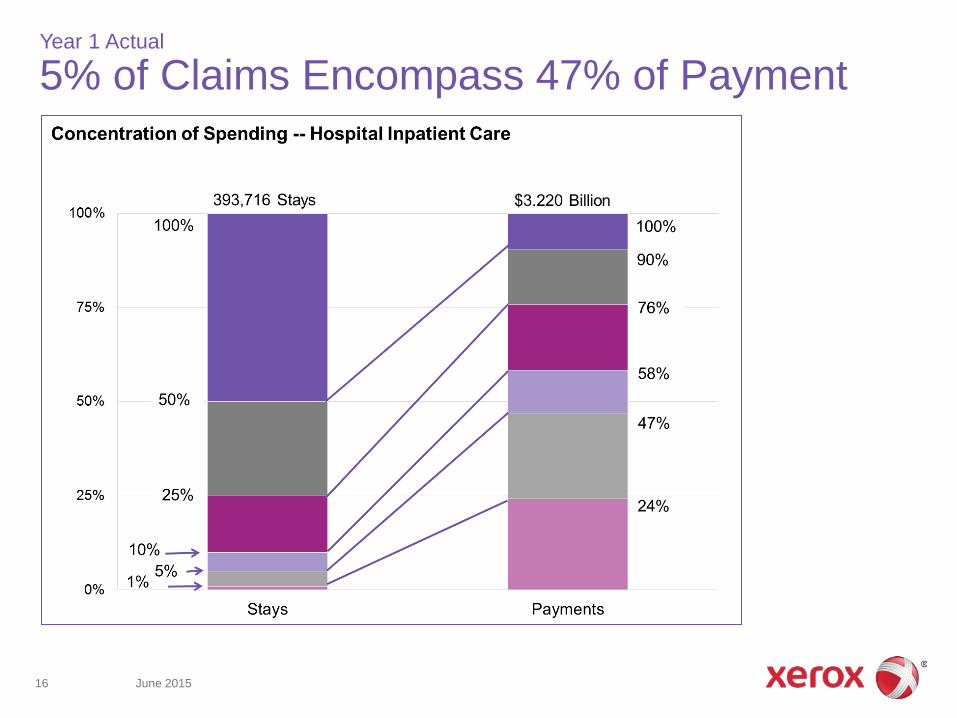
5% of Claims Encompass 47% of Payment
June 2015 16
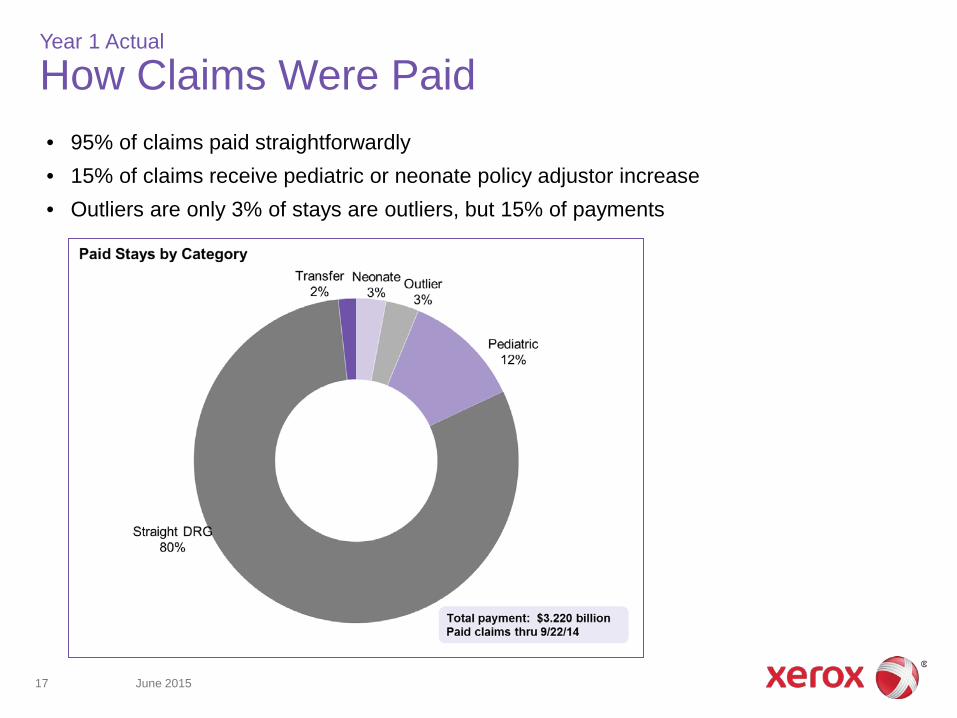
Year 1 Actual
How Claims Were Paid • 95% of claims paid straightforwardly • 15% of claims receive pediatric or neonate policy adjustor increase • Outliers are only 3% of stays are outliers, but 15% of payments
June 2015 17
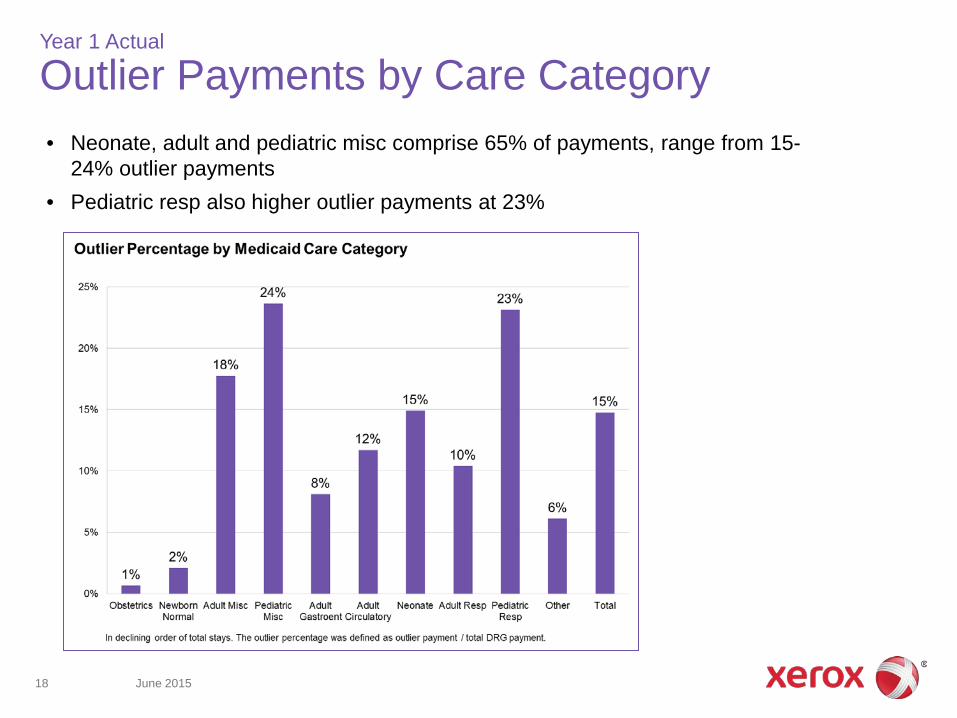
Year 1 Actual
Outlier Payments by Care Category • Neonate, adult and pediatric misc comprise 65% of payments, range from 15
24% outlier payments • Pediatric resp also higher outlier payments at 23%
June 2015 18
Year 1 Actual
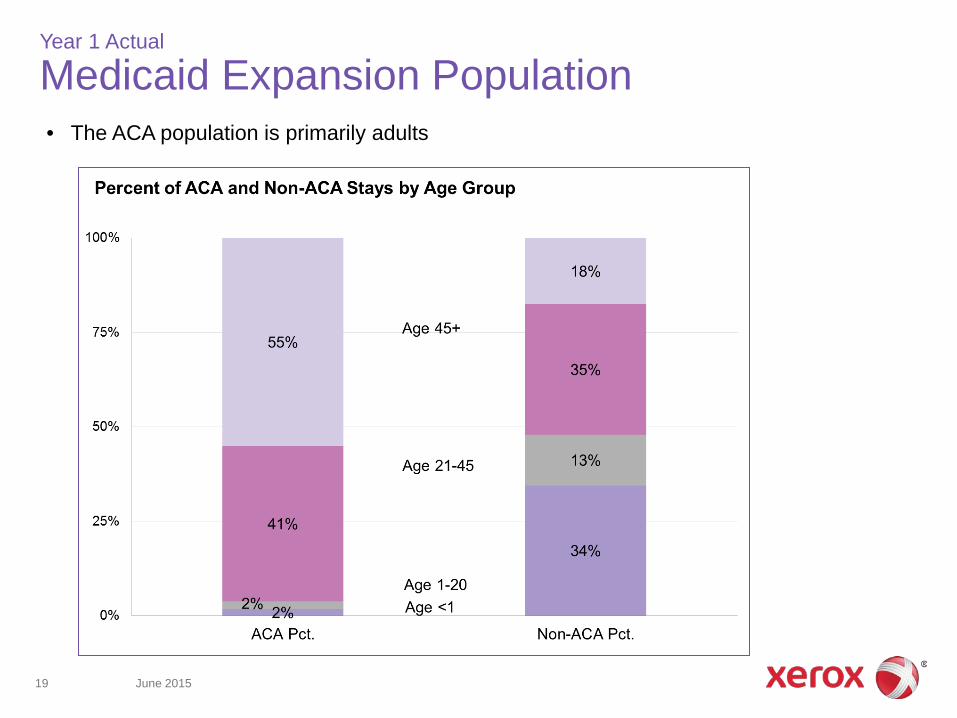
Medicaid Expansion Population • The ACA population is primarily adults
June 2015 19
Year 1 Actual
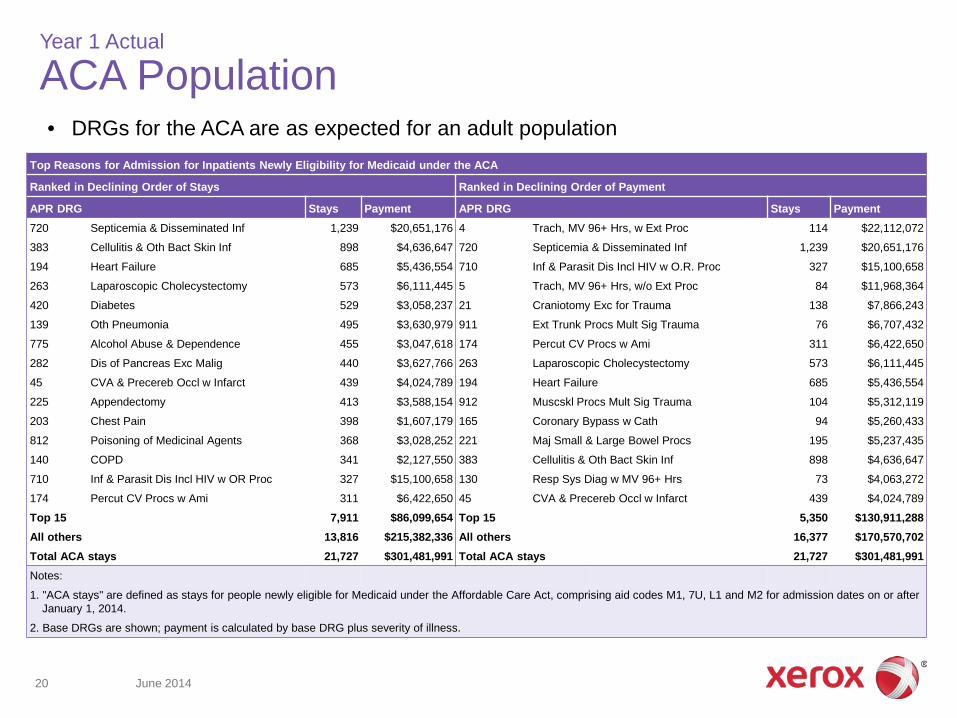
ACA Population • DRGs for the ACA are as expected for an adult population
June 2014 20
Top Reasons for Admission for Inpatients Newly Eligibility for Medicaid under the ACA
Ranked in Declining Order of Stays Ranked in Declining Order of Payment
- APR DRG Stays Payment - APR DRG Stays Payment 720 Septicemia & Disseminated Inf 1,239 $20,651,176 4 Trach, MV 96+ Hrs, w Ext Proc 114 $22,112,072
383 Cellulitis & Oth Bact Skin Inf 898 $4,636,647 720 Septicemia & Disseminated Inf 1,239 $20,651,176
194 Heart Failure 685 $5,436,554 710 Inf & Parasit Dis Incl HIV w O.R. Proc 327 $15,100,658
263 Laparoscopic Cholecystectomy 573 $6,111,445 5 Trach, MV 96+ Hrs, w/o Ext Proc 84 $11,968,364
420 Diabetes 529 $3,058,237 21 Craniotomy Exc for Trauma 138 $7,866,243
139 Oth Pneumonia 495 $3,630,979 911 Ext Trunk Procs Mult Sig Trauma 76 $6,707,432
775 Alcohol Abuse & Dependence 455 $3,047,618 174 Percut CV Procs w Ami 311 $6,422,650
282 Dis of Pancreas Exc Malig 440 $3,627,766 263 Laparoscopic Cholecystectomy 573 $6,111,445
45 CVA & Precereb Occl w Infarct 439 $4,024,789 194 Heart Failure 685 $5,436,554
225 Appendectomy 413 $3,588,154 912 Muscskl Procs Mult Sig Trauma 104 $5,312,119
203 Chest Pain 398 $1,607,179 165 Coronary Bypass w Cath 94 $5,260,433
812 Poisoning of Medicinal Agents 368 $3,028,252 221 Maj Small & Large Bowel Procs 195 $5,237,435
140 COPD 341 $2,127,550 383 Cellulitis & Oth Bact Skin Inf 898 $4,636,647
710 Inf & Parasit Dis Incl HIV w OR Proc 327 $15,100,658 130 Resp Sys Diag w MV 96+ Hrs 73 $4,063,272
174 Percut CV Procs w Ami 311 $6,422,650 45 CVA & Precereb Occl w Infarct 439 $4,024,789
Top 15 7,911 $86,099,654 Top 15 5,350 $130,911,288 All others 13,816 $215,382,336 All others 16,377 $170,570,702 Total ACA stays 21,727 $301,481,991 Total ACA stays 21,727 $301,481,991
Notes:
1. "ACA stays" are defined as stays for people newly eligible for Medicaid under the Affordable Care Act, comprising aid codes M1, 7U, L1 and M2 for admission dates on or after January 1, 2014.
2. Base DRGs are shown; payment is calculated by base DRG plus severity of illness.
Agenda
1. Medi-Cal DRG Background 2. Year 1 Actual 3. Year 3 Updates 4. Billing Points 5. Provider Education
June 2015 21
Year 3 Updates
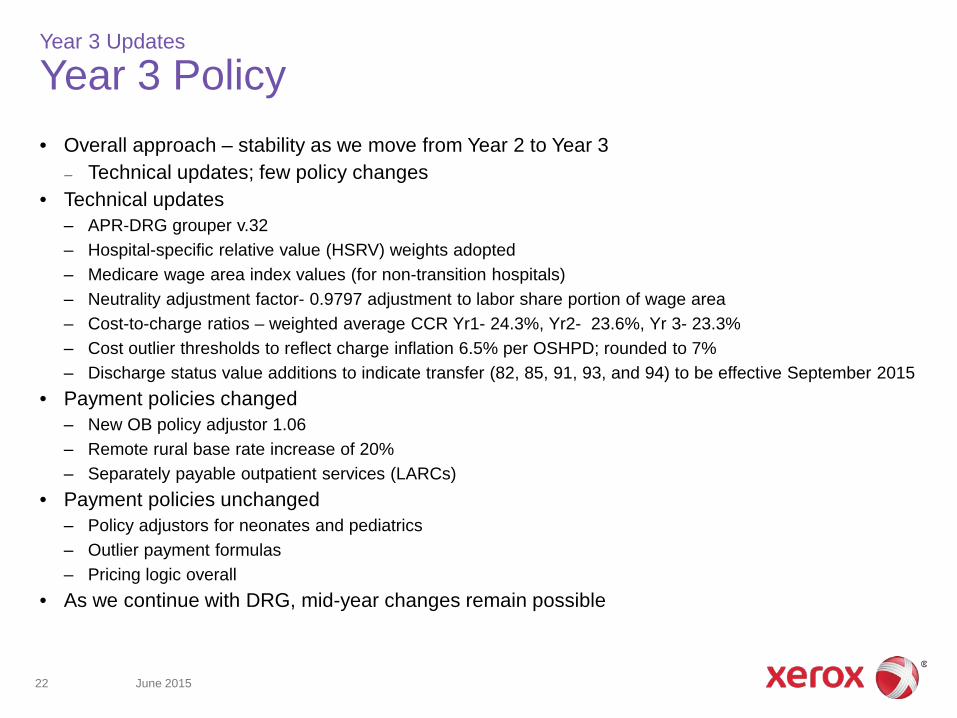
Year 3 Policy
• Overall approach – stability as we move from Year 2 to Year 3 – Technical updates; few policy changes
• Technical updates ‒ APR-DRG grouper v.32 ‒ Hospital-specific relative value (HSRV) weights adopted ‒ Medicare wage area index values (for non-transition hospitals) ‒ Neutrality adjustment factor- 0.9797 adjustment to labor share portion of wage area ‒ Cost-to-charge ratios – weighted average CCR Yr1- 24.3%, Yr2- 23.6%, Yr 3- 23.3% ‒ Cost outlier thresholds to reflect charge inflation 6.5% per OSHPD; rounded to 7% ‒ Discharge status value additions to indicate transfer (82, 85, 91, 93, and 94) to be effective September 2015
• Payment policies changed ‒ New OB policy adjustor 1.06 ‒ Remote rural base rate increase of 20% ‒ Separately payable outpatient services (LARCs)
• Payment policies unchanged ‒ Policy adjustors for neonates and pediatrics ‒ Outlier payment formulas ‒ Pricing logic overall
• As we continue with DRG, mid-year changes remain possible
June 2015 22
Year 3 Impacts
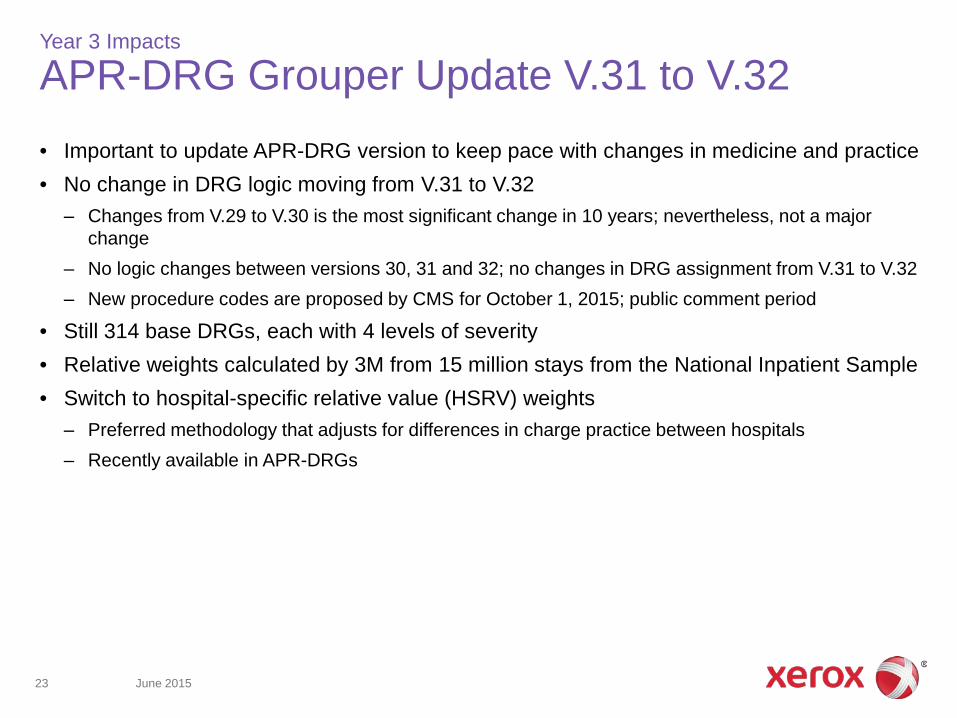
APR-DRG Grouper Update V.31 to V.32
• Important to update APR-DRG version to keep pace with changes in medicine and practice • No change in DRG logic moving from V.31 to V.32 ‒ Changes from V.29 to V.30 is the most significant change in 10 years; nevertheless, not a major
change ‒ No logic changes between versions 30, 31 and 32; no changes in DRG assignment from V.31 to V.32 ‒ New procedure codes are proposed by CMS for October 1, 2015; public comment period
• Still 314 base DRGs, each with 4 levels of severity • Relative weights calculated by 3M from 15 million stays from the National Inpatient Sample • Switch to hospital-specific relative value (HSRV) weights ‒ Preferred methodology that adjusts for differences in charge practice between hospitals ‒ Recently available in APR-DRGs
June 2015 23
Year 3 Updates
Key Payment Values
June 2015 24
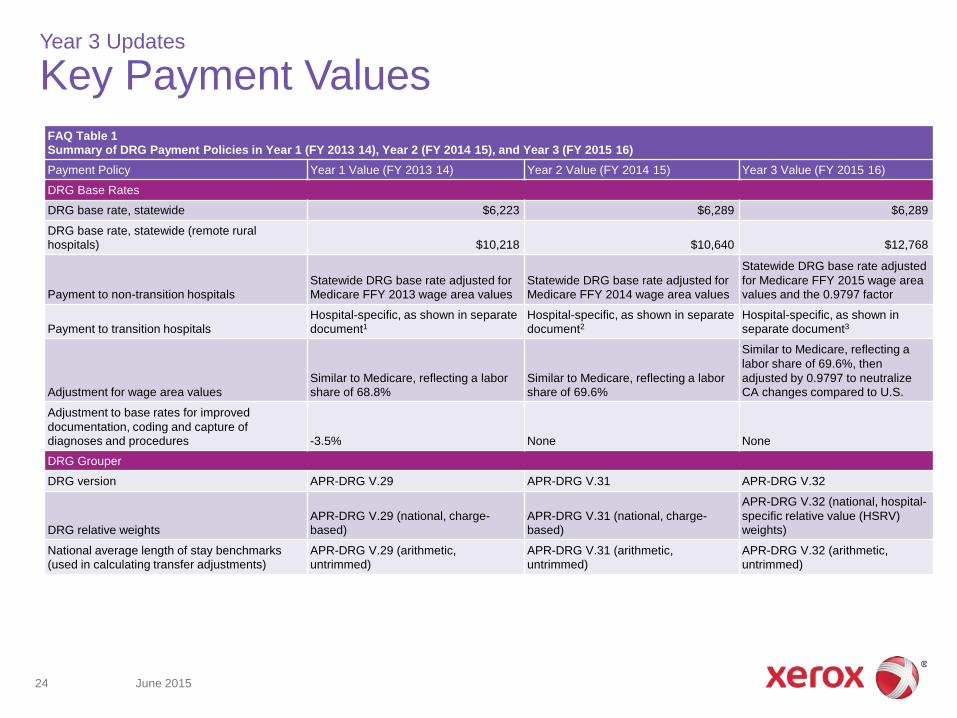
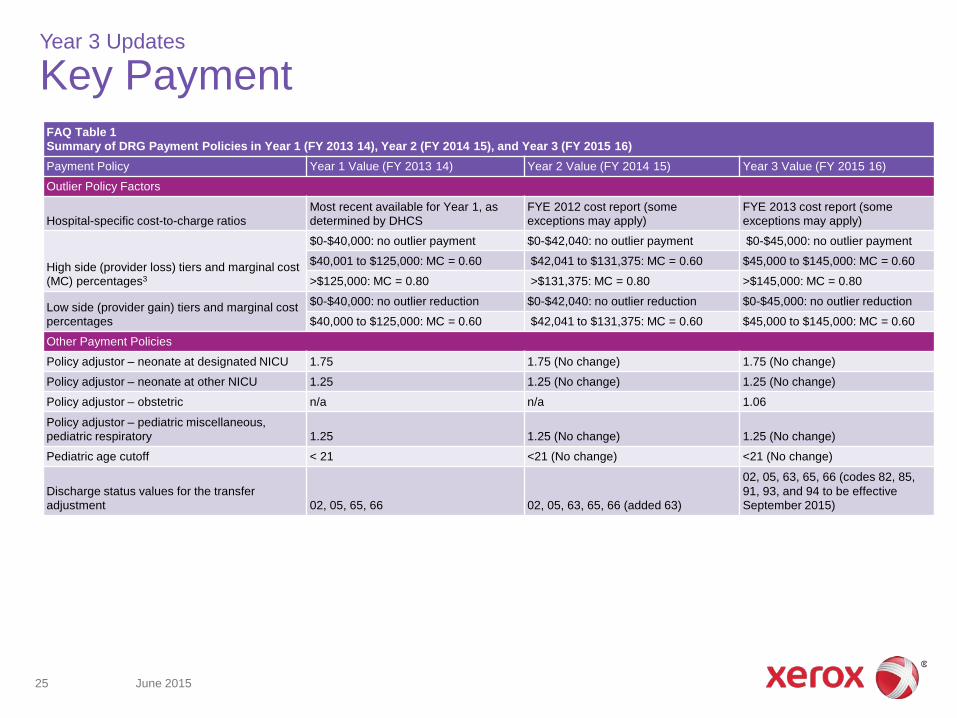
FAQ Table 1 - - - Summary of DRG Payment Policies in Year 1 (FY 2013 14), Year 2 (FY 2014 15), and Year 3 (FY 2015 16)
Payment Policy - Year 1 Value (FY 2013 14) - Year 2 Value (FY 2014 15) - Year 3 Value (FY 2015 16)
DRG Base Rates
DRG base rate, statewide $6,223 $6,289 $6,289
DRG base rate, statewide (remote rural hospitals) $10,218 $10,640 $12,768
Statewide DRG base rate adjusted Statewide DRG base rate adjusted for Statewide DRG base rate adjusted for for Medicare FFY 2015 wage area
Payment to non-transition hospitals Medicare FFY 2013 wage area values Medicare FFY 2014 wage area values values and the 0.9797 factor
Payment to transition hospitals Hospital-specific, as shown in separate Hospital-specific, as shown in separate Hospital-specific, as shown in
document1 document2 separate document3
Similar to Medicare, reflecting a labor share of 69.6%, then
Similar to Medicare, reflecting a labor Similar to Medicare, reflecting a labor adjusted by 0.9797 to neutralize Adjustment for wage area values share of 68.8% share of 69.6% CA changes compared to U.S.
Adjustment to base rates for improved documentation, coding and capture of
diagnoses and procedures -3.5% None None
DRG Grouper
DRG version APR-DRG V.29 APR-DRG V.31 APR-DRG V.32
APR-DRG V.32 (national, hospital- APR-DRG V.29 (national, charge- APR-DRG V.31 (national, charge- specific relative value (HSRV)
DRG relative weights based) based) weights)
National average length of stay benchmarks APR-DRG V.29 (arithmetic, APR-DRG V.31 (arithmetic, APR-DRG V.32 (arithmetic, (used in calculating transfer adjustments) untrimmed) untrimmed) untrimmed)
Year 3 Updates
Key Payment
June 2015 25
FAQ Table 1 - - - Summary of DRG Payment Policies in Year 1 (FY 2013 14), Year 2 (FY 2014 15), and Year 3 (FY 2015 16)
Payment Policy - Year 1 Value (FY 2013 14) - Year 2 Value (FY 2014 15) - Year 3 Value (FY 2015 16)
Outlier Policy Factors
Most recent available for Year 1, as FYE 2012 cost report (some FYE 2013 cost report (some Hospital-specific cost-to-charge ratios determined by DHCS exceptions may apply) exceptions may apply)
$0-$40,000: no outlier payment $0-$42,040: no outlier payment $0-$45,000: no outlier payment
High side (provider loss) tiers and marginal cost (MC) percentages3
$40,001 to $125,000: MC = 0.60
>$125,000: MC = 0.80
$42,041 to $131,375: MC = 0.60
>$131,375: MC = 0.80
$45,000 to $145,000: MC = 0.60
>$145,000: MC = 0.80
Low side (provider gain) tiers and marginal cost $0-$40,000: no outlier reduction $0-$42,040: no outlier reduction $0-$45,000: no outlier reduction
percentages $40,000 to $125,000: MC = 0.60 $42,041 to $131,375: MC = 0.60 $45,000 to $145,000: MC = 0.60
Other Payment Policies
Policy adjustor – neonate at designated NICU 1.75 1.75 (No change) 1.75 (No change)
Policy adjustor – neonate at other NICU 1.25 1.25 (No change) 1.25 (No change)
Policy adjustor – obstetric n/a n/a 1.06
Policy adjustor – pediatric miscellaneous, pediatric respiratory 1.25 1.25 (No change) 1.25 (No change)
Pediatric age cutoff < 21 <21 (No change) <21 (No change)
02, 05, 63, 65, 66 (codes 82, 85, Discharge status values for the transfer 91, 93, and 94 to be effective
adjustment 02, 05, 65, 66 02, 05, 63, 65, 66 (added 63) September 2015)
Year 3 Updates
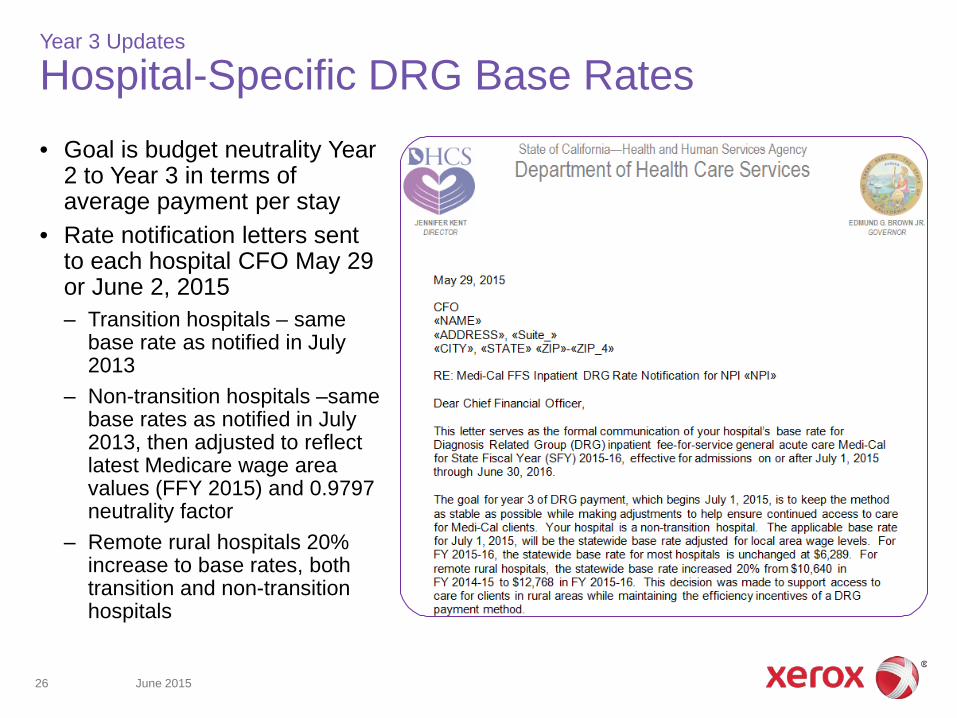
Hospital-Specific DRG Base Rates • Goal is budget neutrality Year
2 to Year 3 in terms of average payment per stay
• Rate notification letters sent to each hospital CFO May 29 or June 2, 2015 ‒ Transition hospitals – same
base rate as notified in July2013
‒ Non-transition hospitals –same base rates as notified in July2013, then adjusted to reflect latest Medicare wage area values (FFY 2015) and 0.9797 neutrality factor
‒ Remote rural hospitals 20%increase to base rates, both transition and non-transition hospitals
June 2015 26
Year 3 Updates
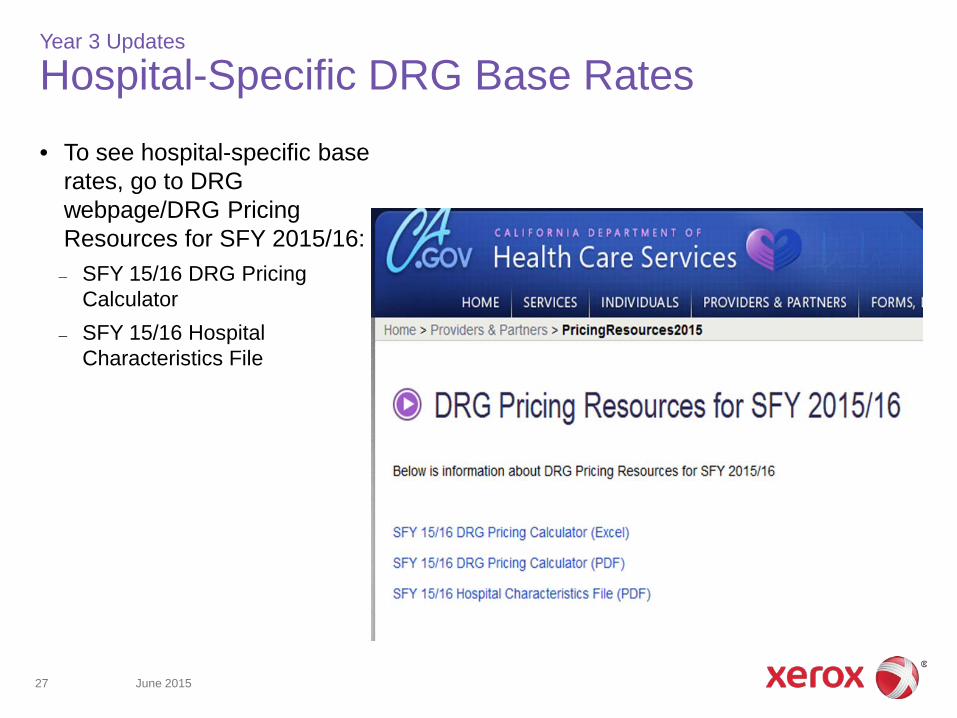
Hospital-Specific DRG Base Rates
• To see hospital-specific base rates, go to DRG webpage/DRG Pricing Resources for SFY 2015/16:
– SFY 15/16 DRG Pricing Calculator
– SFY 15/16 Hospital Characteristics File
June 2015 27
Year 3 Updates
Update Wage Area and Index Values • Policy is to follow Medicare • Applies to non-transition hospitals only in Year 3 • Labor share portion of cost updated by Medicare ‒ Now 69.6% in FFY 2015 ‒ Calculation (e.g., if statewide base rate = $6,289 and wage area index = 1.2477) ‒ 0.9797 neutrality adjustment factor new July 1, 2015, to neutralize CA impact relative to U.S ‒ ($6,289 x 0.696 x 1.2882 x 0.9797) + ($6,289 x 0. 304) = $7,436
• Each year the Medicare Impact File updates wage area assignments and index values for Medicare prospective payment hospitals ‒ www.cms.gov/Medicare/Medicare-Fee-for-Service-Payment/AcuteInpatientPPS/index.html ‒ For FFY 2015, most California hospitals saw an increase in the Medicare wage area value ‒ Medicare values for FFY 2014 (i.e., as of August 2013 final rule) ‒ For children’s hospitals, Medicare CAHs and others not listed on the Medicare Impact file, we
assign wage areas and index values by geographic location • Hospital-specific rehab rates are wage area adjusted each year, so the wage
area was also adjusted by the neutrality factor to calculate the rehab rates for FY 15-16.
June 2015 28
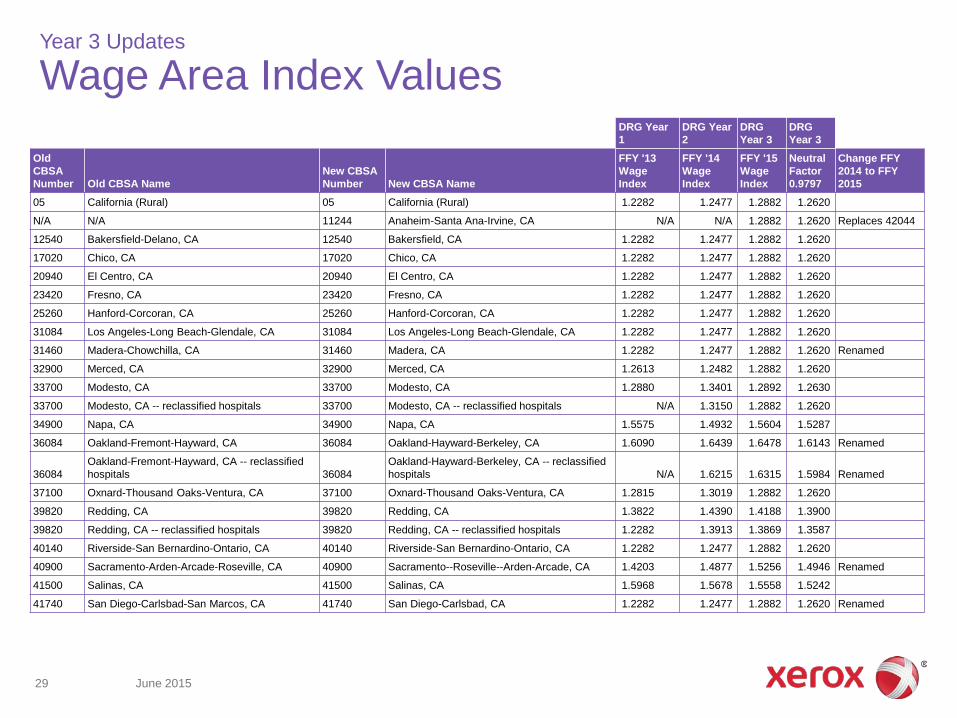
Year 3 Updates
Wage Area Index Values
June 2015 29
DRG Year 1
DRG Year 2
DRG Year 3
DRG Year 3
Old CBSA
Number Old CBSA Name New CBSA
Number New CBSA Name
FFY '13 Wage
Index
FFY '14 Wage
Index
FFY '15 Wage
Index
Neutral Factor 0.9797
Change FFY 2014 to FFY
2015 05 California (Rural) 05 California (Rural) 1.2282 1.2477 1.2882 1.2620
N/A N/A 11244 Anaheim-Santa Ana-Irvine, CA N/A N/A 1.2882 1.2620 Replaces 42044
12540 Bakersfield-Delano, CA 12540 Bakersfield, CA 1.2282 1.2477 1.2882 1.2620
17020 Chico, CA 17020 Chico, CA 1.2282 1.2477 1.2882 1.2620
20940 El Centro, CA 20940 El Centro, CA 1.2282 1.2477 1.2882 1.2620
23420 Fresno, CA 23420 Fresno, CA 1.2282 1.2477 1.2882 1.2620
25260 Hanford-Corcoran, CA 25260 Hanford-Corcoran, CA 1.2282 1.2477 1.2882 1.2620
31084 Los Angeles-Long Beach-Glendale, CA 31084 Los Angeles-Long Beach-Glendale, CA 1.2282 1.2477 1.2882 1.2620
31460 Madera-Chowchilla, CA 31460 Madera, CA 1.2282 1.2477 1.2882 1.2620 Renamed
32900 Merced, CA 32900 Merced, CA 1.2613 1.2482 1.2882 1.2620
33700 Modesto, CA 33700 Modesto, CA 1.2880 1.3401 1.2892 1.2630
33700 Modesto, CA -- reclassified hospitals 33700 Modesto, CA -- reclassified hospitals N/A 1.3150 1.2882 1.2620
34900 Napa, CA 34900 Napa, CA 1.5575 1.4932 1.5604 1.5287
36084 Oakland-Fremont-Hayward, CA 36084 Oakland-Hayward-Berkeley, CA 1.6090 1.6439 1.6478 1.6143 Renamed
36084 Oakland-Fremont-Hayward, CA -- reclassified
hospitals 36084 Oakland-Hayward-Berkeley, CA -- reclassified
hospitals N/A 1.6215 1.6315 1.5984 Renamed
37100 Oxnard-Thousand Oaks-Ventura, CA 37100 Oxnard-Thousand Oaks-Ventura, CA 1.2815 1.3019 1.2882 1.2620
39820 Redding, CA 39820 Redding, CA 1.3822 1.4390 1.4188 1.3900
39820 Redding, CA -- reclassified hospitals 39820 Redding, CA -- reclassified hospitals 1.2282 1.3913 1.3869 1.3587
40140 Riverside-San Bernardino-Ontario, CA 40140 Riverside-San Bernardino-Ontario, CA 1.2282 1.2477 1.2882 1.2620
40900 Sacramento-Arden-Arcade-Roseville, CA 40900 Sacramento--Roseville--Arden-Arcade, CA 1.4203 1.4877 1.5256 1.4946 Renamed
41500 Salinas, CA 41500 Salinas, CA 1.5968 1.5678 1.5558 1.5242
41740 San Diego-Carlsbad-San Marcos, CA 41740 San Diego-Carlsbad, CA 1.2282 1.2477 1.2882 1.2620 Renamed

Year 3 Updates
Wage Area Index Values DRG Year 1
DRG Year 2
DRG Year 3
DRG Year 3
Old CBSA Number Old CBSA Name
New CBSA Number New CBSA Name
FFY '13 Wage Index
FFY '14 Wage Index
FFY '15 Wage Index
Neutral Factor 0.9797
Change FFY 2014 to FFY 2015
41884 San Francisco-San Mateo-Redwood City, CA 41884 San Francisco-Redwood City-South San Francisco, CA 1.5889 1.6269 1.6738 1.6398 Renamed
41884 San Francisco-San Mateo-Redwood City, CA -reclassified hospitals N/A N/A 1.6356 N/A N/A
No reclassified hospitals in 2015
41940 San Jose-Sunnyvale-Santa Clara, CA 41940 San Jose-Sunnyvale-Santa Clara, CA 1.6801 1.6650 1.7180 1.6831
N/A N/A 41940 San Jose-Sunnyvale-Santa Clara, CA -reclassified hospitals N/A N/A 1.6962 1.6618
No reclassified hospitals in 2014
42020 San Luis Obispo-Paso Robles, CA 42020 San Luis Obispo-Paso Robles-Arroyo Grande, CA 1.2461 1.2477 1.2882 1.2620 Renamed
42020 San Luis Obispo-Paso Robles, CA -- reclassified hospitals 42020
San Luis Obispo-Paso Robles-Arroyo Grande, CA -- reclassified hospitals N/A 1.2559 1.2882 1.2620 Renamed
42044 Santa Ana-Anaheim-Irvine, CA N/A N/A 1.2282 1.2508 N/A N/A Moved to 11244
42044 Santa Ana-Anaheim-Irvine, CA -- reclassified hospitals N/A N/A N/A 1.2477 N/A N/A
Moved to 11244, no reclassified hospitals in 2015
N/A N/A 42034 San Rafael, CA N/A N/A 1.6855 1.6513 Split from 41884 42060 Santa Barbara-Santa Maria-Goleta, CA N/A N/A 1.2359 1.2488 N/A N/A Moved to 42200 42100 Santa Cruz-Watsonville, CA 42100 Santa Cruz-Watsonville, CA 1.7471 1.7276 1.7239 1.6889
N/A N/A 42100 Santa Cruz-Watsonville, CA -- reclassified hospitals N/A N/A 1.6928 1.6584
No reclassified hospitals in 2014
N/A N/A 42200 Santa Maria-Santa Barbara, CA N/A N/A 1.2882 1.2620 Replaces 42060 42220 Santa Rosa-Petaluma, CA 42220 Santa Rosa, CA 1.6082 1.6337 1.6188 1.5859 Renamed 44700 Stockton, CA 44700 Stockton-Lodi, CA 1.3148 1.3505 1.3579 1.3303 Renamed 46700 Vallejo-Fairfield, CA 46700 Vallejo-Fairfield, CA 1.5353 1.5749 1.6121 1.5794 47300 Visalia-Porterville, CA 47300 Visalia-Porterville, CA 1.2282 1.2477 1.2882 1.2620 49700 Yuba City, CA 49700 Yuba City, CA 1.2282 1.2477 1.2882 1.2620 Note: 1. CBSA = Core Based Statistical Area. FFY = Federal fiscal year (October-September) 2. Some hospitals in the Medicare Impact file have hospital-specific adjustments to their wage areas and do not match the values shown here. This table shows the wage area index values
for hospitals that do not have hospital-specific adjustments or are not in the Medicare Impact file.
June 2015 30

Agenda
1. Medi-Cal DRG Background 2. Year 1 Actual 3. Year 3 Updates 4. Billing Points 5. Provider Education
June 2015 31
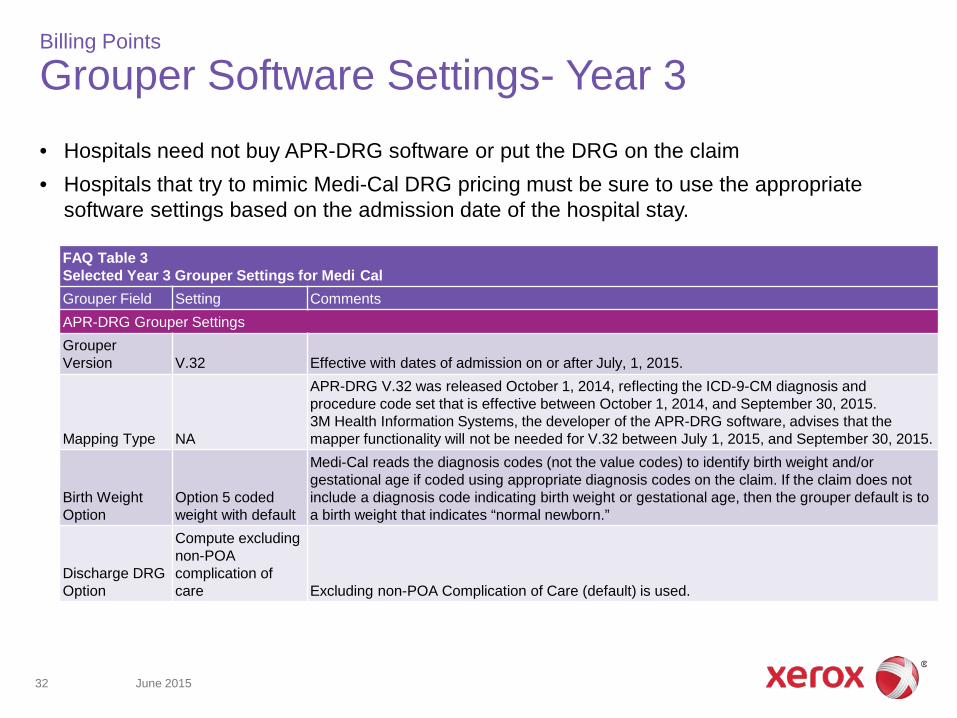
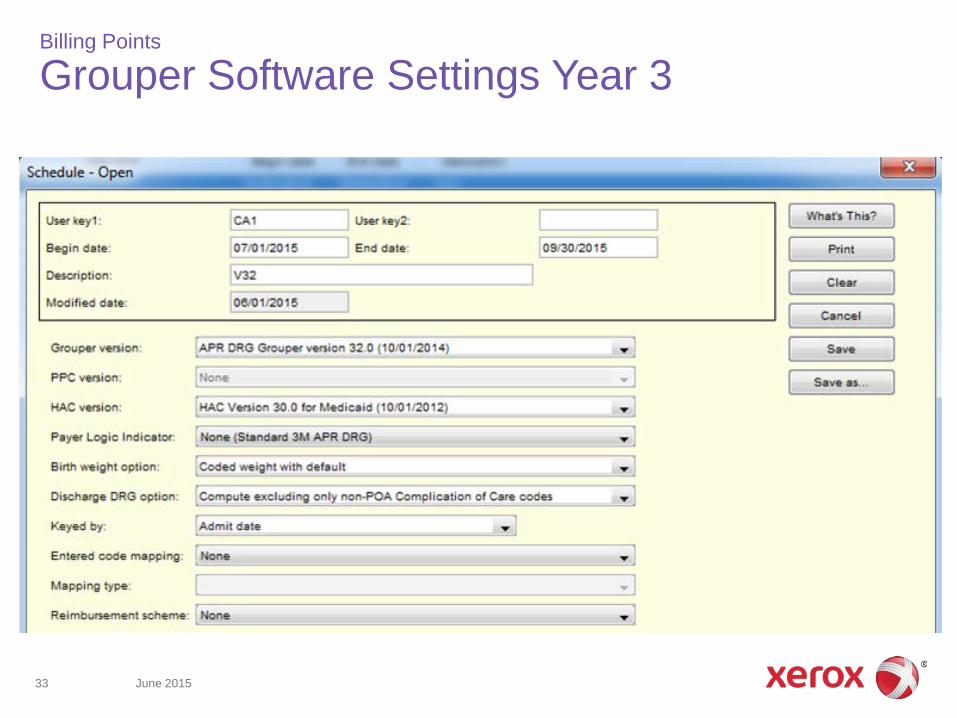
Billing Points
Grouper Software Settings- Year 3 • Hospitals need not buy APR-DRG software or put the DRG on the claim • Hospitals that try to mimic Medi-Cal DRG pricing must be sure to use the appropriate
software settings based on the admission date of the hospital stay.
June 2015 32
FAQ Table 3 -Selected Year 3 Grouper Settings for Medi Cal
Grouper Field Setting Comments APR-DRG Grouper Settings
Grouper Version V.32 Effective with dates of admission on or after July, 1, 2015.
APR-DRG V.32 was released October 1, 2014, reflecting the ICD-9-CM diagnosis and procedure code set that is effective between October 1, 2014, and September 30, 2015.
3M Health Information Systems, the developer of the APR-DRG software, advises that the Mapping Type NA mapper functionality will not be needed for V.32 between July 1, 2015, and September 30, 2015.
Medi-Cal reads the diagnosis codes (not the value codes) to identify birth weight and/or gestational age if coded using appropriate diagnosis codes on the claim. If the claim does not
Birth Weight Option 5 coded include a diagnosis code indicating birth weight or gestational age, then the grouper default is to Option weight with default a birth weight that indicates “normal newborn.”
Compute excluding non-POA
Discharge DRG complication of Option care Excluding non-POA Complication of Care (default) is used.
Billing Points
Grouper Software Settings Year 3
June 2015 33
Billing Points
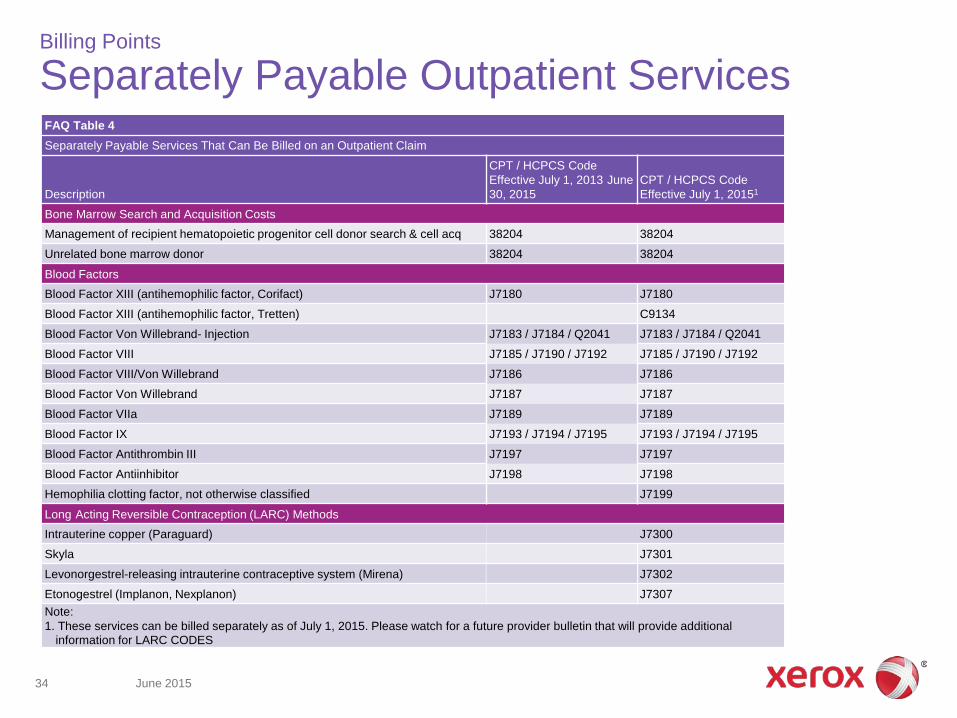
Separately Payable Outpatient Services
June 2015 34
FAQ Table 4 Separately Payable Services That Can Be Billed on an Outpatient Claim
CPT / HCPCS Code -Effective July 1, 2013 June CPT / HCPCS Code
Description 30, 2015 Effective July 1, 20151
Bone Marrow Search and Acquisition Costs Management of recipient hematopoietic progenitor cell donor search & cell acq 38204 38204
Unrelated bone marrow donor 38204 38204
Blood Factors Blood Factor XIII (antihemophilic factor, Corifact) J7180 J7180
Blood Factor XIII (antihemophilic factor, Tretten) C9134
Blood Factor Von Willebrand- Injection J7183 / J7184 / Q2041 J7183 / J7184 / Q2041
Blood Factor VIII J7185 / J7190 / J7192 J7185 / J7190 / J7192
Blood Factor VIII/Von Willebrand J7186 J7186
Blood Factor Von Willebrand J7187 J7187
Blood Factor VIIa J7189 J7189
Blood Factor IX J7193 / J7194 / J7195 J7193 / J7194 / J7195
Blood Factor Antithrombin III J7197 J7197
Blood Factor Antiinhibitor J7198 J7198
Hemophilia clotting factor, not otherwise classified J7199
- Long Acting Reversible Contraception (LARC) Methods Intrauterine copper (Paraguard) J7300
Skyla J7301
Levonorgestrel-releasing intrauterine contraceptive system (Mirena) J7302
Etonogestrel (Implanon, Nexplanon) J7307 Note:
1. These services can be billed separately as of July 1, 2015. Please watch for a future provider bulletin that will provide additional information for LARC CODES
Agenda
1. Medi-Cal DRG Background 2. Year 1 Actual 3. Year 2 Updates 4. Year 2 Impacts 5. Billing Points 6. Provider Education
June 2015 35
Provider Education
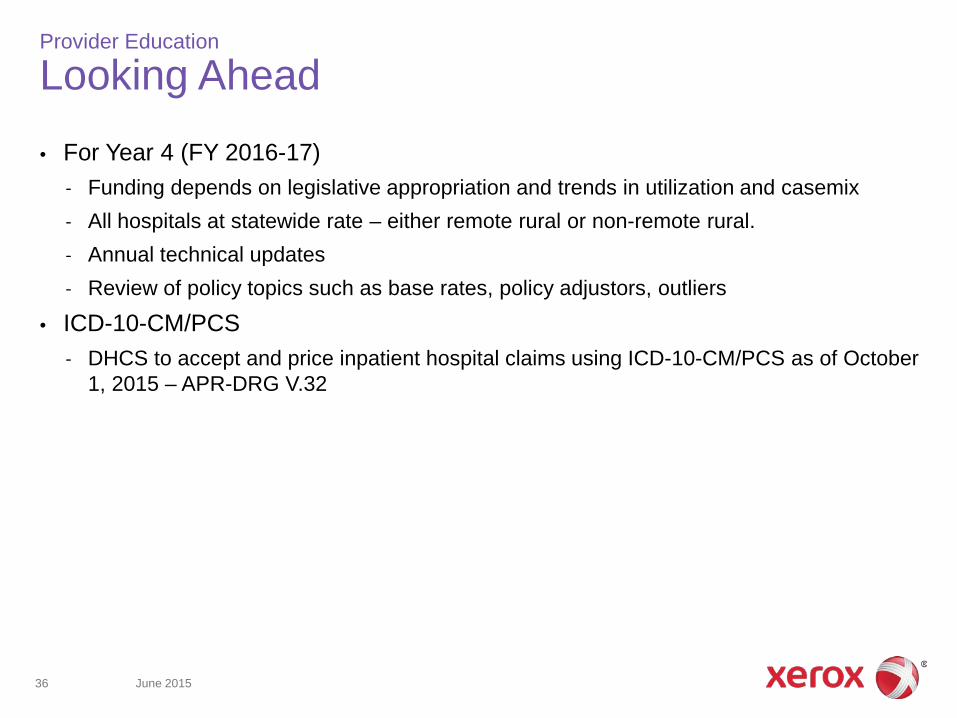
Looking Ahead • For Year 4 (FY 2016-17)
– Funding depends on legislative appropriation and trends in utilization and casemix – All hospitals at statewide rate – either remote rural or non-remote rural. – Annual technical updates – Review of policy topics such as base rates, policy adjustors, outliers
• ICD-10-CM/PCS – DHCS to accept and price inpatient hospital claims using ICD-10-CM/PCS as of October
1, 2015 – APR-DRG V.32
June 2015 36
Provider Education
Stay in Touch
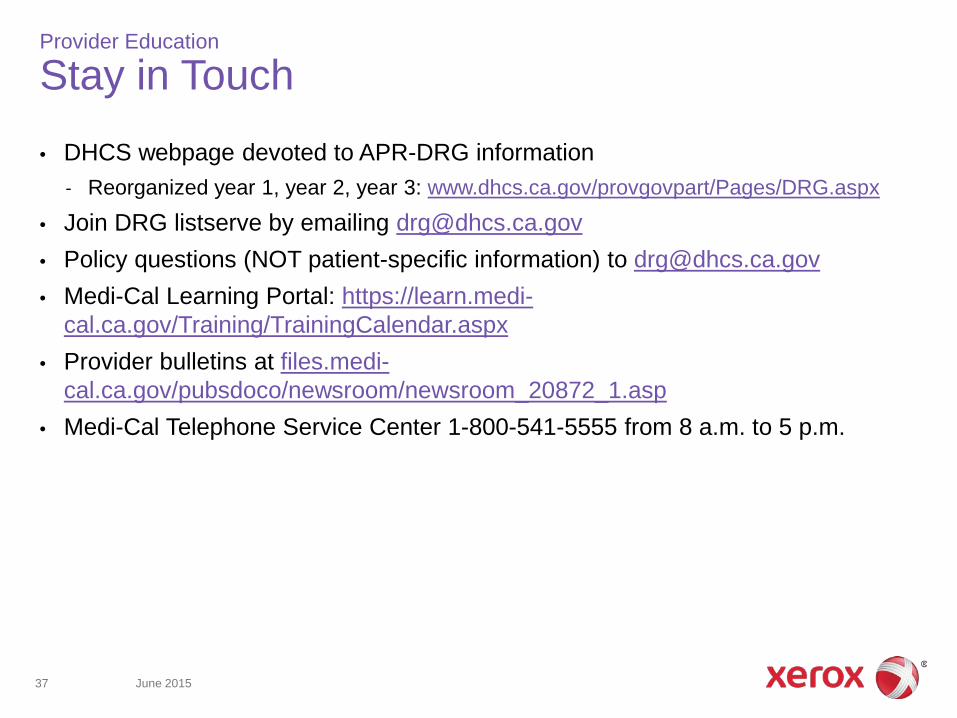
• DHCS webpage devoted to APR-DRG information – Reorganized year 1, year 2, year 3: www.dhcs.ca.gov/provgovpart/Pages/DRG.aspx
• Join DRG listserve by emailing [email protected] • Policy questions (NOT patient-specific information) to [email protected] • Medi-Cal Learning Portal: https://learn.medi
cal.ca.gov/Training/TrainingCalendar.aspx • Provider bulletins at files.medi
cal.ca.gov/pubsdoco/newsroom/newsroom_20872_1.asp • Medi-Cal Telephone Service Center 1-800-541-5555 from 8 a.m. to 5 p.m.
June 2015 37
For Further Information
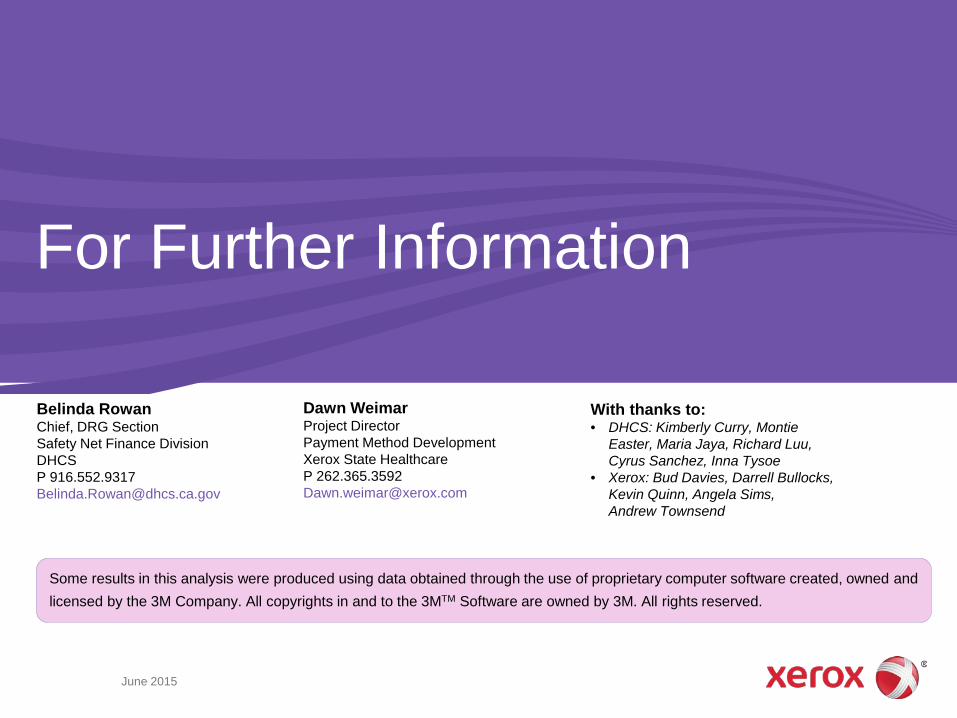
Belinda Rowan Chief, DRG Section Safety Net Finance Division DHCS P 916.552.9317 [email protected]
Dawn Weimar Project Director Payment Method Development Xerox State Healthcare P 262.365.3592 [email protected]
With thanks to: • DHCS: Kimberly Curry, Montie
Easter, Maria Jaya, Richard Luu, Cyrus Sanchez, Inna Tysoe
• Xerox: Bud Davies, Darrell Bullocks, Kevin Quinn, Angela Sims, Andrew Townsend
Some results in this analysis were produced using data obtained through the use of proprietary computer software created, owned and licensed by the 3M Company. All copyrights in and to the 3MTM Software are owned by 3M. All rights reserved.
June 2015