mechanistic study of the high- temperature fischer … · mechanistic study of the high-...
TRANSCRIPT

Mechanistic study of the high-temperature Fischer-Tropsch synthesis using transient kineticsGovender, N.S.
DOI:10.6100/IR689931
Published: 01/01/2010
Document VersionPublisher’s PDF, also known as Version of Record (includes final page, issue and volume numbers)
Please check the document version of this publication:
• A submitted manuscript is the author's version of the article upon submission and before peer-review. There can be important differencesbetween the submitted version and the official published version of record. People interested in the research are advised to contact theauthor for the final version of the publication, or visit the DOI to the publisher's website.• The final author version and the galley proof are versions of the publication after peer review.• The final published version features the final layout of the paper including the volume, issue and page numbers.
Link to publication
Citation for published version (APA):Govender, N. S. (2010). Mechanistic study of the high-temperature Fischer-Tropsch synthesis using transientkinetics Eindhoven: Technische Universiteit Eindhoven DOI: 10.6100/IR689931
General rightsCopyright and moral rights for the publications made accessible in the public portal are retained by the authors and/or other copyright ownersand it is a condition of accessing publications that users recognise and abide by the legal requirements associated with these rights.
• Users may download and print one copy of any publication from the public portal for the purpose of private study or research. • You may not further distribute the material or use it for any profit-making activity or commercial gain • You may freely distribute the URL identifying the publication in the public portal ?
Take down policyIf you believe that this document breaches copyright please contact us providing details, and we will remove access to the work immediatelyand investigate your claim.
Download date: 20. Jun. 2018

Mechanistic study of the High-
Temperature Fischer-Tropsch
Synthesis using transient kinetics
PROEFSCHRIFT
ter verkrijging van de graad van doctor aan de
Technische Universiteit Eindhoven, op gezag van de
Rector Magnificus, prof.dr.ir. C.J. van Duijn, voor een
commissie aangewezen door het College voor
Promoties in het openbaar te verdedigen
op maandag 15 November 2010 om 16.00 uur
door
Nilenindran Sundra Govender
geboren te Durban, Zuid-Afrika

Dit proefschrift is goedgekeurd door de promotor:
prof.dr.ir. J.C. Schouten
Copromotor:
dr. M.H.J.M. de Croon
A catalogue record is available from the Library Eindhoven University of Technology
ISBN: 978-90-386-2340-5
Copyright © 2010 by Nilenindran Sundra Govender
Printed by Ridderprint BV, Ridderkerk, The Netherlands
Cover page design by Gideon Botes and Nilenindran Sundra Govender
Image Credit: T.A. Rector and B.A. Wolpa, NOAO, AURA, and NSF.

Dedicated to my wife, Ashriti and daughter, Suhina.


CONTENTS
Summary
Samenvatting
1. Introduction………………………………………………………………………….....1
2. Experimental methodology and model development…………………………………23
3. Reactivity of surface carbonaceous intermediates on an iron based
Fischer-Tropsch catalyst………….…………………………………………………..45
4. Mechanistic pathway for methane formation over an iron based catalyst……………75
5. Effects of co-fed ethylene during the high temperature Fischer-Tropsch synthesis….95
6. Mechanistic pathway for C2+ hydrocarbon formation over an iron based catalyst….115
7. A comparative study of CO and CO2 hydrogenation on Fe catalysts…………….....141
8. Conclusions and Outlook……………………………………………………………163
Nomenclature
Appendix A: The gPROMs modeling language
Appendix B: Fischer-Tropsch product distribution models schemes as published
in the open literature
Appendix C: Model equations for the 13CO-labelling of C2+ hydrocarbons for
models B and C (see Chapter 6)
Appendix D: Relationship between the reaction mechanism and isotopic decay
plots from SSITKA data
Acknowledgements
List of publications
About the author


Summary
Mechanistic study of the High- Temperature
Fischer-Tropsch Synthesis using transient
kinetics
The Fischer-Tropsch synthesis (FTS) is a heterogeneously catalysed process
whereby synthesis gas (a mixture of carbon monoxide and hydrogen) is converted to
liquid fuels (gasoline and diesel) and chemicals. There are two modes of operation
for the Fischer-Tropsch synthesis, each with its specific selectivity targets. The high
temperature (300–350 C) Fischer-Tropsch process (HTFT) aims at the production of
gasoline and linear low molecular mass olefins, whereas the low temperature (200–
240 C) Fischer-Tropsch process (LTFT) is used for the production of diesel and
high molecular mass linear waxes. The HTFT process comprises a complex network
of elementary reaction steps. Apart from the usual linear FT products (olefins and
paraffins), these steps include the formation of CO2, carbon, branched products,
aromatics and oxygenates (alcohols, acids, aldehydes and ketones). To date, the
product distribution of the HTFT process has not been fully described by the
mechanisms in the literature. This thesis employs isotopic techniques to elucidate the
mechanism of the HTFT process.
The Steady-State Isotopic Transient Kinetic Analysis (SSITKA) technique was
mainly used in this thesis. This method keeps the catalyst under steady-state
conditions and introduces an isotopic transient by abruptly replacing one reactant
with its isotope (e.g. H2/12CO/Ar H2/
13CO/He) with minimum disturbance to the
system. The inert gas is also switched to determine the gas hold-up in the reactor.
Apart from isothermal and isobaric reactor conditions, the surface composition of the
catalyst does not change during SSITKA, making this technique ideal for reaction
mechanistic studies. The methodology included the solution of ordinary differential
equations (or ODE’s) which were mole balances written for the labeled atom (in this

thesis, mainly 13C from 13CO SSITKA experiments) and for a plug flow reactor at
isobaric and isothermal conditions.
Two reaction mechanisms for the methanation reaction were proposed, using the
SSITKA technique over an Fe-based catalyst at HTFT conditions (330 C, 1.2 bar,
and H2/CO = 15). Both mechanisms have two active pools of carbon (C and C) on
the catalyst surface with both leading towards the formation of methane and higher
hydrocarbons. The C pool was 25 to 50 times less active than the C pool for
methanation and occupied 92% of the total CHx coverage (0.25 ML). The C-C
coupling reaction was shown to involve both the C and C pools. Another important
conclusion from this study was that the concentration of molecularly adsorbed CO on
the Fe-based catalyst is extremely low, with an estimated surface coverage of 9 10-4
ML.
Deuterium tracing experiments in combination with hydrogenation experiments
(both isothermal and temperature programmed) provided information on the nature
and reactivity of the surface intermediates on an Fe-based catalyst at HTFT
conditions. This was performed on both fresh and carbided catalysts. On both
catalysts, carbon deposition occurred to the same extent but water formation and
methane formation were faster on the carbided catalyst. More reaction intermediates
for C2 hydrocarbon formation were detected at the start of the Fischer-Tropsch
reaction on the freshly reduced catalyst. However, the CHs intermediate for methane
formation and the CCHs intermediate for C2 hydrocarbon formation were found to be
the most stable surface intermediates on both catalysts. Surface carbon (13Cs),
deposited via the Boudouard reaction using 13CO, was active and was detected in the
C2+ hydrocarbon products as the result of a coupling reaction with 12Cs rather than
with 13Cs. Six distinct carbon pools (Cα1, Cα2, Cβ1, Cγ1, Cγ2 and Cδ1) were identified
during isothermal and temperature programmed surface reactions of which graphitic
carbon (Cδ1) had the highest coverage on the end of the run sample.
The effect of co-fed ethene on the Fischer-Tropsch synthesis was also
investigated. The main aim was to identify reaction pathways for readsorbed olefins.
Steady state results (at 330°C, 1.2 bar, H2/CO = 15 and 7580 ml.gcat-1.hr-1) showed

that the hydrogenation of ethene to ethane is the main reaction pathway but chain
growth does occur to a lesser extent. Repeating these co-fed ethene experiments at
the same reaction conditions but with 13CO in the feed showed that in terms of chain
growth, propene formation was favoured instead of propane. This suggests that the
olefins share the same surface intermediate. This result allowed for the development
of different mechanistic pathways for olefin and paraffin formation, which were later
used for the development of the FT mechanisms.
The mechanism of the methanation reaction pathway was extended to account for
the formation of C2+ hydrocarbons at the same reaction conditions. Three different
mechanistic models were tested whilst considering two cases; in the first case, the
initiation and chain growth rates coefficients are equal (kini = kp) and in the second
case, these rate coefficients differ (kini ≠ kp). Only one model, in which there are two
surface intermediates for the Cn hydrocarbons (n ≥ 2) with direct olefin readsorption
towards the surface intermediate for paraffin formation, gave the best fit.
The hydrogenation of CO2 was investigated and compared to CO hydrogenation
(normal Fischer-Tropsch synthesis) over an iron based catalyst at high temperature
(330 C). In comparison to CO hydrogenation, the catalyst activity, deactivation and
olefinicity were the same during CO2 hydrogenation at similar reactor operating
conditions, especially the H2/CO ratio. However, the transients obtained during 13CO
and 13CO2 SSITKA experiments differ in both cases. During CO2 hydrogenation, the
reactant and product (CO2 and CO) became kinetically indistinguishable. From some
of the data, a two pool model was proposed based on the shape of the 13C decay in 13CO2. A formate mechanism, in which CHOs and COOHs are the surface
intermediates during the water-gas-shift reaction, is the most plausible for the water-
gas-shift mechanism.
The hypothesis in this thesis was that Cs is active and should play a role in the
mechanism of the HTFT process. This was shown to be true (see Chapter 3) with the 13CO deposition (Boudouard reaction) experiment in which the 13Cs was active for
Fischer-Tropsch. Moreover, in the deuterium tracing experiment, CCHs was
identified as an active species for C2 formation. This intermediate most probably

forms from the reaction of Cs and CHs. The latter intermediate is most likely the
monomer in the HTFT process.

Samenvatting
De Fischer-Tropsch synthese (FTS) is een heterogeen-gekatalyseerd proces waarin
synthesegas, een mengsel van koolmonoxide en waterstof, wordt omgezet in
vloeibare brandstoffen (benzine en diesel) en chemicaliën. Er zijn twee manieren
waarop de Fischer-Tropsch synthese kan worden uitgevoerd, waarbij elk een
specifieke selectiviteit tot doel heeft. Het hoge temperatuur Fischer-Tropsch proces
(HTFT, T = 300 -350 C) richt zich op de productie van benzine en lineaire olefines
met lage moleculaire massa, terwijl het lage temperatuur proces (LTFT, T = 200 –
240 C) wordt gebruikt voor de productie van diesel en lineaire wassen met een hoge
moleculaire massa. Het HTFT-proces bestaat uit een complex netwerk van
elementaire reactiestappen. Naast de vorming van de gebruikelijke FTS producten,
zoals olefines en parafines, worden in deze reactiestappen ook CO2, koolstof,
vertakte producten, aromaten en zuurstofhoudende producten, zoals alcoholen, zuren,
aldehydes en ketonen gevormd. Momenteel kan de productverdeling van het HTFT-
proces nog niet volledig worden beschreven met de in de literatuur voorhanden
zijnde mechanismes. Dit proefschrift maakt gebruik van isotooptechnieken om het
mechanisme van het HTFT-proces op te helderen.
In dit proefschrift is vooral gebruik gemaakt van de Steady-State Isotopic
Transient Kinetic Analysis (SSITKA) techniek. In deze methode wordt de katalysator
onder stationaire condities gehouden en wordt een isotooptransiënt geïntroduceerd
door het abrupt vervangen van één van de reactanten door zijn isotoop (bijv.
H2/12CO/Ar H2/
13CO/He) met daarbij een minimale verstoring van het systeem.
Daarbij wordt ook een inert gas in- respectievelijk uitgeschakeld ten einde de
ruimtetijd van het gas in de reactor te bepalen. Onder isotherme en isobare
reactorcondities verandert de oppervlaksamenstelling van de katalysator niet tijdens
het SSITKA-experiment. Dit maakt deze techniek dan ook ideaal voor
mechanistische studies van reacties. De werkwijze behelst het oplossen van gewone
differentiaalvergelijkingen (of ODEs), die de molbalansen zijn voor de gelabelde
atomen (in dit proefschrift vooral 13C uit 13CO SSITKA-experimenten) voor het geval
van een propstroomreactor bij isobare en isotherme condities.

Op basis van de resultaten verkregen met de SSITKA-techniek voor een
ijzerkatalysator bij HTFT-condities (330 C, 1.2 bar en H2/CO = 15) zijn twee
reactiemechanismen voorgesteld. Beide mechanismes hebben twee actieve
koolstofpoelen (C en C) op het katalysatoroppervlak. Beide leiden tot de vorming
van methaan en hogere koolwaterstoffen. De C-poel was 25 tot 50 keer minder
actief dan de C-poel voor methaanvorming. Hij bevat 92% van de totale CHx-
bezetting (0.25 ML). Er is aangetoond dat zowel de C- als de C-poel betrokken zijn
bij de C-C koppelingsreactie. Een andere belangrijke conclusie van dit onderzoek is
dat de concentratie van moleculair-geadsorbeerd CO op de ijzerkatalysator extreem
laag is, met een geschatte oppervlaktebezetting van 9 10-4 ML.
Tracing-experimenten met deuterium in combinatie met zowel isotherme als
temperatuur-geprogrammeerde hydrogeneringsexperimenten verschaften informatie
over de aard en reactiviteit van de oppervlakintermediairen op een ijzerkatalysator bij
HTFT-condities. Deze experimenten zijn uitgevoerd zowel met verse als met
gecarbidiseerde katalysator. Op beide katalysatoren komt koolstofdepositie in gelijke
mate voor, maar watervorming en methaanvorming verlopen sneller bij de
gecarbidiseerde katalysator. Meerdere reactie-intermediairen voor de vorming van
C2- koolwaterstoffen werden gedetecteerd bij het begin van de Fischer-Tropsch
reactie over de vers-gereduceerde katalysator. Het CHs-intermediair voor de
methaanvorming en het CCHs-intermediair voor de C2-koolwaterstofvorming blijken
echter de stabielste intermediairen op beide katalysatoren. Oppervlakkoolstof (13Cs),
gedeponeerd door middel van de Boudouard reactie met 13CO, is actief en wordt
gedetecteerd in de C2+-koolwaterstofproducten als het resultaat van een
koppelingsreactie met 12Cs in plaats van met 13Cs. Zes duidelijk onderscheidbare
koolstofpoelen (Cα1, Cα2, Cβ1, Cγ1, Cγ2 en Cδ1) zijn geïdentificeerd gedurende
isotherme en temperatuur-geprogrammeerde oppervlakreacties. Grafitische koolstof
(Cδ1) heeft de hoogste bezetting op de gebruikte katalysator.
Ook het effect van het bijvoeden van etheen op het Fischer-Tropsch proces is
onderzocht. Het belangrijkste doel was het identificeren van reactiepaden voor
gereadsorbeerde olefines. Resultaten van stationaire experimenten (bij 330°C, 1.2
bar, H2/CO = 15 en 7580 ml.gcat-1.hr-1) laten zien dat de hydrogenering van etheen tot

ethaan het belangrijkste reactiepad is, maar dat ketengroei in mindere mate ook
optreedt. Herhaling van deze experimenten met etheenbijvoeding onder dezelfde
reactiecondities, maar met 13CO in de voeding, laat zien dat in termen van ketengroei
meer propeenvorming optreedt dan propaanvorming. Dit suggereert eenzelfde
oppervlakintermediair voor de olefines. Het resultaat bood de mogelijkheid
verschillende mechanistische paden te ontwikkelen voor de vorming van olefines en
paraffines, die vervolgens konden worden gebruikt voor de ontwikkeling van
mechanismes voor Fischer-Tropsch synthese.
Het mechanisme voor de methaanvorming is uitgebreid om rekening te kunnen
houden met de vorming van C2+-koolwaterstoffen bij dezelfde reactiecondities. Drie
verschillende mechanistische modellen zijn getest. Daarbij zijn twee gevallen
beschouwd. In het eerste geval zijn de reactiesnelheidcoëfficiënten voor initiatie en
ketengroei gelijk gesteld (kini = kp), in het tweede geval zijn ze verschillend genomen
(kini ≠ kp). Slechts één model gaf een goede fit aan de data. In dit model zijn er twee
oppervlakintermediairen voor Cn-koolwaterstoffen (n ≥ 2) en treedt er een directe
olefine-readsorptie op, die leidt tot het oppervlakintermediair voor paraffinevorming.
De hydrogenering van CO2 is onderzocht en er is een vergelijking gemaakt met
CO-hydrogenering, d.w.z. normale Fischer-Tropsch synthese, over een
ijzerkatalysator bij hoge temperatuur (330 °C). In vergelijking met CO-
hydrogenering zijn de katalysatoractiviteit, de deactivering en de selectiviteit naar
olefines hetzelfde voor CO2-hydrogenering bij gelijke bedrijfscondities van de
reactor en speciaal bij gelijke H2/CO verhouding. De transiënte data, verkregen via 13CO- en 13CO2-SSITKA experimenten, zijn echter verschillend in beide gevallen.
Tijdens CO2-hydrogenering worden reactant en product (CO2 en CO) kinetisch
ononderscheidbaar. Op grond van een beperkt aantal data is een model voorgesteld
met twee intermediairen. Dit model is gebaseerd op de vorm van het 13C-verval in
CO2. Een formaat-mechanisme met CHOs en COOHs als oppervlakintermediairen bij
de watergasshift is het meest waarschijnlijke mechanisme voor deze reactie.
De hypothese in dit proefschrift was dat Cs actief is een rol speelt in het
mechanisme van het HTFT-proces. In Hoofdstuk 3 is aangetoond dat dit correct is

door middel van een 13CO-disproportioneringsexperiment (Boudouard reactie),
waarin het 13Cs-species actief is in de Fischer-Tropsch synthese. Bovendien is met
een tracing-experiment met deuterium CCHs geïdentificeerd als een actief species
voor C2-vorming. Dit intermediair wordt hoogstwaarschijnlijk gevormd via de reactie
van Cs en CHs. Het CHs-intermediair komt het meest in aanmerking voor het
monomeer in het HTFT-proces.

1 Introduction
1.1. The Fischer-Tropsch process
Fischer-Tropsch synthesis is a heterogeneously catalysed process whereby
synthesis gas (a mixture of carbon monoxide and hydrogen) is converted to a
range of alkenes, alkanes and oxygenated compounds. Synthesis gas can be
produced from carbon-based materials such as coal, biomass, refinery
bottoms and natural gas. Hence, the Fischer-Tropsch synthesis can be
considered as an alternate to crude oil for the production of liquid fuels
(gasoline and diesel) and chemicals [1].
There are a number of metals, which have sufficient activity in the Fischer-
Tropsch synthesis for industrial application, such as iron, cobalt, nickel and
ruthenium [2,3]. Nickel is, however, too hydrogenating, resulting in high CH4
yields whereas ruthenium is rare and too expensive for use in large scales.
Therefore, only iron and cobalt-based catalysts are being used in commercial
Fischer-Tropsch plants.
There are currently two modes of operation for the Fischer-Tropsch
synthesis, each with its specific selectivity targets. The high temperature
(300–350ºC) Fischer-Tropsch process (HTFT) aims at the production of
gasoline and linear low molecular mass olefins whereas the low temperature
1

Introduction
(200–240ºC) Fischer-Tropsch process (LTFT) is used for the production of
diesel and high molecular mass linear waxes [4].
The Fischer-Tropsch reaction yields a wide spectrum of hydrocarbons and
oxygenated compounds [5]. These reactions producing water as a co-product
can stoichiometrically be written as:
Methanation 3H2 + CO CH4 + H2O
Paraffins (2n + 1)H2 + nCO CnH2n + 2 + nH2O
Olefins 2nH2 + nCO CnH2n + nH2O
Methanol 2H2 + CO CH3OH
Higher Alcohols 2nH2 + nCO CnH2n + 1OH + (n-1)H2O
The formation of methane is a limiting case in the Fischer-Tropsch
synthesis, in which the formation of the C-C bond does not occur. Olefins and
paraffins are the major products of the Fischer-Tropsch synthesis. The
formation of oxygenated compounds, such as alcohols, is observed to some
extent during the Fischer-Tropsch synthesis [5].
Water can react further in the water gas shift reaction yielding carbon dioxide.
H2O + CO CO 2 + H2
Other reactions that may occur under the conditions of the Fischer-Tropsch
synthesis are:
Carbon deposition H2 + CO C + H2O
2

Chapter 1
Boudouard reaction 2CO C + CO2
Carbide formation xM + C MxC
The Fischer-Tropsch synthesis is currently commercially applied at five
different locations in the world, i.e. Sasolburg, Secunda, and Mossel Bay (all
in South Africa), Bintulu (Malaysia) and Ras Lafan (Qatar). Brief details of
these plants are presented in Figure 1.1. Both Sasol and Shell are continuing to
invest in new FT plants. Sasol is planning to start-up its new Gas-to-Lquids
(GTL) plant in Nigeria in December 2010 (with capacity of 34 000 bpd)
whilst Shell has announced their start-up of a 70 000 bpd plant in Qatar in
2010 with the expansion to 140 000 bpd later on. There has also been interest
in FT technology from countries with huge coal reserves such as India, China
and the US, all wanting their economies to become less dependent on oil
imports. The renewed interest in the Fischer-Tropsch process is also related to
the recent high crude oil prices as shown in Figure 1.2.
Sasol 2 & 3, Secunda, SA160 000 bpd, Fe-based
catalyst,HTFT, SAS reactors
PetroSA, Mosselbay, SA36 000 bpd, Fe-base catalyst
HTFT, Circulating Fluidised Bed reactor
Sasol 1, Sasolburg, SA5000 bpd, Fe-based catalyst, LTFT, Slurry Phase & Fixed
bed reactors
Sasol and Qatar, Ras Laffan, Qatar34 000 bpd, Co-based catalyst, LTFT, Slurry Phase reactors
Shell, Bintulu, Malaysia14 700 bpd, Co-based catalyst, LTFT, Fixed
bed reactor
Figure 1.1: Current operating commercial Fischer-Tropsch plants worldwide. Sources: http://www.petrosa.co.za/, www.shell.com, www.sasol.com.
3

Introduction
0
250
500
750
1000
1250
1500
1750
2000
1940 1960 1980 2000 2020
YEAR
FT
S r
esea
rch
pape
rs /
pate
nt
0
20
40
60
80
100
120
140
Oil
Pri
ce [
$/ba
rrel
] FTS ReasearchPapers
FTS Patents
Oil Price
Figure 1.2: Relationship between the number of Fischer-Tropsch publications and the crude oil price. Source: www.oil-price.net for the oil price data and Scopus search for the keyword “Tropsch” for the data on publications.
Although the FT technology has been around since the 1920’s and has been
successfully commercialized, there is still a challenge to improve its
selectivity. To accomplish this, a fundamental understanding of the reaction
mechanism is required which allow for better design of catalysts. The
mechanism is still a subject of great debate in the literature.
1.2. Fischer-Tropsch mechanisms
The High Temperature Fischer-Tropsch (HTFT) process comprises a
complex network of elementary reaction steps. These steps need to include
the formation of CO2, carbon and oxygenates (alcohols, acids, aldehydes and
ketones) at these conditions. To date, mechanisms in literature do not fully
4

Chapter 1
explain the product distribution of the HTFT process. With advanced in-situ
techniques available, many of the older mechanisms have been modified. The
following sections provide a brief description of the main mechanisms
reported. Review articles [6-8] (and references therein) provide more details
on these mechanisms.
The carbide mechanism
The carbide mechanism, also referred to as the alkyl mechanism, was
initially developed by Fischer and Tropsch [9]. The reaction steps, A1-A8, are
the main pathways for this mechanism. The initiation steps (A1-A4) begins
with the successive hydrogenation of surface carbon, Cs. The CsH3 surface
species is regarded as the chain initiator whilst the CsH2 species is the
monomer. Chain growth is by successive incorporation of the monomer
(example A5). This mechanism explains the formation of n-paraffins by H-
addition (A6) and α-olefins by β-H-abstraction (A7) but not the formation of
branched hydrocarbons and oxygenates [10].
CsO + 2Hs Cs + H2O [A1]
Cs + Hs C sH [A2]
CsH + Hs C sH2 [A3]
C sH2 + Hs C sH3 [A4]
Rs + CH2,s R-C sH2 [A5]
R-CH2-CsH2 + Hs R-CH2-CH3 [A6]
R-CH2-C sH2 R-CH=CH2 + Hs [A7]
R-CH2-Cs H2 + HOs R-CH2-CH2OH [A8]
5

Introduction
Schulz et al. [11] proposed a reaction pathway analogous to the carbide
mechanism (see Figure 1.3), for the formation of branched hydrocarbons.
This involves the reaction of an alkylidene surface species and methyl surface
species. The branched alkyl species undergo similar reactions to those
proposed for n-alkyl surface species. Johnston and Joyner [12] proposed the
involvement of surface hydroxyl groups in the formation of oxygenates. The
coupling of a surface hydroxyl group with an alkyl group may lead to the
formation of alcohols (A8). However, more experimental evidence is required
to verify this reaction pathway.
CH3 CH3
CH2=CH-CH3 + H
CH3 CH3 CH
CH3 CH CH2
CH2 CH3
CH2
Figure 1.3. Proposed reaction pathways for the formation of branched hydrocarbons in the FTS, according to Schulz et al. [1990].
The Alkenyl mechanism
Maitlis and his co-workers [13-18] proposed the alkenyl mechanism to
predict the formation of olefins in the FTS. The initiation steps (B1-B3) are
identical to the carbide mechanism. The formation of the first C-C bond
occurs through the coupling of methylidyne and methylene to form a vinyl
surface species (see step B4). This surface species, CH2=CHs, is considered
the chain initiator in this mechanism. Chain propagation occurs through the
6

Chapter 1
addition of a methylene species to a surface alkenyl species yielding a surface
allyl species, which is followed by isomerisation yielding alkenyl species
(steps B5 and B6). Product desorption involves H-addition to an alkenyl
species resulting in α-olefins.
CsO + 2Hs Cs + H2O [B1]
Cs + Hs CsH [B2]
CsH + Hs CsH2 [B3]
CsH + CsH2 CH2=CsH [B4]
R-CH=CsH + CsH2 R-CH=CH-CsH [B5]
R-CH=CsH + CsH2 R-CH2-CH=CsH [B6]
R-CH=CsH + Hs R-CH=CH2 [B7]
Ndlovu et al. [19] tested the isomerisation reported by Maitlis and his co-
workers using organometallic compounds. They reported no observed
isomerisation and went on to refute the alkenyl mechanism. However, this
was later retracted [20] stating that their results were based on poorly
characterised model compounds. Claeys and Van Steen [10] state that the
alkenyl mechanism fails to explain the formation of n-paraffins and
oxygenates. However, if the formation of the olefin is feasible, then it is
conceivable that the corresponding paraffin can also form, either by
hydrogenation of the olefin intermediate or via readsorption of the olefin and
subsequent hydrogenation.
7

Introduction
The Enol mechanism
Storch [21] proposed the enolic theory in which the reaction pathways (C1-
C8) involve oxygen containing surface species (enol). This mechanism
accounts for the formation of oxygenates (alcohols, aldehydes, acids and
esters), olefins and paraffins. In this mechanism, an associatively adsorbed
linear CO molecule is partially hydrogenated (see step C1). Chain growth
occurs through a condensation reaction between enol species, resulting in the
elimination of water. Branched hydrocarbons involve the reaction of a R-CHs-
OH surface species (C5). Aldehydes and alcohols may result from desorption
and dehydrogenation of the alcohol-like groups at the surface (steps C6 and
C7). Acids may result from Cannizzaro reactions of the so formed aldehyde-
like groups, or by reactions of carbon monoxide with water or alcohols.
Esters can be produced by subsequent reactions. The decomposition of the
adsorbed alcohol-like intermediates results in the formation of olefins and
paraffins (steps C8 and C9).
CsO + Hs HCs-OH [C1]
HCs-OH + Hs H-HCs-OH [C2]
R-Cs-OH + H-Cs-OH R-Cs-Cs-OH + H2O [C3]
R-Cs-Cs-OH + 2 Hs R-CH2-Cs-OH [C4]
R-CsH-OH + H-Cs-OH + 2Hs R(CH3)-Cs-OH + H2O [C5]
R-CH2-Cs-OH + R-CH2-CHO [C6]
R-CH2-Cs-OH + 2Hs R-CH2-CH2OH [C7]
R-CH2-Cs-OH + H-Cs-OH + R=CH2 [C8]
R=CH2 + 2 Hs R-CH3 [C9]
The pitfall of this mechanism is that the formation of n-paraffins is only by
secondary hydrogenation of primarily formed olefins. Therefore the primary
formation of n-paraffins requires an alternative reaction pathway.
8

Chapter 1
The CO-insertion mechanism
The CO-insertion mechanism, in which chemisorbed CO is the monomer,
was originally proposed by Sternberg and Wender [22] and later fully
formulated by Pichler and Schultz [23]. The chain initiator is thought to be the
surface methyl species, CsH3. Chain growth occurs by CO-insertion in a
metal-alkyl bond (D3) leading to a surface acyl species. In one of the
termination reaction pathways, these oxygen containing species react with
surface hydrogen to give alcohols (D4). The reaction steps leading to the
formation of n-paraffins and α-olefins are identical to the carbide mechanism
(D6 and D7). The CO-insertion mechanism can also explain the formation of
aldehydes and ketones.
CsO + 3Hs CsH2-OH [D1]
CsH s-OH + 2Hs CsH3 + H2O [D2]
CsO + Rs R-Cs=O [D3]
R-Cs=O + 2Hs R-CsH-OH [D4]
R-CsH-OH + 2Hs R-CsH2 + H2O [D5]
R-CH2-CsH2 R-CH=CH2Hs [D6]
R-CH2-CsH2 + Hs R-CH2-CH3 [D7]
R-CsH-OH R-CHO + Hs [D8]
R-CsH-OH + R-CH2-OH [D9]
Henrici-Olivé and Olivé [24] have confirmed most of these reaction steps
and intermediates with homogeneous catalytic systems containing soluble
transition metal complexes making the CO-insertion mechanism the main
reaction pathway for the formation of oxygenates.
9

Introduction
Other FT Mechanisms
Frennet et al. [25,26] proposed a reaction scheme (E1-E7) for the CO-H2
reaction based on the formate surface radical species. The formulation of the
mechanism was based on chemical transient kinetics (CTK) and pulsed field
desorption mass spectroscopy (PFDMS). The initiation step is the CO-
insertion within a surface hydroxyl to form the formate species (E1). The
progressive hydrogenation of that precursor may lead to methanol and to CH4
formation. The hydrogenated carbon atom here bonds to an oxygen and not to
the metal surface and may react with one CO molecule to form the first
carbon---carbon bond. This insertion is of the same type as the one
corresponding to the initiation step on the OH radical. The only difference is
that here the H atom of that OH is replaced by a CHx. Hence, the initiation
step and the chain lengthening are of the same nature. In this scheme, the
selectivity of hydrocarbons/oxygenates involves only one precursor. The
oxygen atoms on the surface are also consumed to form water and carbon
dioxide (see steps E2 and E3). The steps leading to the C2+ hydrocarbons,
alcohols and alkenes, shown in steps E5 to E7, involve the formate radical
and generate surface hydroxyls species as well.
CO + HOs Os-CH-Os [E1]
Os-CH-Os Hs + CO2 [E2]
HOs + H2/2Hs H2O [E3]
CO + ROs Os-CR-Os [E4]
Os-CR-Os HOs + R-CH2-OH [E5]
Os-CH2-R + H2 HOs + R-CH3 [E6]
Os-CH2-R HOs + R=CH2 [E7]
10

Chapter 1
The formation of the hydroxyl surface species is not fully explained by
Frennet. The most plausible reaction route, based on literature [27-30], is the
reaction between adsorbed oxygen and adsorbed hydrogen (or H2):
Os + Hs HOs
A mechanism for the synthesis of C2+ oxygenates on Rh catalysts was
proposed by Chuang et al. [31]. In their original work [32,33], the reaction
pathway (F1-F12) was developed using probe molecules (ethane, ethanol and
acetaldehyde) under synthesis conditions (300°C; 10bar, H2/CO = 1). The
catalysts were chosen to show different activities to the hydrogenation,
hydrogenolysis, dehydrogenation, decarbonylation, CHx- and CO-insertion
reactions rather than just CO dissociation. In this reaction pathway, the
hydrogenation of CHx/C2Hx species to hydrocarbons (steps F3-F6) and the
insertion of CO to produce C2+ oxygenates (steps F7-F10) are the chain
termination reactions. Surface oxygen species are removed by hydrogenation
and CO-insertion as well to produce water and carbon dioxide respectively
(see F11 and F12).
CsO Cs + Os [F1]
Cs + Hs CsHx [F2]
CsHx + Hs CH4 [F3]
CsHx + CsH2 C2,sHx [F4]
C2,sHx + H,s C2H6 [F5]
C2,sHx C2H4 + H,s [F6]
CsO + Hs CsHxO [F7]
11

Introduction
CsHxO + CsH2 C2,sHxO [F8]
CsHxO + H,s CH3OH [F9]
C2,sHxO + H,s C2 oxygenates [F10]
Os + 2Hs H2O [F11]
Os + COs CO2 [F12]
Other researchers have proposed FT mechanisms based on combinations of
the aforementioned mechanisms. For example, Dry [34] proposes that both
CH2 and CO insert at the carbon-metal bond to form two classes of surface
intermediates as shown in reactions steps G1 and G2. Desorption or
subsequent hydrogenation of these intermediates results in the formation of
alkenes, alkanes, aldehydes and alcohols which are primary products (steps
G4-G7). Dry observed a good correlation between the acid selectivity and the
partial pressures of CO2 and hence proposed the CO2 insertion step (G8) and
subsequent hydrogenation (step G9) to form acids. Bulk carbon or graphite is
formed by the agglomeration of the surface C atoms as shown in step G10.
CsH2 + CsH2-R CsH-CH2-R [G1]
CsO + CsH2-R R-CH2-Cs-Os-C [G2]
R-CH2-Cs-Os-C + 2H2 CsH-CH2-R + H2O [G3]
CsH-CH2-R CH2=CH-R [G4]
CsH-CH2-R + H2 CH3-CH2-R [G5]
R-CH2-Cs-Os-C + H2 RCH2CHO [G6]
R-CH2-Cs-Os-C + 2H2 RCH2CH2OH [G7]
CsH-CH2-R + CO2 O2,s-C-CH-CH2-R [G8]
O2,s-C-CH-CH2-R + 2H2 RCH2CH2COOH [G9]
Cs + xCs graphite [G10]
12

Chapter 1
1.3. Challenges in elucidating the Fischer-Tropsch
mechanism
The most challenging aspect of proving a specific Fischer-Tropsch
mechanism is identifying the proposed surface intermediates at realistic
Fischer-Tropsch conditions. The research group lead by Professor Burton
Davis [35-39] have done extensive work on the use of isotopic tracers (mostly 14C-labelled reactants) to elucidate the mechanism of the Fischer-Tropsch
synthesis on iron-based catalysts. The work demonstrates the power of proper
isotopic experiments but since it was done at low temperatures, only certain
conclusions might be relevant to this thesis. Furthermore, one of the
mechanistic uncertainties for the results based on 14C-labelled experiments is
that it was not possible to determine whether the 14C-labelled species are
added in the initiation or termination step. For this reason, the Steady-State
Isotopic Transient Kinetic Analysis (SSITKA) technique has been chosen.
This technique has been successfully utilized within this research group [40]
to develop a mechanistic pathway for cobalt Fischer-Tropsch catalysts.
1.4. STEADY STATE isotopic transient kinetic analysis
(SSITKA): Background
A steady state kinetic model can be applied if a time-invariant reaction rate
is observed for fixed process conditions or if the process conditions are
changed on a time scale much larger than the relaxation time of the catalytic
reaction [41]. In contrast, a transient kinetic model (also called dynamic
kinetic model) is needed if the process conditions are changed on a time scale
similar to or smaller than the relaxation time of the reaction.
13

Introduction
The rates of the elementary steps of CO hydrogenation are in the
milliseconds range and require relaxation techniques with similar response
times to measure their rate constants. Two popular techniques make use of
step inputs and pulse inputs, viz., SSITKA and temporal analysis of products
(TAP). Present TAP apparatuses have response times of 10 ms to 10 s [42]
whilst SSITKA apparatuses have response times from 1 to 100 s [43].
The SSITKA technique was developed by Happel, Biloen and Bennett [44-
46] for in-situ kinetic information about reaction mechanisms and reaction
intermediates on the catalyst surface. An extensive review of the SSITKA
methodology is given by Shannon and Goodwin [43]. In a nutshell, this
technique keeps the catalyst under steady-state conditions and introduces an
isotopic transient by abruptly replacing one reactant with its isotope. For
example, a feed of H2/12CO/Ar is switched to H2/
13CO/He with minimum
disturbance to the system. The inert gas is also switched to determine the gas
hold-up in the reactor. Apart from isothermal and isobaric reactor conditions,
the surface composition of the catalyst does not change during SSITKA,
making this technique ideal for reaction mechanistic studies.
The SSITKA technique has already been applied to numerous catalyzed
reactions. These include the ammonia synthesis [47-50], CO oxidation
[51,52], ethylene hydroformylation [53,54], methanation [55-58], methanol
synthesis [59,60], methanol reforming [61], NOx reduction [62-65], propene
epoxidation [66] and most relevant to this study, the Fischer-Tropsch
synthesis [58,67-91]. The relevant background literature is discussed in the
various chapters of this thesis and hence not repeated here.
14

Chapter 1
1.5. Hypothesis and key questions
In this study, SSITKA will be used to determine the mechanism of a Fe-
based catalyst under HTFT conditions. The following key questions have
been identified for this thesis:
1. Which is the principal monomer in the mechanism of the HTFT
synthesis?
2. Which is the most abundant surface species during the HTFT synthesis?
3. Can the formation of olefins, paraffins, oxygenates and CO2 be
incorporated into a single FT mechanism?
4. How important is surface carbide, Cs, in the mechanism and kinetics of
the HTFT synthesis?
5. How important is H2O and CO2 in the formation and/or consumption of
Cs?
6. How important is the readsorption of 1-olefins or alcohols in the overall
mechanism of the HTFT synthesis
7. Is CO2 formed by the reaction between CO and H2O or can CO2 be
directly formed to a significant extent by the Boudouard reaction (2CO
CO2 + Cs)?
The hypothesis is that surface carbide, Cs, is formed and consumed at
HTFT conditions and is converted to CH2 by a series of consecutive
irreversible hydrogenation steps. SSITKA can be used to show that this Cs
plays an important role in the mechanism of the HTFT process on an Fe-
based catalyst.
15

Introduction
1.6. Aims and approach
Current mechanisms in literature fail to describe the product distribution of
Fischer-Tropsch at higher temperatures. A combination of two or more
mechanism can explain the product distribution but these mechanisms lack
proper experimental evidence. Kinetic equations proposed have either been
developed empirically or based on a mechanism, using a postulated rate
determining step. Hence these expressions do not illustrate a uniform picture.
Furthermore, the expressions for Fe-based catalysts have been developed at
lower temperatures and thus have limitations at higher temperatures.
Elementary reactions which are usually ignored at lower temperatures due to
negligible rate coefficients must be considered at HTFT conditions.
Moreover, it is expected that the rate determining step, usually assumed to be
the formation of the monomer, would be different at these conditions.
The SSITKA technique can provide extensive insight into the surface
reactions leading to detailed mechanistic and kinetic information. This
technique has already been successful in providing a mechanistic pathway for
a cobalt-based catalyst [40]. The current study is an extension of this work to
higher temperatures over an Fe-based catalyst with the main aim being the
development of the mechanistic pathway. Such a study on Fe-based catalysts
at HTFT conditions is the first to our knowledge.
1.7. Thesis Outline
In Chapter 2, detailed experimental methodology is reported. The
mechanistic models developed in gPROMS and its validation is also included
in this chapter. In chapter 3, the carbonaceous intermediates on a fresh and
carbided Fe catalyst are identified using isotopic transient methods,
16

Chapter 1
specifically H2-D2 exchange reactions. A mechanistic pathway for methane
formation under HTFT conditions is proposed in Chapter 4. The effect of co-
fed ethene with 13CO SSITKA is discussed in Chapter 5. The methanation
model is extended to account for the higher hydrocarbons (C2-C3’s) and
presented in Chapter 6. Finally, a comparison between CO and CO2
hydrogenation with 13CO and 13CO2 SSITKA results is discussed in Chapter 7
and the conclusions and recommendations for future work are presented in
Chapter 8.
References
(1) M.E. Dry, Appl. Catal. A 189 (1999) 185-190.
(2) H. Schulz, Appl. Catal. A186 (1999) 3-12.
(3) M.E. Dry, ACS Div. Fuel Chem., Preprints 48 (2003) 211.
(4) M.E. Dry, Catal. Today 71 (2002) 227-241.
(5) I. Wender, Fuel proc. tech. 48 (1996) 189-297.
(6) C.K. Rofer-DePoorter, Chem. Rev. 81 (1981) 447-474.
(7) B.H. Davis, Fuel proc. tech. 71 (2001) 157-166.
(8) P.M. Maitlis, J. Organo. Chem. 689 (2004) 4366-4374.
(9) F. Fischer and H. Tropsch, Brennstoff-Chem. 7 (1926) 97-104.
(10) M. Claeys and E. Van Steen, Stud.. Surf. Sci. Catal. 152, Elsevier, (2004) 601-680.
(11) H. Schulz, E. Erich, H. Gorre and E. Steen, Catal. Lett. 7 (1990) 157-167.
(12) O. Johnston and R. Joyner, Stud.. Surf. Sci. Catal. 75 Elsevier, (1993) 165.
(13) P.M. Maitlis, H.C. Long, R. Quyoum, M.L. Turner and Z.Q. Wang, J. Chem. Soc., Chem. Commun. 1 (1996).
17

Introduction
(14) P.M. Maitlis and M.L. Turner, Catal. Today 65 (2001) 91-97.
(15) P.M. Maitlis, R. Quyoum, H.C. Long and M.L. Turner, Appl. Catal. A186 (1999) 363-374.
(16) M.L. Turner, P.K. Byers, H.C. Long and P.M. Maitlis, J. Am. Chem. Soc. 115 (1993) 4417-4418.
(17) J.M. Martinez, H. Adams, N.A. Bailey and P.M. Maitlis, J. Chem. Soc., Chem.Commun. (1989) 286-287.
(18) H.C. Long, M.L. Turner, P. Fornasiero, J. Kašpar, M. Graziani and P.M. Maitlis, J. Catal. 167 (1997) 172-179.
(19) S.B. Ndlovu, N.S. Phala, M. Hearshaw-Timme, P. Beagly, J.R. Moss, M. Claeys and E. Van Steen, Catal. Today 71 (2002) 343-349.
(20) S.B. Ndlovu, N.S. Phala, M. Hearshaw-Timme, P. Beagly, J.R. Moss, M. Claeys and E. Van Steen, Catal. Today 78 (2003) 581.
(21) H.H. Storch, N. Golumbic and R.B. Anderson, The Fischer-Tropsch and Related Syntheses (1951).
(22) A.W. Sternberg and I. Wender, Proc. Intern. Conf. on Coordin. Chem. (1959) 53.
(23) H. Pichler, H. Schulz and D. Kühne, Brennstoff-Chem. 49 (1968) 36.
(24) G. Henrici-Olivé and S. Olivé, J. Mol. Catal. 24 (1984) 7-13.
(25) A. Frennet, B. De, J.M. Bastin and N. Kruse, J. Phys. Chem. B 109 (2005) 2350-2359.
(26) A. Frennet and C. Hubert, J. Mol. Catal. A: Chem. 163 (2000) 163-188.
(27) D.K. Matsumoto and C.N. Satterfield, Energy & Fuels 3 (1989) 249-254.
(28) M. Araki and V. Ponec, J. Catal. 44 (1976) 439-448.
(29) R.W. Joyner, J. Catal. 50 (1977) 176-180.
(30) J.G. McCarty and H. Wise, J. Catal. 57 (1979) 406-416.
(31) S.S.C. Chuang, J. Stevens and R. Khatri, Top. Catal. 32 (2005) 225-232.
(32) S.C. Chuang, Y.H. Tian, J.G. Goodwin and I. Wender, J. Catal. 96 (1985) 396-407.
(33) S.C. Chuang, J.G. Goodwin and I. Wender, J. Catal. 92 (1985) 416-421.
(34) M.E. Dry, Catal. Today 6 (1990) 183-206.
18

Chapter 1
(35) A. Sarkar, R. Keogh, S. Bao and B. Davis, Catal. Lett. 120 (2008) 25-33.
(36) B. Shi, G. Jacobs, D. Sparks and B.H. Davis, Fuel 84 (2005) 1093-1098.
(37) L.M. Tau, H.A. Dabbagh, J. Halasz and B.H. Davis, J. Mol. Catal. 71 (1992) 37-55.
(38) L.M. Tau, H.A. Dabbagh and B.H. Davis, Energy & Fuels 5 (1991) 174-179.
(39) B.H. Davis, Catal. Today 141 (2009) 25-33.
(40) H.A.J. Van Dijk , A mechanistic study using transient isotopic tracing, Ph.D thesis, 2001, Technische Universiteit Eindhoven, Eindhoven, the Netherlands. http://alexandria.tue.nl/extra2/200111083.pdf
(41) R.H. Nibbelke, Steady State, Transient and Non-Linear Kinetics in Automotive Exhaust Gas Catalysis, Ph.D thesis, 1998, Technische Universiteit Eindhoven, Eindhoven, the Netherlands.
(42) J. Perez-Ramirez and E.V. Kondratenko, Catal. Today 121 (2007) 160-169.
(43) S.L. Shannon and J. Goodwin, Chem. Rev. 95 (1995) 677-695.
(44) J. Happel, Chem. Eng. Sci. 33 (1978) 1567.
(45) P. Biloen, J. Mol. Catal. 21 (1983) 17-24.
(46) C.O. Bennett, in: Understanding Heterogeneous Catalysis through the Transient Method, eds. A.T. Bell and L.L. Hegedus, Catalysis under Transient Conditions, American Chemical Society, (1982) 1-32.
(47) J.U. Nwalor and J.G. Goodwin, Top. Catal. 1 (1994) 285-293.
(48) R.J. Davis and B.C. McClaine, J. Catal. 210 (2002) 387-396.
(49) B.C. McClaine and R.J. Davis, J. Catal. 211 (2002) 379-386.
(50) B.C. McClaine and R.J. Davis, J. Catal. 210 (2002) 387-396.
(51) A. Sirijaruphan, J. Goodwin, R.W. Rice, D. Wei, K.R. Butcher, G.W. Roberts and J.J.Spivey, Appl. Catal. A281 (2005) 1-9.
(52) S.S. Pansare, J. Goodwin and A. Sirijaruphan, J. Catal. 234 (2005) 151-160.
(53) M.W. Balakos and S.S.C. Chuang, J. Catal. 151 (1995) 266-278.
(54) M.W. Balakos and S.S.C. Chuang, J. Catal. 151 (1995) 253-265.
(55) Y. Soong and P. Biloen, Langmuir 1 (1985) 768-770.
(56) Y. Soong, K. Krishna and P. Biloen, J. Catal. 97 (1986) 330-343.
19

Introduction
(57) I.G. Bajusz, D.J. Kwik and J.G. Goodwin Jr, Catal. Lett. 48 (1997) 151-157.
(58) G.J. Haddad, B. Chen and J. Goodwin, J. Catal. 161 (1996) 274-281.
(59) S.H. Ali and J. Goodwin, J. Catal. 170 (1997) 265-274.
(60) S.H. Ali and J. Goodwin, J. Catal. 171 (1997) 339-344.
(61) J. Papavasiliou, G. Avgouropoulos and T. Ioannides, Appl. Catal. B: Environ. 88 (2009) 490-496.
(62) E.M. Sadovskaya, A.P. Suknev, L.G. Pinaeva, V.B. Goncharov, B.S. Bal'zhinimaev, C. Chupin, R. Pérez and C. Mirodatos, J. Catal. 225 (2004) 179-189.
(63) R. Burch, A.A. Shestov and J.A. Sullivan, J. Catal. 182 (1999) 497-506.
(64) R. Burch, A.A. Shestov and J.A. Sullivan, J. Catal. 186 (1999) 353-361.
(65) R. Burch, A.A. Shestov and J.A. Sullivan, J. Catal. 188 (1999) 69-82.
(66) T.A. Nijhuis, E. Sacaliuc-Parvulescu, N.S. Govender, J.C. Schouten and B.M. Weckhuysen, J. Catal. 265 (2009) 161-169.
(67) E. Rytter, S. Eri, T.H. Skagseth, D. Schanke, E. Bergene, R. Myrstad and A. Lindvåg, IECR 46 (2007) 9032-9036.
(68) J. Panpranot, J. Goodwin and A. Sayari, J. Catal. 211 (2002) 530-539.
(69) M. Rothaemel, K.F. Hanssen, E.A. Blekkan, A. Holmen and D. Schanke, Catal. Today 40 (1998) 171-179.
(70) K. Sudsakorn, J. Goodwin and A.A. Adeyiga, J. Catal. 213 (2003) 204-210.
(71) N. Lohitharn and J. Goodwin, J. Catal. 260 (2008) 7-16.
(72) M. Rothaemel, K.F. Hanssen, E.A. Blekkan, A. Holmen and D. Schanke, Catal. Today 38 (1997) 79-84.
(73) F. Rohr, O.A. Lindvag, A. Holmen and E.A. Blekkan, Catal. Today 58 (2000) 247-254.
(74) N. Lohitharn and J. Goodwin, J. Catal. 257 (2008) 142-151.
(75) N.S. Govender, F.G. Botes, M.H.J.M. de Croon and J.C. Schouten, J. Catal. 260 (2008) 254-261.
(76) T. Van de Vin, A mechanistic study of the High Temperature Fischer-Tropsch process using SSITKA - C2+ formation, Masters graduation report, 2007, Technische Universiteit Eindhoven, Eindhoven, the Netherlands.
20

Chapter 1
21
(77) F. Rohr, A. Holmen, K.K. Barbo, P. Warloe and E.A. Blekkan, Stud. Surf. Sci. Catal. 119 (1998) 107-112.
(78) P.B. Radstake, J.P. Breejen, G.L. Bezemer, J.H. Bitter, K.P. Jong, V.Frøseth and A. Holmen, Stud. Surf. Sci. Catal. 167, (2007) 85-90.
(79) F. Rohr, A. Holmen and E.A. Blekkan, ACS, Div. Petr. Chem., Preprints 44 (1999) 73-75.
(80) H.A.J. Van Dijk, J.H.B.J. Hoebink and J.C. Schouten, Stud.. Surf. Sci. Catal. 130 A (2000) 383-388.
(81) H.A.V. Van Dijk, J.H.B.J. Hoebink and J.C. Schouten, Chem. Eng. Sci. 56 (2001) 1211-1219.
(82) V. Frøseth, S. Storsæter, O. Borg, E.A. Blekkan, M. Rønning and A. Holmen, Appl. Catal. A 289 (2005) 10-15.
(83) K.F. Hanssen, E.A. Blekkan, D. Schanke and A. Holmen, Stud.. Surf. Sci. Catal. 109 (1997) 193-202.
(84) C.A. Mims and L.E. McCandish, J. Am. Chem. Soc. 107 (1985) 696-697.
(85) C.J. Bertole, C.A. Mims and G. Kiss, J. Catal. 223 (2004) 309-318.
(86) C.J. Bertole, C.A. Mims and G. Kiss, J. Catal. 210 (2002) 84-96.
(87) C.A. Mims and L.E. McCandish, J. Phys. Chem. 91 (1987) 929-937.
(88) L.E. McCandlish and C.A. Mims., Isotopic Transient studies of the Fischer-Tropsch reaction, AIChE National meeting (1985).
(89) C.J. Bertole, C.A. Mims, G. Kiss and P. Joshi, Stud.. Surf. Sci. Catal. 136 (2001) 369-374.
(90) C.J. Bertole, C.A. Mims and G. Kiss, J. Catal. 221 (2004) 191-203.
(91) C.A. Mims and C.J. Bertole, Stud.. Surf. Sci. Catal. 136 (2001) 375-380.

22

2 Experimental methodology and model
development
In this chapter, details about the experimental procedures for each of the main
chapters are reported. The modelling software, gPROMS, used in this study is
evaluated and shown to be a robust tool for the estimation of parameters in
complex simulation models such as those for the description of Steady-State
Isotopic Transient Kinetic Analysis (SSITKA) experiments during the Fischer-
Tropsch (FT) synthesis reaction. A kinetic FT model is presented that is
implemented in gPROMS and validated using the kinetic data from a previous
study [1-3] for the formation of ethane during the Fischer-Tropsch synthesis.
gPROMS model simulation results show that the predicted gas-phase and
catalyst surface concentrations are similar as previously reported. Two kinetic
rate parameters are also re-optimised using the parameter estimation tool box in
gPROMS, and the results are comparable to the previous work.
23

Experimental methodology and model development
2.1. The SSITKA Setup
A typical SSITKA system consists of two reactant streams, a 4-port
switching valve, a reactor, a gas chromatograph (GC) and a mass
spectrometer (MS) as shown in Figure 2.1
Figure 2.1: Schematic of a typical SSITKA setup [4]
For most reactions, this would be sufficient for proper analysis. However,
for the Fischer-Tropsch reaction a MS alone is not sufficient for the isotopic
analysis. Hence, in our system we also include an online GC-MS (see Figure
2.2 ) for isotopic analysis of the larger molecules which cannot be easily
detected by the MS [5,6].
24

Chapter 2
Figure 2.2: Schematic of the SSITKA setup used in this work.
2.2. The catalyst
The catalyst is prepared by co-precipitation of the metal nitrates as described
by Espinoza et al. [7]. The catalyst used in this study was supplied by Sasol
Technology Research and Development and contains only potassium as a
promoter. The exact composition is not mentioned due to confidentially. The
surface area measured by N2 physisorption is 27 m2.gcat-1, which is in the
range specified by Espinoza et al. [7] for this type of Fe-based catalyst.
25

Experimental methodology and model development
2.3. Catalyst loading, reduction and activation
Typically 0.5-1.0 gram of Fe/K catalyst (150-250 μm) is weighed and
mixed with 1.0-2.5 gram of SiC (250-300 μm) to create the catalyst bed (~ 20
mm). The catalyst is reduced with a mixture of H2 and Ar flow (both 40 ml
min-1) at 420 ºC and 1.2 bar for 16 hours. After the reduction the reactor is
cooled down to the synthesis temperature, 330ºC, under an Ar flow. At 330 ºC
the Fischer-Tropsch synthesis is started by introducing H2 and CO flows.
These flows are varied to obtain different H2/CO feed ratios and gas hourly
space velocities (GHSV) in the experiments. The catalyst mass is varied to
obtain a different GHSV.
2.4. Catalyst characterisation
2.4.1. In-situ temperature programmed hydrogenation
The Fischer-Tropsch reaction was abruptly stopped by switching between
the synthesis gas feed and an inert. The reactor was cooled down as fast as
possible to 30°C whilst purging the system with inert. After sufficient purging
to remove the chemisorbed species, the reactor temperature was ramped,
typically at 5 °C.min-1 to a maximum attainable temperature of 450°C whilst
feeding a mixture of 50% H2 in Ar. The product gases, mainly CH4, H2O and
CO2 and the reactants H2 and CO were continuously monitored with the
online mass spectrometer.
26

Chapter 2
2.4.2. In-situ isothermal hydrogenation
The aforementioned procedure was followed to stop the Fischer-Tropsch
reaction. However, here the reactor was kept at the synthesis temperature
whilst purging with an inert to remove the chemisorbed species. Thereafter, a
50% mixture of H2/Ar was fed into the reactor and the product gases, mainly
CH4, H2O and CO2 and the reactants H2 and CO were continuously monitored
with the online MS.
2.4.3. Ex-situ temperature programmed surface reactions
A Temperature Programmed Reactor system with on-line mass
spectroscopy was used for the Temperature Programmed Hydrogenation
(TPH) and Temperature Programmed Oxidation (TPO) experiments.
Typically, 0.20 g of the spent Fe catalyst was loaded into a quartz tube reactor
at room temperature. The temperature was increased to 100ºC at 10 ºC.min-1
and held until any moisture in the system was removed and the correct
vacuum condition was obtained. Thereafter, it was ramped to 270ºC at 5
ºC.min-1and held at 270ºC for 60 min. The final stage was ramping to 800ºC
at 2 ºC.min-1 and holding for 60 min. The reactor was then allowed to cool to
room temperature. The feed gases (total flow of 40 ml.min-1) were 50 vol.%
H2/He and 10 vol.% O2/He for the TPH and TPO experiments, respectively.
27

Experimental methodology and model development
2.5. Surface characterisation using isotopic methods
2.5.1. Transients at the start of the Fischer-Tropsch reaction
In these experiments, the reactor was cooled to the synthesis temperature in
flowing Ar after the catalyst reduction. The synthesis was started by a fast
switch from Ar to a H2/CO or D2/CO mixture which resulted in transients of
the reactants and products. This was performed with minimal disturbances in
the reactor pressure. The reactant and product transients were captured with
the online MS and online GCMS.
2.5.2. CO disproportionation
The carbon is deposited on a freshly reduced catalyst by the
disproportionation of 13CO at 330°C and 1.2 bar :
213CO 13Cads + 13CO2. [1]
The catalyst surface, covered with 13Cads and 13CO2, is then exposed to a
mixture of H2/CO initiating the Fischer-Tropsch synthesis. The incorporation
of 13C in the products is measured with the online MS and GCMS.
2.5.3. SSITKA experiments
For a SSITKA experiment, an abrupt switch was made from a normal feed
(for example H2/12CO/Ar) to one with an isotopically labelled reactant, for
example H2/13CO/Ar/Ne in the case of 13CO SSITKA. In some experiments,
Kr was used instead of Ne as the inert. This was mainly due to the lack of Ne
at the time of these experiments and also the preference of Kr for deuterium
experiments (to avoid overlapping of fragmentation patterns).
28

Chapter 2
2.5.4. H2/D2 tracing or Deuterium flushing
H2/D2 exchange reactions were carried out similar to the aforementioned
SSITKA experiments. An abrupt switch was made using a Valco 4-way
switching valve, allowing one feed (H2/CO/Ar) to bypass the reactor to the
vent line and another feed (D2/CO/Ar/Ne) to enter the reactor. The resulting
transients were captured with the online MS for the smaller molecules and the
online GCMS for the heavier products. The overlapping of the fragmentation
patterns going from CH4 to CD4 using the online MS is well known in the
literature. The correction for the contribution of H2O to the methane signals
has been discussed in previous work [3].
2.5.5. Co-fed ethylene experiments
The same procedure as above was followed for the reduction and pre-
treatment. Once steady-state conditions (based on constant CO conversion)
were reached, an abrupt switch was made from the normal feed (H2/CO/Ar) to
a mixture of (1 mol% C2H4 in H2)/CO/Ar. The inlet partial pressures of H2
and CO were kept constant by reducing the flow of Ar to compensate for the
1 mol% C2H4 added.
2.5.6. Co-fed ethylene experiments with 13CO SSITKA
In these experiments, an abrupt switch was made as follows: 1 mol% C2H4
in H2/CO/Ar 1 mol% C2H4 in H2/13CO/Ar. The resulting transients were
then monitored with the online MS and GCMS as described in sections 2.6.2
and 2.6.3.
29

Experimental methodology and model development
2.6. Data analysis and treatment
2.6.1. Steady-state results
The steady state performance of the catalyst was monitored online by a
Varian CP-3800 Gas Chromatograph consisting of one thermal conductivity
detector (TCD) and two Flame Ionization detectors (FID). The unreacted feed
and some hydrocarbon products (N2, H2, CO, CO2, and CH4) were analyzed
by the TCD, whilst C1 to C5 hydrocarbons were analyzed by the FID.
2.6.2. Transients using the online Mass Spectrometer
A Balzers ThermoStarTM (GSD 301T) mass spectrometer was used to
monitor the reactants (H2 and CO), inerts (Ar and Ne), and small molecular
weight products (for example CH4 and CO2). The m/e values used in our
experiments were 2, 15, 17, 22, 28, 29, 40, 44, and 45 for H2, 12CH4,
13CH4,
Ne, 12CO, 13CO, Ar, 12CO2, and 13CO2. The transient responses are normalized
between the initial MS intensity before the isotopic step change and the final
MS intensity at the moment in time when the unlabeled atom in all surface
and gas phase species is replaced by its labeled counterpart, as shown in
equation 1 in the case of the inert Ne:
II
III
NeNe
NetNeNNe
min,max,
min,,,
[2]
where INe,N is the normalized transient of Ne, INe,t is the MS intensity of Ne,
INe,max is the maximum MS intensity of Ne, and INe,min is the minimum MS
intensity of Ne.
30

Chapter 2
2.6.3. Transients using the online GCMS
The transients of the smaller hydrocarbons (CH4 and CO2) and permanent
gases (H2, CO, Ne, Ar) were captured using the online MS as described in the
aforementioned section. For the heavier hydrocarbons, an online GCMS
(Shimadzu GCMS-QP 2010) was used. The non-, partially and fully labelled
Fischer-Tropsch products are produced after the switch to the isotopically
labelled reactant. The fragmentation pattern of each product is a linear
combination of the fragmentation patterns of the corresponding isotopic
product. This contribution can be calculated by minimizing the objective
function,
Sm n ref obs x
ij ij ii=1 j
2
x minimumf fx
[3]
in which S(x) is the objective function, m is the number of m/e values of
the fragmentation pattern of a given product, n is the number of isotopic
combinations of a given product, xij is the fractional contribution of the jth
isotopic combination to the mixture at the ith m/e value, fijref is the intensity of
the fragmentation pattern of the jth isotopic combination at the ith m/e value
and fiobs is the observed intensity of the fragmentation pattern of the mixture at
the ith m/e value. The fragmentation pattern for each isotopic product in the
reaction mixture is required in order to apply this procedure. Van Dijk [3]
provides detailed information on this calculation procedure for 13CO and D2 -
SSITKA experiments.
2.6.4. Reactor modeling
Happel [8] and Bennet et al. [9] showed that SSITKA experiments are
optimal in plug flow reactors due to the fast isotopic step change. In a plug
31

Experimental methodology and model development
flow regime, all changes relative to the inlet signal are ascribed to kinetics.
The fixed-bed reactor used in this study is modeled as an isothermal and
isobaric plug flow reactor. The total molar flow rate throughout the catalyst
bed is assumed constant due to the low conversions.
Mass balances for only the labeled gaseous and surface species,
represented by partial differential equations in time and space, are solved. The
continuity equations for the labeled gaseous component X# and the surface
component Y# are as follows:
#
##
,
1XW
b
XX Rxt
CC [4]
#
#
,YWY Rt
L
C L
[5]
The initial and boundary conditions for an isotopic step from gas-phase
reactant Z to Z# are as follows.
Initial conditions:
t = 0 = = 0 for any x #X #Y
Boundary conditions:
t > 0 x = 0 = input function, f(t) #ZC
t > 0 x = 0 C = 0 for X# ≠ Z# [6] #X
where Cx [mol.mg-3] is the concentration of component X in the gas phase;
LY [mol.kgcat-1] is the surface concentration of Y; [s] is the residence time; t
[s] is the time; b [kgcat/mb3] is the density of the catalyst bed; b [mg
3.mb-3] is
the catalyst bed porosity; RW,X# [mol.kgcat
-1.s-1] is the steady state production
rate of X; x is the dimensionless axial position in the catalyst bed.
32

Chapter 2
The residence time can be calculated as:
V
Rb
F
V [7]
where VR [mb3] is the volume of the catalyst bed and FV [mg
3.s-1] is the total
volumetric flow rate at reaction temperature and pressure. The input function
f(t) is represented by the transient of the inert tracer. The optimal fit for the
empirical input function used in this work is shown in Figure 2.3.
Figure 2.3: The optimal fit for the empirical function used in this study. The open markers (, , and ) are Ne data collected during a SSITKA switch (H2/
12CO/Ar H2/13CO/Ar/Ne) at H2/CO = 15, 330ºC, 1.2 bar, and GHSV =
7412 ml.hr-1.gcat -1. The solid line is the optimal fit with a1 = 9.01, a2 = 0.52, and
a3 = 10.81.
0.0
0.2
0.4
0.6
0.8
1.0
0 5 10 15 20 25
Time [s]
No
rma
lis
ed
Re
sp
on
se
[-]
3
1
2
1( ) =
1 exp
a
f tt a
a
2.6.5. Parameter estimation
The set of partial differential equations (equations 4 and 5) with its initial
and boundary conditions (equation 6) is solved using the software package
33

Experimental methodology and model development
gPROMS (general PROcess Modeling System). Parameter estimation in
gPROMS {Process System Enterprise, 2005 2953 /id} uses a maximum
likelihood objective function (equation 8) in which is the objective
function, N is the total number of measurements taken in all experiments, θ is
the set of model parameters to be estimated, NE is the number of performed
experiments, NVi is the number of variables measured in experiment i, NMij is
the number of measurements of variable j in experiment i, 2ijk is the variance
of the kth measurement of variable j in experiment i, is the experimental
value for the kth measurement of variable j in experiment i, and is the
model prediction for the kth measurement of variable j in experiment i.
ijkz
zijk
2
22
1 1 1
1ln 2 ln
2 2 miniji
NMNVNEijk ijk
ijki j k ijk
z zN
[8]
The principle of parameter estimation is based upon the minimization of
the difference between the experimental values and the model predicted
values (equation 9), in which i is the difference between experimental and
predicted value for measurement i, is the experimental value for
measurement i, and zi( ) is the predicted value for measurement i.
iz
i i iz z [9]
The maximum likelihood principle assumes i to be independent and
normally distributed with zero mean and standard deviation i . Several
variance models that can describe the standard deviation for i are available
in gPROMS. The constant variance model in which the measurement error
has a constant standard deviation is used in our study.
34

Chapter 2
2.7. Transient modelling of the Fischer-Tropsch synthesis
using gPROMS
The mathematical description of SSITKA experiments involves a
combination of partial differential equations (PDEs) expressing the transient
responses and algebraic equations expressing the steady-state mole balances
[3]. Nowadays the use of powerful computers and advanced modelling
packages render easy and fast solutions to these type of equations. For
example, our group has successfully utilized gPROMS (general Process
Modelling System) for developing a model for the NOx storage/reduction
process in the presence of CO2 [10].
The purpose of this part of the work is to demonstrate the capabilities of
gPROMS for transient kinetic modelling, specifically for SSITKA
experiments on the Fischer-Tropsch reaction. These types of models are not
included in standard libraries provided by Process System Enterprise [11].
Here, we demonstrate the simulation and parameter estimation capabilities of
gPROMS. The actual codes and details about the gPROMS language can be
found in Appendix A. The results are compared to a previous study* [1-3]) in
which the modelling was performed using FORTRAN.
* Fischer-Tropsch reaction using a cobalt-based catalyst.
35

Experimental methodology and model development
2.7.1. Modeling description
2.7.1.1. Reactor configuration and reactor mechanism
A stainless steel tubular fixed bed reactor, shown in Figure 2.4, with an
internal diameter of 7.0 mm and a bed length of 40.0 mm was used. The
reactor contains a catalyst bed existing of Cobalt-based catalyst particles
diluted with inert particles (SiC), placed between two sinter plates. Two
sample chambers are present for online mass spectroscopy, one upstream and
one downstream of the catalyst bed. The reaction mechanism chosen for this
work, which was proposed by [3], is shown in Figure 2.5. The corresponding
rate constants are reported in Table 2.1. In brief, this mechanistic model
assumes two single-C species, denoted as C,ads and C,ads. The total fractional
coverage of these surface species together with COads was 90%. The
experimental results indicated that the catalyst surface is heterogeneous
towards the formation of methane and higher hydrocarbons.
The fixed-bed reactor used in this study is modelled as an isothermal and
isobaric plug flow reactor. The total molar flow rate throughout the catalyst
bed is assumed constant due to the low conversions (typically 5% for
differential conditions).
36

Chapter 2
Figure 2.4: Schematic drawing of the reactor used for the SSITKA experiments in
the previous work [3].
COg
COads
Cads
Cads
CH4, g
k1
k2
k3
k4
kads kdes
C2H6, g
C2ads
k5
k6
COg
COads
Cads
Cads
CH4, g
k1
k2
k3
k4
kads kdes
C2H6, g
C2ads
k5
k6
Figure 2.5: Mechanism for the formation of ethane during the Fischer-Tropsch
synthesis as proposed in a previous study [3].
37

Experimental methodology and model development
Table 2.1: Optimised kinetic rate parameters corresponding to the mechanism in
Figure 2.5 and calculated in a previous study [3]. Experimental conditions:
225°C, 1.2 bar, Wcat.F-1 = 24.2 kgcat.s-1.mole-1
kads mg3.kgcat
-1.s-1 5.9 10-2 kdes s
-1 9.0 k1 s
-1 7.2 10-3 k2 s
-1 3.4 10-3 k3 s
-1 3.3 10-2 k4 s
-1 1.3 10-1 k5 kgcat.mole-1.s-1 2.8 k6 s
-1 4.4 10-1
Mole balances for the labelled gaseous and surface species, represented by
partial differential equations in time and space, were solved (see equations 4
and 5)
2.7.2. Model validation
To validate our gPROMS model, the rate constants estimated in a previous
study [3], presented in Table 2.1, corresponding to the mechanism in Figure
2.5, were fixed and the PROCESS was simulated. Steady-state and transient
gas phase and surface concentrations were obtained as a function of time and
reactor length. The transients for Ne, CO and CH4 at the reactor outlet are
presented in Figure 2.6a, and for clarity the transients for Ne and C2H6 are
presented in Figure 2.6b. The fast exponential decay of the Ne transient with a
time constant of 0.5 s and the delayed response of 13CO is correctly described
as previously discussed by Van Dijk et al. [1]. The latter is caused by the
reversible interaction of CO with the catalyst surface and is known as the
chromatographic effect [12]. Furthermore, the earlier breakthrough of 13CH4
compared to 13CO at the outlet of the reactor is also correctly described here.
38

Chapter 2
This phenomenon is typical of a plug-flow reactor model and indicates the
absence of any significant interaction of methane with the catalyst [3]. The
predicted steady-state gas phase and surface concentrations, shown in Table
2.2, are similar to the previous work. Based on the aforementioned results, we
conclude that the previous models describing the SSITKA experiments have
been successfully reproduced in gPROMS.
Table 2.2: Calculated gas-phase and surface concentrations for the mechanism in Figure 2.5 obtained using the gPROMS model in this study. Values in brackets are from a previous work [3].
Gas phase concentration [mole.mg-3] Surface concentrations [mole.kgcat
-1]
CH4 2.51 10-1 ( 2.53 10-1) CO 3.7 10-2 (3.7 10-2) C2H6 1.47 10-2 (1.53 10-2) C 3.8 10-3 (3.8 10-3)
C 2.7 10-3 (2.7 10-3) C2 4.5 10-5 (4.5 10-5)
2.7.3. Parameter quantification
To quantify the rate constants listed in Table 2.1 using gPROMS, the same
set of experiments were chosen as used in the previous study [3]. The same
modelling approach was also followed. The rate constants for the methanation
reaction which were estimated in a separate model discrimination study [3]
were fixed. The remaining two rates constants (k5 and k6) were then
estimated. This approach helps to reduce the number of parameters to
estimate. In gPROMS, the weighted residual is compared to the chi-squared
value to determine the goodness of the fit. In our case, the obtained weighted
residual (623) was lower than the chi-squared value (675), thus indicating a
good fit. In comparison to the parameters in Table 2.1, the optimised
parameters in this study, shown in Table 2.3, were within the 95% confidence
39

Experimental methodology and model development
intervals. A 95% t-value is also calculated in gPROMS during parameter
estimation. A 95% t-value for a parameter smaller than the reference t-value
indicates that the data is not sufficient to estimate this parameter precisely
implying more data points are required. In this study, the reference value was
lower in both cases, thus indicating that sufficient data was used in our study.
The simulated transients using the newly estimated rate constants are
presented in Figure 2.7 with the experimental data points for comparison of
the fit.
40

Chapter 2
Time [s]
No
rma
lis
ed R
es
po
ns
e [-
]
0.0
0.2
0.4
0.6
0.8
1.0
0 50 100 150
13C2H6
12C2H6
13C12CH6
Ne
Time [s]
No
rma
lis
ed R
es
po
ns
e [-
]
0.0
0.2
0.4
0.6
0.8
1.0
0 50 100 150
Time [s]
No
rma
lis
ed R
es
po
ns
e [-
]
0.0
0.2
0.4
0.6
0.8
1.0
0 50 100 150
13C2H6
12C2H6
13C12CH6
Ne
0.0
0.2
0.4
0.6
0.8
1.0
0 50 100
Time [s]
No
rma
lis
ed R
es
po
ns
e [-
]13CH4
12CH4
13CO
12CO
Ne
0.0
0.2
0.4
0.6
0.8
1.0
0 50 100
Time [s]
No
rma
lis
ed R
es
po
ns
e [-
]
0.0
0.2
0.4
0.6
0.8
1.0
0 50 100
Time [s]
No
rma
lis
ed R
es
po
ns
e [-
]13CH4
12CH4
13CO
12CO
Ne
a
b
Time [s]
No
rma
lis
ed R
es
po
ns
e [-
]
0.0
0.2
0.4
0.6
0.8
1.0
0 50 100 150
13C2H6
12C2H6
13C12CH6
Ne
Time [s]
No
rma
lis
ed R
es
po
ns
e [-
]
0.0
0.2
0.4
0.6
0.8
1.0
0 50 100 150
Time [s]
No
rma
lis
ed R
es
po
ns
e [-
]
0.0
0.2
0.4
0.6
0.8
1.0
0 50 100 150
13C2H6
12C2H6
13C12CH6
Ne
0.0
0.2
0.4
0.6
0.8
1.0
0 50 100
Time [s]
No
rma
lis
ed R
es
po
ns
e [-
]13CH4
12CH4
13CO
12CO
Ne
0.0
0.2
0.4
0.6
0.8
1.0
0 50 100
Time [s]
No
rma
lis
ed R
es
po
ns
e [-
]
0.0
0.2
0.4
0.6
0.8
1.0
0 50 100
Time [s]
No
rma
lis
ed R
es
po
ns
e [-
]13CH4
12CH4
13CO
12CO
Ne
a
b
Figure 2.6: Model simulation for the formation of (a) methane, and (b) ethane
under Fischer-Tropsch conditions for a SSITKA experiment (13CO/H2/Ar 12CO/H2/Ne at 225°C, 1.2 bar, Wcat.F-1 = 24.2 kgcat.s-1.mole-1 over a cobalt
catalyst).
41

Experimental methodology and model development
The aforementioned results show the robustness of gPROMS in modelling
a complex reaction network such as in SSITKA experiments for the Fischer-
Tropsch synthesis. The example presented here has already recently been
extended successfully towards model discrimination using new data,
parameter estimation solving more unknowns and lastly extending the model
to account for the heavier hydrocarbons (see Chapters 4 and 6). In summary,
gPROMS has proven to be an excellent tool for the modelling of transient
experiments.
0.0
0.2
0.4
0.6
0.8
1.0
0 50 100 150 200
Time [s]
No
rmal
ised
Res
po
nse
[-]
13C2H6
13C12CH6
0.0
0.2
0.4
0.6
0.8
1.0
0 50 100 150 200
Time [s]
No
rmal
ised
Res
po
nse
[-]
13C2H6
13C12CH6
Figure 2.7:. Parameter estimation results for the formation of ethane under
Fischer-Tropsch conditions for a SSITKA experiment (13CO/H2/Ar 12CO/H2/Ne at 225°C, 1.2 bar, Wcat.F-1 = 24.2 kgcat.s-1.mole-1 over a cobalt
catalyst).
42

Chapter 2
Table 2.3: The optimized kinetic rate constants, the 95% confidence intervals,
and the 95% t-value calculated using parameter estimation in gPROMS.
Parameter Optimal
Estimate
95%
Confidence Interval
95%
t-value
k5 [kgcat.mole-1.s-1] 2.3 100 5.6 10-1 4.1 100 k6 [s
-1] 4.6 10-1 7.2 10-2 6.4 100
2.7.4. Summary
A gPROMS implementation of a SSITKA experiment for the formation of
ethane during the Fischer-Tropsch synthesis was presented. This model was
based on previous work and as such was validated using older data. The
model in gPROMS predicted both steady-state and transient gas phase and
surface concentrations both as a function of time and reactor length.
Parameter estimation in gPROMS was also successfully completed and the
results were in excellent agreement with the earlier work.
References
(1) H.A.J. Van Dijk, J.H.B.J. Hoebink and J.C. Schouten, Top. Catal. 26 (2003) 163-171.
(2) H.A.J. Van Dijk, J.H.B.J. Hoebink and J.C. Schouten, Top. Catal. 26 (2003) 111-119.
(3) H.A.J. Van Dijk , A mechanistic study using transient isotopic tracing, Ph.D thesis, 2001, Technische Universiteit Eindhoven, Eindhoven, the Netherlands. http://alexandria.tue.nl/extra2/200111083.pdf
(4) S. Hammache, J.G. Goodwin Jr, S.L. Shannon and S.Y. Kim, in: In Situ Analysis of Reaction at the Site Level in Heterogeneous Catalysis , eds. P. Somasundaran and A. Hubbard, Encyclopedia of Surface and Colloid Science, Marcel Dekker (2002) 2445-2454.
43
Experimental methodology and model development
(5) H.A.J. Van Dijk, J.H.B.J. Hoebink and J.C. Schouten, Chem. Eng. Sci. 56 (2001) 1211-1219.
(6) H.A.J. Van Dijk, J.H.B.J. Hoebink and J.C. Schouten, Stud. Surf. Sci. Catal. 130 A (2000) 383-388.
(7) R.L. Espinoza, T.C. Bromfield, F.G. Botes, J.L. Visagie, K.H. Lawson and P. Gibson. Hydrocarbon synthesis catalyst and process, ed. Sasol Technology. US Patent, US 6844370, (2005).
(8) J. Happel, Isotopic Assessment of Heterogeneous Reactors, Academic Press Inc., (1986).
(9) C.O. Bennett, in: A.T. Bell, L.L. Hegedus (Editors), Catalysis under Transient Conditions. American Chemical Society, 1982, p. 1.
(10) C.M.L. Scholz, K.M. Nauta, M.H.J.M. de Croon and J.C. Schouten, Chem. Eng. Sci. 63 (2008) 2843-2855.
(11) Process System Enterprise. gPROMS Advanced User Guide. (2005).
44

3 Reactivity of surface
carbonaceous intermediates on
an iron-based Fischer-Tropsch
catalyst
The reactivities of surface carbonaceous intermediates on both a freshly
reduced and a carbided iron-based Fischer-Tropsch catalyst were characterised
using isotopic transient kinetic analysis (ITKA), isothermal hydrogenation, and
temperature programmed surface reactions. On both catalysts, carbon deposition
occurred to the same extent but water formation and methane formation were
faster on the carbided catalyst. More reaction intermediates for C2 hydrocarbon
formation were detected at the start of the Fischer-Tropsch reaction on the
freshly reduced catalyst. However, the CHs intermediate for methane formation
and the CCHs intermediate for C2 hydrocarbon formation were found to be the
most stable surface intermediates on both catalysts. Surface carbon (13Cs),
deposited via the Boudouard reaction using 13CO, was active and was detected in
the C2+ hydrocarbon products as the result of a coupling reaction with 12Cs
rather than with 13Cs. Six distinct carbon pools (Cα1, Cα2, Cβ1, Cγ1, Cγ2 and Cδ1)
were identified during isothermal and temperature programmed surface
reactions. Graphitic carbon (Cδ1) has the highest coverage of all the surface
carbonaceous species on the end of the run sample.
45

Reactivity of surface carbonaceous intermediates on iron-based Fischer-Tropsch catalysts
3.1. Introduction
The high temperature Fischer-Tropsch (HTFT) process [1,2] comprises a
complex network of elementary reaction steps. Apart from the main HTFT
products (olefins and paraffins), these steps need to account for the formation
of CO2, carbon and oxygenates (alcohols, acids, aldehydes and ketones) and
aromatics. To date, the mechanisms in literature do not fully explain the
product distribution of the HTFT process. In part, this is due to the complex
products spectrum and the fact that the working iron-catalyst consists of a
mixture of iron carbides, iron oxides, and α-iron [3,4]. Combining the
knowledge of the rates of the elementary reaction steps with the reactivity of
the surface intermediates and then correlating this to the formation of the
various iron phases is paramount to understanding the overall mechanistic
pathway. In this paper, we focus on the reactivity of the surface intermediates
at HTFT conditions (330°C and 1.2 bar).
Knowledge about the surface species and reaction intermediates during the
Fischer-Tropsch Synthesis (FTS) is essential in developing reaction pathways
which can lead to a plausible mechanism. Many surface species have already
been identified using techniques such as infra-red spectroscopy (IR),
secondary ion mass spectroscopy (SIMS), and electron energy loss
spectroscopy (EELS) which has been reviewed by Claeys and Van Steen [5].
Some of the relevant species are listed in Table 3.1, where the subscript s
denotes adsorption of that atom onto the catalyst surface. Steady State
Isotopic Transient Kinetic Analysis (SSITKA) [6-10] can also be used to
identify possible reaction intermediates, their concentrations and possible
reaction pathways.
46

Chapter 3
Table 3.1: List of surface species identified on a Fischer Tropsch catalyst with techniques such as EELS, IR, etc. Adapted from Claeys and Van Steen [5].
Surface Species Notation Surface Species Notation
Alkyl R-C sH2 Formate Os-CH-Os
Alkylidene R-C sH Hydrogen Hs
Alkylidyne R-C s Hydroxyl HOs
Allyl R-CH=CH2-CsH2 Methylidyne C sH
Carbon Monoxide CsO Methylene C sH2
Carbon Cs Methyl C sH3
Enol HCs-OH Vinyl R-CH=CsH
R = CnH2n+1 with n≥0
Temperature programmed surface reaction (TPSR) methods with either
hydrogen (TPH) or oxygen (TPO) are extremely powerful in characterising
surface intermediates [11-13]. The challenge with the ex-situ TPSR methods
for the FTS is passivating the catalyst. In the case of iron-based catalysts,
phase changes can readily occur at ambient temperature [14] if the correct
passivation method is not followed. In-situ TPSR measurements therefore
provide more trustworthy data. Isothermal surface reaction (ISR) can also be
applied to working catalysts at the reaction temperature to characterise the
surface intermediates [12]. This technique is extremely useful for capturing
those surface intermediates which cannot be detected with TPH.
The carbon deposited on the catalyst by CO disproportionation (or
Boudouard reaction) prior to exposure to FTS conditions have been shown to
have a high reactivity towards FT products [15,16]. These studies were
performed on Ni, Co and Ru at low temperatures (<300°C) where it is
difficult to distinguish between COads and Cads. At HTFT conditions, COads
will be lower [17] and there will be more Cads deposited. However, less
reactive surface carbon is also formed, making the analysis technique for
active surface carbon very important. Mims and McCandlish [18,19] used
47

Reactivity of surface carbonaceous intermediates on iron-based Fischer-Tropsch catalysts
isotopic transient techniques to show that on an Fe/K catalyst (237°C, H2/CO
= 1, and 0.9 bar), the majority of the surface carbon is in the monomeric
building block pool whilst only a small fraction is part of the pool of growing
hydrocarbon chains. No measurable amount of COads was detected. Stockwell
et al. [20] also measured a very small amount of COads, only 8 μmol
COads.gcat-1 equivalent to 0.1 monolayer of CO, on a 10 wt% Fe/Al2O3 catalyst
(285°C, H2/CO = 9, and 1 bar), using the same isotopic transient methods.
It is well known in the open literature that iron-based Fischer-Tropsch
catalysts transform during the synthesis. This transformation reflects a change
in the catalyst phases (α-Fe, iron oxides, and iron carbides). Datye et al. [3]
used X-ray diffraction (XRD), transmission electron microscopy (TEM) and
Mössbauer spectroscopy to correlate these phase changes to changes in the
Fischer-Tropsch activity. The major challenge with ex-situ characterisation
techniques is correlating the data to the Fischer-Tropsch activity and
selectivity. Usually, numerous samples, at different times on stream, are
required to formulate a plausible correlation to the FTS performance of the
catalyst. The general trend in literature is therefore to use in-situ methods.
Raupp and Delgass [21] used in-situ Mössbauer to link the FT activity to the
extent of carbidation. Most recently, Du Plessis [22] used in-situ XRD in an
attempt to correlate the phase changes to trends in the catalyst activity.
SSITKA studies using H2/D2 have been shown to be useful in
characterising surface intermediates amid the kinetic isotopic effects. This is
an in-situ technique at realistic reaction conditions and hence provides data
which are more trustworthy than the traditional ex-situ methods. Marquez-
Alvarez et al. [23] could detect all three surface intermediates of CH4
following a H2/D2 exchange for a Ni-SiO2 catalyst at 250°C, 1 bar, and H2/CO
= 2. The authors concluded that CHads was the most abundant intermediate
and the rate determining step being the hydrogenation of CHads. Happel et al.
[24-26] modelled their H2/D2 experiments for the methanation reaction on a
48

Chapter 3
Ni-based catalyst at 210°C and came to a similar conclusion with Cads also
being as abundant as CHads.
The properties and the dynamic behaviour of each of the surface species
need to be investigated in the working state of the catalyst to obtain
fundamental mechanistic information. In this present work, the hydrogenation
of carbon monoxide, on an iron-based catalyst at higher temperatures, is
studied with the aim of understanding the reactivity of the surface
carbonaceous species. Both ex-situ and in-situ temperature programmed
surface reaction experiments and isotopic switching experiments were
performed to elucidate the mechanistic pathway for the formation of methane
and higher hydrocarbons. Experiments were performed on a freshly reduced
catalyst, on a carbided catalyst, and on a spent catalyst.
3.2. Results and Discussion
3.2.1. Transients at the start of the Fischer-Tropsch synthesis
The introduction of synthesis gas into the reactor results in various
transients. Schulz et al. [27,28] characterised transient kinetic regimes (or
episodes) during the Fischer-Tropsch synthesis as a result of the changing
phases (-Fe, iron oxides, and iron carbides) of the iron catalyst. These
transient regimes were linked to changes in both the catalyst activity and
selectivity. In a similar approach, four distinct transient kinetic regimes are
identified in Figure 3.1. In the first regime, H2O formation is very fast and CO
dissociation is observed. The latter was also observed by Schulz et al. [28] in
their first episode. The breakthrough of H2O first is due to the formation of
Fe3C (cementite) from metallic iron, according to the reaction:
49

Reactivity of surface carbonaceous intermediates on iron-based Fischer-Tropsch catalysts
3Fe + CO + H2 Fe3C + H2O [1]
0.0E+00
2.0E-10
4.0E-10
6.0E-10
8.0E-10
1.0E-09
1.2E-09
1.4E-09
0 10 20 30 40 50 6
Time [min]
MS
ion
cu
rren
t [A
mp
s]
CO
H2O
CH4
CO2
0
H2 (420°C) Ar (330°C) H2/CO/Ar
0.0E+00
2.0E-10
4.0E-10
6.0E-10
8.0E-10
1.0E-09
1.2E-09
1.4E-09
0 10 20 30 40 50 6
Time [min]
MS
ion
cu
rren
t [A
mp
s]
CO
H2O
CH4
CO2
0
0.0E+00
2.0E-10
4.0E-10
6.0E-10
8.0E-10
1.0E-09
1.2E-09
1.4E-09
0 10 20 30 40 50 6
Time [min]
MS
ion
cu
rren
t [A
mp
s]
CO
H2O
CH4
CO2
0
H2 (420°C) Ar (330°C) H2/CO/Ar
Figure 3.1: H2O, CO2, CO and CH4 transients at the start of the Fischer Tropsch synthesis on a freshly reduced catalyst. Experimental conditions: reduction with 80 ml.min-1 of 50 vol.% H2/Ar at 420°C, the reactor is then cooled to 330°C under flowing Ar and the Fischer Tropsch reaction is started with 45 ml.min-1 H2, 3 ml.min-1 CO and 15 ml.min-1 Ar at 1.2 bar.
It is noteworthy to mention that these transients fit the in-situ XRD work
by Du Plessis [22] in which a peak in activity (H2O signal) is correlated with
the formation of cementite (Fe3C) before the steady state Hagg carbide
(Fe5C2) is formed. In the second regime, CO2, CO and CH4 start to break
through. Both the CO and CO2 signals coincide suggesting that this CO is
most probably a product from the fragmentation of CO2. This conclusion is
50

Chapter 3
based on the similar shapes of these transients. In typical 13CO SSITKA
experiments, one would expect the 13CO signal to pass through the reactor.
However, here the catalyst phase changes and various associated reactions
either consume or produce CO.
In the third regime, the H2O and CO2 signals start to decline whilst CO
increases sharply. The decreasing CO2 signal together with the increasing CO
signal is most probably due to the reverse water gas shift (RWGS) reaction.
However, part of this CO could also be simply the reactant passing through
the reactor. One would expect the H2O signal to also increase with RWGS
activity. The decreasing H2O can be explained by a loss of metallic iron
(active sites) as the iron catalyst starts to change into the different carbides
[22].
In the fourth and final regime, pseudo steady state conditions are obtained.
The time scales for these regimes are very different to those reported by
Schulz et al. [28], especially with regards to reaching the steady state. Schulz
et al. [28] worked at lower temperatures (250°C) and higher pressures (10
bar), both of which result in a longer residence time inside the reactor,
compared to our reaction conditions. The high temperatures and lower
pressures used in our study resulted in a faster first regime, 2-3 min for carbon
deposition, compared to 10-15 min observed by Schulz et al. [28].
In Figure 3.2, the different regimes can also be identified. However, in this
case the Fischer-Tropsch synthesis was started on a carbided catalyst as
opposed to the freshly reduced catalyst in Figure 3.1. The carbided catalyst
was exposed to synthesis gas for at least 20 hr. The first regime in which
carbon deposition takes place is still 2-3 min for the carbided catalysts.
However, now H2O has already reached the maximum concentration. In the
second regime, CO, CO2 and CH4 start to break through similarly as in Figure
3.1. In this case, the CO signal increases rapidly and could not be linked to the
51

Reactivity of surface carbonaceous intermediates on iron-based Fischer-Tropsch catalysts
CO2 formation. The CH4 formed also was much higher in this case than for
the freshly reduced catalyst. This is most probably due to the reaction of
surface carbon or hydrocarbon species which are still present on the catalyst
surface. The maximum CH4 concentration is also reached much faster in this
case and steady-state conditions are obtained twice as fast as compared to a
freshly reduced catalyst.
0.0E+00
1.0E-09
2.0E-09
3.0E-09
4.0E-09
5.0E-09
6.0E-09
0 2 4 6 8
0.0E+00
5.0E-09
1.0E-08
1.5E-08
2.0E-08
2.5E-08
3.0E-08
3.5E-08
Time [min]
MS
ion
cu
rren
t [A
mp
s]
COH2O
CH4
CO2
MS
ion
cu
rren
t [A
mp
s]
H2/CO/Ar Ar H2/CO/Ar
0.0E+00
1.0E-09
2.0E-09
3.0E-09
4.0E-09
5.0E-09
6.0E-09
0 2 4 6 8
0.0E+00
5.0E-09
1.0E-08
1.5E-08
2.0E-08
2.5E-08
3.0E-08
3.5E-08
Time [min]
MS
ion
cu
rren
t [A
mp
s]
COH2O
CH4
CO2
MS
ion
cu
rren
t [A
mp
s]
H2/CO/Ar Ar H2/CO/Ar
Figure 3.2: H2O, CO2, CO and CH4 transients at the start of the Fischer Tropsch synthesis on a carbided catalyst. Experimental conditions: Fischer Tropsch reaction is stopped, the reactor is purged with Ar and the Fischer Tropsch reaction is restarted with 45 ml.min-1 H2, 3 ml.min-1 CO, and 15 ml.min-1 Ar at 330°C and 1.2 bar.
The Fischer-Tropsch synthesis was also started with D2/CO on a freshly
reduced catalyst. The resulting transients for ethane and ethene are shown in
Figure 3.3 and 3.4, respectively. For ethane, two surface intermediates are
observed, C2Hs and C2H3,s. It is noteworthy mentioning at this stage that
52

Chapter 3
SSITKA experiments using D2 are considered ITKA experiments due to the
kinetic isotope effect [9] which disturbs the steady state behaviour of the
catalyst. Therefore, these results are interpreted only qualitatively. In Figure
3.3, both surface intermediates break through at the same time indicating
similar activities (ignoring kinetic isotope effects). The C2Hs surface
intermediate seems to occupy a larger surface area as its coverage is larger.
0.0
0.2
0.4
0.6
0.8
1.0
0.0 0.5 1.0 1.5
Time [min]
Nor
mal
ised
res
pon
se [
-] C2D6
C2H1D5
C2H3D3
H2 (420°C) Ar (330°C) D2/CO/Ar
C2H2D4
0.0
0.2
0.4
0.6
0.8
1.0
0.0 0.5 1.0 1.5
Time [min]
Nor
mal
ised
res
pon
se [
-] C2D6
C2H1D5
C2H3D3
H2 (420°C) Ar (330°C) D2/CO/Ar
C2H2D4
Figure 3.3: C2H6 transients at the start of the Fischer-Tropsch synthesis on a freshly reduced catalyst. Experimental conditions: reduction with 80 ml.min-1 of 50 vol.% H2/Ar at 420°C, the reactor is then cooled to 330°C under flowing Ar and the Fischer-Tropsch reaction is started with 45 ml.min-1 D2, 3 ml.min-1 CO, and 15 ml.min-1 Ar at 1.2 bar.
In Figure 3.4, all three surface intermediates of ethene could be detected.
The C2Hs and C2H2,s intermediates break through together with fully labelled
ethene. The C2Hs intermediate has a larger coverage and seems to be less
53

Reactivity of surface carbonaceous intermediates on iron-based Fischer-Tropsch catalysts
0.0
0.2
0.4
0.6
0.8
1.0
0.0 0.5 1.0 1.5Time [min]
Nor
mal
ised
resp
onse
[-]
C2H1D3
C2D4
C2H3D1C2H2D2
H2 (420°C) Ar (330°C) D2/CO/Ar
0.0
0.2
0.4
0.6
0.8
1.0
0.0 0.5 1.0 1.5Time [min]
Nor
mal
ised
resp
onse
[-]
C2H1D3
C2D4
C2H3D1C2H2D2
H2 (420°C) Ar (330°C) D2/CO/Ar
Figure 3.4: C2H4 transients at the start of the Fischer-Tropsch synthesis on a freshly reduced catalyst. Experimental conditions: reduction with 80 ml.min-1 of 50 vol.% H2/Ar at 420°C, the reactor is then cooled to 330°C under flowing Ar and the Fischer-Tropsch reaction is started with 45 ml.min-1 D2, 3 ml.min-1 CO, and 15 ml.min-1 Ar at 1.2 bar.
reactive. Interestingly, the third intermediate, C2H3,s, which was detected
together with C2Hs in the case of ethane, only breaks through after ca. 30
seconds. This time lag coincides with a decrease in the C2H2,s coverage.
Based on this observation, it seems that the C2H2,s and C2H3,s surface
intermediates are interlinked carbon pools and that the C2Hs surface
intermediate is a larger and less reactive carbon pool. At this stage, we cannot
provide a plausible mechanistic reason as to why no C2H2,s surface
intermediate was detected for ethane. One possible explanation could be that
the C2H2,s surface intermediate for ethane is extremely reactive with a very
54

Chapter 3
small surface coverage, making it virtually undetectable with the technique
used in this work. Mechanistically, this result also implies two different
pathways towards ethene and ethane formation and most likely the C2’s do
not desorb from the same intermediate. The reason we observed fully labelled
C2H4 and C2H6 on a freshly reduced catalyst is because H2 was used during
the reduction. It seems that although the reactor was purged with Ar, not all
the chemisorbed H2 was removed.
3.2.2. CO disproportion
The carbon was deposited on a freshly reduced catalyst by 13CO
disproportion (via the Boudouard reaction) at 330°C and 1.2 bar for 3 min.
The mass spectrometer intensities were traced over time when switching to
inert and it was observed that the chemisorbed CO2 elutes before 10 min. In
these experiments, the chemisorbed 13CO and 13CO2 were first removed by
purging the reactor with Ar for at least 15 min. Thereafter, the Fischer-
Tropsch synthesis with 12CO/H2 was started to determine if the deposited 13Cs
on the catalyst surface was reactive. The result, presented in Figure 3.5, shows
the presence of 13Cs in both the C2 and C3 hydrocarbons. In terms of C-C
coupling, the combination of 13C with 12C was more significant than the
combination of two 13Cs species. The latter was observed (not shown here) but
in small amounts (ca. 25% of the normalised intensity) and with a slight delay
in the break through. This delay could be attributed to carbide formation in
which the 13Cs dissolves into the catalyst bulk but is still mobile and able to
react. Alternatively, it could also be that certain 13Cs species were deposited
on less reactive sites. The main conclusion from this experiment is that 13Cs
deposited via CO disproportion reacts into FT products. This also implies that
the formation of unreactive Cs (or graphitic carbon), which is normally
observed in the HTFT process, is a relatively slow reaction.
55

Reactivity of surface carbonaceous intermediates on iron-based Fischer-Tropsch catalysts
3.2.3. H2/D2 isotopic flushing
The results for the H2/D2 exchange reactions carried out on a carbided
catalyst, which was online for ca. 20 hr, are presented in Figure 3.6 to 3.9
following a H2/CO/Ar/ D2/CO/Ar/Ne switch. In Figure 3.6, the transients
of Ne, H2, D2 and HD are presented. The two main observations are: (1) an
observable delay between the Hads and Ne transient, and (2) the presence of
the product HD. The former suggest that a measurable amount of Hads is
0.0
0.2
0.4
0.6
0.8
1.0
0 20 40 60 80
13C=12C
13C--12C
13C=12C2
13C--12C2
Time [min]
Nor
mal
ised
resp
onse
[-]
13C=12C
13C-12C
13C=12C2
13C-12C2
0.0
0.2
0.4
0.6
0.8
1.0
0 20 40 60 80
13C=12C
13C--12C
13C=12C2
13C--12C2
Time [min]
Nor
mal
ised
resp
onse
[-]
13C=12C
13C-12C
13C=12C2
13C-12C2
Figure 3.5 Normalised responses of ethane, ethane, propane and propene formed after 13CO disproportional on a reduced Fe/K catalyst at 330°C, 1.2 bar and H2/CO = 9.
56

Chapter 3
present on the catalyst surface. The latter is indicative of the dissociative
adsorption of H2. An exact value for Hads is not reported since we can not
accurately account for water and oxygenates which consume Hads. In
comparison to CO [29], the adsorption/desorption rate of H2 is slower than
CO. The break through of 13CO/12CO is immediate and overlaps with the Ne
transient whilst the D2/H2 transients have a time lag. This behaviour is similar
to the observation made by Van Dijk [10] for a cobalt based catalyst. In
summary, this implies that H2 adsorbs/desorbs slower than CO on an Fe-
surface.
0.0
0.2
0.4
0.6
0.8
1.0
0 5 10 15 20
Time [s]
Nor
mal
ised
resp
onse
[-]
H2
D2
HD
Ne
H2/ CO/Ar D2/ CO/Ar12 12
0.0
0.2
0.4
0.6
0.8
1.0
0 5 10 15 20
Time [s]
Nor
mal
ised
resp
onse
[-]
H2
D2
HD
Ne
H2/ CO/Ar D2/ CO/Ar12 12
Figure 3.6: Evolution of H2, HD and D2 species during an isotopic transient switch from H2/CO to D2/CO on the iron-based catalyst. (Reaction conditions, 330°C, 1.2 bar and H2/CO = 9)
57

Reactivity of surface carbonaceous intermediates on iron-based Fischer-Tropsch catalysts
The normalised transients of CHxD4-x (x = 0-4) are shown in Figure 3.7. All
three methane intermediates were detectable (viz. CHs, CH2,s, and CH3,s). The
CH3,s surface intermediate breaks through slightly faster than the other two
and also has a lower surface coverage. The CHs surface intermediate has a
longer tail than the other two surface intermediates, implying either a lower
overall reactivity or its formation from the de-hydrogenation of the other two
surface species.
Time [s]
Nor
mal
ised
resp
onse
[-]
0.0
0.2
0.4
0.6
0.8
1.0
0 5 10 15 20
CH4
CD4
Ne
CH3D1
CH2D2
CH1D3
H2/ CO/Ar D2/ CO/Ar
Time [s]
Nor
mal
ised
resp
onse
[-]
12 12
0.0
0.2
0.4
0.6
0.8
1.0
0 5 10 15 20
CH4
CD4
Ne
CH3D1
CH2D2
CH1D3
Time [s]
Nor
mal
ised
resp
onse
[-]
0.0
0.2
0.4
0.6
0.8
1.0
0 5 10 15 20
CH4
CD4
Ne
CH3D1
CH2D2
CH1D3
H2/ CO/Ar D2/ CO/Ar12 12
Figure 3.7: Responses of the isotopic variants of methane following the switch H2/CO to D2/CO for an iron-based catalyst at 330°C, 1.2 bar and H2/CO = 9.
In Figure 3.8 and 3.9, the D-transients of ethane and ethene are presented,
respectively. In comparison to the fresh catalyst (see Figures 3.3 and 3.4),
58

Chapter 3
0.0
0.2
0.4
0.6
0.8
1.0
0 20 40 60
Time [s]
Nor
mal
ised
resp
onse
[-] C2H6 C2D6
C2H1D5
H2/ CO/Ar D2/ CO/Ar12 12
0.0
0.2
0.4
0.6
0.8
1.0
0 20 40 60
Time [s]
Nor
mal
ised
resp
onse
[-] C2H6 C2D6
C2H1D5
0.0
0.2
0.4
0.6
0.8
1.0
0 20 40 60
Time [s]
Nor
mal
ised
resp
onse
[-] C2H6 C2D6
C2H1D5
H2/ CO/Ar D2/ CO/Ar12 12
Figure 3.8: Responses of the isotopic variants of ethane following the switch H2/CO to D2/CO for an iron-based catalyst at 330°C, 1.2 bar and H2/CO = 9.
Time [s]
Nor
mal
ised
resp
onse
[-]
0.0
0.2
0.4
0.6
0.8
1.0
0 20 40 60
C2H4
C2D4
C2H1D3
H2/ CO/Ar D2/ CO/Ar
Time [s]
Nor
mal
ised
resp
onse
[-]
12 12
0.0
0.2
0.4
0.6
0.8
1.0
0 20 40 60
C2H4
C2D4
C2H1D3
Time [s]
Nor
mal
ised
resp
onse
[-]
0.0
0.2
0.4
0.6
0.8
1.0
0 20 40 60
C2H4
C2D4
C2H1D3
H2/ CO/Ar D2/ CO/Ar12 12
Figure 3.9: Responses of the isotopic variants of ethene following the switch H2/CO to D2/CO for an iron-based catalyst at 330°C, 1.2 bar and H2/CO = 9.
59

Reactivity of surface carbonaceous intermediates on iron-based Fischer-Tropsch catalysts
only a single surface intermediate, C2Hs, was detectable for both ethane and
ethene on the carbided catalyst. The tailing of this surface intermediate is
similar to that of the CHs species detected for methane suggesting that the
CHs surface intermediate is the precursor for ethane and ethene formation.
The formation of a C2Hs species by CHs diffusing onto Cs has been proposed
by Liu and Hu [30] for a Ru-based catalyst. They also proposed that the C2Hs
species is the most stable and abundant intermediate as part of their (Cs + Cs-
R) mechanistic pathway to Fischer-Tropsch products. Our experimental result
for the Fe-based catalyst supports their conclusion.
3.2.4. In-situ isothermal hydrogenation
The Fischer-Tropsch synthesis was abruptly stopped by switching to an
inert feed. It can be expected that during this process, extremely reactive
surface intermediates will continue to react whilst chemisorbed reactants will
also be removed. The transients for this step change are shown in Figure
3.10a. For the 60 min duration, the only noticeable peak was m/z = 44 at ca.
10 min. This is most likely to be CO2, however as shown in Figure 10b, there
was no associated peak for CO2 at m/z = 28 (from the fragmentation to CO).
So, this peak at m/z = 44 could be a higher hydrocarbon such as propane.
These experiments were performed with the online MS, so further work using
the online GCMS is required to correctly identify this peak.
60

Chapter 3
0.0E+00
6.0E-10
1.2E-09
1.8E-09
0 10 20 30 40 50 60
0.0E+00
1.0E-08
2.0E-08
3.0E-08
Time [min]
m/z = 2
m/z = 44
m/z = 28
m/z = 15
m/z = 18
m/z = 16
MS
ion
curr
ent
[Am
ps]
MS
ion
curr
ent
[Am
ps]
0.0E+00
6.0E-10
1.2E-09
1.8E-09
0 10 20 30 40 50 60
0.0E+00
1.0E-08
2.0E-08
3.0E-08
Time [min]
m/z = 2
m/z = 44
m/z = 28
m/z = 15
m/z = 18
m/z = 16
MS
ion
curr
ent
[Am
ps]
MS
ion
curr
ent
[Am
ps]
0.0E+00
6.0E-10
1.2E-09
1.8E-09
0 5 10 15
0.0E+00
1.0E-08
2.0E-08
3.0E-08
Time [min]
m/z = 2
m/z = 44
m/z = 28
m/z = 15
m/z = 18
m/z = 16
MS
ion
cu
rren
t [A
mp
s]
MS
ion
cu
rren
t [A
mp
s]
0.0E+00
6.0E-10
1.2E-09
1.8E-09
0 5 10 15
0.0E+00
1.0E-08
2.0E-08
3.0E-08
Time [min]
m/z = 2
m/z = 44
m/z = 28
m/z = 15
m/z = 18
m/z = 16
MS
ion
cu
rren
t [A
mp
s]
MS
ion
cu
rren
t [A
mp
s]
a
b
0.0E+00
6.0E-10
1.2E-09
1.8E-09
0 10 20 30 40 50 60
0.0E+00
1.0E-08
2.0E-08
3.0E-08
Time [min]
m/z = 2
m/z = 44
m/z = 28
m/z = 15
m/z = 18
m/z = 16
MS
ion
curr
ent
[Am
ps]
MS
ion
cu
rren
t [A
mp
s]
0.0E+00
6.0E-10
1.2E-09
1.8E-09
0 10 20 30 40 50 60
0.0E+00
1.0E-08
2.0E-08
3.0E-08
Time [min]
m/z = 2
m/z = 44
m/z = 28
m/z = 15
m/z = 18
m/z = 16
MS
ion
curr
ent
[Am
ps]
MS
ion
cu
rren
t [A
mp
s]
0.0E+00
6.0E-10
1.2E-09
1.8E-09
0 5 10 15
0.0E+00
1.0E-08
2.0E-08
3.0E-08
Time [min]
m/z = 2
m/z = 44
m/z = 28
m/z = 15
m/z = 18
m/z = 16
MS
ion
cu
rren
t [A
mp
s]
MS
ion
cu
rren
t [A
mp
s]
0.0E+00
6.0E-10
1.2E-09
1.8E-09
0 5 10 15
0.0E+00
1.0E-08
2.0E-08
3.0E-08
Time [min]
m/z = 2
m/z = 44
m/z = 28
m/z = 15
m/z = 18
m/z = 16
MS
ion
cu
rren
t [A
mp
s]
MS
ion
cu
rren
t [A
mp
s]
a
b
Figure 3.10: (a) Transients at the end of the FTS showing the first 60 min after switching from H2/CO = 9 to an inert feed. Reaction temperature (330°C) and pressure (1.2 bar) were kept constant.(b) Transients at the end of the FTS showing the first 15 min after switching from H2/CO = 9 to an inert feed. Reaction temperature (330°C) and pressure (1.2 bar) were kept constant.
61

Reactivity of surface carbonaceous intermediates on iron-based Fischer-Tropsch catalysts
The isothermal hydrogenation was started after purging the reactor to
remove all the chemisorbed species. The profiles for CH4 and H2O are shown
in Figure 3.11. Two distinct peaks are observed. Both peaks are associated
with the formation of CH4 and H2O, implying two active sites for the Fischer-
Tropsch reactions (see equations 2 and 3). The peaks are clearly deconvoluted
which is not expected for an isothermal operation. This could be due to the
faster reaction of the surface species compared to the sub-surface species.
Alternatively, it could also be that unhydrogenated species requiring more
Hads additions take longer to react.
CHx + (4-x) Hs CH4 [2]
OHs + Hs H2O + 2s [3]
Time [min]
0.0E+00
2.0E-11
4.0E-11
6.0E-11
0 10 20 30 40 50 60
0.0E+00
2.0E-13
4.0E-13
6.0E-13
m/z = 15
m/z = 18
m/z = 17
m/z = 19
m/z = 16
1 2
MS
ion
cu
rren
t [A
mp
s]
MS
ion
cu
rren
t [A
mp
s]
Time [min]
0.0E+00
2.0E-11
4.0E-11
6.0E-11
0 10 20 30 40 50 60
0.0E+00
2.0E-13
4.0E-13
6.0E-13
m/z = 15
m/z = 18
m/z = 17
m/z = 19
m/z = 16
1 2
MS
ion
cu
rren
t [A
mp
s]
MS
ion
cu
rren
t [A
mp
s]
Figure 3.11: In-situ ISR results for a working Fe/K catalyst during the FTS at 330°C, 1.2 bar and H2/CO = 9. Methane, water and oxygen (m/z = 16 -19) were monitored after a switch from H2/CO = 9 to Ar (> 15 min) to D2/Ar.
62

Chapter 3
In Figure 3.12, the peaks for CO and CO2 correspond to the same two
active sites as in Figure 3.11. The formation of CO and CO2 can either be
from the reaction between surface oxygen and carbon or the hydrogenation of
formate species and the subsequent WGS products as shown in equation [4].
This reaction corresponds more significantly with peak 2 in Figure 3.12. This
also implies that sub-surface species become active when the surface species
are cleaned (hydrogenated) away. Based on the peak areas, the first peak,
which represents the more active site, has a lower coverage compared to the
second peak, representing the less reactive peak.
COs + H2Os COOHs + Hs CO2 + 2Hs [4]
Time [min]
0.0E+00
2.0E-11
4.0E-11
6.0E-11
0 10 20 30 40 50 60
0.0E+00
2.0E-13
4.0E-13
6.0E-13
m/z = 15
m/z = 28
m/z = 44
MS
ion
cu
rren
t [A
mp
s]
MS
ion
curr
ent
[Am
ps]
Time [min]
0.0E+00
2.0E-11
4.0E-11
6.0E-11
0 10 20 30 40 50 60
0.0E+00
2.0E-13
4.0E-13
6.0E-13
m/z = 15
m/z = 28
m/z = 44
MS
ion
cu
rren
t [A
mp
s]
MS
ion
curr
ent
[Am
ps]
Figure 3.12: In-situ ISR results for a working Fe/K catalyst during the FTS at 330°C, 1.2 bar and H2/CO = 9. Methane, carbon monoxide and carbon dioxide (m/z = 16, 28 and 44) were monitored after a switch from H2/CO = 9 to Ar (> 15 min) to D2/Ar.
63

Reactivity of surface carbonaceous intermediates on iron-based Fischer-Tropsch catalysts
3.2.5. In-situ temperature programmed hydrogenation
The in-situ TPH profiles for CH4 and H2O are shown in Figure 3.13.
Initially, at low temperatures (below 150°C), there are high concentrations of
H2O, implying the presence of Oads which can be hydrogenated easily. Two
H2O peaks were detected prior to the synthesis temperature (330°C), one at
205°C and the second at 310°C. The first CH4 peak starts to break through at
350°C. The maximum temperature attainable in the in-situ reactor for TPH
was 450°C which was not high enough to hydrogenate all of the CH4
intermediates. However, holding the temperature at 450°C provided useful
information. The CH4 TPH profile can be deconvoluted into two peaks, one
representing an intermediate (C) which can be hydrogenated at ~350°C,
whilst the other (C) requires temperatures in excess of 450°C.
0.0E+00
5.0E-11
1.0E-10
1.5E-10
2.0E-10
2.5E-10
3.0E-10
30 120 220 370 450 450 310
0.0E+00
2.1E-11
4.2E-11
6.3E-11
8.4E-11
Temperature [°C]
m/z = 18
m/z = 13
m/z = 15
m/z = 14
m/z = 17
m/z = 16
MS
ion
cu
rren
t [A
mp
s]
MS
ion
curr
ent
[Am
ps]
0.0E+00
5.0E-11
1.0E-10
1.5E-10
2.0E-10
2.5E-10
3.0E-10
30 120 220 370 450 450 310
0.0E+00
2.1E-11
4.2E-11
6.3E-11
8.4E-11
Temperature [°C]
m/z = 18
m/z = 13
m/z = 15
m/z = 14
m/z = 17
m/z = 16
MS
ion
cu
rren
t [A
mp
s]
MS
ion
curr
ent
[Am
ps]
Figure 3.13: Methane and water produced during in-situ TPH for a Fe/K catalyst after FTS at 330°C, 1.2 bar and H2/CO = 9. See Chapter 2 for TPH program.
64

Chapter 3
There were also H2O peaks at both temperatures corresponding to C and
Csuggesting that these intermediates are active for Fischer-Tropsch
synthesis. The profiles for m/z = 13 (13C) were only observed at temperatures
in excess of 400°C implying that there exists some surface carbon which is
inactive at reaction temperature but can be hydrogenated at higher
temperatures. This carbon should not be confused with graphitic carbon (C)
which is also inactive at reaction temperature but cannot be hydrogenated. It
usually requires a gasification type of reaction with either O2 or CO. The
higher molecular weight Fischer-Tropsch products (m/z = 30 to 56,
representing C2-C4) were also captured during the in-situ TPH and are
presented in Figure 3.14. In comparison to the CH4 intermediate, which was
not completed hydrogenated, the C2-C4 hydrocarbon intermediates were
0.0E+00
8.0E-13
1.6E-12
2.4E-12
3.2E-12
4.0E-12
4.8E-12
30 120 220 370 450 450 310
0.0E+00
1.0E-13
2.0E-13
3.0E-13
4.0E-13
5.0E-13
6.0E-13
Temperature [°C]
m/z = 55 & 56
m/z = 32
m/z = 43 m/z = 46
m/z = 30
MS
ion
cu
rren
t [A
mp
s]
MS
ion
cu
rren
t [A
mp
s]
0.0E+00
8.0E-13
1.6E-12
2.4E-12
3.2E-12
4.0E-12
4.8E-12
30 120 220 370 450 450 310
0.0E+00
1.0E-13
2.0E-13
3.0E-13
4.0E-13
5.0E-13
6.0E-13
Temperature [°C]
m/z = 55 & 56
m/z = 32
m/z = 43 m/z = 46
m/z = 30
MS
ion
cu
rren
t [A
mp
s]
MS
ion
cu
rren
t [A
mp
s]
Figure 3.14: Fischer-Tropsch hydrocarbons produced during in-situ TPH for a Fe/K catalyst after FTS at 330°C, 1.2 bar and H2/CO = 9. See Chapter 2 for TPH program.
65

Reactivity of surface carbonaceous intermediates on iron-based Fischer-Tropsch catalysts
completely hydrogenated at 450°C and were represented by only this single
peak. This implies that the C2+ intermediates have a lower surface coverage
than the CH4 intermediates. Furthermore, Cs which diffuses into the catalyst
bulk, is mostly hydrogenated to methane and does not contribute significantly
to the C2+ hydrocarbons.
Finally, the TPH profile for CO2 is presented in Figure 3.15. There are
three distinct peaks for the unlabelled CO2 (m/z = 44), observed at 75°C,
250°C, and 450°C. The peak at 250°C is broad, starting at 160°C and ending
at 350°C whilst the one at 450°C is relatively small. One the other hand, there
is a distinct peak at 450°C for labelled CO2 (m/z 45 and 29). The labelled 13CO2 is most probably formed from 13Cs which was deposited during the
0.0E+00
1.0E-12
2.0E-12
3.0E-12
4.0E-12
5.0E-12
30 120 220 370 450 450 310
0.0E+00
2.0E-11
4.0E-11
6.0E-11
8.0E-11
1.0E-10
Temperature [°C]
m/z = 45
m/z = 28
m/z = 29
m/z = 44
MS
ion
cu
rren
t [A
mp
s]
MS
ion
cu
rren
t [A
mp
s]
0.0E+00
1.0E-12
2.0E-12
3.0E-12
4.0E-12
5.0E-12
30 120 220 370 450 450 310
0.0E+00
2.0E-11
4.0E-11
6.0E-11
8.0E-11
1.0E-10
0.0E+00
1.0E-12
2.0E-12
3.0E-12
4.0E-12
5.0E-12
30 120 220 370 450 450 310
0.0E+00
2.0E-11
4.0E-11
6.0E-11
8.0E-11
1.0E-10
Temperature [°C]
m/z = 45
m/z = 28
m/z = 29
m/z = 44
MS
ion
cu
rren
t [A
mp
s]
MS
ion
cu
rren
t [A
mp
s]
Figure 3.15: CO2 produced during in-situ TPH for a Fe/K catalyst after FTS at 330°C, 1.2 bar and H2/CO = 9. See Chapter 2 for TPH program.
66

Chapter 3
13CO dissociation experiments. This 13Cs could have dissolved into the
catalyst bulk and remained active but requires higher temperatures to be
removed completely.
3.2.6. Temperature programmed surface reactions
The ex-situ TPH profile showing the evolution of CH4 is presented in
Figure 3.16. The temperatures in these experiments were as high as 800°C. In
comparison to the in-situ TPH, the CH4 intermediate could now be completely
hydrogenated at 483°C. The second peak (at 483°C) is larger than the first at
360°C, implying that the less reactive surface intermediate has a greater
surface coverage than the intermediate at 360°C. The TPO result, shown in
Figure 3.17, indicates that the unreactive graphitic carbon covers most of the
catalyst surface. Furthermore the species corresponding to the second peak at
450°C could also be oxygenated making mainly CO and not CO2.
Xu and Batholomew [31] used TPH and Mössbauer spectroscopy on an Fe-
based catalyst to show the presence of four groups of carbonaceous species
during the FTS (265°C, 10 atm, and H2/CO = 1): (1) adsorbed atomic carbon
(C), (2) polymerized hydrocarbon or adsorbed polymeric carbon or
amorphous surface methylene chains (C), (3) bulk iron carbides (Fe2.2C and
Fe2.5C), and (4) graphitic carbon (C). Their spectra could be fitted with
Gaussian curves yielding seven peaks, and Based on
the aforementioned study and the authors’ previous work [13], we can assign
similar nomenclature to our peaks for the combined in-situ and ex-situ TPH
results. Carbidic carbon (C1and C2) dominates initially during the FTS
synthesis and can be removed at temperatures below and up to reaction
conditions (typically below 330°C). There also seems to be the one type of
67

Reactivity of surface carbonaceous intermediates on iron-based Fischer-Tropsch catalysts
Temperature [°C]
Nor
mal
ised
res
pon
se [
-]
0.0
0.2
0.4
0.6
0.8
1.0
0 200 400 600 800
Peak 2, 483°C
Peak 1, 360°C
Temperature [°C]
Nor
mal
ised
res
pon
se [
-]
0.0
0.2
0.4
0.6
0.8
1.0
0 200 400 600 800
Peak 2, 483°C
Peak 1, 360°C
Figure 3.16: Methane produced from ex-situ TPH for a spent Fe/K catalyst after FTS at 330°C, 1.2 bar and H2/CO = 9.
0.0
0.2
0.4
0.6
0.8
1.0
0 200 400 600 800 1000
CO2
CO
Temperature [°C]
Nor
mal
ised
resp
onse
[-]
Peak 2, 483°C
Peak 3, 757°C
CO2
0.0
0.2
0.4
0.6
0.8
1.0
0 200 400 600 800 1000
CO2
CO
Temperature [°C]
Nor
mal
ised
resp
onse
[-]
Peak 2, 483°C
Peak 3, 757°C
CO2
Figure 3.17: CO and CO2 produced from ex-situ TPH for a spent Fe/K catalyst after FTS at 330°C, 1.2 bar and H2/CO = 9.
68

Chapter 3
amorphous carbon (C) at 360°C. The iron carbides (C1and C2) occur in the
region 435-485°C and also consume Cs which remains active. Finally, we
only observed one type of graphitic carbon (C1) which requires temperatures
in excess of 750°C to be completed removed.
In summary, we have shown the existence of various carbonaceous surface
species on an iron-based catalyst, with the use of transient techniques
combined with temperature programmed surface reaction experiments. The
combined results are summarised in Table 3.2.
Table 3.2: A summary of the results from the different experiments used to characterise the surface intermediates on a iron-based catalyst during the high temperature Fischer-Tropsch synthesis.
Surface species
(Carbon Pool (a))
Peak temperatures
(°C)
C2H2,s, C2H3,s C2H2,s (C) Fresh Catalyst
C2Hs (C)
330 (b)
CH3,s CH2,s (C) 205 (c) and 260 (c)
CHs C2Hs (C) 310 (c)
Carbided Catalyst
Fe-carbides (CC) 450 and > 450 (c)
Fe-carbides (CC) 450 (d) and 483 (d) End of run sample
Graphitic carbon (C) 757 (e)
(a) Carbonaceous pools designated similarly to work by Xu and Bartholomew [31].
(b) Data from in-situ isothermal surface reaction measurements (section 3.4).
(c) Data from in-situ temperature programmed hydrogenation measurements (section 3.5).
(d) Data from ex-situ temperature programmed hydrogenation measurements (section 3.6).
(e) Data from ex-situ temperature programmed oxygenation measurements (section 3.6).
69

Reactivity of surface carbonaceous intermediates on iron-based Fischer-Tropsch catalysts
We have not specified if any of these surface species contain oxygen as this
requires the use of oxygen labelled experiments which will form part of a
follow-on study. If the formation of CO2 occurs on oxygen containing surface
intermediates, then this will most probably be part of the C pool (see peak at
260°C in Figure 3.15).
3.3. Conclusions
The reactivities of surface carbonaceous intermediates on an iron-based
catalyst were characterised during the high temperature Fischer-Tropsch
synthesis using isotopic transient kinetic analysis (ITKA), isothermal
hydrogenation, and temperature programmed surface reactions. The main
conclusions from this work are summarised below:
(1) The transients observed at the start of the Fischer-Tropsch synthesis
were different on a carbided catalyst (a catalyst exposed to synthesis
gas) compared to a freshly reduced catalyst. The distinct transient
regimes observed at the start of the Fischer-Tropsch reaction are similar
to those presented in the work by Schulz et al. [28]. On both the fresh
and carbided catalysts, carbon deposition still occurs to the same extent
but water formation and methane formation are faster on the carbided
catalyst. H/D exchanges reactions were used to identify the nature of
the surface intermediates. The surface intermediates at the start of the
Fischer-Tropsch synthesis were different to those on a carbided
catalyst.
(2) The CHs and CCHs surface intermediates were observed on both
catalysts for methane formation and C2 hydrocarbon formation,
respectively. The other Fischer-Tropsch surface intermediates, which
70

Chapter 3
were present of the fresh catalyst, either disappeared on the carbided
catalyst or were too small in concentration to be detected. This
observation is not consistent with the classical carbide mechanism
(Chapter 1) in which CH2 are considered the monomer building blocks
and olefins are formed from H-abstraction.
(3) Surface carbon was deposited via the Boudouard reaction using 13CO
on a reduced catalyst. This carbon (13Cs) was active and detected in
the C2+ hydrocarbon products as a coupling reaction with 12Cs rather
than with 13Cs.
(4) Finally, combing the in-situ and ex-situ temperature programmed
surface reaction data with the in-situ isothermal reaction data,
confirmed the presence of six distinct pools of carbonaceous
intermediates. These were assigned to the four main groups of carbon
species as proposed by Xu and Bartholomew [31]. Two active pools
of carbons (Cα1 and Cα2) can be hydrogenated up to reaction
temperature (330°C) with one pool being more active than the other
and having a lower coverage. Another carbonaceous intermediate
(Cγ1) required temperatures in excess of 483°C to be completed
hydrogenated. This pool had a larger coverage than the combined Cα
pools. Finally, graphitic carbon was detected at 767°C and had the
highest coverage of all the surface species.
71

Reactivity of surface carbonaceous intermediates on iron-based Fischer-Tropsch catalysts
References
[1] Steynberg, A. P., Espinoza, R. L., Jager, B., and Vosloo, A. C., App. Catal. A: Gen. 186 (1999), pp. 41-54.
[2] Dry, M.E. and Steynberg, A.P., Chapter 5, in Stud. Surf. Sci. Catal. 152 (2004), pp 406-481
[3] Datye, A. K., Jin, Y., Mansker, L., Motjope, R. T., Dlamini, T. H., and Coville, N. J., Stud. Surf. Sci. Catal. 130, (2000), pp. 1139-1144.
[4] Sarkar, A., Seth, D., Dozier, A., Neathery, J., Hamdeh, H., and Davis, B., Catal. Lett. 117 (2007), pp. 1-17.
[5] Claeys, M. and Van Steen, E., Chapter 8, in Stud. Surf. Sci. Catal. 152, (2004), pp. 601-680.
[6] J. Happel, J., Chem. Eng. Sci. 33 (1978) 1567.
[7] Bennett, C.O., Catalysis under transient conditions, ACS Symposium Series (1982) 1.
[8] Biloen, P., J. Mol. Catal. 21 (1983) 17.
[9] Shannon, S. L. and Goodwin, J., Chem.Rev. 95 (1995), pp. 677-695.
[10] Van Dijk, H. A. J., PhD thesis, (2001), Technische Universiteit Eindhoven, Eindhoven, the Netherlands. http://alexandria.tue.nl/extra2/200111083.pdf
[11] Efstathiou, A. M., J. Mol. Catal. 69 (1991), pp.41-60.
[12] Kieffer, E. P. and van der Baan, H. S., Appl. Catal. 3 (1982), pp. 245-254.
[13] Eliason, S. A. and Bartholomew, C. H., Stud. Surf. Sci. Catal. 111, (1997), pp. 517-526.
[14] Shroff, M. D. and Datye, A. K., Catal. Lett. 37 (1996), pp. 101-106.
[15] Rabo, J. A., Risch, A. P., and Poutsma, M. L., J. Catal. 53 (1978), pp. 295-311.
[16] Biloen, P., Helle, J. N., and Sachtler, W. M. H., J. Catal. 58 (1979), pp. 95-107.
[17] Blanco, G.L., PhD thesis, (2007), Universiteit Ghent, Ghent, Belgium.
[18] Mims, C. A. and McCandish, L. E., J. Am. Chem. Soc. 107 (1985), pp. 696-697.
72

Chapter 3
73
[19] Mims, C. A. and McCandish, L. E., J. Phys. Chem. 91 (1987), pp. 929-937.
[20] Stockwell, D. M., Bianchi, D., and Bennett, C. O., J. Catal. 113 (1988), pp. 1324.
[21] Raupp, G. B. and Delgass, W. N., J.Catal. 58 (1979), pp. 337-347.
[22] Du Plessis, H.E., PhD thesis (2007), University of Johannesburg, South Africa
[23] Marquez-Alvarez, C., Martin, G. A., and Mirodatos, C., Stud. Surf. Sci. Catal. 119 (1998), pp. 155-160.
[24] Otarod, M., Ozawa, S., Yin, F., Chew, M., Cheh, H. Y., and Happel, J., J. Catal. 84 (1983), pp. 156-169.
[25] Happel, J., Cheh, H. Y., Otarod, M., Ozawa, S., Severdia, A. J., Yoshida, T., and Fthenakis, V., J. Catal. 75 (1982), pp. 314-328.
[26] Happel, J., Suzuki, I., Kokayeff, P., and Fthenakis, V., J. Catal. 65 (1980), pp. 59-77.
[27] Schulz, H., Schaub, G., Claeys, M., and Riedel, T, App. Catal. A: Gen. 186 (1999), pp. 215-227.
[28] Schulz, H., Riedel, T., and Schaub, G., Top. Catal. 32 (2005), pp. 117-124.
[29] Govender, N. S., Botes, F. G., de Croon, M. H. J. M., and Schouten, J. C., J. Catal. 260 (2008), pp. 254-261.
[30] Liu, Z. P. and Hu, P., J. Am. Chem. Soc. 124 (2002), pp. 11568-11569.
[31] Xu, J. and Bartholomew, C. H., J. Phys. Chem. B 109 (2005), pp. 2392-2403.

74

4 Mechanistic pathway for methane
formation over an iron-based catalyst
The methanation reaction mechanism under Fischer-Tropsch conditions is
investigated with the Steady State Isotopic Transient Kinetic Analysis (SSITKA)
technique over a precipitated iron-based catalyst. The 13CH4 transients resulting
from a 12CO 13CO switch (330 °C, 1.2 bar, and H2/CO = 15) provided kinetic
information for the methanation reaction. Six methanation models were screened
and only three of these could describe the methane transient. These models were
subsequently extended to account for the Fischer-Tropsch higher hydrocarbon
products by considering C-C coupling reactions and the kinetic rate parameters
were estimated. The result was two indistinguishable mechanisms which could
describe the methane transient as well as the experimental steady-state
concentrations. Both mechanisms have two active pools of carbon (C and C) on
the catalyst surface with both leading towards the formation of methane. The C
pool is 25 to 50 times less active than the C pool for methanation and occupies
92% of the total CHx coverage (0.25 ML). The C-C coupling reaction was shown
to involve both the C and C pools. The concentration of molecularly adsorbed
CO on the Fe-based catalyst is shown to be extremely low, with an estimated
surface coverage of 9 10-4 ML.
75

Mechanistic pathway for methane formation over an iron-based catalysts
4.1. Introduction
The Fischer-Tropsch synthesis (FTS) is a heterogeneously catalysed
process whereby synthesis gas (a mixture of carbon monoxide and hydrogen)
is converted to liquid fuels (gasoline and diesel) and chemicals [1]. Dry [2]
describes two modes of operation for the Fischer-Tropsch synthesis, each
with its specific selectivity targets. The high temperature (300–350ºC)
Fischer-Tropsch process (HTFT) aims at the production of gasoline and linear
low molecular mass olefins, whereas the low temperature (200–240ºC)
Fischer-Tropsch process (LTFT) is used for the production of diesel and high
molecular mass linear waxes. Sasol’s commercial HTFT and LTFT processes
are described briefly by Steynberg et al. [3] and Espinoza et al. [4],
respectively, whilst details of the entire FTS have recently been published by
Steynberg [5]. The HTFT process comprises a complex network of
elementary reaction steps. Apart from the usual linear FT products (olefins
and paraffins), these steps include the formation of CO2, carbon, and
oxygenates (alcohols, acids, aldehydes and ketones). To date, the product
distribution of the HTFT process has not been fully described by the
mechanisms in the literature. Kinetic equations proposed for this process have
either been developed empirically or based on a mechanism, using a
postulated rate determining step. Hence these expressions do not illustrate a
uniform picture.
The Steady-State Isotopic Transient Kinetic Analysis (SSITKA) technique
was developed by Happel [6], Bennett [7] and Biloen [8], to obtain in-situ
kinetic information about reaction mechanisms and reaction intermediates on
the catalyst surface. An extensive review of the SSITKA methodology is
given by Shannon and Goodwin [9]. In a nutshell, this technique keeps the
catalyst under steady-state conditions and introduces an isotopic transient by
abruptly replacing one reactant with its isotope. For example, a feed of
76

Chapter 4
H2/12CO/Ar is switched to H2/
13CO/He with minimum disturbance to the
system. The inert gas is also switched to determine the gas hold-up in the
reactor. Apart from isothermal and isobaric reactor conditions, the surface
composition of the catalyst does not change during SSITKA, making this
technique ideal for reaction mechanistic studies. The methanation reaction has
proven to be an ideal system for isotopic transient kinetic investigations due
to the simple molecules involved, which are easy to trace by mass
spectrometry (MS). A study of this reaction under FT conditions would be
useful in developing a complete kinetic framework which could also be used
to formulate more robust steady-state kinetic models. It is reasonable to
assume that methane is formed by the stepwise hydrogenation of C atoms
producing CHx (x = 1 to 3) groups. For iron catalysts, there is still uncertainty
about the abundance and nature of the surface species and the rate limiting
step of the surface reactions. One reason for this is that iron forms several
different types of surface carbides [10,11], some of which have been shown to
be active for FTS. These key questions regarding iron catalysts have been
addressed by several authors also for other FT active metal (Rh, Ru, Co and
Ni) catalysts.
High CO coverage, in some cases near a monolayer, has been reported by
Efstathiou et al. [12-16] and Siddall et al. [17] over Rh-based catalysts,
Agnelli et al. [18] over Ni catalysts, Bajusz and Goodwin [19] for Ru-based
catalysts, and Van Dijk et al. [20] for Co-based catalysts. In all of these
studies, the coverage of CO was reported to be higher than the monomeric
building units (CHx). The authors of this paper are not aware of any reports in
the literature for such high CO coverage on Fe-based catalysts. Mims and
McCandish [21,22] performed SSITKA experiments on a promoted Fe
catalyst at 237ºC, H2/CO = 1, and 1 bar. There was no measurable delay
between the Ar and 13CO transients, implying extremely low CO coverage.
Stockwell et al. [23] studied the mechanism of methane and hydrocarbon
77

Mechanistic pathway for methane formation over an iron-based catalysts
formation on a 10 wt% Fe/Al2O3 catalyst using 12CO to 13CO SSITKA. The
amount of 12COads measured was very small, only 8 μmol COads.gcat-1
equivalent to 0.1 monolayer of CO after 1.5 hr on stream at 285°C, H2/CO =
9, 1 bar, and 7% conversion to Fischer-Tropsch products.
The rate of CO dissociation was reported to be rate determining by both
Efstathiou et al. [12-16] and Siddall et al. [17] over Rh-based catalysts, whilst
for a similar catalyst, Balakos et al. [24] reported that hydrogenation of CHx is
the rate determining step. Stockwell et al. [25] on the other hand could not
distinguish between these two rates on a Ni-based catalyst and concluded that
both are kinetically important. More specifically, Van Dijk et al. [20]
concluded that the Cads CHads reaction step was the rate determining step
for their Co-based catalyst, whilst Mirodatos et al. [18,26] showed that the
CH into CH2 step was rate determining using both 13CO and D2 tracing on a
Ni/SiO2 catalyst. There is uncertainty as to which elementary reaction step is
rate determining during methanation. For Fe catalysts, such information
obtained from transient studies has not been published.
The most abundant CHx surface species was identified as CHads by Happel
et al. [27] on a Ni-based catalyst. For a Co-based catalyst, Van Dijk et al. [20]
identified Cads as the most abundant methane intermediate. Krishna and Bell
[28] studied chain growth during FTS over Ru/TiO2 using 13CO and D2
tracing. They concluded that the dominant species are monomeric building
units (0.2 to 0.6 ML), whilst growing alkyl chains occupy less than 0.2 ML
and COads occupied an additional 0.7 ML. There are no transient studies
reporting the nature of the surface species on Fe catalysts.
Two parallel pools of surface intermediates, CHx and CHx are proposed
by Balakos [24] to react irreversibly to CH4 on a 3 wt% Rh/SiO2 catalyst.
Happel et al. [27,29-31] showed that carbidic carbon consists of two pools, a
smaller active Cads pool and a larger methanation inactive C pool which is not
78

Chapter 4
graphitic. More than a decade later [31], they showed that the data in the
aforementioned studies could be modeled using a mechanism consisting of
two parallel paths, where both paths lead independently to the formation of
methane. Bajusz and Goodwin [19] also identified two active pools (C and
C) which can be hydrogenated to methane. Both Van Dijk et al. [20] and
Soong et al. [32] modeled such a pathway for a Co-based and a Raney-nickel
catalyst, respectively.
The purpose of this work is to develop a plausible mechanism for the
methanation reaction under HTFT conditions for an Fe-based catalysts using
SSITKA. Our approach is to model the 13CO and 13CH4 transients obtained
from a 12CO13CO SSITKA experiment and then to use parameter estimation
to discriminate between several rival models. There are no such studies to
date reported in the open literature.
4.2. Results and Discussion
4.2.1. Steady State Results
Both the catalyst and the reaction should be at steady state before
performing a SSITKA experiment. Steady state was monitored online by
calculating the CO conversion. The data for one of our runs in Figure 4.1
shows that there is a sharp decline in the CO conversion in the first 10 hours
exposure to synthesis gas. This is attributed to the changes in the catalyst
morphology. Dry [33] showed that during this induction period, the iron
catalyst changes from iron oxide and iron to mostly iron carbides. Du Plessis
[34] observed the same high CO conversion in the first 5 to 10 hours for
potassium promoted iron catalyst under HTFT conditions and used in-situ
79

Mechanistic pathway for methane formation over an iron-based catalysts
XRD to show that this initial change in activity is due to the formation and
stability of the various iron carbides. It is safe to assume, based on the
aforementioned study and our data, that minimal changes to the catalyst occur
after the first 10 hours of operation. Most of our SSITKA experiments were
performed after 20 hours exposure to synthesis gas. To avoid excessive
carbon formation, the synthesis was stopped overnight and re-started the
following morning. Typically, the catalyst undergoes a quick re-activation
(shown in Figure 4.1 at 15 hr) and then reaches the same steady state CO
conversion.
4.2.2. SSITKA Results
A delay on the 13CO response is usually observed with 12CO 13CO
SSITKA experiments which results from the time required for the 13CO to
replace the reservoir of 12COads. This phenomenon is commonly referred to as
the chromatographic effect [9,33,34]. The absence of this chromatographic
effect in our results, shown in Figure 4.2, suggests an extremely low surface
coverage of COads. The breakthrough of 13CO is extremely fast and in all
cases overlaps the Ne signal. This is consistent with the results by Mims et al.
[21,22], Saudsakorn et al. [35] and Stockwell et al. [23] obtained on other Fe-
based catalysts using the same transient technique at LTFT conditions. It has
also been well documented [36,37] that low temperatures (-80ºC) are required
to accurately measure CO chemisorbed on iron catalysts because it readily
dissociates at room temperature. We could only measure 37 μmol CO.gcat-1 at
25°C corresponding to a coverage of 0.1 ML, based on a surface area of 16
m2.g-1 obtained by N2 physisorption.
80

Chapter 4
0
5
10
15
20
0 10 20 30 40
Time on stream [hr]
CO
Co
nv
ers
ion
[%
]
Figure 4.1: CO conversion data obtained at H2/CO = 15, 330ºC, 1.2 bar, and GHSV = 7412 ml.hr-1.gcat
-1.
0.0
0.2
0.4
0.6
0.8
1.0
0 10 20
Time [s]
No
rmal
ised
res
po
nse
[-]
Figure 4.2: Normalised transient responses for 13CO (∆) and Ne ( ) obtained at H2/CO = 15, 330ºC, 1.2 bar, and GHSV = 7412 ml.hr-1.gcat
-1. For clarity reasons, data from only one run is shown.
81

Mechanistic pathway for methane formation over an iron-based catalysts
The surface concentration of COads can also be calculated according to:
CO CO COCO 12
cat cat 0
.( ) ( )NeCO
F FL EW W t
t t
E dt [8]
where LCO is the surface concentration of COads in mole.kgcat-1; FCO is the
molar feed rate of CO in moles.s-1; τCO is the mean residence time of COads in
s; Wcat is the weight of catalyst in the reactor bed in kgcat; is the
normalised transient of 12CO; and is the normalised transient of Ne. The
surface concentration calculated in this way is independent of the reaction
mechanism. The mean residence time could not be accurately determined
because of the extremely low CO coverage. A maximum value of 0.05 s was
used in our study which resulted in a surface concentration of 2.4 10-4
mole.kgcat-1 (~9 10-4 ML). This amount of CO on our Fe-based catalyst is 32
times lower than that reported by Stockwell et al. [23]. This deviation can be
best ascribed to the higher temperatures used in this study.
CO12E
NeE
The 13CH4 transients for different runs at the same experimental conditions
are presented in Figure 4.3. The 13CH4 transients reached 100% marking after
45 min but 90% of this is observed in the first 15 to 20 min. It seems that
there are two distinct processes occurring; a fast route to methanation in the
first few minutes and then a slower route which takes at least a further 30 min.
The possibility that methane can readsorb and hence causes such a delay was
also investigated. This was performed by using the transient switch, Ar
CH4/Ne after the catalyst reached steady state and the reactor was purged with
inert. The results (Figure 4.4) show that there is no delay between the Ne and
CH4 transients confirming that methane does not readsorb onto the catalyst
surface under our reaction conditions.
82

Chapter 4
0.0
0.2
0.4
0.6
0.8
1.0
0 20 40 60
Time on Stream [min]
No
rma
lis
ed
Re
sp
on
se
[-]
Figure 4.3: Normalised transient responses for 13CO (), Ne () and 13CH4 (, , , and ) obtained at H2/CO = 15, 330ºC, 1.2 bar, and GHSV = 7412 ml.hr-1.gcat
-1.
The surface concentration of C1,ads can also be calculated from the transient
data according to:
C1 CO CO CO COC1 12 12
4cat cat 0 0
. . . 1( ) ( ) ( ) ( )Ne NeCH CO2
F X F XL E E EW W t t
. t t dt - t t d
E t
[9]
where Xco is the conversion of CO. The mean residence of C1,ads was
ca. 1000 s which resulted in a surface concentration of 0.08 mole.kg-1 (or 0.2
ML) for the total C1,ads species. This higher surface coverage of C1,ads than of
COads on our Fe catalyst is different to all other FT metals (see introduction).
This is consistent with recent kinetic modelling. Botes and Breman [in 38]
have shown that at commercially relevant conditions, the reaction order for
CO on the iron-based is positive whilst for the cobalt-based catalyst it is
83

Mechanistic pathway for methane formation over an iron-based catalysts
negative. This implies that the CO coverage on the iron-based catalyst is
lower than for the cobalt-based catalyst.
0.0
0.2
0.4
0.6
0.8
1.0
0 5 10 15 20
Time [s]
No
rma
lise
d t
ran
sie
nt
[-]
Figure 4.4: . Normalised transient responses for Ne (∆) and 13CH4 ( ) obtained at 330ºC and 1.2 bar after a Ar CH4/Ne transient switch.
4.2.3. Model Identification and Discrimination
Based on two gas phase components (CO and CH4) and three surface
species components (COads, Cαads, Cßads), Van Dijk et al. [20] tested six
possible methanation models, shown in Figure 4.5. Some of these models
have also been used by Happel [33] and Soong et al. [32]. The same set of
models was screened in our study using parameter estimation. Apart from
model 1, there are six kinetic parameters to be estimated for each model. Our
initial efforts showed that some of these parameters are highly correlated. To
simplify the parameter estimation process, kads and kdes were fixed. The
84
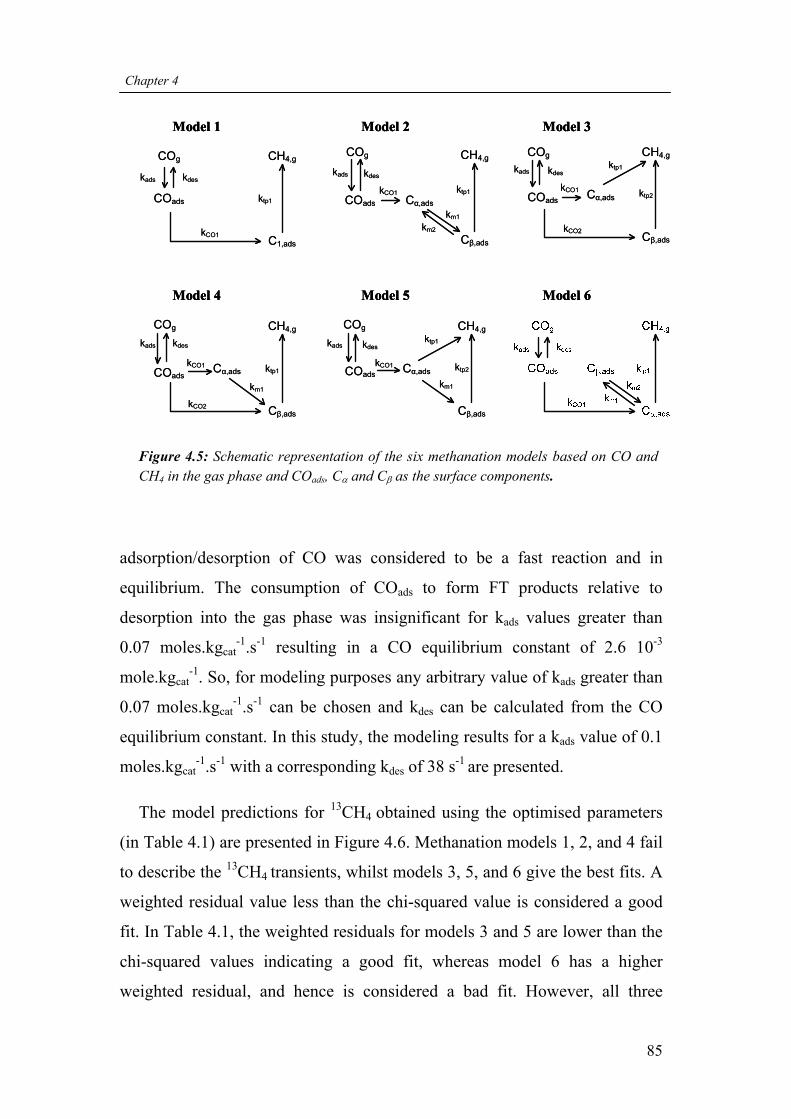
Chapter 4
COg CH4,g
COads
C1,ads
kads kdes
kCO1
ktp1
COg CH4,g
Cα,adsCOads
Cβ,ads
kads kdes
kCO1 ktp1
km1
km2
COg CH4,g
Cα,adsCOads
Cβ,ads
kads kdes
kCO1
kCO2
ktp1
ktp2
COg CH4,g
Cα,adsCOads
Cβ,ads
kads kdes
kCO1
km1
ktp1
kCO2
COg CH4,g
Cα,adsCOads
Cβ,ads
kads kdes
kCO1
ktp1
ktp2
km1
Model 1 Model 2 Model 3
Model 4 Model 5 Model 6
COg CH4,g
COads
C1,ads
kads kdes
kCO1
ktp1
COg CH4,g
Cα,adsCOads
Cβ,ads
kads kdes
kCO1 ktp1
km1
km2
COg CH4,g
Cα,adsCOads
Cβ,ads
kads kdes
kCO1
kCO2
ktp1
ktp2
COg CH4,g
Cα,adsCOads
Cβ,ads
kads kdes
kCO1
km1
ktp1
kCO2
COg CH4,g
Cα,adsCOads
Cβ,ads
kads kdes
kCO1
ktp1
ktp2
km1
Model 1 Model 2 Model 3Model 1 Model 2 Model 3
Model 4 Model 5 Model 6Model 4 Model 5 Model 6
Figure 4.5: Schematic representation of the six methanation models based on CO and CH4 in the gas phase and COads, C and C as the surface components.
adsorption/desorption of CO was considered to be a fast reaction and in
equilibrium. The consumption of COads to form FT products relative to
desorption into the gas phase was insignificant for kads values greater than
0.07 moles.kgcat-1.s-1 resulting in a CO equilibrium constant of 2.6 10-3
mole.kgcat-1. So, for modeling purposes any arbitrary value of kads greater than
0.07 moles.kgcat-1.s-1 can be chosen and kdes can be calculated from the CO
equilibrium constant. In this study, the modeling results for a kads value of 0.1
moles.kgcat-1.s-1 with a corresponding kdes of 38 s-1 are presented.
The model predictions for 13CH4 obtained using the optimised parameters
(in Table 4.1) are presented in Figure 4.6. Methanation models 1, 2, and 4 fail
to describe the 13CH4 transients, whilst models 3, 5, and 6 give the best fits. A
weighted residual value less than the chi-squared value is considered a good
fit. In Table 4.1, the weighted residuals for models 3 and 5 are lower than the
chi-squared values indicating a good fit, whereas model 6 has a higher
weighted residual, and hence is considered a bad fit. However, all three
85

Mechanistic pathway for methane formation over an iron-based catalysts
86
models predict both the surface concentration of COads and the gas phase
concentration of CH4 equally well. So, at this stage of the modeling, we
cannot rule out model 6 based only on the weighted residual value. This issue
of model identifiability and distinguishibility with this type of modeling has
been discussed by Happel [33] and was also reported by Van Dijk et al. [20].
These authors showed that successful further model discrimination is possible
if either more experimental data other than from SSITKA is considered, or the
models are extended to incorporate the formation of heavier hydrocarbons.
An example of the former approach could be quantification of the surface
concentrations of C and C using a suitable characterization technique. The
latter approach is used in this study.
0.0
0.2
0.4
0.6
0.8
1.0
0 10 20 30 40 50
Time [min]
No
rmal
ised
res
po
nse
[-]
3, 5 and 6
1, 2 and 4
Figure 4.6: Model predictions for the 13CH4 transients for the methanation models
shown in Figure 4.5. The symbols () are 13CH4 data points obtained at H2/CO = 15,
330ºC, 1.2 bar, and GHSV = 7412 ml.hr-1.gcat-1 and the solid lines are the model
predictions.

Cha
pter
4
Tab
le 4
.1:
Opt
imis
ed p
aram
eter
est
imat
es f
or t
he m
etha
nati
on r
eact
ion
acco
rdin
g to
the
mod
els
in F
igur
e 4.
5. T
he s
urfa
ce c
once
ntra
tion
of
CO
ads a
nd
the
gas
phas
e co
ncen
trat
ion
of C
H4
are
the
mod
el p
redi
ctio
ns u
sing
the
corr
espo
ndin
g op
tim
al p
aram
eter
est
imat
es.
M
odel
1
Mod
el 2
M
odel
3
Mod
el 4
M
odel
5
Mod
el 6
kco
1
6.
24 1
0-1
2.9
10-2
1.
40
2.4
10-1
5.
26 1
0-1
1.6
10-2
4.
85 1
0-1
12.
74
6.49
10-1
2
.9 1
0-2
6.26
10-1
2
.9 1
0-2
kco
2
1.
25 1
0-1
1.6
10-2
1.
51 1
0-1
12.
73
km
1
1.
62 1
0-1
5.4
10-2
2.29
2
37
1.29
10-2
2
.2 1
0-3
2.57
10-2
3
.6 1
0-3
km
2
9.8
10-2
6
.3 1
0-3
2.
40 1
0-3
3.0
10-4
ktp
1
9.
10 1
0-3
8.0
10-4
8.
40 1
0-3
3.0
10-3
1.
97 1
0-2
2.4
10-3
9.
40 1
0-3
1.0
10-3
1.
49 1
0-2
1.4
10-3
1.
34 1
0-2
1.3
10-3
ktp
2
1.
90 1
0-3
2.0
10-4
1.60
10-3
1
.0 1
0-4
2 b
1243
16
52
1652
16
52
1652
16
52
WR
a 40
84
3856
45
5 24
56
436
2070
LC
O
2.80
10-4
1 1
0-5
2.34
10-4
1 1
0-5
2.79
10-4
1 1
0-5
2.80
10-4
1 1
0-5
2.91
10-4
1 1
0-5
2.87
10-4
1 1
0-5
CH
4, s
s 1.
76 1
0-3
2 1
0-4
6.17
10-4
2 1
0-4
1.96
10-3
2 1
0-4
1.80
10-3
2 1
0-4
1.90
10-3
2 1
0-4
1.70
10-3
2 1
0-4
Uni
ts: a
ll k
’s in
[s-1
], L
co in
[m
ole.
kgca
t-1]
and
CH
4,ss
in [
mol
e.m
g-3].
a WR
is th
e w
eigh
ted
resi
dual
obt
aine
d fr
om th
e pa
ram
eter
est
imat
ion
resu
lts.
b 2 is
the
95%
chi
-squ
ared
val
ue o
btai
ned
from
the
para
met
er e
stim
atio
n re
sults
.
87

Mechanistic pathway for methane formation over an iron-based catalysts
4.2.4. Parameter Quantification
The methanation models 3, 5, and 6 (in Figure 4.5) can describe our
methanation results better than the other three models. These models are thus
suitable to extend towards the formation of the higher hydrocarbon Fischer-
Tropsch products, and by doing so, the parameters for the methanation
models can be quantified. Both chain-growth and chain-initiation need to be
considered when modeling the Fischer-Tropsch synthesis. The latter reaction
is not considered in full as this will require modeling the transients of the
higher hydrocarbons which is not in the scope of this chapter. However, the
formation of the higher hydrocarbons from C and C is included in our
modeling as a net consumption rate [39]. Chain-initiation involves C-C
coupling reactions and is included in the models via the combination of: (1)
two C species, (2) one C and one C species, and (3) two C species, as
shown in Figure 4.7 for models 3, 5 and 6. Model 3 is considered symmetrical
since the C and C are interchangeable. In other words, the results for the
reaction of two C species will be the same as for two C species reacting.
Hence only two combinations are considered for model 3.
In Table 4.2, the parameter estimation results for all the models in Figure
4.7 are presented and the model descriptions of 13CH4 according to the
optimised parameters are shown in Figure 4.8. Model 5.3 is discarded because
it could not describe the methane and also failed to predict the steady-state
surface and gas phase concentrations. Both combinations of chain-initiation
for model 3 can describe the methane transient and both models give good fits
according to their weighted residuals. However, model 3.1 predicts a lower
C1,tot coverage (0.07 ML) compared to model 3.2 (0.16 ML). On the basis that
our experimental value for C1,tot is ca. 0.2 ML, model 3.1 is discarded. Models
5.1, 6.1 and 6.2 are also discarded for the same reason of predicting a low
C1,tot coverage. For the methanation model 5, the combination of C and C
(model 5.2) can describe the methane transient with a good fit (see Table 4.2).
88

Chapter 4
89
The predicted surface and gas phase concentrations for this model are similar
to model 3.2 and cannot be further distinguished. Lastly, model 6.3 could
describe both surface concentrations adequately but the rate of the C-C
coupling reaction, ki, was not statistically significant. In fact, ki was poorly
estimated in all combinations for the methanation model 6 (models 6.1, 6.2
and 6.3).
Model 3.1 Model 3.2
Model 5.1 Model 5.2 Model 5.3
Model 6.1 Model 6.2 Model 6.3
Model 3.1 Model 3.2
Model 5.1 Model 5.2 Model 5.3
Model 6.1 Model 6.2 Model 6.3
Figure 4.7: Schematic representation of the models for the Fischer-Tropsch reaction taking into account different chain initiation pathways based on the three indistinguishable methanation models in Figure 4.5.

Mec
hani
stic
pat
hway
for
met
hane
form
atio
n ov
er a
n ir
on-b
ased
cat
alys
ts
Tab
le 4
.2:
Opt
imis
ed p
aram
eter
est
imat
es fo
r th
e m
etha
nati
on r
eact
ion
acco
rdin
g to
the
mod
els
in F
igur
e 4.
7. T
he s
urfa
ce c
once
ntra
tion
s of
CO
ads,
C,
an
d C,
and
the
gas
pha
se c
once
ntra
tion
of
CH
4 ar
e th
e m
odel
pre
dict
ions
usi
ng t
he c
orre
spon
ding
opt
imal
par
amet
er e
stim
ates
. It
alic
val
ues
are
insi
gnif
ican
t par
amet
er e
stim
ates
.
M
odel
3.1
M
odel
3.2
M
odel
5.1
M
odel
5.2
M
odel
5.3
M
odel
6.1
M
odel
6.2
M
odel
6.3
k co1
3.63
10-1
2
.3 1
0-1
3.38
10-1
1
.2 1
0-1
3.82
10-1
2
.3 1
0-1
6.37
10-1
2
.4 1
0-1
2.60
10-1
2
.25
10-1
3.
22 1
0-1
2.3
10-1
3.
15 1
0-1
2.3
10-1
3.
29 1
0-1
2.3
10-1
k co2
1.16
10-1
1
.3 1
0-2
2.39
10-1
1
.2 1
0-1
- -
- -
-
km
1
-
- 3.
10 1
0-2
1.9
10-2
2.
95 1
0-2
3.2
10-3
2.
76 1
0-1
3.6
3 10
-2
2.40
10-2
3
.3 1
0-3
2.77
10-1
1
.4 1
0-2
4.22
10-2
1
.9 1
0-2
km
2
-
- -
- -
2.26
10-3
2
.7 1
0-4
2.59
10-3
1
.3 1
0-3
1.93
10-3
9
.0 1
0-4
k tp
1
2.
74 1
0-2
1.7
10-3
2.
78 1
0-2
9.9
10-3
3.
11 1
0-2
1.9
10-2
1.
59 1
0-2
5.9
10-3
1.
55 1
0-2
1.6
10-2
2.
76 1
0-2
1.9
10-2
2.
79 1
0-2
2.0
10-2
2.
69 1
0-2
1.9
10-2
k tp
2
1.
47 1
0-3
7.3
10-5
7.
69 1
0-4
3.8
10-4
1.
8 10
-3
8.5
10-5
6.
61 1
0-4
3.0
10-4
3.
02 1
0-4
3.3
10-4
-
- -
k i
8.24
5
.31
8.33
10-1
1
.4 1
0-1
3.27
2
1.8
4.23
10-1
5
.16
10-2
2.
85 1
0-2
4.9
10-3
1.
60 1
0-4
6.5
2 1.
05 1
0-3
6.6
10-1
2.
40 1
0-3
2.4
10-2
2 b
1651
16
51
1651
16
51
1651
16
51
1651
16
51
WR
a
1437
14
48
1480
14
11
2314
20
84
2075
20
74
LC
O
2.34
10-4
1
10-5
2.
31 1
0-4
1 1
0-5
2.36
10-4
1
10-5
2.
30 1
0-4
1 1
0-5
2.40
10-4
1
10-5
2.
38 1
0-4
1 1
0-5
2.38
10-4
1
10-5
2.
38 1
0-4
1 1
0-5
LC
1.30
10-3
1.
01 1
0-3
1.01
10-3
2.
02 1
0-3
2.14
10-4
1.
99 1
0-3
1.91
10-3
1.
95 1
0-3
LC
1.
82 1
0-2
3.40
10-2
1.
72 1
0-2
3.89
10-2
2.
32 1
0-2
2.06
10-2
2.
04 1
0-2
2.96
10-2
LC
1, t
ot
1.90
10-2
6.
94 1
0-2
2.52
10-2
6.
11 1
0-2
1.21
10-1
2.
86 1
0-2
3.06
10-2
5.
84 1
0-2
CO
0.
0009
0.
0009
0.
0009
0.
0009
0.
0009
0.
0009
0.
0009
0.
0009
C1,
tot
0.07
0.
13
0.07
0.
16
0.09
0.
09
0.08
0.
12
CH
4, s
s
2.30
10-3
2.
12 1
0-3
3.56
10-3
1.
99 1
0-3
2.09
10-3
2.
92 1
0-3
2.87
10-3
2.
67 1
0-3
Uni
ts: a
ll k
’s in
[s-1
] ex
cept
ki i
n [k
g cat.m
ole -
1 .s-1
], L
co in
[m
ole.
kgca
t-1]
and
CH
4,ss
in [
mol
e.m
g-3].
a WR
is th
e w
eigh
ted
resi
dual
obt
aine
d fr
om th
e pa
ram
eter
est
imat
ion
resu
lts.;
and
b 2 is
the
95%
chi
-squ
ared
val
ue o
btai
ned
from
the
para
met
er e
stim
atio
n re
sult
s.
90

Chapter 4
0.0
0.2
0.4
0.6
0.8
1.0
0 10 20 30 40 50
Time [min]
No
rma
lis
ed
re
sp
on
se
[-]
5.1
3.1, 3.2, 5.2, 5.3, 6.1, 6.2 and 6.3
Figure 4.8: Model predictions for the 13CH4 transients for the models in Figure 4.7. The symbols () are 13CH4 data points obtained at H2/CO = 15, 330ºC, 1.2 bar, and GHSV = 7412 ml.hr-1.gcat
-1, and the solid lines are the model predictions.
The buffer step in this model seems to play a significant role in the
parameter estimation. The rates constants for this buffer step (km1 and km2)
seem to fluctuate to match the desired surface and gas-phase concentrations
without adequately accounting for the C-C coupling reactions. Methanation
model 6 is a suitable candidate for describing the methanation results alone
but it is inconceivable that this model can be extended to account for the
Fischer-Tropsch process. Hence these models (6.1, 6.2 and 6.3) are all
discarded.
Finally, the rates of the surface reactions for the models 3.2 and 5.2 are
compared to obtain more insight. The rate of CO dissociation, kCO1 for model
5.2 and (kCO1 + kCO2) for model 3.2, is 0.8-0.9 s-1, with kCO1 equivalent to kCO2
in model 3.2. This rate is two times higher than that reported by Van Dijk [39]
91

Mechanistic pathway for methane formation over an iron-based catalysts
for the Co-based catalyst, suggesting that CO dissociates easier on Fe than Co
catalysts which is consistent with the study reported by Vannice [40]. Both
models have similar termination rate constants with termination from the C
pool being the rate determining step (25-50 less active for methanation). No
further model discrimination between these two models is possible based on
the available experimental data.
In summary, models 3.2 and 5.2 both give the best fits for the methanation
transients and predict similar steady-state concentrations of CH4 in the gas-
phase and the surface concentrations of COads, C, and C. Both these models
have two pathways towards the formation of methane. In model 3.2 these
pathways are independent whereas in model 5.2, the C and C pools are
interlinked. Chain-initiation involves the combination of both these carbon
pools.
4.3. Conclusions
Experimental observations obtained using a 12CO 13CO transient switch
indicated that molecularly adsorbed CO on the Fe/K catalyst is extremely low,
ca. 9 10-4 ML, whilst the C1,tot is much higher, 0.25 ML. For the methanation
reactions, the parameter estimation study showed that three models are
indistinguishable. All these models have a buffer step or parallel route
towards the formation of methane. The chain initiation reaction (C-C
coupling) was included which resulted in eight models being tested. The
results showed that two models remain indistinguishable. Both these models
have two surface intermediates (C and C) active towards methanation and
higher hydrocarbon formation. The quantification of the kinetic rate
parameters was performed by accounting for the higher hydrocarbon
formation. The results showed that C is the larger pool, occupying 92% of
the C1,tot coverage and is 25-50 less active for methanation than C. The
92

Chapter 4
chain-initiation reaction (C-C coupling) involves a combination of C and C
to form the C2 surface intermediate.
References [1] M.E. Dry, Appl. Catal. A 138 (1996) 319.
[2] M.E. Dry, Catal. Today 71 (2002) 227.
[3] A.P. Steynberg, R.L. Espinoza, B. Jager, A.C. Vosloo, Appl. Catal. A 186 (1999) 41.
[4] R.L. Espinoza, A.P. Steynberg, B. Jager, A.C. Vosloo, Appl. Catal. A 186 (1999) 13.
[5] A.P. Steynberg, Studies in Surface Science and Catalysis 152 (2004) 1.
[6] J. Happel, Chem. Eng. Sci. 33 (1978) 1567.
[7] C.O. Bennett, Catalysis under transient conditions, ACS Symposium Series (1982) 1.
[8] P. Biloen, J. Mol. Catal. 21 (1983) 17.
[9] S.L. Shannon, J. Goodwin, Chem. Rev. 95 (1995) 677.
[10] J. Galuszka, T. Sano, J.A. Sawicki, J. Catal. 136 (1992) 96.
[11] J. Xu, C.H. Bartholomew, J. Phys. Chem. B 109 (2005) 2392.
[12] A.M. Efstathiou, C.O. Bennett, Chem. Eng. Comm. 83 (1989) 129.
[13] A.M. Efstathiou, T. Chafik, D. Bianchi, C.O. Bennett, J. Catal. 147 (1994) 24.
[14] A.M. Efstathiou, C.O. Bennett, J. Catal. 120 (1989) 118.
[15] A.M. Efstathiou, C.O. Bennett, J. Catal. 120 (1989) 137.
[16] A.M. Efstathiou, J. Mol. Catal. 69 (1991) 41.
[17] J.H. Siddall, M.L. Miller, W.N. Delgass, Chem. Eng. Comm. 83 (1989) 261.
[18] M. Agnelli, H.M. Swaan, C. Marquez-Alvarez, G.A. Martin, C. Mirodatos, J. Catal. 175 (1998) 117.
[19] I.G. Bajusz, J. Goodwin, J. Catal. 169 (1997) 157.
[20] H.A.J. Van Dijk, J.H.B.J. Hoebink, J.C. Schouten, Top.Catal. 26 (2003) 111.
[21] C.A. Mims, L.E. McCandish, J. Am. Chem. Soc. 107 (1985) 696.
[22] C.A. Mims, L.E. McCandish, J. Phys. Chem. 91 (1987) 929.
[23] D.M. Stockwell, D. Bianchi, C.O. Bennett, J. Catal. 113 (1988) 13.
[24] M.W. Balakos, S.S.C. Chuang, G. Srinivas, M.A. Brundage, J. Catal. 157 (1995) 51.
[25] D.M. Stockwell, J.S. Chung, C.O. Bennett, J. Catal. 112 (1988) 135.
[26] C. Marquez-Alvarez, G.A. Martin, C. Mirodatos, Studies in Surface Science and Catalysis 119 (1998) 155.
93

Mechanistic pathway for methane formation over an iron-based catalysts
94
[27] J. Happel, H.Y. Cheh, M. Otarod, S. Ozawa, A.J. Severdia, T. Yoshida, V. Fthenakis, J. Catal. 75 (1982) 314.
[28] K.R. Krishna, A.T. Bell, J. Catal. 139 (1993) 104.
[29] J. Happel, I. Suzuki, P. Kokayeff, V. Fthenakis, J. Catal. 65 (1980) 59.
[30] M. Otarod, S. Ozawa, F. Yin, M. Chew, H.Y. Cheh, J. Happel, J. Catal. 84 (1983) 156.
[31] M. Otarod, J. Happel, E. Walter, Appl. Catal. A 160 (1997) 3.
[32] Y. Soong, K. Krishna, P. Biloen, J. Catal. 97 (1986) 330.
[33] J. Happel, Isotopic Assessment of Heterogeneous Reactors. Academic Press, Inc., 1986.
[34] C.O. Bennett, in: A.T. Bell, L.L. Hegedus (Editors), Catalysis under Transient Conditions. American Chemical Society, 1982, p. 1.
[35] gPROMS Advanced User Guide, Process Systems Enterprise, 2004, p. 37.
[36] M.E. Dry, The Fischer-Tropsch synthesis, in: R.B Anderson, and M. Boudart, (Eds.),
Catalysis Science and Technology, Vol. 15-255, Springer-Verlag, Berlin (1981). 1
[37] H.E. du Plessis , The crystal structures of the iron carbides, Ph.D thesis, 2007, University of Johannesburg, South Africa.
[38] P. Biloen, J.N. Helle, F.G.A. van den Berg, W.M.H. Sachtler, J. Catal. 81 (1983) 450.
[39] K. Sudsakorn, J. Goodwin, A.A. Adeyiga, J. Catal. 213 (2003) 204.
[40] D. Bianchi, S. Borcar, F. Teule-Gay, C.O. Bennett, J. Catal. 82 (1983) 442.
[41] M. Boudart, A. Delbouille, J.A. Dumesic, S. Khammouma, H.Topsoe, J. Catal. 37 (1975) 486.
[42] F.G. Botes, Catal. Rev. Sci. Eng. (2008), accepted for publication.
[43] H.A.J. Van Dijk , A mechanistic study using transient isotopic tracing, Ph.D thesis, 2001, Technische Universiteit Eindhoven, Eindhoven, the Netherlands. http://alexandria.tue.nl/extra2/200111083.pdf
[44] M.A. Vannice, J. Catal. 37 (1975) 462.

5 Effects of co-fed ethylene during the high temperature Fischer-Tropsch
synthesis
In this chapter, the effect of co-fed ethene on the Fischer-Tropsch
synthesis is investigated. The main aim was to identify reaction pathways
for readsorbed olefins. Steady state results (at 330°C, 1.2 bar, H2/CO = 15
and 7580 ml.gcat-1.hr-1) showed that the hydrogenation of ethene to ethane
is the main reaction pathway but chain growth does occur to a lesser
extent. Moreover, methane formation was suppressed whilst there was no
effect on the water-gas-shift rate. Repeating these co-fed ethene
experiments at the same reaction conditions but with 13CO in the feed
showed that in terms of chain growth, propene formation was favoured
instead of propane. This suggests that the olefins share the same surface
intermediate. Mechanisms are proposed to account for the above
experimental observations.
95

Effects of co-fed ethylene during the high temperature Fischer-Tropsch synthesis
5.1. Introduction
The products obtained during the Fischer-Tropsch Synthesis (FTS) were
found to follow a polymerization-like distribution, the so-called Anderson-
Schulz-Flory (ASF) distribution [1,2]:
1 12 n nW n [1]
where Wn is the mass fraction of the products containing n carbon atoms, n is
the carbon number and α is the probability of chain growth. Deviations from
the ideal (linear) ASF product distribution have been reported in many studies
[3,4]. The usual deviations are: (1) a relatively higher selectivity to methane;
(2) a relatively lower selectivity to ethane and ethylene (C2’s); (3) a relatively
low olefin:paraffin ratio for C2; (4) an increase in chain growth probability
with increasing carbon number; and (5) an exponential decrease of the olefin
to paraffin ratio with increasing chain length in comparison to the ideal ASF
distribution.
Olefin readsorption studies have received the most attention in terms of
describing these deviations from the ASF distribution, which resulted in
various hydrocarbon selectivity models. Briefly, Iglesia et al. [5] developed
their transport-enhanced α-olefin readsorption model on a 1.2 wt% Ru/TiO2
catalyst (at 203°C, H2/CO = 2.1, 6 bar and 5-60% CO conversion) from
residence time and co-feeding studies to explain ASF deviations. They
suggested that the diffusion limitation of reactants within the liquid-filled
pores slowed down the removal of the α-olefins, causing an increased
residence time within the catalyst pores. Kuipers et al. [6] attributed the
exponentially increasing paraffin/olefin ratio with chain length to a chain
length dependent olefin readsorption mechanism. They showed, on a Co foil
at 220°C, H2/CO = 2 and 1 bar, that the probability of readsorption depends
on the heat of physisorption of the olefins in the catalyst as well as on the heat
96

Chapter 5
of dissolution and diffusivity in the FT wax. Van der Laan and Beenackers
[7,8] proposed the α-olefin readsorption product distribution model to explain
ASF deviations. Their model (developed over a commercial Fe/Cu/K/SiO2
catalyst at 250°C, 8-32 bar, H2/CO = 0.5-2.0) combined a mechanistic model
of olefin readsorption with kinetics of chain growth and termination on the
same catalytic sites. Similar to Kuipers et al. [6], they showed that olefin
readsorption depends on physisorption strength and solubility inside the
catalyst pores. Most recently, Botes [9] developed a chain length dependent
desorption model for characterizing the product slate of the Fe-Low
Temperature Fischer-Tropsch (Fe-LTFT) synthesis. The model only
accounted for primary reactions and could describe the olefin and paraffin
selectivities in the C3 to C10 range very well. However, the model
overestimated the ethene/ethane ratio. In a subsequent paper, Botes and
Govender [10] showed that the deviation was due to the secondary
hydrogenation of ethene to ethane.
In this present study, the effect of co-feeding ethene at High-Temperature
Fischer-Tropsch (HTFT) conditions is investigated. At the higher
temperatures (330-350°C), certain elementary reactions could be faster with
the possibility that olefin incorporation could become significant. Many of the
previous studies [10] have focused on LTFT conditions. So, this present work
is the first to report co-feeding ethene at HTFT conditions. Furthermore, since
the data from normal co-feeding studies are non-trivial to analyse [11], we
have also used isotopic labeled 13CO to follow the reaction intermediates.
97

Effects of co-fed ethylene during the high temperature Fischer-Tropsch synthesis
5.2. Experimental
Details about the catalyst preparation and data analysis are described
elsewhere [Chapters 2 and 3]. In brief, a Fe/K catalyst is used and prepared by
the co-precipitation of the metal nitrates with NH4OH at ambient temperature
and pH of 7. The precipitate is dried in an oven at 120°C for 16 hrs and then
heat treated in air at 350°C for 4 hrs. The dried catalyst was crushed and
sieved between 150 and 200 m which was ready to load into the reactor. The
conditions used in the above experiments are summarised in Table 5.1.
Table 5.1: List of experiments performed and conditions tested to investigate the effect of co-fed ethene during the Fischer–Tropsch synthesis. The reaction temperature and pressure were kept constant at 330°C and 1.2 bar, respectively.
Run 1 Run 2 Run 3 Run 4
H2/CO in the feed 15 4.5 10 5 15 10 15 9
C2H4 in H2 [ml.min-1]# 45.45 45.45 30.3 25.5 45.45 30.3 45.45 45.45
CO [ml.min-1] 3 10 3 5 3 3 3 5
Ar/Ne [ml.min-1] 14.55 7.55 19.7 9.5 14.55 29.7 9.55 7.55
Steady state data yes yes yes yes no no no no
SSITKA data no no no no yes yes yes yes
# 1 mol% C2H4 in H2 mixture (Scott Specialty Gases) was used.
5.3. Results and Discussion
5.3.1. Reactor partial pressures during ethylene addition
At the reaction conditions used here, a period of 20 hr is required to obtain
steady state which is attributed to the stabilization of the Fe catalyst
98

Chapter 5
active phases [12], which is generally believed to be the Hägg carbide (-
Fe2C5) [13]. After this period, an abrupt switch was made to the feed as
follows: H2/CO /Ar 1 mol % C2H4 in H2/Co/Ar. To compensate for
additional volume in the second feed due to the added C2H4, an equivalent
amount (1 mol %) of Ar was removed from the second feed. The resulting
changes to the partial pressures of H2 and CO are presented in Figure 5.1.
There was no observable change to the CO partial pressure but the H2 partial
pressure did initially decrease and thereafter increase to its original value.
This is linked to an increase in the H2 conversion which was also observed. In
order to eliminate the effects of the reactant partial pressures on the Fischer-
Tropsch selectivity and activity, the data captured during this transition period
is not considered when discussing the effect of co-fed ethylene.
0
0.2
0.4
0.6
0.8
1
0 10 20 3
Time on line [hr]
Par
tial
Pre
ssu
re [
bar
]
CO
H2
0
C2H4co-fed
0
0.2
0.4
0.6
0.8
1
0 10 20 3
Time on line [hr]
Par
tial
Pre
ssu
re [
bar
]
CO
H2
0
C2H4co-fed
Figure 5.1: H2 and CO partial pressures before and after 1 mol% C2H4 in H2 was co-fed. Reaction conditions: Fe/K catalyst at 330°C, 1.2 bar, H2/CO = 15 and GHSV = 7850 ml.gcat
-1.hr-1.
99

Effects of co-fed ethylene during the high temperature Fischer-Tropsch synthesis
5.3.2. Fischer-Tropsch activity
The Fischer-Tropsch activity increased by ca. 16 % when ethene was co-
fed (see Table 5.2) at the same reaction conditions (330°C, 1.2 bar, H2/CO =
15 and GHSV = 7850 ml.gcat-1.hr-1). Although the partial pressures of H2 and
CO remained the same, the conversions of these reactants also increased by a
similar margin as the Fischer-Tropsch activity (15% and 13 %, respectively).
This can be attributed to the reactions associated with the added ethene in the
fresh feed. For example, ethene could be hydrogenated resulting in increased
H2 conversion or ethene could participate in chain growth consuming C1
monomers (or CO) resulting in increased CO conversion.
Table 5.2: Fischer-Tropsch steady state results with and without co-feeding ethene. Reaction conditions (330°C, 1.2 bar, H2/CO = 15 and GHSV = 7850 ml.gcat
-1.hr-1) were kept constant.
Without co-fed olefin
With co-fed olefin
H2 partial pressure [bar] 0.80 0.79
CO partial pressure [bar] 0.05 0.05
H2 conversion [%] 19 22
CO conversion [%] 20 23
H2/CO-Feed Ratio [-] 15 15
H2/CO-Reactor Ratio [-] 15 15
FT reaction rate [mole CO. gcat-1.s-1] 7.6 10-7 8.8 10-7
Methane formation rate [mole CO.gcat-1.s-1] 1.6 10-7 1.5 10-7
CH4 selectivity [C-atom %] 21.3 16.9
100

Chapter 5
Not many researchers have reported changes to the Fischer-Tropsch
activity due to the presence of ethylene in the fresh feed. However similar to
our study, Hanlon and Satterfield [14] did report an increase in H2 conversion
for a fused Fe catalyst at 248°C and 7.8 – 14.8 bar but unlike our work, there
were no observable changes to the CO conversion during the addition of 1-
olefins.
5.3.3. Fischer-Tropsch selectivity
5.3.3.1. Methane selectivity
The methane selectivity (see Table 5.2) decreased by ca. 21% with the
addition of ethene in the feed. Moreover, there was an observed decrease in
the methanation rate (ca. 8%) which suggests that ethene could be competing
for the same adsorption sites as the methane intermediates. The decreased
selectivity could also be simply due to fewer adsorbed molecular hydrogen
(Hads) on the catalyst surface available for methanation. This could either be
due to the ethene competing the Hads sites or Hads reacting preferentially with
ethene instead of methane intermediates (CHx, x = 1 to 3). The suppression of
methane by the addition of olefins in the fresh feed was claimed by Kim and
Hills [15]. They observed a 30% decrease in methane selectivity with 9.6
mol% ethene for a precipitated Fe/K/Cu catalyst at 200°C and H2/CO = 2 (the
total reactor pressure was not reported). Snel and Espinoza [16] reported a
25% decrease in methane selectivity and a 50% reduction in the methanation
rate, a factor 2 which is similar to our result.
101

Effects of co-fed ethylene during the high temperature Fischer-Tropsch synthesis
5.3.3.2. Olefin selectivity
The change in olefinicity, presented in Figure 5.2, shows the differences
between the C2’s and C3’s. The change in the C2’s is expected since ethene is
added to the fresh feed. The change in the C3’s is attributed to chain growth.
In other words, the co-fed ethene participates in chain growth. Unfortunately,
our GC system was setup to separate the C2’s accurately and as such limited
the analysis to mainly the C1 to C5 hydrocarbons. Together with the low
conversions used here, this resulted in a poor mass balance accounting for the
added ethene. At best, we could account for 15% reaction both at H2/CO = 15
and 10. The CO conversion can influence the extent of the secondary
reactions for the added olefin. Hanlon and Satterfield [14] reported that at low
CO conversions (ca. 30%), the conversion of ethylene in the feed was ca.
10%.
The low reactivity of the ethene in our study can be attributed to the low
CO conversions used in this study. However, Dwyer and Somorjai [17]
reported 80–90% reaction of co-fed ethylene at extremely low conversions
(1%) on a Fe (111) crystal at 300°C, 6 bar and H2/CO = 2. There are two good
reasons for this contradiction. Firstly, according to Boelee et al. [18] alkali
promotion generally has a strong negative influence on the rate of secondary
reactions. The Fe crystal used by Dwyer and Somorjai was unpromoted and
hence would have been more reactive. Secondly, carbon deposition was a
problem for Dwyer and Somorjai and therefore short experiments
(approximately 3 hr) were performed. In our study, we allowed for carbon
deposition to a certain extent (to allow for phase changes to Fe carbides) and
performed our co-feeding experiments at steady-state conditions.
102

Chapter 5
0.0
0.2
0.4
0.6
0.8
1.0
0 20 40
Ole
fin
/ (ol
efin
+ p
araf
fin
) [
-]
Time on line [hr]
60
b e
C2H4
(C2H4 + C2H6)
C3H6
(C3H6 + C3H8)
a c d f
0.0
0.2
0.4
0.6
0.8
1.0
0 20 40
Ole
fin
/ (ol
efin
+ p
araf
fin
) [
-]
Time on line [hr]
60
b e
C2H4
(C2H4 + C2H6)
C3H6
(C3H6 + C3H8)
a c d f
Figure 5.2: Olefinicity [olefin / (olefin + paraffin)] for the C2’s and C3’s during the co-fed ethene experiments. Reaction conditions (330°C, 1.2 bar and GHSV = 7850 ml.gcat
-1.hr-1) were kept constant during the various changes to the fresh feed. The fresh feed was changed as follows: (a) H2/CO = 15 without C2H4, (b) H2/CO = 15 with C2H4, (c) H2/CO = 15 without C2H4, (d) H2/CO = 10 without C2H4, (e) H2/CO = 10 with C2H4, and (f) H2/CO = 10 without C2H4.
At these conditions, conversions and selectivities are relatively constant and
the activity rates are lower than the initial values due to catalyst deactivation.
To summarise, Dwyer and Somorjai worked with an unpromoted (cleaned) Fe
catalyst and at the beginning of the reaction where rates of activity are
expected to be higher.
5.3.4. Water-gas-shift activity and selectivity
The CO2 activity and selectivity remained the same when the ethene was
added to the fresh feed as shown in Table 5.3. This is in contrast to the
103

Effects of co-fed ethylene during the high temperature Fischer-Tropsch synthesis
methane activity and selectivity. Although not conclusive, this implies that
methanation and water-gas-shift most probably occur on different catalytic
sites.
Table 5.3: Water-gas-shift (WGS) steady state results with and without co-feeding ethene. Reaction conditions (330°C, 1.2 bar, H2/CO = 15 and GHSV = 7850 ml.gcat
-1.hr-1) were kept constant.
Without co-fed olefin
With co-fed olefin
WGS reaction rate [mole CO2 formed.gcat-1.s-1] 1.4 10-7 1.4 10-7
CO2 selectivity [C-atom %] 15 14
5.3.5. 13CO SSITKA during co-fed ethene experiments
The main aim of performing 13CO SSITKA experiments during co-feeding
ethene in the fresh feed was to collect transient data for the C2-C4’s and test
various C2+ mechanistic models. It was later observed that the co-fed C2H4
(0.7 mol%) was significantly larger than the in-situ formed C2H4 (typically 0.1
mol% after 20 hr online). This lead to poor C2 transients since deconvoluting
the unlabeled and labeled species in the presence of the C2H4 in the fresh feed
was virtually impossible. However, the full transients for the C3’s could be
captured. The first C3 product will be partially labeled species.
In Figure 5.3, a comparison of this transient is made between with and
without the co-fed ethene. Interestingly, there was no change to the partially
labeled propane transient but a clear change to the partially labeled propene.
This result confirms that ethene does take part in chain growth as mentioned
104

Chapter 5
earlier. Furthermore, it seems that the olefins and paraffins grow on different
catalytic sites or do not share the same surface intermediate. Turner et al. [19]
used 13C NMR spectroscopy to show that 13C2H4 reacts with C1 intermediates
to form predominantly 1-alkenes on a Fe/SiO2 catalyst at 220°C, 1 bar and
H2/CO = 1.
0.0
0.1
0.1
0.2
0.2
0.3
0 10 20 30 40
13C12C2H8-b
13C12C2H6-b
13C12C2H8
13C12C2H6
13C12C2H6 with co-fed ethene
Time on line [min]
Nor
mal
ised
res
pons
e [
-] 13C12C2H8 with co-fed ethene
13C12C2H8 without co-fed ethene
13C12C2H6 without co-fed ethene
0.0
0.1
0.1
0.2
0.2
0.3
0 10 20 30 40
13C12C2H8-b
13C12C2H6-b
13C12C2H8
13C12C2H6
13C12C2H6 with co-fed ethene
Time on line [min]
Nor
mal
ised
res
pons
e [
-] 13C12C2H8 with co-fed ethene
13C12C2H8 without co-fed ethene
13C12C2H6 without co-fed ethene
13C12C2H6 with co-fed ethene
Time on line [min]
Nor
mal
ised
res
pons
e [
-] 13C12C2H8 with co-fed ethene
13C12C2H8 without co-fed ethene
13C12C2H6 without co-fed ethene
Time on line [min]
Nor
mal
ised
res
pons
e [
-] 13C12C2H8 with co-fed ethene
13C12C2H8 without co-fed ethene
13C12C2H6 without co-fed ethene
Figure 5.3: Normalised responses for the partially labeled ethene and ethane during a 13CO SSITKA experiment with and without co-fed ethene. Reaction conditions (330°C, 1.2 bar, H2/CO = 15 and GHSV = 7850 ml.gcat
-1.hr-1) were the same for both experiments.
5.3.6. Mechanistic implications
The two main experimental observations, viz. (1) ethene is rapidly
hydrogenated to ethane, and (2) ethene participates in chain growth with a
greater influence on the propene than propane selectivity, need to be
accounted for in the Fischer-Tropsch mechanism proposed in this study. Most
Fischer-Tropsch mechanisms are described by a typical polymerization
105

Effects of co-fed ethylene during the high temperature Fischer-Tropsch synthesis
process and as such have three distinct steps, i.e. initiation, propagation (chain
growth), and termination.
Chain initiation
In our previous work [see Chapter 3], two reactive carbidic surface species,
denoted C and C were identified as the intermediates for methanation and
were also shown to be active for the formation of a C2 intermediate. If ethene
readsorbs onto the catalyst surface, one possible C2 intermediate is
CH2=CH2,ads. In terms of initiation, this species could react with either C or
C to form a C3 intermediate.
Chain propagation
Chain growth can occur by reaction of combinations of C or C to form
reactive C2 intermediates. These C2 intermediates (for example, CH2=CH2,ads
or CH2=CHads) can further react with a monomer (C or C) to form C3’s.
Another possible reaction is for these C2 species to react with one another to
form C4’s which is a dimerization reaction.
Chain termination
Surface alkene intermediates can desorb as alkenes, react with another
growing chain (to form higher hydrocarbons, including branched products) or
react with adsorbed hydrogen to desorb as the corresponding paraffin.
106

Chapter 5
Secondary reactions also need to be taken into account. In this study, it
was shown that an olefin, ethene in this case, can readsorb onto the catalyst
surface and participate in secondary reactions. Based on the main product
observed, ethane, the hydrogenation of ethene was the most predominant
reaction. A full product analysis was not performed for reasons stated earlier
which makes it difficult to ignore other reactions such as isomerisation. The
CO insertion reaction is also plausible, especially if the formation of
oxygenates is considered. More work is required in terms of product analysis
to fully account for the readsorbed olefin.
5.3.6.1. Formation of ethane
Based on the available data and the experimental observation reported here,
two alternate mechanisms are proposed here to those reported in the literature
[8]. Firstly, in Figure 5.4, olefin readsorption is shown to occur on the same
site as the original alkene intermediate (CH2=CH2,ads) and hydrogenation to
the corresponding paraffin (ethane in this case) occurs in two steps, firstly
reaction with Hads to form a second surface intermediate (CH3-CH2,ads) and
then desorption by reaction with another Hads. In this way, the olefin and
paraffin surface intermediates are distinguishable and therefore chain growth
can occur via the CH2=CH2,ads species forming propene first which is
consistent with the result shown in Figure 5.3.
In the second mechanism, presented in Figure 5.5, the idea of two distinct
C2+ intermediates is continued. However, here the olefin readsorbs from the
gas phase directly to the paraffin intermediate (in this case, CH3-CH2,ads). This
accounts to rapid hydrogenation of readsorbed olefins to the corresponding
paraffins with the two step process shown in Figure 5.4. Since it was shown
that chain growth does occur, the formation of the paraffin intermediate,
(CH3-CH2,ads) is also a reversible reaction with the olefin intermediate,
107

Effects of co-fed ethylene during the high temperature Fischer-Tropsch synthesis
CH2=CH2,ads. The chain propagation to form the C3’s is still via the
CH2=CH2,ads intermediate as explained above.
CATALYST SURFACE
H2C CH2
H2C CH2 H+ CH2
CH3
+ H
H3C CH3
CATALYST SURFACE
H2C CH2
H2C CH2 H+ CH2
CH3
+ H
H3C CH3
Figure 5.4: Mechanistic scheme showing the surface intermediates for the formation of ethane from ethene.
H3C CH3
CATALYST SURFACE
H2C CH2
H2C CH2 H+ CH2
CH3
+ H
H3C CH3
CATALYST SURFACE
H2C CH2
H2C CH2 H+ CH2
CH3
+ H
CATALYST SURFACE
H2C CH2
H2C CH2 H+ CH2
CH3
+ H
Figure 5.5: Mechanistic scheme showing the direct hydrogenation of ethene in the gas phase to form ethane via the same surface intermediate shown in Figure 5.4.
5.3.6.2. Formation of propene and propane
From the data presented in Figure 5.3, the additional ethene co-fed has a
greater influence on the formation of propene compared to the formation of
propane. The current mechanisms in the literature [20-29] (also see Chapter 1)
108

Chapter 5
which all claim that olefins are formed via –H abstraction and paraffins via
H-addition, and both from the same species cannot explain the
aforementioned result unless H-addition is an extremely slow reaction. Such a
scenario is unlikely since deuterium experiments (see Chapter 4) showed that
hydrogen-deuterium exchange and hydrogenation reactions are extremely fast
compared to C–C coupling reactions. Therefore, two surface intermediates for
the C3’s must also be a possibility, similarly to the C2’s presented in previous
section.
The mechanistic scheme shown in Figure 5.5 can be extended to account
for the formation of the C3’s as shown in Figure 5.6. This scheme can only be
valid if either the hydrogenation of the propene intermediate or the
readsorption of propene to form propane is extremely slow. Such a case will
then explain the result obtained in Figure 5.3 where the formation of propane
is slow compare to propene.
H3C CH2 CH3
CATALYST SURFACE
H2C CH
H2C CH H+ CH
CH3
+ 2H
CH3
CH3 CH3
H3C CH2 CH3
CATALYST SURFACE
H2C CH
H2C CH H+ CH
CH3
+ 2H
CH3
CH3 CH3
Figure 5.6: Mechanistic scheme showing the formation of propene and propane.
Alternatively, propane can be formed from another surface intermediate
independently of the olefins. Egiebor and Cooper [30] proposed a two (or
dual) site mechanism in which olefins are mainly synthesised on site 1 and
109

Effects of co-fed ethylene during the high temperature Fischer-Tropsch synthesis
paraffins (and saturated hydrocarbons) on site 2. In Figure 5.7, the formation
of propane is shown which occurs from the same surface intermediate (CH3–
CH2,ads) for ethane formation. This mechanistic scheme is still dependent on
the co-fed ethene since the CH3–CH2,ads species also forms from readsorption
of the ethene (see Figure 5.5). However, the reaction with the monomeric
species, in this case CH2,ads is a slow reaction compared to the reaction of
ethene to form propene. It was shown in Chapter 3 that the monomeric
building units for methanation consist of two distinct carbon pools with
different reactivities. So, it is plausible that the CH3–CH2,ads species reacts
with the less reactive C pool whilst the olefins are produced from reactions
with the C pool.
CATALYST SURFACE
+CH2
CH3
+ H
H3C CH2 CH3CH2
CH3
CH2CH2
CATALYST SURFACE
+CH2
CH3
+ H
H3C CH2 CH3CH2
CH3
CH2
CH2
CH3
CH2CH2
Figure 5.7: Mechanistic scheme showing the formation of propane.
5.4. Conclusions
The main conclusions from this study are as follows:
1. The addition of ethene during Fischer-Tropsch synthesis results in
mainly hydrogenation to ethane.
110

Chapter 5
2. Chain growth is also observed but to a lesser extent than hydrogenation
(40% ethane formed compared to 1% propene).
3. Based on 13CO SSITKA results, propene was the kinetically preferred
product when ethene participates in chain growth, implying different
sites or intermediates for the olefins and paraffins.
4. Both the methanation rate and the methane selectivity decreased with
the addition of ethene in the fresh feed. This could be due to competitive
adsorption between the respective surface intermediates, for example
between Hads and CHx (x = 0 to 3) surface intermediates sites.
5. Both the water-gas-shift rate and the CO2 selectivity remained the same
during the co-fed ethene experiments. This could imply that methanation
and water-gas-shift take place on different surface sites.
6. Lastly, two mechanistic pathways, both with dual sites or intermediates,
are proposed to explain the above experimental observations.
References
(1) R.A.Friedel and R.B.Anderson, J. Am. Chem. Soc. 72 (1950) 1211.
(2) P.J.Flory, J. Am. Chem. Soc. 58 (1936) 1877-1885.
(3) B.Shi and B.H.Davis, Appl. Catal. A: 277 (2004) 61-69.
(4) I.Puskas and R.S.Hurlbut, Catal. Today 84 (2003) 99-109.
(5) E.Iglesia, S.C.Reyes and R.J.Madon, J. .Catal. 129 (1991) 238-256.
(6) E.W.Kuipers, I.H.Vinkenburg and H.Oosterbeek, J. Catal. 152 (1995) 137-146.
111

Effects of co-fed ethylene during the high temperature Fischer-Tropsch synthesis
(7) G.P.Van Der Laan and A.A.C.M.Beenackers, Stud. Surf. Sci. Catal., 119 (1998) 179-184.
(8) G.P.Van Der Laan and A.A.C.M.Beenackers, IECR 38 (1999) 1277-1290.
(9) F.G.Botes, Energy & Fuels 21 (2007) 1379-1389.
(10) F.G.Botes and N.S.Govender, Energy & Fuels 21 (2007) 3095-3101.
(11) L.M.Tau, H.A.Dabbagh and B.H.Davis, Energy & Fuels 4 (1990) 94-99.
(12) N.S.Govender, F.G.Botes, M.H.J.M.de Croon and J.C.Schouten, J. Catal. 260 (2008) 254-261.
(13) H.E.du Plessis,H.E.du Plessis, University of Johannesburg(2007).
(14) R.T.Hanlon and C.N.Satterfield, Energy & Fuels 2 (1988) 196-204.
(15) C.J.Kim and N.J.Hills. Reducing Methane Production in Fischer-Tropsch Reactions. ed. Exxon Research and Engineering Company, US Patent, US 4,547,525 (1985).
(16) R.Snel and R.L.Espinoza, J. Mol. Catal. 43 (1987) 237-247.
(17) D.J.Dwyer and G.A.Somorjai, J. Catal. 56 (1979) 249-257.
(18) J.H.Boelee, J.M.G.Custers and K.van der Wiele, Appl. Catal. 53 (1989) 1-13.
(19) M.L.Turner, N.Marsih, B.E.Mann, R.Quyoum, H.C.Long and P.M.Maitlis, J. Am. Chem. Soc. 124 (2002) 10456-10472.
(20) F.Fischer and H.Tropsch, Brennstoff-Chem. 7 (1926) 97-104.
(21) H.H.Storch, N.Golumbic and R.B.Anderson, The Fischer-Tropsch and Related Syntheses (1951).
(22) A.W.Sternberg and I.Wender, Proc.Intern.Conf.on Coordin.Chem. (1959) 53.
(23) H.Pichler, H.Schulz and D.hne, Brennstoff-Chem. 49 (1968) 36.
(24) R.Quyoum, H.C.Long, M.L.Turner and P.M.Maitlis. A mechanistic study of the chain propagation step in the Fischer-Tropsch synthesis. ACS meeting, San Francisco, Fuel Preprints 42, (1997), 62.
(25) H.C.Long, M.L.Turner, P.Fornasiero, J.par, M.Graziani and P.M.Maitlis, J. Catal. 167 (1997) 172-179.
(26) R.Quyoum, V.Berdini, M.L.Turner, H.C.Long and P.M.Maitlis, J. Catal. 173 (1998) 355-365.
112

Chapter 5
113
(27) P.M.Maitlis, R.Quyoum, H.C.Long and M.L.Turner, Appl. Catal. A: 186 (1999) 363-374.
(28) P.M.Maitlis and M.L.Turner, Catal. Today 65 (2001) 91-97.
(29) P.M.Maitlis, J. Organo. Chem. 689 (2004) 4366-4374.
(30) N.O.Egiebor and W.C.Cooper, Appl.Catal. 14 (1985) 323-332.

114

6 Mechanistic pathway for C2+
hydrocarbons over an iron-based catalyst
Our mechanism for the methanation reaction pathway (presented in Chapter 4)
during the Fischer-Tropsch synthesis at high temperature reaction conditions
(330°C, H2/CO = 15 and 1.2 bar) is extended here to account for the formation of
C2+ hydrocarbons. In addition to the mechanism on cobalt-based catalyst, two
additional mechanisms are tested. The latter mechanisms consider two surface
intermediates for the C2+ hydrocarbons and different pathways for olefin
readsorption. It’s shown that a mechanism with two surface intermediates for the
C2+ hydrocarbons and with olefin readsorption directly to the corresponding
paraffin surface intermediate describes the data the best. Parameter estimates for
the rate constants describing the formation of the C2’s are reported. The optimal
model is also shown to fit the C3’s.
115

Mechanistic pathway for C2+ hydrocarbons over an iron-based catalyst
6.1. Introduction
The elucidation of the Fischer-Tropsch (FT) mechanism still remains one
of the major endeavours in heterogeneous catalysis. To date, most researchers
favour either the CO-insertion [1] or carbide mechanism [2] (see Chapter 2
for review of the FT mechanisms). Recently, Davis [3] reviewed the reaction
mechanisms for iron-based FT catalysts and concluded that their data supports
the oxygenate mechanism. Davis had to perform 14C-label experiments to
conclusively eliminate the rival mechanisms. The use of isotopes and isotopic
transient methods, such as SSITKA (Steady State Isotopic Transient Kinetic
Analysis [4-6]), to provide detailed kinetic analysis and information on the
key reaction intermediates is well documented [7].
Mims and co-workers have successfully utilised SSITKA to investigate
active carbon intermediates on the catalyst surface. They showed that the
chain growth over a Co/SiO2 (at 201.85°C, 1.2 bar and H2/CO = 2) and an
Fe/K (at 226.85°C, 0.9 bar and H2/CO = 1) catalyst was rapid in comparison
to the rate of displacement of the isotopes [8;9]. The active carbon species
was also shown to spend most of it’s time on the catalyst surface as a C1
intermediate. Mims [10] also concluded that this intermediate was common to
both methanol and hydrocarbon products. This initial work was extended to
higher pressures and different H2/CO ratios [11-14] on a cobalt catalyst and
led to the development of their kinetic scheme for carbon reaction pathways
in FTS (see Figure B1 in Appendix B). The short-fall of this mechanistic
model is it’s simplicity as it does not take into account olefin readsorption and
moreover it does not distinguish between desorption of the olefins and
paraffins.
116

Chapter 6
Komaya and Bell [15] improved their previous model [16] by taking into
account olefin readsorption over a Ru/TiO2 catalyst at 250°C and D2/CO = 3.
This was done by varying the bed residence times thus allowing olefins to
readsorb. Their model (see Figure B2 in Appendix B) incorporated a
physisorbed precursor from which olefins are allowed the reenter. The model
also allows for depolymerisation of C2 species and the conversion of C1’s
species to Cm,s species. Similarly to Mims et al. [12;17], this model only
considers a single C2 surface intermediate and also does not distinguish
between desorption of the olefins and paraffins.
Van Dijk [18] extended the SSITKA technique, by using GC-MS product
analysis together with MS, to study the Fischer-Tropsch mechanism and
kinetics for a cobalt based catalyst at 210-240°C and 1.2 bar. The main route
for the formation of paraffins and olefins was based on the carbide
mechanism whereas alcohol formation could be either CO or CHxO insertion.
This mechanism (see Figure B3 in Appendix B) also included the presence of
a physisorbed state under dry conditions (no wax formation). Many of the
assumptions made by Van Dijk were based on the formation of a wax layer
under industrial conditions or higher pressures. This model also only
considers a single C2 intermediate but unlike the aforementioned models, this
model does distinguish between desorption of the olefins and paraffins. This
is achieved by defining separate physisorbed species for the olefins and
paraffins. Apart from the physisorbed species, this model is very similar to
the model by Van der Laan and Beenackers [19] (see Figure B4 in Appendix
A), which was developed independently using steady state data captured for
iron based catalysts at 250°C and 15 bar.
117

Mechanistic pathway for C2+ hydrocarbons over an iron-based catalyst
The aim of this study is to develop a plausible mechanism for the Fischer-
Tropsch reaction for an Fe-based catalyst under High Temperature Fischer
Tropsch (HTFT) conditions (typically at 330°C and 1.2 bar) using isotopic
transient methods. The objective is also to develop a mechanism which is
consistent with our methanation reaction pathway (see Chapter 4) and our co-
feeding experiments with ethene (see Chapter 5). Moreover, the mechanism
should be able to describe the formation of oxygenates and other products not
captured under the current experimental conditions.
6.2. Fischer-Tropsch mechanistic models
6.2.1. Model selection and description
The transient responses obtained for C2+ Fischer-Tropsch products on the
Fe-based catalyst in this study differs from those obtained by Van Dijk [18]
on the Co-based catalyst. The main difference, illustrated in Figure 6.1, is the
transient response for the paraffin in this study is delayed compared to the
response for the olefin, which is opposite to Van Dijk’s result. Van Dijk used
a model with single Cn (n ≥ 2) surface intermediates, with olefin readsorption
to describe his data. However, such a model is not capable of describing
delays in the ethane formation. Therefore, in this study, three new models A,
B and C are proposed and tested against transient data collected for an iron-
based catalyst at 330°C and 1.2 bar. In all of the models, the methanation
reaction pathway is taken from Chapter 4 and the corresponding rate
constants are fixed.
118

Chapter 6
0
0.2
0.4
0.6
0.8
1
0 100 200 300
Time /s
No
rma
lize
d R
es
po
ns
e /-
0.0
0.2
0.4
0.6
0.8
1.0
0 5 10 15 20 25 30
Time [min]
No
rma
lis
ed
Re
sp
on
se
[-]
(b) (a)
Figure 6.1: Normalised responses of ethane (closed markers) and ethene (open
markers) on (a) Cobalt [18] and (b) Iron-based catalyst [this study], during the
Fischer Tropsch Synthesis.
MODEL A: A single C2 surface intermediate with olefin readsorption
This model (see Figure 6.2 ) is similar to that proposed by Van Dijk [18]
and Van der Laan and Beenackers [19]. It has been simplified by removing
the physisorbed species in Van Dijk’s model but retains the different
pathways for the olefins and paraffins directly from the C2 surface
intermediate as proposed in both studies. The formation of the C3+ olefins and
paraffins is also similar to the C2’s formation.
CO
COads Cads
Cads
CH4
C2ads
C2H4 C2H6
kco1
km1
ktp2
ktp1
kre2kto2 ktp2ka kd
C3ads
C3H6 C3H8
ki kp kp
kre3kto3 ktp3
CO
COads Cads
Cads
CH4
C2ads
C2H4 C2H6
kco1
km1
ktp2
ktp1
kre2kto2 ktp2ka kd
C3ads
C3H6 C3H8
ki kp kp
kre3kto3 ktp3
Figure 6.2: Schematic for model A, with a single Cn (n ≥ 2) surface intermediate
119

Mechanistic pathway for C2+ hydrocarbons over an iron-based catalyst
MODEL B: Two C2 surface intermediates with olefin readsorption
In model B, illustrated in Figure 6.3, an additional C2 intermediate (C2) is
introduced in series with the C2 intermediate. The rate of formation of C2
(with rate constant, kh) can be considered as a hydrogenation step. Olefin
readsorption and chain growth pathways are similar to model A. It is
presumed that the C3+ hydrocarbons are also formed from two surface
intermediates as illustrated for the C3’s.
C2ads
C2H4 C2H6
kh
kto2 ktp2
C2ads
kre,2
C3ads
C3H6 C3H8
kh
C3ads
ki kp
kto3 kre3ktp3
kp
CO
COads Cads
Cads
CH4
kco1
km1
ktp2
ktp1
ka kd
C2ads
C2H4 C2H6
kh
kto2 ktp2
C2ads
kre,2
C3ads
C3H6 C3H8
kh
C3ads
ki kp
kto3 kre3ktp3
kp
CO
COads Cads
Cads
CH4
kco1
km1
ktp2
ktp1
ka kd
Figure 6.3: Schematic for model B, with two Cn (n ≥ 2) surface intermediates.
MODEL C: Two C2 surface intermediates with direct olefin readsorption
In the third model, illustrated in Figure 6.4 an additional C2 intermediate is
introduced in series similar to Model B. However, here the olefin readsorbs
directly to the paraffin surface intermediate (C2). Moreover, to accommodate
for chain growth via olefin readsorption, the hydrogenation step is considered
reversible. The pathway for the C3+ hydrocarbons is similar to the C2’s as
shown for propene and propane.
120

Chapter 6
C2ads
C2H4 C2H6
khf,2
kto2ktp2
C2ads
kre,2
C3ads
C3H6 C3H8
C3ads
ki kp
kto3kre3 ktp3
kp
CO
COads Cads
Cads
CH4
kco1
km1
ktp2
ktp1
ka kd
khf,2
khr,2khr,2
C2ads
C2H4 C2H6
khf,2
kto2ktp2
C2ads
kre,2
C3ads
C3H6 C3H8
C3ads
ki kp
kto3kre3 ktp3
kp
CO
COads Cads
Cads
CH4
kco1
km1
ktp2
ktp1
ka kd
khf,2
khr,2khr,2
Figure 6.4: Schematic for model C, with two Cn (n ≥ 2) surface intermediates.
6.2.2. Model assumptions and equations
For each of the mechanistic models, the mole balances for all the
components can be derived as explained in Chapter 4 for the case of the
methanation reaction. Model assumptions for a plug flow reactor model were
also discussed in Chapter 4. As an example for the C2+ models equations, the
specific mole balances for both the gas phase and surface species for Model A
are presented. In the equations, a single 13C-labelled atom is represented as ′C
whilst ″C refers to two 13C-labelled atoms. The subscript ‘ss’ refers to the sum
of the concentrations of the labelled and unlabelled species. The mole
balances for the remaining two models are presented in Appendix C.
The mole balances for the fully labelled gas phase components are:
CO'desCO'adsCO'CO' 1
LkCkxt b
CC [1]
121

Mechanistic pathway for C2+ hydrocarbons over an iron-based catalyst
CCb
CHLkLk
xt 'tp2'tp14CH'4' 1 CC
[2]
42''re22''to2
42''42'' 1HCC
b
HCHCCkLk
xt
CC
[3]
2''tp2
62''62'' 1C
b
HCHCLk
xt
CC
[4]
63'''re33'''to3
63'''63''' 1HCC
b
HCHCCkLk
x
C
t
C
[5]
3'''tp3
83'''83''' 1C
b
HCHCLk
x
C
t
C
[6]
The mole balances for the non-labelled gas phase components are exactly
similar to those for the fully labelled species (equations [1] to [6]). Partially
labelled gas phase species are also formed from partial labelled surface
species, as shown in equations [7] to [12].
42're22'to2
42'42' 1HCC
b
HCHCCkLk
xt
CC
[7]
2'tp2
62'62' 1C
b
HCHCLk
xt
CC
[8]
63're33'to3
63'63' 1HCC
b
HCHCCkLk
xt
CC
[9]
122

Chapter 6
3'tp3
83'83' 1C
b
HCHCLk
xt
CC
[10]
63''re33''to3
63''63'' 1HCC
b
HCHCCkLk
x
C
t
C
[11]
3''tp3
83''83'' 1C
b
HCHCLk
x
C
t
C
[12]
The mole balances for the fully labelled surface species are:
CO'co1CO'desCO'adsCO' LkLkCkt
L
[13]
nconsumptionetss
CLL
LL
LLLLLLk
LLLkLkLkLkt
L
_,
CC'
3C'''3C''
3C'3C2C''2C'2C
C'p
CC'C'iC'tp2C'm1CO'co1C'
*/
[14]
where Cnet_consumption represents the net consumption of Cαads into C3+
hydrocarbons and is expressed in mole.kgcat-1.s-1. [see page 109, reference 18
for more details]
CC'C'iC'tp1C'm1
C'LLLkLkLk
t
L
[15]
CC'2C''p
42C''re22C''tp22C''to2C'C'i
2C''
LLLk
CkLkLkLLkt
L
HC
[16]
123

Mechanistic pathway for C2+ hydrocarbons over an iron-based catalyst
CC'3C'''p
63C'''re33C'''tp33C'''to32C''C'i
3C'''
LLLk
CkLkLkLLkt
L
HC
[17]
Partial labelled surface species are formed by the combination of non-
labelled and labelled surface species. These can then desorb to form the
partial labelled gas phase components, as presented above in equations [7] to
[10]. The following set of equations is obtained for the partial labelled surface
species:
CC'2C'p42
C're2
2C'tp22C'to2C'CiCC'i2C'
LLLkCk
LkLkLLkLLkt
HC
L
[18]
CC'3C'p63
C're3
3C'tp33C'to32C'Cp2CC'p3C'
LLLkCk
LkLkLLkLLkt
L
HC
[19]
CC'3C''p63
C''re3
3C''tp33C''to32C''Cp2C'C'p3C''
LLLkCk
LkLkLLkLLkt
HC
L
6.2.3.
[20]
Parameter estimation
The rate constants (kads, kdes, kco1, km1, ktp1 and ktp2 ) estimated in the
methanation study (see Chapter 4) were fixed in this part of the modeling
124

Chapter 6
since the carbon mass balance was closed by taking into account the net
consumption to C2+ species. Moreover, only the rate constants describing the
formation of the C2’s (kto2, kre2, ktp2, kini, kp, kh2f and kh2r) were initially
estimated. Both these steps reduced the number of parameters that needs to be
estimated. The parameter estimation process itself was performed using
gPROMS, similarly for the methanation study in Chapter 4.
6.3. Results and Discussion
6.3.1.
Fischer Tropsch steady state results
The steady state performance of the catalyst has been discussed in Chapter
4. It was shown that the catalyst activity declines the most during the first 10-
15 hrs on line and thereafter reaches steady state. It is at this stage where the
SSITKA experiments are performed since there are minimal changes to the
catalyst. During this initial period, the olefin/paraffin ratio also changes, as
shown in Figure 6.5 for the C2’s and C3’s. For the C2’s, the olefin/paraffin ratio
decreases from ca. 9 to a steady state value of ca. 3 whilst for the C3’s, the
ratio drops from ca. 12 to ca. 6. The baseline conditions used in this study
were at H2/CO = 15, 330°C, 1.2 bar, and GHSV = 7500 ml.gcat-1.hr-1. The data
at these baseline conditions has been used for the parameter estimation. The
steady state gas phase concentration of the C2’s and C3’s in mole.mg-3, which
are used in the modeling, are presented in Figure 6.6.
However, during the course of the experiments, the syngas flow was
stopped to avoid excessive carbon formation (e.g. in Figure 6.5at TOL = 60-
110 hr). When re-commencing the run, the olefin/paraffin ratio returns to the
125

Mechanistic pathway for C2+ hydrocarbons over an iron-based catalyst
baseline conditions after 1-2 hrs on line. There were also data points captured
where the H2/CO ratio and GHSV were varied to investigate the effect of
process conditions.
6.3.2. SSITKA results
The normalised transients for ethene, ethane, propene and propane captured
using a 12CO/ H2/Ar 13CO/ H2/Ar/Ne switch at feed conditions of H2/CO =
15 and GHSV = 7500 ml.gcat-1.hr-1, for three different SSITKA experiments,
are presented in Figure 6.7. Many of the data points overlap implying these
results are fairly reproducible and could therefore be considered suitable for
modelling purposes.
0
5
10
15
0 50 100 150
Time [hr]
Ole
fin
/Par
affi
n
0
2
4
6
8
10
0 50 100 150
Time [hr]
Ole
fin
/Par
affi
n
(a) (b)
H2/CO = 15
H2/CO = 15
0
5
10
15
0 50 100 150
Time [hr]
Ole
fin
/Par
affi
n
0
2
4
6
8
10
0 50 100 150
Time [hr]
Ole
fin
/Par
affi
n
(a) (b)
H2/CO = 15
H2/CO = 15
Figure 6.5: The changes to the olefin/paraffin ratio with time on line for (a) C2’s
and (b) C3’s. Reactions conditions are H2/CO = 15, 330°C, 1.2 bar, and a GHSV
= 7500 ml.gcat-1.hr-1
126

Chapter 6
0.00000
0.00002
0.00004
0.00006
0.00008
0.00010
0 50 100 150
Time [hr]
C2H
6 [m
ol/m
3 ]
0.0000
0.0001
0.0002
0.0003
0.0004
0 50 100 150
Time [hr]
C2H
4 [m
ol/m
3 ](a) (b)
H2/CO = 15
H2/CO = 15
0.00000
0.00002
0.00004
0.00006
0.00008
0.00010
0 50 100 150
Time [hr]
C2H
6 [m
ol/m
3 ]
0.0000
0.0001
0.0002
0.0003
0.0004
0 50 100 150
Time [hr]
C2H
4 [m
ol/m
3 ](a) (b)
H2/CO = 15
H2/CO = 15
Figure 6.6: The steady state gas phase concentration of (a) C2H4 and (b) C2H6
with time on line. Changes to process conditions (H2/CO ratio or space velocity)
cause the data to shift away from the baseline condition (H2/CO = 15, GHSV =
7500 ml.gcat-1.hr-1)
As discussed by Van Dijk [18], the shapes of the transients of C1-C5
hydrocarbons are dictated by the capacity of the chemisorbed state and
contain information about the surface kinetics. Similarly to the methane
transient (see Chapter 4), the fully labelled C2’s and C3’s took more than 40
min to reach steady state. The partially labelled species reached an optimum
at ca. 5 min but showed a long tailing which also reached steady state (a zero
value) at ca. 40-45 min. These responses are much longer than those reported
on cobalt [18] and ruthenium [15] catalysts. In both of these studies, lower
temperatures (210-250°C) were used which resulted in wax formation.
Therefore, the long response times for the higher hydrocarbons were
attributed to increasing physisorption due to this wax formation.
127

Mechanistic pathway for C2+ hydrocarbons over an iron-based catalyst
0.0
0.2
0.4
0.6
0.8
1.0
0 500 1000 1500 2000 2500
Time on line [s]
Nor
mal
ised
Res
pon
se [
-]
0.0
0.2
0.4
0.6
0.8
1.0
0 500 1000 1500 2000 2500
Time on line [s]
Nor
mal
ised
Res
pon
se [
-]
0.0
0.2
0.4
0.6
0.8
1.0
0 500 1000 1500 2000 2500
Time on line [s]
Nor
mal
ised
Res
pon
se [
-]
0.0
0.2
0.4
0.6
0.8
1.0
0 500 1000 1500 2000 2500
Time on line [s]
Nor
mal
ised
Res
pon
se [
-]
(a) (b)
(c) (d)
0.0
0.2
0.4
0.6
0.8
1.0
0 500 1000 1500 2000 2500
Time on line [s]
Nor
mal
ised
Res
pon
se [
-]
0.0
0.2
0.4
0.6
0.8
1.0
0 500 1000 1500 2000 2500
Time on line [s]
Nor
mal
ised
Res
pons
e [-
]
0.0
0.2
0.4
0.6
0.8
1.0
0 500 1000 1500 2000 2500
Time on line [s]
Nor
mal
ised
Res
pon
se [
-]
0.0
0.2
0.4
0.6
0.8
1.0
0 500 1000 1500 2000 2500
Time on line [s]
Nor
mal
ised
Res
pon
se [
-]
(a) (b)
(c) (d)
Figure 6.7: Normalised transient responses for (a) C2H4, (b) C2H6, (c) C3H6 and
(d) C3H8 at H2/CO = 15 and GHSV = 7500 ml.gcat-1.hr-1. The symbols, ♦, ○, ■,
and ▲ represent fully labeled, non-labeled, single atom partial labeled and two
atoms partial labeled transient, respectively. The solid and dashed lines through
the data sets are inserted to better illustrate the shapes of these transients.
However, in this study, there was no significant wax formation at these
higher temperatures (330°C) which was mainly due to the low conversions at
lower pressures. Therefore, the longer response times observed for the C1 to
128

Chapter 6
C3’s cannot be attributed to a higher degree of physisorption. It’s most likely
that these longer responses are due to a carbon reservoir which is difficult to
hydrogenate. For the first 5 to 10 min, the transients reached between 75-90%
of their final steady state value. Thereafter, there’s a slow evolution for the
remaining 30 to 40 min. These are two distinct processes. The first seems to
be associated with a more reactive carbon pool whilst the second process
seems to occur on a less reactive carbon pool. This has been successfully
shown to be the case for the methanation reaction (see Chapter 4). Since the
less reactive carbon pool (C) was shown to be active for C-C coupling, the
delay in the transient responses for the C2-C3’s can be attributed to the
reactivity of this less reactive carbon pool.
6.3.3. C2+ model discrimination
Some researchers [16,18,19] have distinguished between the rates of chain
initiation (Cα + Cα C2α) and chain growth (e.g. Cα + C2α C3α) whilst
others [20-22] have modeled the Fischer-Tropsch product distribution by
presuming these rates are equivalent. Based on this discrepancy, two different
cases have been tested in this study. In the first case, the rates of chain
initiation and chain growth are fixed whilst in the second case, only the chain
initiation rate was fixed and the chain growth rate was estimated. The rate of
chain initiation has already been estimated in the methanation study which
was accomplished by accounting for the net consumption of Cα to form C2+
hydrocarbons. This estimated value (ki = 0.4798 s-1 ± 0.05) is used in both of
these cases.
129

Mechanistic pathway for C2+ hydrocarbons over an iron-based catalyst
Case 1: kini = kp
The model predictions for the 13C-labelled C2’s (13C2H4, 13C12CH4,
13C2H6
and 13C12CH6) are presented in Figure 6.8. Models A and B fail to describe
the 13C2 transients, especially during the initial 15 min where there is a larger
deviation between the model and data points.
0.0
0.2
0.4
0.6
0.8
1.0
0 10 20 30 40 50
Time [min]
No
rmal
ised
res
po
nse
[-]
0.0
0.2
0.4
0.6
0.8
1.0
0 10 20 30 40 50
Time [min]
No
rmal
ised
res
po
nse
[-]
0.0
0.2
0.4
0.6
0.8
1.0
0 10 20 30 40 50
Time [min]
No
rmal
ised
res
po
nse
[-]
0.0
0.2
0.4
0.6
0.8
1.0
0 10 20 30 40 5
Time [min]
No
rmal
ised
res
po
nse
[-]
Model C
Model A
Model B
0
(a)
(d)(c)
(b)
Model C
Model A
Model B
Model C
Model A
Model B
Model C
Model A
Model B
Data
Data
Data
Data
0.0
0.2
0.4
0.6
0.8
1.0
0 10 20 30 40 50
Time [min]
No
rmal
ised
res
po
nse
[-]
0.0
0.2
0.4
0.6
0.8
1.0
0 10 20 30 40 50
Time [min]
No
rmal
ised
res
po
nse
[-]
0.0
0.2
0.4
0.6
0.8
1.0
0 10 20 30 40 50
Time [min]
No
rmal
ised
res
po
nse
[-]
0.0
0.2
0.4
0.6
0.8
1.0
0 10 20 30 40 5
Time [min]
No
rmal
ised
res
po
nse
[-]
Model C
Model A
Model B
0
(a)
(d)(c)
(b)
Model C
Model A
Model B
Model C
Model A
Model B
Model C
Model A
Model B
Data
Data
Data
Data
Figure 6.8: Case 1, model predictions (solid lines) for (a) 13C2H4, (b) 13C12CH4,
(c) 13C2H6 and (d) 13C12CH6 transients for the C2+ models shown in Figure 6.2
to Figure 6.4. The symbols are the data points obtained at H2/CO = 13, 330°C,
1.2 bar and GHSV = 7500 ml.gcat-1.hr-1.
130

Chapter 6
This is also more noticeable for the partially labelled C2’s (see Figure 6.8b &
6.8d). Model C gives the best fit and is capable of describing both the fully
labelled and partially labelled C2’s. The estimated rate constants used to plot
these model predictions are discussed in the next section. In summary, the
model with two intermediates and with a direct hydrogenation route for the
olefin from the gas phase, gives the best description of the experimental data.
Case 2: kini ≠ kp
For this case, in which kp was estimated whilst kini was fixed, both Models
A and B overlapped and could not describe the 13C-labelled C2’s (13C2H4, 13C12CH4,
13C2H6 and 13C12CH6), as shown in Figure 6.9. Once again, Model
C gave the best fit, describing both the fully labelled and partially labelled
C2’s. The model parameters for this case are similar to Case 1 because certain
parameters are highly correlated as discussed in the next section.
6.4. Parameter estimation
The estimated parameter estimates of the rate coefficients for the model
predictions in Figure 6.8 and Figure 6.9 are listed in Table 6.1. The rate
coefficients for the methanation reaction were fixed from Chapter 4 and are
not reported here. Similar to the methanation study [see Chapter 4], a net
consumption term (to C3+ hydrocarbons) was also used here. In comparison to
131

Mechanistic pathway for C2+ hydrocarbons over an iron-based catalyst
0.0
0.2
0.4
0.6
0.8
1.0
0 10 20 30 40 50
Time [min]
No
rmal
ise
d r
esp
on
se [
-]
0.0
0.2
0.4
0.6
0.8
1.0
0 10 20 30 40 50
Time [min]
No
rmal
ised
res
po
nse
[-]
0.0
0.2
0.4
0.6
0.8
1.0
0 10 20 30 40 50
Time [min]N
orm
alis
ed r
esp
on
se [
-]
0.0
0.2
0.4
0.6
0.8
1.0
0 10 20 30 40 50
Time [min]
No
rmal
ised
res
po
nse
[-]
Model C
Model A
Model B
(a)
(d)(c)
(b)
Model C
Model A
Model B
Model C
Models A & B
Model C
Models A & B
Data
DataData
Data
0.0
0.2
0.4
0.6
0.8
1.0
0 10 20 30 40 50
Time [min]
No
rmal
ise
d r
esp
on
se [
-]
0.0
0.2
0.4
0.6
0.8
1.0
0 10 20 30 40 50
Time [min]
No
rmal
ised
res
po
nse
[-]
0.0
0.2
0.4
0.6
0.8
1.0
0 10 20 30 40 50
Time [min]N
orm
alis
ed r
esp
on
se [
-]
0.0
0.2
0.4
0.6
0.8
1.0
0 10 20 30 40 50
Time [min]
No
rmal
ised
res
po
nse
[-]
Model C
Model A
Model B
(a)
(d)(c)
(b)
Model C
Model A
Model B
Model C
Models A & B
Model C
Models A & B
Data
DataData
Data
Figure 6.9: Case 2, model predictions (solid lines) for (a) 13C2H4, (b) 13C12CH4,
(c) 13C2H6 and (d) 13C12CH6 transients for the C2+ models shown in Figure 6.2
to Figure 6.4. The symbols are the data points obtained at H2/CO = 13, 330°C,
1.2 bar and GHSV = 7500 ml.gcat-1.hr-1.
132

Chapter 6
case 1 (kini = kp), the rate constants for case 2 (kini < kp or kp = 3.66 x kini) were
all different except for the termination constant of the paraffin, ktp,2, which
remained the same. Both the olefin termination and the olefin readsorption
rate constants increased by ca. 1.5 and 2 times, respectively. The reverse
hydrogenation rate constant, khr,2 decreased by ca. 1.2 times but there was a
large drop in the forward rate constant, khf,2, being ca. 16.6 times lower. These
changes did not affect the 2 and weighted residual values and therefore both
cases give the best fit. Moreover, the predicted steady state gas phase
concentrations and surface concentrations are similar for both cases and in the
case of the gas phase concentrations, the predicted values closely match the
experimental data values.
To test the robustness of this model (sensitivity analysis), each rate
constant was individually fixed to zero whilst estimating the remaining
parameters. The model fails when both termination rate constants, kto,2 and
ktp,2 are zero. This is expected since a positive value is required to explain the
gas phase concentrations. The model also failed when the olefin readsorption
rate constant (kre,2) was zero. In this case, the paraffin intermediate (C2β) can
only be produced via the hydrogenation of C2α which is not viable according
to our data. In contrast, if the forward hydrogenation rate constant (khf,2) is set
to zero, the model does not fail. The paraffin can still be produced via olefin
readsorption. In the last case, in which the reverse hydrogenation rate constant
(khr,2) is zero, the model does not fail but gives a bad fit. This suggests that
this rate constant is not essential in the model but if included would give
better fits.
One major concern of the current model parameters is the high degree of
cross correlation as illustrated in Table 6.2. Any value other than zero implies
a correlation with values close to ±1 implying a high degree of correlation. In
133

Mechanistic pathway for C2+ hydrocarbons over an iron-based catalyst
Table 6.1: Estimated parameter estimates of the rate coefficients for the C2+
formations at 330°C, 1.2 bar, H2/CO = 15 and GHSV = 7500 ml.gcat-1.hr-1.
Values obtained for Cases 1 and 2 are presented.
Case 1, kini = kp Case 2, kini ≠ kp
Model A Model B Model C Model A Model B Model C
kini 0.4798 0.4798 0.4798 0.4798 0.4798 0.4798
kp 0.4798 0.4798 0.4798 1.0728 0.1657 1.7551
kt0,2 0.3138 13.6890 35.7097 0.0369 6.9148 69.5018
kre,2 0.0032 0.0126 0.0650 0.0002 0.0243 0.1046
ktp,2 0.0038 1.0045 0.0003 0.0082 0.3466 0.0003
khf,2 - 0.9740 19.2530 - 2.0795 1.1602
khr,2 - - 0.0079 - - 0.0066
2 b 231 230 229 230 229 228
WR a 3586 3018 211 2909 2897 213
C2H4, ss 6.86 10-4 6.04 10-4 5.70 10-4 5.71 10-4 4.45 10-4 5.95 10-4
C2H6, ss 8.78 10-7 5.26 10-5 5.20 10-5 1.27 10-4 1.93 10-4 5.35 10-5
C2, ss 6.48 10-5 1.76 10-6 1.45 10-6 4.36 10-4 3.18 10-6 1.11 10-6
C2, ss - 1.72 10-6 7.90 10-3 - 1.91 10-5 9.21 10-3
Units: all k’s in [s-1] except ki in [kgcat.mole -1.s-1], C2 and C2 in [mole.kgcat-1], and C2H4,ss
and C2H6,ss in [mole.mg-3].
a WR is the weighted residual obtained from the parameter estimation results.
b 2 is the 95% chi-squared value obtained from the parameter estimation results.
134

Chapter 6
both cases (see Table 6.2 for values in bold), we observed that the olefin
termination rate constant is highly correlated with the forward hydrogenation
rate constant whilst the olefin readsorption rate constant is highly correlated
with the reverse hydrogenation constant. This explains why we currently
cannot distinguish between the two cases reported. One idea to resolve this
issue was to increase the partial pressure of the olefin (by co-feeding the
olefin) and then performing the SSITKA experiment. In this way, the rate of
olefin readsorption could be enhanced and perhaps fixed at a suitable value.
This was attempted but the experimental data was not suitable for modeling
since the olefin concentration in the fresh feed was much higher than that
produced during our reaction. This caused difficulties with normalizing the
transients due to the constant and much larger value of 12C2H4 present in the
gas phase.
Table 6.2: Correlation matrix of the estimated parameters for both cases
considered.
Case 1, kini = kp Case 2, kini ≠ kp
Parameter khf,2 khr,2 kre,2 kto,2 ktp,2 khf,2 khr,2 kre,2 kto,2 ktp,2 kp
khf,2 1 1
khr,2 0.41 1 0.53 1
kre,2 -0.32 -0.97 1 -0.42 -0.97 1
kto,2 1 0.40 -0.31 1 0.99 0.42 -0.31 1
ktp,2 -0.62 -0.28 0.22 -0.62 1 -0.58 -0.27 0.21 -0.58 1
kp - - - - - 0.61 0.31 -0.20 0.60 -0.29 1
135

Mechanistic pathway for C2+ hydrocarbons over an iron-based catalyst
6.5. Extension to the model to account for C3+
hydrocarbons
The methodology adopted to estimate the rate coefficients for the C2’s was
followed for the C3’s. A net consumption term was defined which accounted for the
formation of C4+ hydrocarbons and the rate constants describing the C1-C2’s were
fixed from Chapter 4 and Table 2. Unfortunately, a good fit could not be obtained
which was mainly due to limited transient data for the partially labeled C3’s.
However, the model did converge and the results for the optimum solution is
presented in Figure 6.10 for propene and in Figure 6.11 for propane. From this we
can conclude that Model C can be extended to account for the formations of higher
hydrocarbons.
0
0.2
0.4
0.6
0.8
1
0 10 20 30 40 5
Time [min]
Nor
mal
ised
res
pons
e [-
]
0
Figure 6.10: Model predictions (represented by solid lines) for propene using
Model C (see Figure 6.4) and the optimized parameters from the C2 study. The
symbols: (●) 13C3H6, (○)12C3H6 (□) 13C12C2H6, and (∆) 13C212CH6 are the data
points obtained at H2/CO = 15, 330°C, 1.2 bar and GHSV = 7500 ml.gcat-1.hr-1
136

Chapter 6
0
0.2
0.4
0.6
0.8
1
0 10 20 30 40
Time [min]
Nor
mal
ised
res
pon
se [
-]
50
Figure 6.11: Model predictions (represented by solid lines) for propane using
Model C (see Figure 6.4) and the optimized parameters from the C2 study. The
symbols: (●) 13C3H8, (○)12C3H8 (□) 13C12C2H8, and (∆) 13C212CH8 are the data
points obtained at H2/CO = 15, 330°C, 1.2 bar and GHSV = 7500 ml.gcat-1.hr-1.
To summarise, we have used our SSITKA results to distinguish between
three mechanistic models for higher hydrocarbon formation. We showed that
Model C, with two surface intermediates and with a direct pathway for olefins
to readsorb and terminate as paraffins, can describe our data the best. The
optimized parameters for the C2 hydrocarbons are highly correlated which
made the estimation of the rate constants for the C3’s more difficult. Fixing
the rate constants for case 2 (kini = kp), Model C could predict the C3’s but
without a high degree of confidence due to lack of sufficient data, especially
for the partial labeled species.
137

Mechanistic pathway for C2+ hydrocarbons over an iron-based catalyst
6.6. Conclusions
In this chapter, 13CO SSITKA experimental data for C2-C3 hydrocarbons
was used to extend the mechanistic model for the methanation reaction
previously reported in Chapter 4. Three different mechanistic models were
tested whilst considering two cases, 1. kini = kp and 2. kini ≠ kp. Model C, in
which there are two surface intermediates for the Cn hydrocarbons (n ≥ 2)
with direct olefin readsorption towards the surface intermediate for paraffin
formation, gave the best fit. Both cases gave identical results in terms of
goodness of fit and predicted gas phase concentrations. This implies that with
the current results, there is no basis for expecting that kini ≠ kp. The results also
showed that the rate constants were highly correlated. This coupled with the
limited data for the C3 partially labelled species made it difficult to optimise
the rate constants for the C3’s. However, a simulation of our best case shows
that the C2 model can be extended to account for the formation of C3’s.
References
(1) A.W. Sternberg and I. Wender, Proc.Intern.Conf.on Coordin.Chem. (1959),
p53.
(2) F. Fischer and H. Tropsch, Brennstoff-Chem. 7 (1926), p97.
(3) B.H. Davis, Catal. Today 141 (2009), p25.
(4) J. Happel, Chem. Eng. Sci. 33 (1978), p1567.
(5) C.O. Bennett, in: Understanding Heterogeneous Catalysis through the Transient Method, eds. A.T.Bell and L.L.Hegedus, Catalysis under Transient Conditions (American Chemical Society, 1982), p1.
(6) P. Biloen, J Mol. Catal. 21 (1983), p17.
138

Chapter 6
139
(7) A. Frennet, B. De, J.M. Bastin and N. Kruse, J Phys. Chem. B 109 (2005), p2350.
(8) C.A. Mims and L.E. McCandish, J Am. Chem. Soc. 107 (1985), p696.
(9) C.A. Mims and L.E. McCandish, J Phys. Chem. 91 (1987), p929.
(10) C.A. Mims, Catal. Letters 1 (1988), p293.
(11) C.J.Bertole, C.A.Mims, G.Kiss and P.Joshi, Stud.. Surf. Sci. Catal. 136 (2001), p369.
(12) C.J. Bertole, C.A. Mims and G. Kiss, J. Catal.210 (2002), p84.
(13) C.J. Bertole, C.A. Mims and G. Kiss, J. Catal. 223 (2004), p309.
(14) C.J. Bertole, C.A. Mims and G. Kiss, J. Catal. 221 (2004), p191.
(15) T. Komaya and A.T. Bell, J. Catal. 146 (1994), 237.
(16) K.R. Krishna and A.T. Bell, Journal of Catalysis 139 (1993), p104.
(17) C.J. Bertole, C.A. Mims and G. Kiss, Journal of Catalysis 221 (2004), p191.
(18) H.A.J. Van Dijk , A mechanistic study using transient isotopic tracing, Ph.D thesis, 2001, Technische Universiteit Eindhoven, Eindhoven, the Netherlands. http://alexandria.tue.nl/extra2/200111083.pdf
(19) G.P. Van Der Laan and A.A.C.M. Beenackers, IECR 38 (1999), p1277.
(20) H. Schulz and M. Claeys, Appl. Catal. A 186 (1999), 91.
(21) W. Zimmerman, D. Bukur and S. Ledakowicz, Chem. Eng. Sci. 47 (1992), 2707.
(22) L. Nowicki, S. Ledakowicz and D.B. Bukur, Chem. Eng. Sci. 56 (2001), 1175.

140

7
A comparative study of CO and CO2 hydrogenation on Fe catalysts
In this chapter, the hydrogenation of CO2 is investigated and compared to CO
hydrogenation (normal Fischer-Tropsch synthesis) over an iron based catalyst at
high temperature (330°C). At these conditions, the water-gas-shift reaction is
closer to equilibrium than at lower temperatures (210-240°C) and so the reverse
reaction becomes thermodynamically more favourable making these conditions
ideal for CO2 hydrogenation. In comparison to CO hydrogenation, the catalyst
activity, deactivation and olefinicity are the same during CO2 hydrogenation at
similar reactor operating conditions, especially the H2/CO ratio. However, the
transients obtained during 13CO and 13CO2 SSITKA experiments differ in both
cases. During CO2 hydrogenation, the reactant and product (CO2 and CO) become
kinetically indistinguishable. From some of the data, a two pool model is proposed
based on the shape of the 13C decay in 13CO2. In comparison to the work by Botes
[1], the model (model B in [1]) in which CHOs and COOHs are the surface
intermediates during the water-gas-shift reaction is the most plausible for the
water-gas-shift mechanism.
141

A comparative study of CO and CO2 hydrogenation on Fe catalysts
7.1. Introduction
The reaction of carbon monoxide and steam to produce carbon dioxide and
hydrogen according to Equation 1, is called the water-gas-shift (WGS)
reaction. The water-gas-shift reaction is useful for those industrial processes
requiring synthesis gas (or syngas) with H2/CO ratios higher than can be
produced by gasification or reforming of hydrocarbons. The WGS reaction is
reversible, the reversed reaction often is denoted as reversed WGS, rWGS. It is
also sometimes referred to as CO2 hydrogenation.
222 HCOOHCO [1]
A variety of counter measures [2] have been undertaken to mitigate the
accumulation of greenhouse gases, especially CO2 in the atmosphere. Among
the methods of chemical fixation, the catalytic hydrogenation of CO2 into
liquid fuels, for example via the Fischer-Tropsch (FT) process [3], has received
much interest as a potential CO2 sink. However, the direct hydrogenation of
CO2 requires a safe and efficient method for the production of required H2,
needed for the reaction. Nevertheless, CO2 hydrogenation is still being
researched for cases of CO2-rich synthesis gas (for example biomass [4]).
In this chapter, CO2 hydrogenation at high temperature Fischer-Tropsch
(HTFT) conditions is investigated. Specifically, isotopes are used to probe the
reaction mechanism.
142

Chapter 7
7.2. Background literature and theory
7.2.1. The water-gas-shift reaction
There are three main processes based on the WGS reaction, viz. the high-
temperature shift (HTS), operating between 360 and 530 C, the low-
temperature shift (LTS), operating between 210 and 270 C, and the “sour gas”
shift which converts raw gases from gasification of coal or crude oil containing
traces of sulphur and which operates at ca. 350 C. Details about the catalysts
used in these (non-FT) processes and other background information has been
reported in the comprehensive review by Newsome [5].
The WGS reaction is also part of complex reactions, such as steam
reforming of methane and the Fischer-Tropsch synthesis. In the case of the
latter process, this is mostly significant over an iron-based catalyst.
7.2.2. Thermodynamic considerations
The WGS reaction is an exothermic reaction (∆H = -40.6 kJ.mol-1). The
equilibrium constant Kp is defined by Equation 2 and its temperature
dependence is expressed by Equation 3 [5] which indicates a decrease with
increasing temperature as shown in Figure 7.1. This implies that the WGS
reaction becomes thermodynamically less favourable at higher temperatures
although the kinetics of the reaction will be much faster. The WGS reaction is
normally conducted in multiple stages to overcome the thermodynamic
limitation. This can be achieved by a HTS operation in the first stage and
thereafter a LTS in the second stage.
COOH
COHK
2
22expWGS, [2]
143

A comparative study of CO and CO2 hydrogenation on Fe catalysts
4.33
T
4577.8expK mequilibriuWGS, [3]
Temperature [°C]
KW
GS
1
10
100
1000
150 250 350 450
ThermodynamicequilibriumLTFT
HTFT
Temperature [°C]
KW
GS
1
10
100
1000
150 250 350 450
ThermodynamicequilibriumLTFT
HTFT
Figure 7.1: A comparison between the thermodynamic equilibrium constant [5] for the water-gas-shift reaction (Equation 3) and experimental constants (Equation 2) for LTFT [6] (H2/CO = 2, 253°C and 15 bar) and HTFT [this study] (H2/CO = 15, 330°C and 1.2 bar) conditions.
For the HTFT synthesis the water-gas-shift reaction is sufficiently rapid so
that it is nearly at equilibrium [6] (KWGS,exp = 15 at 300 C) whereas at low
temperature Fischer-Tropsch (LTFT) conditions, the reaction is far from
equilibrium (KWGS,exp = 4.3 at 253 C). The removal of water causes the water-
gas-shift equilibrium to shift in the case of high temperature Fischer-Tropsch
synthesis so that it favours the production of CO. The CO formed, as a result
undergoes hydrogenation yielding hydrocarbons.
144

Chapter 7
7.2.3. Iron-based catalysts for the WGS and rWGS reactions
Fe based catalysts, for example Fe-Cr catalysts, used for commercial HTS
operations which are not relevant to the Fischer-Tropsch conditions in this
study are not discussed here. Background information about these (non-FT)
catalysts can be found elsewhere [5]. In this section, the background literature
for Fe based catalysts operated at conditions relevant to the Fischer-Tropsch
synthesis is discussed.
Riedel et al. [3] showed that iron and cobalt catalysts behaved differently in
CO2 hydrogenation. With the iron catalyst, the same hydrocarbon product
distribution was obtained with both a H2/CO and H2/CO2 syngas, whereas with
a cobalt catalyst, the product composition shifted towards CH4 at lower CO
content in the syngas. A similar conclusion was obtained by Zhang et al. [8] for
a cobalt based catalyst. For the Fe-based catalysts, Riedel et al. [3] also
observed ca. 43% lower reaction rate for CO2-rich syngas than the CO-rich
syngas (at the same H/C ratio). It was also reported that CO2 oxidises the silica
supported catalysts and therefore the CO2 hydrogenation is lower. Jun et al. [9]
also reported lower activity for silica supported Fe-based catalysts than those
supported on alumina. In another publication by the same others, Schulz et al.
[10] concluded that Fischer-Tropsch with H2/CO2 gave the same product
distribution as with H2/CO. Interestingly, it was also reported that the transient
episodes† for a H2/CO2 feed were similar but extended compared to the H2/CO
feed. They also reported no significant deactivation with the H2/CO2 feed
which was attributed to lower carbon formation. In contrast, Hong et al. [11]
studied the deactivation on precipitated Fe-Cu-K-Al catalysts in CO2
hydrogenation and reported significant decreases in activity and selectivity
after 1500 h at 300ºC and 10 atm. This could be due to the higher temperatures
used by Hong et al. [11] which could have resulted in rWGS activity and hence
higher CO partial pressures with the associated increase in carbon deposition.
† Refers to the time period when the catalyst is undergoing changes, which in the case of Fe-based
catalysts means transforming into carbides. During this period, the product slate also changes.
145

A comparative study of CO and CO2 hydrogenation on Fe catalysts
Chemicals, mainly olefins and alcohols, via the FT process have also
received attention due to demand of these high value products. Fiato et al. [12]
claim a process for producing C2-C20 olefins from a feed stream consisting of
H2 and CO2 using an iron-carbide catalyst. Both oxygenates and hydrocarbons
were produced when CO2 was added to the syngas feed, as reported by Xu et
al. [13]. In that study it was also shown that when CO2 is present at low
concentrations (0.2 mol % of CO), it can initiate chain growth but does not
contribute to a measurable amount of chain propagation. However, when CO2
is present in a larger amount relative to CO (CO2/CO = 3), the water-gas-shift
reaction was rapid relative to that of the FT reaction.
7.2.4. Mechanisms and kinetics
Two main types of reaction mechanisms for the WGS reaction have been
proposed in the literature [5].
(a) Oxidation-reduction mechanism (Rideal-Eley type, Equations 4 and 5):
H2O + s H2 + Os [4]
CO + Os CO2 + s [5]
where Os is the surface oxygen and s is a vacant surface site.
(b) Multistep mechanism (Langmuir-Hinshelwood type, Equations 6 to 10):
COg + s COs [6]
H2Og + 3s 2Hs + Os [7]
COs + Os CO2,s + s [8]
CO2,s CO2,g + s [9]
2Hs H2,g + 2s [10]
in which one step is rate determining whilst the others are fast and virtually
at equilibrium. Here as well, s denotes free adsorption sites and the subscript g
denotes the gas phase.
146

Chapter 7
The WGS reaction on Fe-Cr catalysts has been shown to proceed via an
oxidation-reduction mechanism [14]. However, under Fischer-Tropsch
conditions, such a mechanism has received little attention. Van der Laan and
Beenackers [15] and more recently Botes [1] both considered Langmuir-
Hinshelwood type mechanisms for the WGS reaction at low temperature
Fischer-Tropsch conditions on an iron precipitated catalyst. Specifically, these
mechanisms included the formation of the formate species (COOHs) either by
reacting a hydroxyl species (OHs) or water (H2Os) with carbon monoxide
(COs). The formation of this formate intermediate can also occur via the CHOs
intermediate. The formate intermediate can then be reduced to either adsorbed
or gaseous carbon dioxide. The pathways for the aforementioned reactions are
depicted in Figure 7.2.
COOHs + HsCOs
COg
CO2,g
- s+ s
+ H2O
- H2O
+ Hs- Hs
CHOs + sCOs
COg
CO2,g
- s+ s
+ Hs
- Hs
+ Hs- Hs
+ OHs
- OHs
COOHs + Hs
COOHs + sCOs
COg
CO2,g
- s+ s
+ OHs
- OHs
+ Hs- Hs
Model A
Model B
Model C
COOHs + HsCOs
COg
CO2,g
- s+ s
+ H2O
- H2O
+ Hs- Hs
CHOs + sCOs
COg
CO2,g
- s+ s
+ Hs
- Hs
+ Hs- Hs
+ OHs
- OHs
COOHs + Hs
COOHs + sCOs
COg
CO2,g
- s+ s
+ OHs
- OHs
+ Hs- Hs
Model A
Model B
Model C
Figure 7.2: Schematic of the formate mechanisms as reported by Botes [1]. The reactions for the H2 are the same as Equation 10 whilst H2O can either react as adsorbed H2Os or dissociate into OHs and Hs.
147

A comparative study of CO and CO2 hydrogenation on Fe catalysts
The WGS and FT kinetics cannot be described with the same denominator in
the rate equations [1], implying that these reactions occur on separate catalytic
sites [16,17]. Assuming the formate mechanism, Equation 11 proposed by
Botes [1] can predict the WGS rate within the range of 5 to 20 bar absolute
pressure. The terms in the denominator account for the effects of vacant sites
and site occupation by adsorbed water and hydroxyl groups.
2
5.0
2
22
222
3.61.11
H
OHOH
WGS
HCOOHCO
WGS
P
PP
K
PPPP
r [11]
At HTFT conditions, the exact mechanism and kinetics for the WGS are not
completely understood. The two main reasons for this are:
The WGS reaction is closer to equilibrium at HTFT conditions (see
Figure 7.1). This makes it experimentally complicated to distinguish
between CO and CO2 at these conditions.
The CO disproportionation reaction, 2CO CO2 + C, becomes more
significant at higher temperatures. This causes uncertainty as to the
source of CO2 as it could be the aforementioned reaction or the water-
gas-shift reaction.
The aim of this work is to distinguish between CO2 and CO hydrogenation
at HTFT conditions, specifically in terms of activity and selectivity. The use of
isotopic methods to elucidate the mechanistic pathways is also presented here.
148

Chapter 7
7.3. Results and Discussion
7.3.1. Fischer-Tropsch activity and selectivity
7.3.1.1. Fischer-Tropsch activity
The Fischer-Tropsch activity over a given catalyst is dependent on the
reactant partial pressures and reaction temperature. In the case of CO
hydrogenation, normally the FT activity is expressed as the moles of CO
converted per unit of time. This implies the conversion of CO to CO2 via the
WGS reaction is also taken into account when reporting the FT activity.
However, in the case of CO2 hydrogenation (without CO in the fresh feed), the
FT activity cannot be expressed in the same units since then a negative value is
obtained for CO converted. Therefore many researchers report the FT activity
during CO2 hydrogenation in units of moles of CO2 converted per unit of time.
Another important parameter is the H2/CO reactor exit ratio, which
influences the activity, selectivity and even catalyst deactivation [18].
Davis[18] showed that the CO conversion is lower at H2/CO = 0.7 compared to
H2/CO = 1.7 at 270°C and 11.6 bar on a Fe-based catalysts. Higher H2/CO
ratios are also often desired to limit carbon formation which can cause catalyst
deactivation. In Figure 7.3, the (almost linear) relationship between H2/CO
reactor exit ratio and the H2/CO2 fresh feed ratio is illustrated‡. Thus, to obtain
comparable results as with CO hydrogenation, the correct H2/CO2 inlet ratio
also needs to be chosen. Most studies have compared CO and CO2
hydrogenation at the same H2/CO and H2/CO2 inlet ratios [19,20]. Considering
the aforementioned discussion and the relationship in Figure 7.3, such a
comparison is not realistic, especially at lower temperatures where CO2
hydrogenation is relatively slower than at the higher temperatures used in this
study.
‡ In the case of H2/CO experiments, the H2/CO ratio did not vary across the catalyst bed (differential reaction conditions). For H2/CO2, the assumption was the CO2 hydrogenation is very rapid, and the reactor exit H2/CO2 ratio is taken as the average H2/CO2 across that catalyst bed.
149

A comparative study of CO and CO2 hydrogenation on Fe catalysts
The baseline conditions used in most of our studies were at H2/CO =15
which corresponds to ca. H2/CO2 = 3. The FT activity profile, shown in Figure
7.4, is very similar for both cases. The catalyst activation (via carbide
formation) is similar for both CO and CO2 hydrogenations at these conditions.
Schulz et al. [10] also compared the changes in the catalyst activity of an Fe-
based catalyst during the initial stages of the Fischer-Tropsch synthesis. They
reported similar kinetic episodes but with longer times for H2/CO2. This is to be
expected as they worked at lower temperatures (250°C) where the rWGS
reaction is slower as compared to the WGS reaction. Nevertheless, they did not
0
5
10
15
20
25
0 2 4 6
H2/CO2 feed ratio
H2/
CO
rea
ctor
exi
t ra
tio
8
0
5
10
15
20
25
0 2 4 6
H2/CO2 feed ratio
H2/
CO
rea
ctor
exi
t ra
tio
8
Figure 7.3: Dependence of H2/CO reactor exit ratio on the H2/CO2 fresh feed ratio. Reaction conditions were 330°C and 1.2 bar on a Fe/K catalyst.
report differences in deactivation with CO2 and so it can be accepted that the
hydrogenation of CO2 to produce FT products proceeds via the rWGS reaction
to form the CO intermediate which is subsequently hydrogenated.
150

Chapter 7
7.3.1.2. Methane selectivity
Apart from thermodynamic restrictions, the other major factor against CO2
hydrogenation is the higher methane selectivity [20,21]. The methane
selectivity is not compared here, as negative values were obtained when
calculated on a C-atom basis for CO2 hydrogenation. This is due to the low
0
20
40
60
80
100
0 5 10 15
CO hydrogenation
CO2 hydrogenation
Time on line [hr]
Nor
mal
ised
act
ivit
y [a
.u.]
CO hydrogenation
CO2 hydrogenation
Time on line [hr]
Nor
mal
ised
act
ivit
y [a
.u.]
CO hydrogenation
CO2 hydrogenation
Figure 7.4: Normalised Fischer-Tropsch activity profile comparing CO and CO2 hydrogenation. Reaction conditions were 330°C, 1.2 bar, H2/CO = 15 and H2/CO2 =3, respectively.
conversions and also the absence of CO in the fresh feed. At low conversions,
the error in the GC analysis is large due to the difference between two almost
similar values. Instead, the rate of methane production is reported in Figure 7.5.
The rate of methane production for CO2 hydrogenation is lower than for CO
hydrogenation. One possible reason for this could be that more hydrogen is
consumed during CO2 hydrogenation which slows down the methanation rate.
Alternatively, it could be that CO2 hydrogenation produces more surface
species than during CO hydrogenation, for example formate intermediates [15]
which could block potential methanation sites. It is interesting to note that the
151

A comparative study of CO and CO2 hydrogenation on Fe catalysts
rate of methane production is stable for the first 20 hrs TOL for both CO and
CO2 hydrogenation. This is another indication that severe catalyst deactivation
did not occur during the CO2 hydrogenation experiments in this study since
methane selectivity increases during catalyst deactivation [22].
0
50
100
150
200
0 5 10 15
CO hydrogenation
CO2 hydrogenation
CO hydrogenation
CO2 hydrogenation
Time on line [hr]
CH
4ra
te o
f pr
odu
ctio
n
[m
ol/h
r]
0
50
100
150
200
0 5 10 15
CO hydrogenation
CO2 hydrogenation
CO hydrogenation
CO2 hydrogenation
Time on line [hr]
CH
4ra
te o
f pr
odu
ctio
n
[m
ol/h
r]
Figure 7.5: Comparison of the methane production for CO and CO2 hydrogenation at 330°C, 1.2 bar, H2/CO = 15 and H2/CO2 =3, respectively.
7.3.1.3. Olefinicity (Olefin/Paraffin ratios)
The C2 and C3 olefinicities are shown in Figure 7.6 for both CO and CO2
hydrogenation at similar H2/CO reactor ratios. The olefinicity for CO2
hydrogenation is almost the same as for CO hydrogenation. Similar
selectivities for CO and CO2 hydrogenation have also been reported by other
researchers [3], once again implying that CO2 hydrogenation proceeds via the
rWGS reaction with CO as an intermediate before the Fischer-Tropsch reaction
proceeds.
152

Chapter 7
0
5
10
15
0 5 10 15
CO hydrogenation
CO2 hydrogenation
Time on line [hr]
Eth
ene/
(eth
ane
+ e
then
e)[-
]
CO hydrogenation
CO2 hydrogenation
0
5
10
15
0 5 10 15
CO hydrogenation
CO2 hydrogenation
Time on line [hr]
Eth
ene/
(eth
ane
+ e
then
e)[-
]
CO hydrogenation
CO2 hydrogenation
0
5
10
15
20
0 5 10 15
CO hydrogenation
CO2 hydrogenation
Time on line [hr]
Pro
pen
e/(p
ropa
ne
+ p
rop
ene)
[-]
CO hydrogenation
CO2 hydrogenation
0
5
10
15
20
0 5 10 15
CO hydrogenation
CO2 hydrogenation
Time on line [hr]
Pro
pen
e/(p
ropa
ne
+ p
rop
ene)
[-]
CO hydrogenation
CO2 hydrogenation
Figure 7.6: Olefinicity (olefin/paraffin ratio) for CO and CO2 hydrogenation at 330°C, 1.2 bar, H2/CO = 15 and H2/CO2 =3. Top is C2’s and bottom is C3’s.
7.3.2. A comparison between 13CO and 13CO2 SSITKA
The transients for 13CH4 and C2-C3 hydrocarbons obtained from 13CO
SSITKA have been presented earlier (see Chapters 4 and 6). Figure 7.7 shows
the normalised transients for 13CO2 obtained from 13CO SSITKA experiments.
The Ne and 13CO signals are also shown for comparison of the relative
residence times but these responses were also discussed earlier (see Chapter 4).
153

A comparative study of CO and CO2 hydrogenation on Fe catalysts
During 13CO SSITKA, the surface coverage of the reactant CO is shown to be
extremely small whilst the product
Time on line [min]
Nor
mal
ised
res
pon
se [
-]
0.0
0.2
0.4
0.6
0.8
1.0
0 0.5 1 1.5 2
Run1
Run2b
Run2c
CO
Ne
13CO2
13CO2
13CO2
13CO
Ne
Time on line [min]
Nor
mal
ised
res
pon
se [
-]
0.0
0.2
0.4
0.6
0.8
1.0
0 0.5 1 1.5 2
Run1
Run2b
Run2c
CO
Ne
13CO2
13CO2
13CO2
13CO
Ne
Figure 7.7: Normalised responses for Ne, 13CO and 13CO2 from a 13CO SSITKA experiment (H2/
12CO/Ar H2/13CO/Ar/Ne), obtained at 330°C, 1.2 bar, H2/CO
= 15. The different symbols for 13CO2 are data points from a different time on line or experiment but at the same experimental conditions mentioned above.
0.0
0.2
0.4
0.6
0.8
1.0
0 5 10 15 20
Kr
13CO
13CO2
Time on line [s]
Nor
mal
ised
res
pons
e [-
]
Kr
13CO
13CO2
0.0
0.2
0.4
0.6
0.8
1.0
0 5 10 15 20
Kr
13CO
13CO2
Time on line [s]
Nor
mal
ised
res
pons
e [-
]
Kr
13CO
13CO2
Figure 7.8: Normalised responses for Kr, 13CO and 13CO2 from a 13CO2 SSITKA experiment (H2/
12CO2/Ar H2/13CO2/Ar/Kr), obtained at 330°C, 1.2 bar,
H2/CO2 = 5.
154

Chapter 7
CO2 elutes in about 2 min. In contrast, during 13CO2 SSITKA experiments,
the reactant CO2 seems to occupy a measurable coverage and the product CO
elutes at the same time as illustrated in Figure 7.8. The latter phenomenon is
expected at HTFT conditions (close to the WGS equilibrium) where CO and
CO2 become kinetically indistinguishable from each other.
In the case where CO was present in the fresh feed during CO2
hydrogenation, the 13CO and 13CO2 transients (see Figure 7.9) also eluted at the
same time. There also is an effect of H/C ratio on these transients with
increasing residence times at the higher H/C ratio. However, this conclusion is
based on just these two experiments and therefore more work is required to
fully understand the mechanistic reasons for such an observation. There have
been contradictory reports in the literature regarding the effect of H2/CO ratio
on the surface concentrations on methane intermediates. Van Dijk [23] reported
a decrease for H2/CO = 1 – 5 on a Co based catalyst, Bajusz et al. [24] reported
an increase for H2/CO = 3.9 – 20 on a Ru based catalyst and Chen and
Goodwin [25] showed there was no change for H2/CO = 5 – 15, also on a Ru
based catalyst. Therefore, to study the effect on H2/CO for the more
complicated WGS reaction, at close to equilibrium conditions, requires a
dedicated experimental plan which was not in the scope of this thesis.
The transients for 13CH4 and 12CH4 from 13CO2 SSITKA experiments during
CO2 hydrogenation are shown in Figure 7.10. These transients cross at a value
of 0.5 suggesting that these are the main products and moreover there are no
reversible reactions. Such a reaction pathway is consistent with our 13CO
SSITKA experiments (see Chapter 4). The 13CH4 transient from such an
experiment is also included in Figure 7.10 and is shown to have a longer
residence time. As discussed, more experiments at varying H2/(CO + CO2)
ratios are required to fully understand and explain the reason for this
observation.
155

A comparative study of CO and CO2 hydrogenation on Fe catalysts
Time on line [s]
Nor
mal
ised
res
pon
se [
-]
0.0
0.2
0.4
0.6
0.8
1.0
0 5 10 15 20 25
Ne-3
13CO-3
13CO2-3
Ne-1
13CO-1
13CO2-1
Ne @ H2/(CO+CO2)=10
13CO @ H2/(CO+CO2)=10
13CO2 @ H2/(CO+CO2)=10
Ne @ H2/(CO+CO2)=7.5
13CO @ H2/(CO+CO2)=7.5
13CO2 @ H2/(CO+CO2)=7.5
Time on line [s]
Nor
mal
ised
res
pon
se [
-]
0.0
0.2
0.4
0.6
0.8
1.0
0 5 10 15 20 25
Ne-3
13CO-3
13CO2-3
Ne-1
13CO-1
13CO2-1
Ne @ H2/(CO+CO2)=10
13CO @ H2/(CO+CO2)=10
13CO2 @ H2/(CO+CO2)=10
Ne @ H2/(CO+CO2)=7.5
13CO @ H2/(CO+CO2)=7.5
13CO2 @ H2/(CO+CO2)=7.5
Figure 7.9: Normalised responses for Ne, 13CO and 13CO2 from a 13CO2 SSITKA experiment (H2/
12CO2/Ar H2/13CO2/Ar/Ne), obtained at 330°C, 1.2 bar and
different H2/(CO + CO2) ratios.
0.0
0.2
0.4
0.6
0.8
1.0
0 500 1000 1500
12CH4
13CH4
Ne
13CO
13CH4from CO
13CH4 from 13CO2 SSITKA
Ne
Time on line [s]
Nor
mal
ised
res
pons
e [-
]
12CH4 from 13CO2 SSITKA
13CH4 from 13CO SSITKA
13CO
0.0
0.2
0.4
0.6
0.8
1.0
0 500 1000 1500
12CH4
13CH4
Ne
13CO
13CH4from CO
13CH4 from 13CO2 SSITKA
Ne
Time on line [s]
Nor
mal
ised
res
pons
e [-
]
12CH4 from 13CO2 SSITKA
13CH4 from 13CO SSITKA
13CO
13CH4 from 13CO2 SSITKA
Ne
Time on line [s]
Nor
mal
ised
res
pons
e [-
]
12CH4 from 13CO2 SSITKA
13CH4 from 13CO SSITKA
13CO
Figure 7.10: Normalised responses for Ne, 13CO, 12CH4 and 13CH4 from a 13CO2 SSITKA experiment (H2/
12CO2/Ar H2/13CO2/Ar/Ne), obtained at 330°C, 1.2
bar, H2/CO2 = 5. For comparison, the data for 13CH4 from a 13CO SSITKA (presented in Chapter 4) is also included.
156

Chapter 7
Although steady state selectivities for CO and CO2 hydrogenation are
similar, the product transients for the SSTIKA experiments using 13CO and 13CO2 are somewhat different, at least for the experiments presented here. This
implies that CO2 hydrogenation to Fischer-Tropsch products most probably
proceeds via the formation of CO which is subsequently hydrogenated resulting
in similar selectivities. However, from the transients, it can be concluded that
the rate of these reactions are different.
7.3.3. Mechanistic implications
The shape of the transients obtained during SSITKA experiments provides
information about both the intrinsic kinetics and mechanistic pathways [26]. In
Chapters 4 and 6, reactor modeling was utilized to elucidate the mechanistic
pathways for methane and C2-C3 hydrocarbons, respectively. Such an exercise
requires a wealth of experimental data with good reproducibility. Unfortunately
in the case of CO2 hydrogenation, too few data points were collected due to
technical problems with the mass spectrometer to allow for completion of a
similar study.
However, one simple evaluation of the transient data involves plotting the 13C decay versus time. The shape of this graph is known to provide some
indication of the type of mechanism, in terms of number of “C” pools
[23,26,27]. Details of this approach are given in Appendix D. A concave
upwards graph is obtained for the 13C decay in 13CO2 for both CO and CO2
hydrogenation, as presented in Figure 7.12. Such a graph is indicative of a “two
pool” model. In other words, this indicates that there are two kinetically
distinguishable “C” pools for the WGS reaction mechanism,
157

A comparative study of CO and CO2 hydrogenation on Fe catalysts
7.3.4. Proposed model for WGS reaction
The formate mechanism has recently been accepted as the most plausible
pathway for CO2 formation during Fischer-Tropsch conditions [1,15,28,29].
Botes [1] tested three different formate mechanisms (models A, B and C). In
terms of “C-pools”, two of these models were single pool models whilst the
other was a two pool model as illustrated in Figure 7.11. In models A and C,
the single pool (C1) is the COOHs species whilst in model B the two pools (C1
and C2) are the CHOs and COOHs species, respectively. Based on the 13C decay
plot (Figure 7.12), our results suggest a two pool model. Although the work by
Botes [15] was performed at LTFT conditions, and thus his outcomes may not
apply to our system, the most plausible mechanism for CO2 formation at
present is model B in Figure 7.11. Incidentally, Botes [1] concluded that this
model was also the best model when tested against steady state experiments.
COg CO2,g
COs C1
COg CO2,g
COs C1 C2
Model B
Models A and C
COg CO2,g
COs C1
COg CO2,g
COs C1 C2
Model B
Models A and C
Figure 7.11: Formate mechanisms tested by Botes [1] represented as “C-pools”.
158

Chapter 7
Time on line [s]
ln(1
-E13
C)
[-]
-5
-4
-3
-2
-1
0
0 50 100 150 200 250
Time on line [s]
ln(1
-E13
C)
[-]
-5
-4
-3
-2
-1
0
0 50 100 150 200 250
Time on line [s]
ln(1
-E13
C)
[-]
-6.0
-4.0
-2.0
0.0
0 50 100 150 200
Time on line [s]
ln(1
-E13
C)
[-]
-6.0
-4.0
-2.0
0.0
0 50 100 150 200
Figure 7.12: Calculated decay of the 13C content in 13CO2 from (top) a 13CO SSITKA experiment (H2/
12CO/Ar H2/13CO/Ar/Ne), obtained at 330°C, 1.2 bar,
H2/CO = 15 with symbols representing different data sets, and (bottom) a 13CO2 SSITKA experiment (H2/
12CO2/Ar H2/13CO2/Ar/Ne), obtained at 330°C, 1.2
bar, H2/CO2 = 5.
159

A comparative study of CO and CO2 hydrogenation on Fe catalysts
7.4. Conclusions and recommendations
The H2/CO2 feed ratio during the CO2 hydrogenation influences the H2/CO
reactor ratio and it is therefore important to chose the correct feed ratios
(among other reaction conditions) when comparing CO and CO2 hydrogenation
experiments.
At the same reaction conditions during CO and CO2 hydrogenation, similar
steady-state activity and olefinicity were obtained. This is consistent with the
study by Schulz et al. [10].
In contrast to 13CO SSITKA experiments during CO hydrogenation, CO and
CO2 become kinetically indistinguishable during 13CO2 SSITKA experiments
during CO2 hydrogenation, indicating that in this case the WGS reaction is near
equilibrium.
Based on the 13C decay plots, a two pool model for the WGS mechanism is
most likely to fit our experimental data. When comparing to the recent formate
mechanism reported by Botes [1], model B (see Figure 7.11) is the most
plausible mechanism. This mechanism has CHOs and COOHs species as the
surface intermediates during the WGS reaction.
References (1) F.G. Botes, Appl. Catal. A: 328 (2007) 237-242.
(2) United Nations. Kyoto Protocol to the United Nations framework convention on climate change. (1998).
(3) T. Riedel, M. Claeys, H. Schulz, G. Schaub, S.S. Nam, K.W. Jun, M.J. Choi, G. Kishan and K.W. Lee, Appl. Catal. A: 186 (1999) 201-213.
(4) M. Rohde, D. Unruh, P. Pias, G. Schaub and K.W. Lee, Stud. Surf. Sci. Catal. 153 (2004) 97-102.
(5) D.S. Newsome, Catal. Rev. Sci. Eng. 21 (1980) 275-318.
160

Chapter 7
(6) G.Van Der Laan, Kinetics, selectivity and scale up of the Fischer-Tropsch synthesis, PhD thesis (1999), Rijksuniversiteit Groningen, the Netherlands . http://dissertations.ub.rug.nl/faculties/science/1999/g.p.van.der.laan/?pLanguage=en&pFullItemRecord=ON
(7) M.E. Dry, ACS Div. Fuel Chem., Preprints 48 (2003) 211.
(8) Y. Zhang, G. Jacobs, D.E. Sparks, M.E. Dry and B.H. Davis, Catal. Today 71 (2002) 411-418.
(9) K.W. Jun, H.S. Roh, K.S. Kim, J.S. Ryu and K.W. Lee, Appl. Catal. A: 259 (2004) 221-226.
(10) H. Schulz, G. Schaub, M. Claeys and T. Riedel, Appl. Catal. A:186 (1999) 215-227.
(11) J.S. Hong, J.S. Hwang, K.W. Jun, J.C. Sur and K.W. Lee, Appl. Catal. A: 218 (2001) 53-59.
(12) R.A. Fiato, S.L. Soled, G.W. Rice and S. Miseo. Method for producing olefins from H2 and CO2 using an iron carbide based catalyst. ed. Exxon Research and Engineering Company. US Patent 5,140,049, (1992).
(13) L. Xu, S. Bao, D.J. Houpt, S.H. Lambert and B.H. Davis, Catal. Today 36 (1997) 347-355.
(14) M. Tinkle and J.A. Dumesic, J. Catal. 103 (1987) 65-78.
(15) G.P. Van Der Laan and A.A.C.M. Beenackers, Appl. Catal. A: 193 (2000) 39-53.
(16) E.S. Lox and G.F. Froment, IECR 32 (1993) 71-82.
(17) K.R.P.M. Rao, F.E. Huggins, V. Mahajan, G.P. Huffman, V.U.S. Rao, B.L. Bhatt, D.B. Bukur, B.H. Davis and R.J. O'Brien, Top. Catal. 2 (1995) 71-78.
(18) B.H. Davis, Catal. Today 84 (2003) 83-98.
(19) M.L. Cubeiro, J. González, M.R. Goldwasser, M.J. Pérez-Zurita, E. Pietri and L. García, Hyperfine Interactions 134 (2001) 13-25.
(20) T. Riedel, M. Claeys, H. Schulz, G. Schaub, S.S. Nam, K.W. Jun, M.J. Choi, G. Kishan and K.W. Lee, Appl. Catal. A 186 (1999) 201-213.
(21) G.D. Weatherbee and C.H. Bartholomew, J. Catal. 77 (1982) 460-472.
(22) S.A. Eliason and C.H. Bartholomew, Appl. Catal. A: 186 (1999) 229-243.
161

A comparative study of CO and CO2 hydrogenation on Fe catalysts
162
(23) H.A.J. Van Dijk , A mechanistic study using transient isotopic tracing, Ph.D thesis (2001), Technische Universiteit Eindhoven, Eindhoven, the Netherlands. http://alexandria.tue.nl/extra2/200111083.pdf
(24) I.G. Bajusz and J. Goodwin, J. Catal. 169 (1997) 157-165.
(25) B. Chen and J. Goodwin, J. Catal. 158 (1996) 511-520.
(26) S.L. Shannon and J. Goodwin, Chem. Rev. 95 (1995) 677-695.
(27) Y. Soong, K. Krishna and P. Biloen, J. Catal. 97 (1986) 330-343.
(28) B.T. Teng, J. Chang, J. Yang, G. Wang, C.H. Zhang, Y.Y. Xu, H.W. Xiang and Y.W. Li, Fuel 84 (2005) 917-926.
(29) Y.N. Wang, W.P. Ma, Y.J. Lu, J. Yang, Y.Y. Xu, H.W. Xiang, Y.W. Li, Y.L. Zhao and B.J. Zhang, Fuel 82 (2003) 195-213.

8 Conclusions and Outlook
8.1. Conclusions
The high temperature (300–350 C) Fischer-Tropsch (HTFT) process aims
at the production of gasoline and linear low molecular mass olefins from a
mixture of hydrogen and carbon (synthesis gas) over an Fe-based catalyst.
The process comprises a network of complex elementary reaction steps and to
date, mechanisms in the literature cannot explain these reaction pathways. For
this reason, this thesis has addressed the development of a mechanistic
pathway for this process by the use of isotopic methods. The Steady State
Isotopic Transient Kinetic Analysis (SSITKA) technique keeps the catalyst at
steady state whilst an abrupt switch is made to the feed, changing from a
normal feed to an isotopically labelled one. The resulting transient responses
provide information about the intrinsic kinetics which in turn can be related to
a fundamental reaction pathway. The main outcome of this thesis is presented
here.
A mechanism for methanation
In Chapter 4, 13CO SSITKA experimental results showed that molecularly
adsorbed CO on the Fe/K catalyst (at 330°C, 1.2 bar and H2/CO = 15) is
163

Conclusions and Outlook
extremely low, ca. 9 10-4 ML, whilst the monomeric carbon pool (C1,tot) is
much higher at 0.25 ML. A parameter estimation study showed that three (out
of six) methanation models are indistinguishable and moreover these models
have a buffer step or parallel route towards the formation of methane. In other
words, there needs to be two surface intermediates in the model to explain
the experimental results. In order to distinguish between these models, the
chain initiation reaction (C-C coupling) was included which resulted in eight
models being tested. The final results showed that two of these eight models
(see Figure 4.7, Chapter 4) remain indistinguishable. Both these models have
two surface intermediates (C and C) which are active towards methanation
and higher hydrocarbon formation as shown in Figure 8.1.
Model 3.2 Model 5.2
Figure 8.1: Indistinguishable models 3.2 and 5.2 as obtained from the methanation study in Chapter 4.
The quantification of the kinetic rate parameters was performed by
accounting for the higher hydrocarbon formation. The results showed that C
is the larger pool, occupying 92% of the C1,tot coverage and is 25-50 times less
active for methanation than C.
164

Chapter 8
Identification of surface species
The aforementioned study of the methanation reaction was completed only
with 13CO SSITKA experimental data and hence could not shed any light onto
the nature of the carbon pools, specifically C and C. For this reason, in
Chapter 3, the identity and reactivity of surface carbonaceous intermediates
were determined by various methods, mostly isotopic tracing using
deuterium.
It is well known in literature that the activity and selectivity of an Fe-based
Fischer-Tropsch catalyst changes with time on line which is mainly attributed
to phase changes (mostly the formation of Fe-carbides). This was also
observed in this study (Chapter 4). Therefore, it was decided to perform
experiments on a fresh catalyst and a catalyst which was exposed to synthesis
gas as well as an end of run sample to investigate the effect of carbiding the
Fe-based catalyst. The results showed that the transients at the start of the
Fischer-Tropsch synthesis (i.e. when synthesis gas is introduced) were
different on a carbided catalyst compared to a freshly reduced catalyst.
Moreover, on both the fresh and carbided catalysts, carbon deposition still
occurs to the same extent but water formation and methane formation are
faster on the carbided catalyst.
H/D exchange reactions were used to identify the nature of the surface
intermediates which turned out to be different for the various carbided
catalysts. The CHs and CCHs surface intermediates were observed on both
catalysts for methane formation and C2 hydrocarbon formation, respectively.
The other Fischer Tropsch surface intermediates, which were present on the
fresh catalyst, either disappeared on the carbided catalyst or were too small in
concentration to be detected. These results are summarised in Figure 8.2.
165

Conclusions and Outlook
FRESH CATALYST CARBIDED CATALYST
CARBIDED CATALYSTFRESH CATALYST
FeCDH
v
0.0
0.2
0.4
0.6
0.8
1.0
0.0 0.5 1.0 1.5
Time [min]
Nor
mal
ised
res
pon
se [
-]
C2H1D3
C2D4
C2H3D1C2H2D2
H2 (420°C) Ar (330°C) D2/CO/Ar
0.0
0.2
0.4
0.6
0.8
1.0
0.0 0.5 1.0 1.5
Time [min]
Nor
mal
ised
res
pon
se [
-]
C2H1D3
C2D4
C2H3D1C2H2D2
H2 (420°C) Ar (330°C) D2/CO/Ar
Time [s]
Nor
mal
ised
res
pon
se [
-]
0.0
0.2
0.4
0.6
0.8
1.0
0 20 40 60
C2H4
C2D4
C2H1D3
H2/12CO/Ar D2/
12CO/Ar
Time [s]
Nor
mal
ised
res
pon
se [
-]
0.0
0.2
0.4
0.6
0.8
1.0
0 20 40 60
C2H4
C2D4
C2H1D3
Time [s]
Nor
mal
ised
res
pon
se [
-]
0.0
0.2
0.4
0.6
0.8
1.0
0 20 40 60
C2H4
C2D4
C2H1D3
H2/12CO/Ar D2/
12CO/Ar
Figure 8.2: Summary of the main results from the H/D exchange experiments on a fresh and carbided catalyst as reported in Chapter 3.
Surface carbon was deposited via the Boudouard reaction using 13CO on a
reduced catalyst. This carbon (13Cs) was active and detected in the C2+
hydrocarbon products as a coupling reaction with 12Cs rather than with 13Cs.
Finally, combing the in-situ and ex-situ temperature programmed surface
reaction data with the in-situ isothermal reaction data, confirmed the presence
of six distinct pools of carbonaceous intermediates. Graphitic carbon, detected
at 767°C, had the highest coverage of all the surface species.
Co-feeding ethene during Fe-HTFT
Numerous studies have addressed olefin readsorption either on Fe or Co-
based catalysts but mostly at low temperatures (200-270°C). At higher
166

Chapter 8
temperatures, like the experiments in this thesis, these reactions could become
more significant. To provide some insight into the mechanistic pathways of
olefin readsorption during the HTFT process, ethene was added to the fresh
feed (as 1 mol% C2H4 in H2) and 13CO SSITKA experiments were performed
as presented in Chapter 5.
The main reaction was the hydrogenation of ethene to ethane but chain
growth was also observed to a certain extent (40% ethane was formed
compared to 1% propene). Based on 13CO SSITKA results, propene was the
kinetically preferred product when ethene participates in chain growth,
implying different sites or different intermediates for olefins and paraffins. It
was also observed that both the methanation rate and the methane selectivity
decreased with the addition of ethene in the fresh feed. This could be due to
competitive adsorption between the respective surface intermediates, for
example between Hads and CHx (x = 0 to 3) surface intermediates sites. Both
the water-gas-shift rate and the CO2 selectivity remained the same during the
co-fed ethene experiments. This could imply that methanation and water-gas-
shift take (WGS) place on different surface sites. These results were used to
propose two mechanistic pathways, both with dual sites (or different
intermediates) as presented in Figures 5.6 and 5.7.
The Fischer-Tropsch mechanism
In Chapter 6, 13CO SSITKA experimental data for C2-C3 hydrocarbons
were used to extend the mechanistic model for the methanation reaction
previously reported in Chapter 4. The results from co-feeding an olefin
(presented in Chapter 5) was also considered and used to propose two
different mechanistic models. This resulted in testing three different
167

Conclusions and Outlook
mechanistic models whilst considering two cases. In the first case, the
initiation and chain growth rate coefficients are equal (kini = kp) and in the
second case, these rate coefficients differ (kini ≠ kp). A parameter estimation
study showed that only one model, in which there are two surface
intermediates for the Cn hydrocarbons (n ≥ 2) with direct olefin readsorption
towards the surface intermediate for paraffin formation, gave the best fit. The
results also showed that the rate coefficients were highly correlated. This
coupled with the limited data for the C3 partially labelled species made it
difficult to optimise the rate coefficients for the C3’s. However, a simulation
of our best case shows that the proposed C2 model can be extended to account
for the formation of C3’s (see Figure 6.3).
The aforementioned main conclusions can be summarised into a preferred
mechanism for the Fischer-Tropsch synthesis on an iron-based catalyst as
illustrated in Figure 8.3.
CsCsH
2 4 2 6C H C H
CsH2CH3,ads CHCsCHads
3 6 C3H8C H
CsH2CH2CH3,ads
ki kp kp
CO
CsO CsHCs
CH4
ka kd
CsCsH
2 4 2 6C H C H
CsH2CH3,ads CHCsCHads
3 6 C3H8C H
CsH2CH2CH3,ads
ki kp kp
CO
CsO CsHCs
CH4
ka kd
Figure 8.3: Preferred mechanism for the Fischer-Tropsch synthesis using an iron-based catalyst.
CO versus CO2 hydrogenation
The water-gas-shift (WGS) reaction becomes significant on Fe-based
catalysts and, hence should be considered in the overall mechanistic pathway.
168

Chapter 8
In Chapter 7, a comparison between the CO and CO2 hydrogenation was
presented. It was shown that the H2/CO2 feed ratio during the CO2
hydrogenation influences the H2/CO reactor ratio and it is therefore important
to choose the correct feed ratios (among other reaction conditions) when
comparing CO and CO2 hydrogenation experiments.
At the same reaction conditions, during CO and CO2 hydrogenation,
similar steady-state activity and olefinicity were obtained. In contrast to 13CO
SSITKA experiments during CO hydrogenation, CO and CO2 become
kinetically indistinguishable during 13CO2 SSITKA experiments during CO2
hydrogenation, indicating that in this case the WGS reaction is near
equilibrium.
Based on the 13C decay plots, a two pool model for the WGS mechanism is
the most likely fit to our experimental data. Upon comparison with the open
literature, the formate mechanism is the most plausible mechanism. This
mechanism has CHOs and COOHs species as the surface intermediates during
the WGS reaction.
Hypothesis and key questions
The hypothesis and key questions considered in this thesis are presented in
Chapter 1 (section 1.5). The hypothesis that Cs is active and should play a role
in the mechanism of the HTFT process is indeed true. This was shown in
Chapter 3 with the 13CO deposition (Boudouard reaction) experiment in
which the 13Cs was active for Fischer-Tropsch. Moreover, in the deuterium
tracing experiment, CCHs was identified as an active species for C2 formation.
This intermediate most probably forms from the reaction of Cs and CHs.
Responses to the specific key questions are:
169

Conclusions and Outlook
The monomer for the HTFT process is most likely the CHs as identified by
the deuterium study in Chapter 3.
In terms of the reactive intermediates, both CHs and CCHs were identified
as the most abundant whilst graphitic carbon is the most abundant unreactive
species (see Chapter 3).
Olefins and paraffins can be described by the same mechanism but do not
necessarily share the same surface intermediates (see Chapters 3, 5 and 6).
Unfortunately, the experiments to elucidate the oxygenate and water gas shift
surface intermediates (using 18O-labelled CO and CO2) were not performed in
this thesis. This will form part of a follow-up study to this thesis.
Cs was shown to be important in the overall mechanism.
The experiments with varying H2O and CO2 to study surface carbon (Cs)
were not performed here as it posed a few technical challenges and required a
modification to the setup. This will also be part of the follow-up study to this
thesis.
The readsorption of 1-olefins (ethene) was studied and shown to be
relevant in the mechanism of the HTFT process (see Chapter 5). The study of
other 1-olefins (especially propene) and alcohols will form part of a follow up
study.
The formation of CO2 seems to be predominantly from the water-gas-shift
reaction since H2O needs to be present before CO2 is formed (see Figure 3.1).
The Boudouard reaction also occurs but the CO2 formed here is as significant
as that from the water-gas-shift reaction.
170

Chapter 8
8.2. Outlook
This thesis presents a basic framework for the HTFT process and
successfully describes the formation of methane, ethane and ethene. These
results were based on 1.2 bar experiments and so, a first step would be to
determine if these reaction pathways hold true at higher pressures (perhaps
from 5 to 15 bar). There is also scope to refine the C3+ model, specifically to
show if it also requires two separate carbon pools as in the case for the CH4
and the C2’s.
The formation of oxygenates were not considered in this thesis. These
products are important to the overall selectivity of the HTFT process and
should therefore be included in the overall mechanism. The key question is
whether the oxygenates share the same surface intermediates as the
hydrocarbons or maybe with the WGS intermediates. These experiments
would probably require a combination of 13CO and C18O SSITKA
experiments.
The identification of the surface intermediates for methanation and C2
formation required numerous experiments with different GCMS sampling
programs. Such a study could be extended to the C3’s and C4’s to determine if
these species share the same surface intermediates. This would provide
conclusive proof of the monomer during the Fischer-Tropsch process. Due to
the large number of isotopic variants, it would be difficult to perform such
experiments for C5’s, although not impossible. Proper analysis of the C4’s
would also provide some indication as to the mechanism of branched products
(e.g. transients for (CH3)2-CH-CH3).
The relationship between the catalyst phase and product selectivity during
the HTFT process is still not well understood. SSITKA has the advantage that
171

Conclusions and Outlook
172
the catalyst phase remains the same during the isotopic switch. Bearing this in
mind, it would be useful to perform short SSITKA experiments at various
times on line. This will provide insight into the changes in surface coverages
and selectivity whilst ex-situ analysis (for example X-Ray Diffraction) would
provide information on the corresponding phase changes. This would allow
for a correlation between selectivity and catalyst phases.
Finally, this thesis proposed a mechanistic pathway for the WGS reaction
at HTFT conditions. A more detailed study, similar to the methanation study
in Chapter 4, is required in order to validate this WGS mechanism. Here as
well, the catalyst phase during the experiments should be taken into account.
Moreover, apart from the obvious 13C labeled CO and CO2 reactants, the use
of 18O-labelled CO and CO2 reactants will provide the relevant data to
distinguish between the rival formate mechanisms. Another option is to
perform coupled DRIFTS-MS and SSITKA experiments to check if the
labeled formate intermediate is related to the appearance of the labeled CO2.

Nomenclature
Roman symbols
kA constants in Equation 2
sC surface carbon
st
c
kC steady-state concentrations of species in the gas phase.
constant
CE13 fractional contribution of 13C-labelled isotopes (eg. 13CO)
ID
L
internal diameter
jI mass spectrometer intensity of component j
ik reaction rate coefficient for reaction i
length
N number of exponential functions in constitute the spectrum.
stir rates of steps i
t time
CkZ relative concentrations of the isotopic label (isotopic fraction) in
173

Nomenclature
the gas phase species.
kZ relative concentrations of the isotopic label (isotopic fraction) on
the catalyst surface
Greek symbols
dimensionless coefficient that determines the ratio between the
active sites on the catalyst surface and the concentrations of
reactants in the gas phase.
i number of atoms of the same type capable of carrying a label
from one specie to another in a single elementary step.
stk steady-state concentrations of species on the catalyst surface
k the eigenvalues of the corresponding matrix for the right-hand
sides of Equations 1.
bed residence time
Subscripts and superscripts
a or ads adsorption
b bed
d or des desorption
174
g gas phase
h hydrogenation
i or ini initiation
p propagation or chain growth
re readsorption
tp,i termination of a paraffin for component i
to,i termination of an olefin for component i
Abbreviations
ASF Anderson Schulz Flory
FID Flame Ionisation Detector
FTS Fischer-Tropsch Synthesis
GC Gas Chromatography
GCMS Gas Chromatography Mass Spectrometer
HTFT High Temperature Fischer-Tropsch
ISR Isothermal surface Reaction
LTFT Low Temperature Fischer-Tropsch
ML Monolayer
MS Mass Spectrometer
PFR Plug Flow Reactor
175

Nomenclature
176
rWGS Reverse Water-Gas-Shift
SSITKA Steady State Isotopic Transient Kinetic Analysis
TPH Temperature Programmed Hydrogenation
TPO Temperature Programmed Oxidation
TPR Temperature Programmed Reduction
TPSR Temperature Programmed Surface Reaction
WGS Water-Gas-Shift

Appendix A: The gPROMS modeling language.
In this section, specific information about the gPROMS modelling is
described. For more details, the reader is advised to consult the Advanced
User Guide1. A new gPROMS project starts with a tree structure consisting of
various folders. Each folder on the project tree represents a group of
gPROMS entities. Each entity type represents a fundamental gPROMS
concept. In our work, the following entities were used:
1. Variable Type
2. Model
3. Process
4. Parameter Estimation
5. Experiments
Variable and variable types
In gPROMS, all quantities calculated by the Model Equations are
Variables which are always real numbers and must always be given a
Variable Type. The variable name, default value, and upper and lower limits
need to be specified. An example of our Variable Type is shown in Table A1.
1 Process System Enterprise. gPROMS Advanced User Guide. (2005)
177

Appendix A
Table A1: Details of the Variable Types as specified in the gPROMS model used in this study.
Name Lower
Limit
Default
Value
Upper
Limit
Units
gas_concentration 0.0 1.0 1.0 1030 mol/mg3
normalized_gas_concentration 0.0 0.0 1.1 - reaction_rate_constants 0.0 1.0 1.0 1030 s-1 surface_concentration 0.0 1.0 1.0 1030 mol/kgcat
The model entity
Each gPROMS process must contain at least one Model which provides a
description of the physical behaviour of a given system in the form of
mathematical equations. The gPROMS language tab in a new Model entity
comprises of various sections. In our work, the following sections were used:
1. Parameter
2. Distribution_Domain
3. Variable
4. Boundary
5. Equation
The Parameter section is used to declare the parameters of a Model.
Parameters are time-invariant quantities that will not, under any
circumstances, be the result of a calculation. Each parameter is declared a
certain type (for example, Real or Integer). An example of the parameters as
declared in our model is shown in Figure A1. All distribution domains within
our model are specified in the DISTRIBUTION_DOMAIN subsection of the
Model entity. In a typical tubular reactor model, Axial and Radial are two
such domains defined which are declared as two model parameters, namely
reactor length and reactor radius. In our work, the radial domain was ignored
and only the axial domain was declared as is shown in Figure A1.
178

All quantities that are calculated in Model Equations must be declared as
model variables in the VARIABLE section. Like Parameters, Variables are
always real numbers and must be given a type as shown in Figure A1 for our
work.
BOUNDARY conditions are part of the description of the physical system
behaviour and are therefore specified within Models in contrast to initial
conditions, which may differ from one simulation experiment to another and
are therefore specified within Processes. In gPROMS, it is possible to include
the Boundary conditions in the Equation section together with all other model
equations but for clarity reasons it is often better to have it separated. The
Boundary conditions specified in our model are presented in Figure A2.
The EQUATION section is used to declare the equations that determine the
time trajectories of the variables already declared in the VARIABLE section.
179

Appendix A
PARAMETER epsg as REAL Fv as REAL V as REAL rocat as REAL SimTime as REAL a1, a2, a3 as REAL Cco0 as REAL NoCompg as INTEGER NoComps as INTEGER NoCompg_pl as INTEGER NoComps_pl as INTEGER ReactorLength as REAL DISTRIBUTION_DOMAIN Axial as [0:ReactorLength] VARIABLE C_l as DISTRIBUTION(NoCompg,Axial) of gas_concentration L_l as DISTRIBUTION(NoComps,Axial) of surface_concentration C_nl as DISTRIBUTION(NoCompg,Axial) of gas_concentration L_nl as DISTRIBUTION(NoComps,Axial) of surface_concentration Css as DISTRIBUTION(NoCompg,Axial) of gas_concentration Lss as DISTRIBUTION(NoComps,Axial) of surface_concentration C ne as DISTRIBUTION(Axial) of gas_concentration Cbound as ARRAY(NoCompg) of gas_concentration Lbound as ARRAY(NoComps) of surface_concentration Cn_CO_l as ARRAY(Axial) of surface_concentration Cn_Product_gases_l as ARRAY(NoCompg-1) of normalized_gas_concentration Cn_CO_nl as ARRAY(Axial) of normalized_gas_concentration Cn_Product_gases_nl as ARRAY(NoCompg-1) of normalized_gas_concentration k as reaction_rate_constantsadsk
des
reaction_rate_constants as
Figure A1: An example of a gPROMS model for a transient plug-flow reaction model
showing the details of the PARAMETER, DSITRIBUTION_DOMAIN and VARIBALES
as specified in this work.
The order in which the equations are declared is of no importance in
gPROMS. The model equations for the SSITKA modelling as discussed
elsewhere (Chapter 4), are presented in Figure A2. The symbol $ denotes the
partial differentiation operator with respect to time.
k 1, k2, k3, k4 as reaction_rate_constants k 5, k6 as reaction_rate_constants
180

The process entity
A Model can be used to study the behaviour of the system under many
different circumstances, each one called a simulation activity. The coupling of
Models with the particulars of a dynamic simulation activity is done in a
PROCESS. A PROCESS is partitioned into the following key sections:
1. UNIT
2. SET
3. ASSIGN
4. INTIAL
5. SOLUTION PARAMETERS
6. SCHEDULE
181

Appendix A
BOUNDARY Cne(0) = (1-(1/(1+exp(-(time-a1)/a2)))^a3); C_l(1,0) = Cco0*((1/(1+exp(-(time-a1)/a2)))^a3); C_l(2,0) = Cbound(2); L_l(1,0) = Lbound(1); L_l(2,0) = Lbound(2); L_l(3,0) = Lbound(3); C_nl(1,0) = Cco0*(1-((1/(1+exp(-(time-a1)/a2)))^a3)); C_nl(2,0) = Cbound(2); L_nl(1,0) = Lbound(1); L_nl(2,0) = Lbound(2); L_nl(3,0) = Lbound(3); Css(1,0) = Cco0; Css(2,0) = Cbound(2); Lss(1,0) = Lbound(1); Lss(2,0) = Lbound(2); Lss(3,0) = Lbound(3); EQUATION
FOR x:=0|+ TO ReactorLength DO $Cne(x)+(Fv/(epsg*V))*PARTIAL(Cne(x),Axial)=0; $C_l(1,x)+(Fv/(epsg*V))*PARTIAL(C_l(1,x),Axial)=(rocat/epsg)*(-kads*C_l(1,x) +kdes*L_l(1,x)); $C_l(2,x)+(Fv/(epsg*V))*PARTIAL(C_l(2,x),Axial)=(rocat/epsg)*(ktp1*L_l(3,x)); $L_l(1,x)=kads*C_l(1,x)-kdes*L_l(1,x)-kco2*L_l(1,x)-kco1*L_l(1,x); $L_l(2,x)=kco2*L_l(1,x)-km1*L_l(2,x); $L_l(3,x)=km1*L_l(2,x)+kco1*L_l(1,x)-ktp1*L_l(3,x)-L_l(3,x)/Lss(3,x)*C2net; $C_nl(1,x)+(Fv/(epsg*V))*PARTIAL(C_nl(1,x),Axial)=(rocat/epsg)*(-kads*C_nl(1,x) +kdes*L_nl(1,x)); $C_nl(2,x)+(Fv/(epsg*V))*PARTIAL(C_nl(2,x),Axial)=(rocat/epsg)*(ktp1*L_nl(3,x)); $L_nl(1,x)=kads*C_nl(1,x)-kdes*L_nl(1,x)-kco1*L_nl(1,x)-kco2*L_nl(1,x); $L_nl(2,x)=kco2*L_nl(1,x)-km1*L_nl(2,x); $L_nl(3,x)=km1*L_nl(2,x)+kco1*L_nl(1,x)-ktp1*L_nl(3,x)-L_nl(3,x)/Lss(3,x)*C2net; (Fv/(epsg*V))*PARTIAL(Css(1,x),Axial)=(rocat/epsg)*(-kads*Css(1,x)+kdes*Lss(1,x)); (Fv/(epsg*V))*PARTIAL(Css(2,x),Axial)=(rocat/epsg)*(ktp1*Lss(3,x)); 0=kads*Css(1,x)-kdes*Lss(1,x)-kco1*Lss(1,x)-kco2*Lss(1,x); 0=kco2*Lss(1,x)-km1*Lss(2,x); 0=kco1*Lss(1,x)+km1*Lss(2,x)-ktp1*Lss(3,x)-Lss(3,x)/Lss(3,x)*C2net;
END
Figure A2: An example of a gPROMS model for a transient plug-flow reaction model
showing the details of the BOUNDARY and EQUATION as specified in this work.
The UNIT section allows for different models to be declared in a single
process. This is useful in the simulation of complex plants where each piece
of equipment is declared as a UNIT and coupled in the process simulation. In
the SET section of a process, all parameters are specified. This must be done
182

before a model can be used in a simulation. The set of equations resulting
from the instantiation of the Models declared in the UNIT section is typically
under-determined. This simply means that there are more variables than
equations. The number of degrees of freedom in the simulation activity is
given by:
Number of degrees of freedom (NDOF) = Number of variables - Number
of equations.
For the simulation activity to be fully defined, NDOF variables must be
specified as either constant values or given functions of time. Variables
specified in this way are the input variables of this simulation activity. The
remainder of the variables are the unknown variables, the time variation of
which will be determined by the solution of the system equations. The
specification of input variables is provided in the ASSIGN section of the
PROCESS. The INITIAL section is used to declare the initial condition
information pertaining to a dynamic simulation activity. Solver settings and
output specifications can be controlled in the SOLUTION_PARAMETERS
section. Information on the external manipulations that are to be simulated is
provided in the SCHEDULE section of the PROCESS. These are deliberate
actions which cause a disturbance in the simulation. In our case, the
simulation was allowed to continue for a specified time period. In Figure A3,
the PROCESS entity used in our work is presented.
The parameter estimation and experiment entities
gPROMS can be used to perform Parameter Estimation for complex
models using both dynamic and steady-state experimental data. A maximum
likelihood objective function is used to estimate the parameters1. This
183

Appendix A
function allows for several types of variance models to be specified.
Parameters to be estimated are declared and given initial guesses, lower and
upper bounds. It is also possible to declare parameters to be estimated as fixed
values. All performed experiments which are included in the EXPERIMENT
entity can be chosen in the experiments and measurement tab under the
PARAMETER ESTIMATION entity. At the same time, gPROMS requires
the variances of the measurements to be defined. The constant variance model
was chosen in order to reduce the number of unknown parameters2. Details on
the PARAMETER entity used in our work are presented in Figure A4.
2 T.Van de Vin, Masters Graduation Report, Technische Universiteit Eindhoven
(2007), the Netherlands
184

UNIT M07 as Model4 SET M07.epsg:=0.61; M07.Fv:=1.21e-6; M07.V:=1.51e-6; M07.rocat:=856; M07.NoCompg:=2; M07.NoComps:=3; M07.ReactorLength:=1; M07.SimTime:=200; M07.Axial:=[BFDM,1,100]; M07.a1:=0.46; M07.a2:=0.37; M07.a3:=100; M07.Cco0:=5.84; M07.C2net:=4.95e-4; ASSIGN M07.Cbound(1):=0; M07.Cbound(2):=0; M07.Lbound(1):=0; M07.Lbound(2):=0; M07.Lbound(3):=0; M07.kads:=6.2e-2; M07.kdes:=9.1; M07.kco1:=1.7e-2; M07.kco2:=6.6e-3; M07.ktp1:=5.2e-2; M07.km1:=3e-2; INITIAL FOR x:=0|+ TO M07.ReactorLength DO M07.Cne(x)=0; M07.C_l(1,x)=0; M07.C_l(2,x)=0; M07.L_l(1,x)=0; M07.L_l(2,x)=0; M07.L_l(3,x)=0; M07.C_nl(1,x)=M07.Css(1,x); M07.C_nl(2,x)=M07.Css(2,x); M07.L_nl(1,x)=M07.Lss(1,x); M07.L_nl(2,x)=M07.Lss(2,x); M07.L_nl(3,x)=M07.Lss(3,x); END SOLUTIONPARAMETERS ReportingInterval:=0.5; SCHEDULE CONTINUE FOR M07.SimTime
Figure A3: An example of a gPROMS model for a transient plug-flow reaction model
showing the details of the Process entity as specified in this work.
185

Appendix A
186
Figure A4: A part of the Parameter Estimation entity from a gPROMS model for a
transient plug-flow reaction as specified in this work.

APPENDIX B: Fischer-Tropsch product distribution schemes as
published in the open literature
CH4 C2 C3,4,…n
CO
CO C* C*1 C*2 C*3,4,...nCOCOk *Cik
1*1 Ctk
1** CCgk
2*Ctnk
2** CCgk
nCtnk, ...4,3*
Figure B1. Expanded kinetic scheme depicting pathways to CH4 and C2+
hydrocarbons in the Fischer-Tropsch synthesis (Adapted from Bertole et al. [1,2].
Figure B2. Chain growth model as proposed by Komaya and Bell [3].
187

Appendix B
188
Figure B3.: Chain growth model as proposed by Van Dijk [4].
Figure B4.: Alpha-olefin readsorption model as proposed by Van der Laan and
Beenackers [5].

APPENDIX C: Model equation for the 13CO-labelling of C2+
hydrocarbons for models B & C (see Figures 6.3 and 6.4, Chapter
6).
MODEL B: Two C2 surface intermediates with olefin readsorption
The mole balances for the CO and CH4 in the gas phase, and COads, C and C on the
catalyst surface remain the same as in Model A. The difference is with the
introduction of the second surface intermediate for the C2+ hydrocarbons (Cnn ≥ 2).
The equations for olefin termination and readsorption also remain the same as in
Model A. The termination rate for the paraffins differs and these with the related
expressions for the surface species are presented here.
2''tp2
62''62'' 1C
b
HCHCLk
x
C
t
C [C1]
3'''tp3
83''83''' 1C
b
HCHCLk
x
C
t
C [C2]
The mole balances for the non-labelled gas phase are exactly the same as those
for the fully labelled species. Partially labelled gas phase species are also formed
from partial labelled surface species, as shown in equations [C3] to [C5].
2'tp2
62'62' 1C
b
HCHCLk
x
C
t
C [C3]
3'tp3
83'83' 1C
b
HCHCLk
x
C
t
C [C4]
189

Appendix C
3''tp3
83''83'' 1C
b
HCHCLk
x
C
t
C [C5]
The mole balances for the fully labelled surface species are:
CC'2C''p
42C''re22C''h22C''to2C'C'i
2C''
LLLk
CkLkLkLLkt
L
HC
[C6]
2C''tp22C''h2C''
LkLkt
L
[C7]
CC'3C'''p
63C'''re33C'''h33C'''to32C''C'p
3C'''
LLLk
CkLkLkLLkt
L
HC
[C8]
3C'''tp23C'''h3C'''
LkLkt
L
[C9]
190

The following set of equations is obtained for the partially labelled surface
species:
CC'2C'p42
C're2
2C'h22C'to2C'CiCC'i2C'
LLLkCk
LkLkLLkLLkt
L
HC
[C10]
2C'tp22C'h2C'
LkLkt
L
[C11]
CC'3C'p63C're33C'h3
3C'to32C'Ci2C'Cp2CC'p3C'
LLLkCkLk
LkLLkLLkLLkt
L
HC
[C12]
3C'tp23C'h3C'
LkLkt
L
[C13]
CC'3C''p63
C''re3
3C''h33C''to32C''Cp2C'C'p3C''
LLLkCk
LkLkLLkLLkt
L
HC
[C14]
3C''tp23C''h3C''
LkLkt
L
[C15]
191

Appendix C
MODEL C: Two C2 surface intermediates with direct olefin readsorption
The pathway for olefin readsorption and chain growth is different for this model,
compared to Model B. The termination pathway for the paraffin is the same (see
equations C16 to C20. The mole balances for the CO and CH4, and C2+ hydrocarbons
in the gas phase are the same as in Models A and B respectively.
The mole balances for the fully labelled surface species are:
CC'2C''p
2C''h2r2C''h2f2C''to2C'C'i2C''
LLLk
LkLkLkLLkt
L
[C16]
2C''tp22C''h2r42
C''re22C''h2f2C''
LkLkCkLkt
L
HC
[C17]
CC'3C'''p
3C'''h3r3C'''h3f3C'''to32C''C'p3C'''
LLLk
LkLkLkLLkt
L
[C18]
63C'''re33C'''h2r3C'''tp23C'''h2f
3C'''
HCCkLkLkLk
t
L
[C19]
192

The following set of equations is obtained for the partial labelled surface species:
CC'2C'p2C'h2r
2C'h2f2C'to2C'CiCC'i2C'
LLLkLk
LkLkLLkLLkt
L
[C20]
2C'tp22C'h2r42
C're22C'h2f2C'
LkLkCkLkt
L
HC
[C21]
CC'3C'p3C'h3r
3C'h3f3C'to32C'Cp2CC'p3C'
LLLkLk
LkLkLLkLLkt
L
[C22]
63C're33C'h2r3C'tp23C'h2f
3C'
HCCkLkLkLk
t
L
[C23]
CC'3C''p3C''h3r
3C''h3f3C''to32C''Cp2C'C'p3C''
LLLkLk
LkLkLLkLLkt
L
[C24]
63C''re33C''h2r3C''tp23C''h2f
3C''
HCCkLkLkLk
t
L
[C25]
193

Appendix D
Appendix D: Relationship between reaction mechanisms and isotopic
decay plots from SSITKA data.
During a SSITKA experiment, the isotopic composition of the reactant
changes but the chemical composition of the gas phase and adsorbed layer
remain the same. Therefore, the isotopic transfer can be viewed as a first-order
reaction (assuming mono-labelled species) with respect to the isotopic fraction:
CkN
ij
stii
Ckst
k Zrdt
dZC
1,
kN
ij
stii
kstk Zr
dt
dZ
1. [D1]
and with initial conditions, at t = 0, Zi = Z0.
The right-hand sides of Equations D1 are linear and therefore the solution
can be described as:
N
kki ceAtZ tk
1
[D2]
The form of the isotopic response curves depends on the number of
exponential functions (N) that constitute the spectrum which is equal to the
number of intermediate species in the mechanistic scheme. Furthermore, the
rate of a decrease in the exponents k and amplitude influences N, and
each mechanistic scheme is characterised by a certain ratio between these
parameters.
kA
Mechanistic discrimination can be shown by obtaining corresponding
analytical solutions to the sets of equations. For the simplest mechanistic
schemes (Si denotes the intermediate species), the solutions can be found in
explicit forms as reported by Shannon and Goodwin3. The solutions to the
equations corresponding to mechanistic models 1 to 4 (shown in Figure D1)
3 S.L.Shannon and J.Goodwin, Chem.Rev. 95 (1995) 677-695.
194

have different values of k and . Thus, these models can be discriminated
based on the isotopic response curves (see
kA
Figure D2a).
The logarithmic plots of the isotopic fraction versus time demonstrate the
specific features of the isotopic response curves for the mechanisms in Figure
D1:
If model 1 is true, the logarithmic plot is linear (line 1 in Figure D2b)
If model 2 is true, the corresponding curve has an upward convexity (line 2
in Figure D2b)
If a scheme has a buffer step (model 3) or parallel steps (model 4), then the
curve has a downward convexity (line 3, Figure D2b). Models 3 and 4 can
therefore only be discriminated on the basis of solely numerical data.
Therefore, on the basis of the shapes of the isotopic response curves,
conclusions can be drawn on the reaction mechanism.
A [S1] P A [S1] P[S2]
A [S1] P
[S2]
A
[S1]
[S2]
P
Model 1 Model 2
Model 3 Model 4
A [S1] P A [S1] P[S2]
A [S1] P
[S2]
A
[S1]
[S2]
P
Model 1 Model 2
Model 3 Model 4
Figure D1: Various mechanistic schemes showing possible pathways from reactant A to product P via intermediates S1 and S2.
195

Appendix D
196
0
0.2
0.4
0.6
0.8
1
0 20 40 60
Time [s]
ZB
[-]
1
2
3
-3.0
-2.5
-2.0
-1.5
-1.0
-0.5
0.0
0 10 20 3
Time [s]
Ln
(1 –
ZB)
12
3
a b
0
0
0.2
0.4
0.6
0.8
1
0 20 40 60
Time [s]
ZB
[-]
1
2
3
-3.0
-2.5
-2.0
-1.5
-1.0
-0.5
0.0
0 10 20 3
Time [s]
Ln
(1 –
ZB)
12
3
0
0
0.2
0.4
0.6
0.8
1
0 20 40 60
Time [s]
ZB
[-]
1
2
3
0
0.2
0.4
0.6
0.8
1
0 20 40 60
Time [s]
ZB
[-]
0
0.2
0.4
0.6
0.8
1
0 20 40 60
Time [s]
ZB
[-]
1
2
3
-3.0
-2.5
-2.0
-1.5
-1.0
-0.5
0.0
0 10 20 3
Time [s]
Ln
(1 –
ZB)
12
3
0
-3.0
-2.5
-2.0
-1.5
-1.0
-0.5
0.0
0 10 20 3
Time [s]
Ln
(1 –
ZB)
12
3
a b
0
Figure D2: (a) Calculated isotopic response curves for the mechanistic models presented in Figure D1: (1) Model 1, (2) Model 2, and (3) Models 3 and 4; (b) the same curves in logarithmic coordinates showing the decay in the isotopic fraction.

Acknowledgements
This project turned out to a life changing experience and one that I will
remember and cherish forever. Such an experience was only made possible with
the support of family, friends and colleagues.
I would like to start by thanking the one person who was instrumental in
several aspects of my life, my wife. Ashriti, this thesis is dedicated to you for
all your love and support. Being able to share the experience with our daughter,
Suhina, made the experience even more rewarding.
To all our friends and family back in South Africa, thanks for keeping us
updated and making us feel so welcome during our short visits.
The skill and knowledge of the SCR technicians, Peter, Marlies and Frank
led by Anton, have proven very valuable in getting my experiments started and
then completed with minimum downtime. All of you were friendly from day
one and always willing to help and I thank you for this.
To my students Tim and Sunil for all their assistance in commissioning the
experimental setup and also contributing to the initial development of the
mechanistic models.
To my PhD colleagues, starting with Vinit who caught me wandering in the
hallways on my first day at TU/e and then took me along to the SCR group
meeting. I was not impressed when I was put on the spot to tell the group what
my project was about (having never met my supervisors!). Of course, all that
was soon forgotten when he introduced me to Chaitu and convinced me to play
cricket for PSV Tegenbosch. The friendships I’ve made since then are still
standing the test of time (and distance). Vishwa and Vinayak, a special thanks
to you for making time for me during my quick visits to Eindhoven, especially
in recent times when not many familiar faces were around. To my SCR
197

Acknowledgements
roommates, Maurice and Halabi, thanks for the great technical discussions and
also the entertainment during lunch. To the rest of the gang (Patrick, Stijn,
Niek, Oki, Chattarbir, Jovan, Joost, Charl, Roman, Marco, Bianca, Narendra),
thank you for fun conversations either during coffee breaks or Fort. Also,
thanks to Michiel and Carlos for all the relaxing conversations about football
and also for good laughs in the lab. I would also like to thanks Ionel and
Sorinela for the wonderful dinners as well as Denzil and Prabashni for sharing
in the Dutch experience and also for reminiscing about life back home.
To the other SCR colleagues, thanks for all your support. A special thanks to
Xander Nijhuis for entertaining us on our trip to New Orleans. Who will ever
forget “manager happy hour”? It was also a pleasure working with Elena and
yourself on the propene epoxidation project.
I also want to thank SCR secretary, Denise. You are simply brilliant and the
most efficient secretary I’ve ever known. Thanks for sorting all my
documentation.
To Professor Hans Niemantsverdriet and Professor Rutger van Santen for
useful technical discussions.
In terms of compiling the final thesis, a few people played a critical role. I
would like to start with the promoter of this thesis, Professor Jaap Schouten
firstly for his patience and support. Thanks for allowing me the extra time to
write when I returned to South Africa to work at Sasol. It has been an honour to
work with you. I was always impressed by your detailed comments – it still
amazes me how you manage to spot the extra spaces between words!
To my daily supervisor, Dr Mart de Croon for just being brilliant and
challenging me throughout the project. Your competency in mathematics was
frightening at times, especially when I took weeks to solves PDE’s in gPROMS
and you did a few whilst relaxing in the bath or whilst on the bus. I have to
198

199
admit that this has reignited my passion for maths and I thank you for this –
though that does not mean you can ask me to solve Laplace equations by hand.
My supervisors from Sasol, Dr Gideon Botes and Dr Berthold Breman
who initiated this project with TU/e and remained interested in its development
all the way. Our telecons always proved to be an eye-opener and your hard but
fair and constructive criticism helped my understanding of this work but most
of all contributed to my development as an engineering scientist. I have utmost
respect for you and hope we can work closely together in the future. A special
thank you to my Sasol colleague Toine Cents for visiting me at TU/e and
participating in our telecons. I also want to thank Dr Gideon Botes for spending
hours of his spare time with the cover design. I also appreciate all the ingenious
ideas and tricks you came up with in Photoshop.
To Philip Gibson for offering me the opportunity to do this project, for all
his support and guidance and also for his entertaining visits. We always felt like
Sasol employees when you were around.
Lastly, together with my fellow colleagues involved in this project, we would
like to thank mainly Sasol for financial support but also the NWO for funding
during the first year of the project.

200

List of Publications
Publications
1. N.S. Govender, M.H.J.M. de Croon, J.C. Schouten, Reactivity of
surface carbonaceous intermediates on an iron-based Fischer-
Tropsch catalyst, Appl. Catal. A, 373(1-2), 81-89, (2010)
2. T.A. Nijhuis, E. Sacaliuc-Parvulescu, N.S. Govender, J.C. Schouten,
B.M. Weckhuysen, The role of support oxygen in the epoxidation of
propene over gold-titania catalysts investigated by isotopic transient
kinetics, J. Catal., 265(-), 161-169, (2009)
3. N.S. Govender, F.G. Botes, M.H.J.M. de Croon, J.C. Schouten,
Mechanistic pathway for methane formation over an iron-based
catalyst, J. Catal., 260(-), 254-261, (2008)
4. Botes, F.G.; Govender, N.S. Secondary reactions of ethylene as
studied in a laboratory-scale recycle slurry reactor, Energy & Fuels,
21, 3095 (2007).
5. Govender, N.S., Van Vuuren, M.J., Claeys, M., & Van Steen, E.,
Importance of the usage ratio in iron-based Fischer-Tropsch synthesis
with recycle, IECR 45(25), 8629-8633, (2006).
6. Van Vuuren, M.J., Govender, N.S., Kotze, R., Masters, G.J., & Pete,
T.P., The correlation between double bond isomerization, water gas
shift and acid production during Fischer-Tropsch synthesis. Am.
Chem. Soc., Div. Petr. Chem., Preprints, 50(2), 200-202, (2005).
201

List of Publication
202
Oral and Poster presentations
Refereed proceedings
1. N.S. Govender, M.H.J.M. de Croon, J.C. Schouten, Modelling the C2+
hydrocarbons during the Fischer-Tropsch Synthesis using transient
kinetics, in Proc. 21st North American Catalysis Society Meeting
(NAM); San Francisco, CA, United States, PW23, (2009)
2. N.S. Govender, M.H.J.M. de Croon, J.C. Schouten, Mechanistic study
of the Fischer-Tropsch synthesis using transient kinetics, in Proc.
235th ACS National Meeting; Editors: -, New Orleans, LA, United
States, 231a, (2008)
3. N.S. Govender, M.H.J.M. de Croon, J.C. Schouten, Mechanistic study
of the Fischer-Tropsch synthesis using transient kinetics, in Proc. 14th
Int. Congress on Catalysis; Editors: -, Seoul, Korea, Republic of,
OD54, p. 143, (2008)
4. N.S. Govender, M.H.J.M. de Croon, J.C. Schouten, Mechanistic study
of the Fischer-Tropsch synthesis using transient kinetics, in Proc. 20st
Int. Symp. on Chemical Reaction Engineering (ISCRE-20); Kyoto,
Japan, pp. 268-269, (2008)
Non-refereed proceedings
1. N.S. Govender, M.H.J.M. de Croon, J.C. Schouten, Mechanistic study
of the High Temperature Fischer-Tropsch (HTFT) process on an Fe-
based catalyst using Steady-State Isotopic Kinetic Analysis (SSITKA),
in Book of Abstracts Netherlands' Catalysis & Chemistry Conference;
Editors: -, Noordwijkerhout, Netherlands, P50, page 202, (2007)

About the author
Nilenindran Sundra Govender (Gregory)
was born in Durban, South Africa on 18 July
1975. In 1993, he matriculated from Umzinto
Secondary School in the lower south coast of
Kwazulu Natal. He initially registered for
Chemical Engineering at University of
Kwazulu-Natal in 1994 but later graduated
with a Bachelors degree (B.Sc.) in Chemistry and Applied mathematics in
1999. In 2000, he obtained his National Diploma (Chemical Engineering)
from ML Sultan Technikon in Durban. Gregory was employed by Sasol
in March 2001 and started work on the preparation of iron precipitated
catalysts. He continued his studies via correspondence and in 2004
obtained in B.Sc. Honors Degree in Chemistry from the University of
South Africa. In the same year, he registered for the Taught Masters in
Catalysis at the University of Cape Town and a year later graduated with
Professor Eric van Steen with a thesis entitled “Recycling the tail-gas
during the Low Temperature Fischer-Tropsch Process”. In June 2005,
Sasol seconded him to the Eindhoven University of Technology (TU/e) to
start his PhD project in the group of Professor Jaap Schouten. The results
of this project are presented in this dissertation.