mechanistic ivivc using the simcyp adam model -...
TRANSCRIPT

Mechanistic IVIVC Using the Simcyp ADAM
Model
Make SCIENCE out of IVIVC
© Copyright 2012 Certara, L.P. All rights reserved.
IVIVC and Its Components
0
50
100
150
-6 4 14 24
Pla
sm
a C
on
c
(ng
/mL
)
Time (h)
Formulation PK
0
20
40
60
80
100
0.0 4.0 8.0 12.0
%D
isso
lved
/Ab
so
rbe
d
Time (h)
In vivo Absorption/Dissolution
020406080
100
0.0 4.0 8.0 12.0
%D
isso
lved
Time (h)
In vitro Dissolution
y = 0.9941x R² = 0.9703
0
50
100
0 50 100
in v
ivo
%
Dis
so
lved
/Ab
so
rbed
in vitro % Dissolved
IVIVR
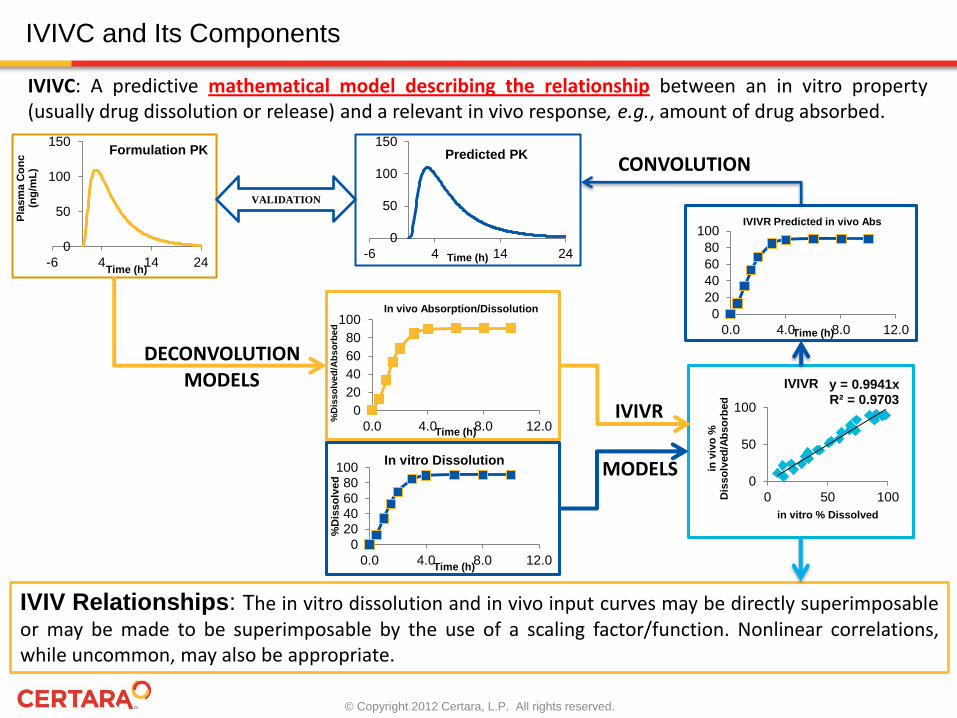
IVIVC: A predictive mathematical model describing the relationship between an in vitro property (usually drug dissolution or release) and a relevant in vivo response, e.g., amount of drug absorbed.
DECONVOLUTION
IVIV Relationships: The in vitro dissolution and in vivo input curves may be directly superimposable or may be made to be superimposable by the use of a scaling factor/function. Nonlinear correlations, while uncommon, may also be appropriate.
IVIVR
MODELS
MODELS
0
20
40
60
80
100
0.0 4.0 8.0 12.0Time (h)
IVIVR Predicted in vivo Abs
0
50
100
150
-6 4 14 24Time (h)
Predicted PK CONVOLUTION
VALIDATION
© Copyright 2012 Certara, L.P. All rights reserved.
IVIVC Components: Deconvolution Methods
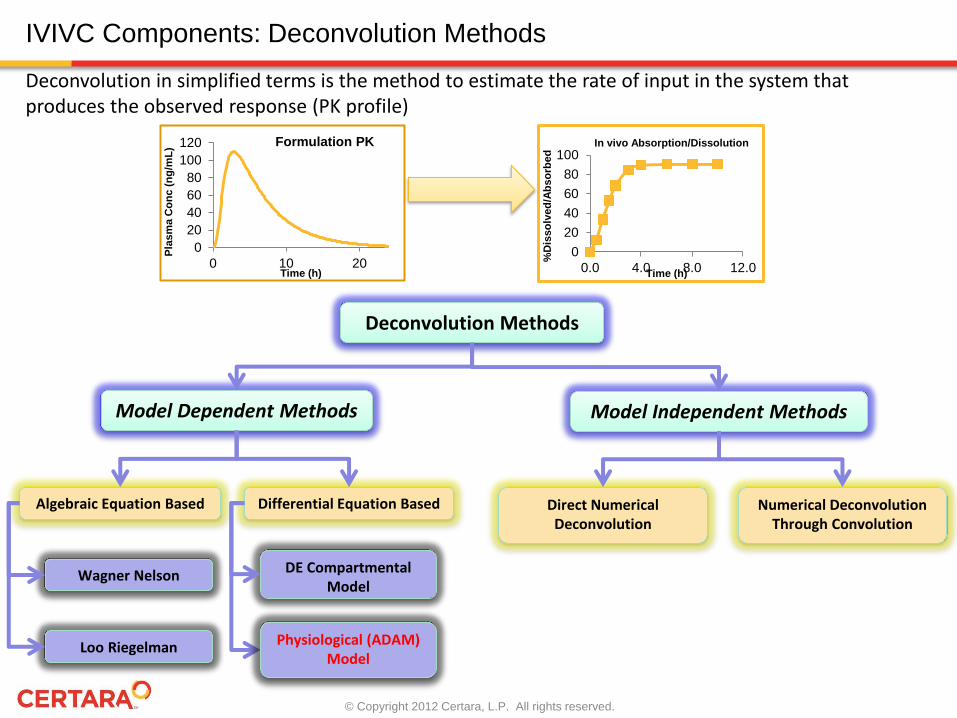
Deconvolution Methods
Model Dependent Methods Model Independent Methods
Wagner Nelson
Algebraic Equation Based Differential Equation Based
Loo Riegelman
DE Compartmental Model
Physiological (ADAM) Model
Direct Numerical Deconvolution
Numerical Deconvolution Through Convolution
Deconvolution in simplified terms is the method to estimate the rate of input in the system that produces the observed response (PK profile)
0
20
40
60
80
100
120
0 10 20
Pla
sm
a C
on
c (
ng
/mL
)
Time (h)
Formulation PK
0
20
40
60
80
100
0.0 4.0 8.0 12.0
%D
isso
lved
/Ab
so
rbed
Time (h)
In vivo Absorption/Dissolution

© Copyright 2012 Certara, L.P. All rights reserved.
Deconvolution: Mechanistic ADAM Model
in vivo dissolution is deconvoluted separately from GIT transit, permeation, gut wall
metabolism and first pass liver extraction
P-gp etc
Metabolism
Enterocytes
Faeces
Dissolved Drug
Absorption / Efflux
Degradation
Colon Jejunum I & II Duodenum Ileum I Ileum II Ileum III Ileum IV Stomach
Solid Dosage
PBPK DISTRIBUTION
MODEL LIVER Portal Vein
Dissolution

© Copyright 2012 Certara, L.P. All rights reserved.
Mechanistic vs. Conventional IVIVC
CR BCS I OR BCS II Low Extraction CR BCS I OR BCS II High Extraction
CR BCS III OR BCS IV Low Extraction CR BCS III OR BCS IV High Extraction
Differing Permeation/Metabolism in GIT Drugs with Enterohepatic Recirculation
In vivo In vitro Conventional Deconvolution
In vivo In vitro Conventional Deconvolution
In vivo In vitro Conventional Deconvolution
In vivo In vitro Conventional Deconvolution
In vivo In vitro Conventional Deconvolution In vivo In vitro Conventional
Deconvolution
Dissolution Permeation Systemic Input

© Copyright 2012 Certara, L.P. All rights reserved.
• Metoprolol is a BCS Class I (High Solubility High Permeability) High First Pass Extraction Drug
ER BCS I OR BCS II High Extraction
In vivo In vitro Conventional Deconvolution
Conventional methods may require IVIVR function with lag time, sigmoid or power function to accommodate delay and slowness of in vivo availability as compared to in vitro conditions
• Relatively short half life and sufficient absorption from colon makes it suitable candidate for extended release formulation
• ER formulations of BCS Class I drug are Dissolution/Release Controlled Absorption
Mechanistic IVIVC Case Study Using Simcyp

© Copyright 2012 Certara, L.P. All rights reserved.
Reported Model 1: Functional Numerical Deconvolution with Oral Solution as UIR
• The IVIVR was sigmoid or with lag time. • FRA -> FRD graphs shown here used all three formulation data to establish IVIVC. No
graphs are shown when one of the formulations is used as external
In vitro In vivo
In vitro in vivo relationship
USP II, pH 6.8, 50 RPM USP II, pH 6.8, 150 RPM
Eddington et al. (1998) Pharm Res 15(3), 466
Mechanistic IVIVC Case Study: Metoprolol IVIVC

© Copyright 2012 Certara, L.P. All rights reserved.
Reported Model 2: Semi Mechanistic Parent/Metabolite Model
USP II, pH 6.8, 150 RPM In vivo Parent and Metabolite Data
In vitro in vivo relationship
Sirisuth and Eddington (2002) EJPS 53, 301
In spite of using parent and metabolite data and lag time IVIVR, prediction errors were higher. No graphs or results are shown when one of the formulations is used as external
Mechanistic IVIVC Case Study Using Simcyp

© Copyright 2012 Certara, L.P. All rights reserved.
Slow and Fast Formulations Used for IVIVC and Medium as External
Deconvolution of in vivo dissolution rather than input rate allowed the establishment of IVIV Relationship without lag time and superior correlation (R2=0.98).
y = 0.8684x R² = 0.9675
y = 0.0021x2 + 0.6925x R² = 0.9782
0
20
40
60
80
100
120
0 50 100 150
%D
isso
lved
in v
ivo
% Dissolved in vitro
Linear IVIVC without Lag
Decon
Linear (Decon)
Poly. (Decon)
y = 0.9941x R² = 0.9703
-20
0
20
40
60
80
100
120
-20 0 20 40 60 80 100 120
Dec
on
vo
lute
d i
n v
ivo
%
Dis
so
lve
d
IVIVR Predicted in vivo % Dissolved
IVIVR Predictivity
• PK Data after oral solution were used to estimate permeability, distribution and elimination parameters
• in vivo dissolution profiles that produce observed PK profiles of each formulation were estimated
Mechanistic IVIVC Case Study Using Simcyp

© Copyright 2012 Certara, L.P. All rights reserved.
Understanding Bio-relevance of dissolution media
• Using two extremes (fast and slow) to develop model and test the model for medium also conforms to the idea of domain of applicability
0102030405060708090
100
0.0 5.0 10.0 15.0
%D
isso
lved
Time (h)
Fast Release Formulation
In vitro Decon
0
20
40
60
80
100
0.0 5.0 10.0 15.0
Time (h)
Medium Release Formulation
In vitro Decon
0
20
40
60
80
100
0.0 5.0 10.0 15.0
Time (h)
Slow Release Formulation
In vitro Decon
• The in vitro dissolution media used is more bio-relevant to medium release formulation but not for the fast and slow release formulations
• Thus, Medium and Fast/Slow release formulations based IVIVC will lead to very good statistics (R2) however confidence in prediction for new formulation beyond used range is questionable
Mechanistic IVIVC Case Study Using Simcyp
© Copyright 2012 Certara, L.P. All rights reserved.
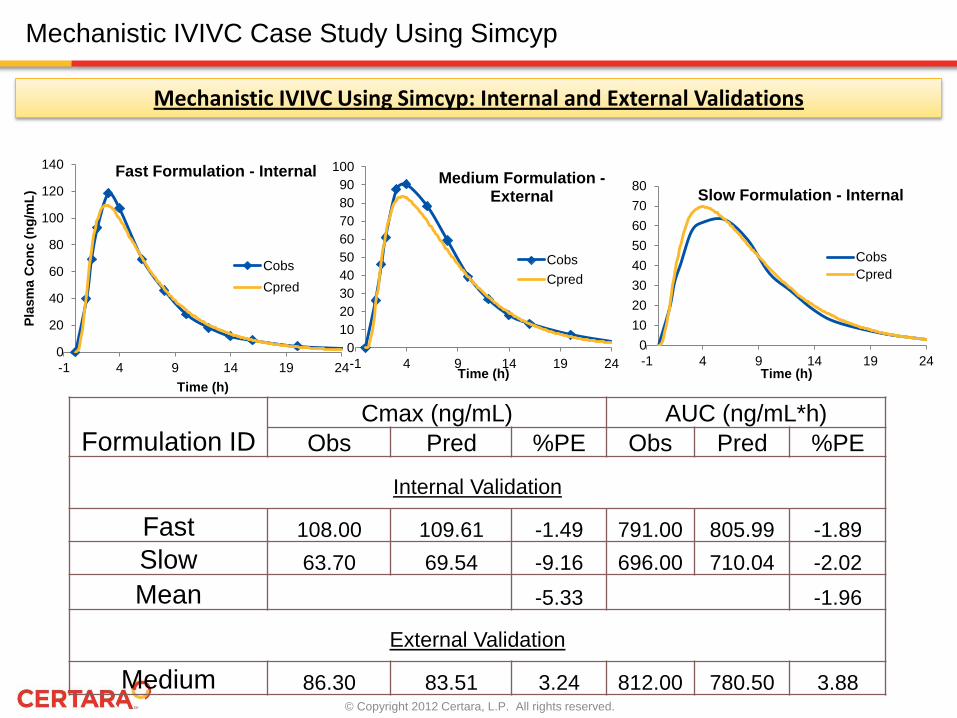
Mechanistic IVIVC Using Simcyp: Internal and External Validations
0
20
40
60
80
100
120
140
-1 4 9 14 19 24
Pla
sm
a C
on
c (
ng
/mL
)
Time (h)
Fast Formulation - Internal
Cobs
Cpred
0
10
20
30
40
50
60
70
80
90
100
-1 4 9 14 19 24Time (h)
Medium Formulation - External
Cobs
Cpred
0
10
20
30
40
50
60
70
80
-1 4 9 14 19 24Time (h)
Slow Formulation - Internal
Cobs
Cpred
Formulation ID Cmax (ng/mL) AUC (ng/mL*h)
Obs Pred %PE Obs Pred %PE
Internal Validation
Fast 108.00 109.61 -1.49 791.00 805.99 -1.89
Slow 63.70 69.54 -9.16 696.00 710.04 -2.02
Mean -5.33 -1.96
External Validation
Medium 86.30 83.51 3.24 812.00 780.50 3.88
Mechanistic IVIVC Case Study Using Simcyp

© Copyright 2012 Certara, L.P. All rights reserved.
Designing a new once-daily formulation of Metoprolol
Fast Formulation Medium
Formulation
Slow
Formulation
Time (h) Cp (ng/mL) Cp Cp
0 0 0 0 1.0 39.61 26.16 18.55 1.5 69.30 46.13 31.71 2.0 92.84 60.91 40.50 3.0 118.68 87.56 56.94 4.0 107.25 90.39 61.71 6.0 69.16 78.23 63.00 8.0 45.98 59.26 53.11
10.0 28.14 39.16 36.24 12.0 18.08 26.83 26.99 14.0 11.91 17.91 17.26 16.0 8.66 13.20 11.58 20.0 4.27 7.19 5.89 24.0 2.79 3.76 2.95
How can you use Simcyp to design new once-daily (24 h)
formulation?
Therapeutic Cp range of metoprolol is 20-100 ng/mL
• All three formulations lead to Cp below 20 ng/mL after 12 h
• Thus they require administration every 12 h (twice daily)
• The Fast formulation leads to Cp beyond maximum tolerable Cp (100 ng/mL)
Mechanistic IVIVC Case Study Using Simcyp
© Copyright 2012 Certara, L.P. All rights reserved.
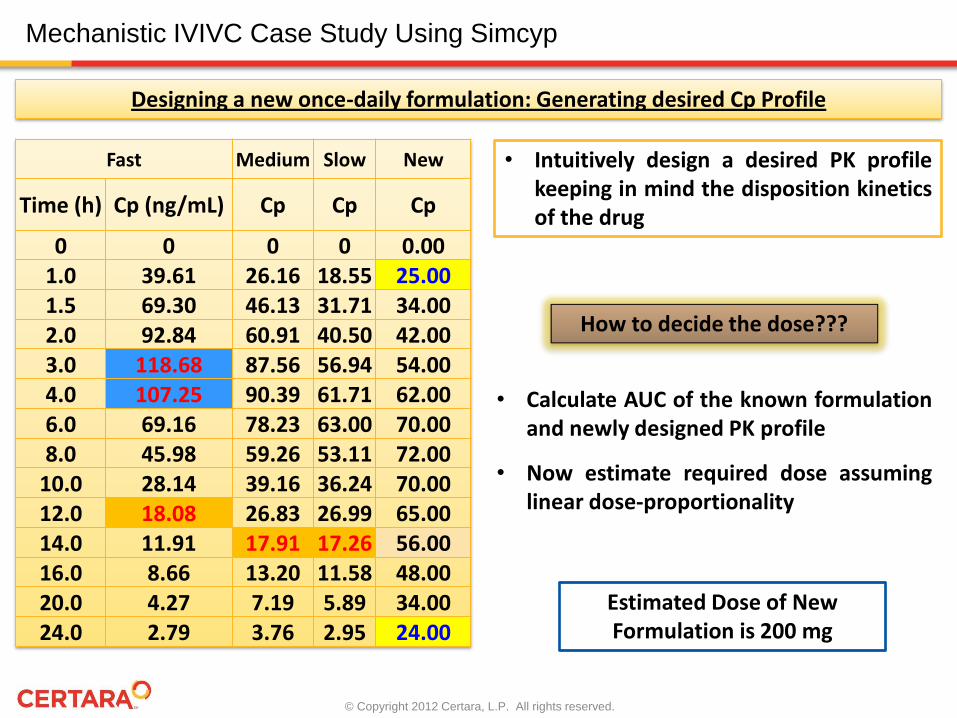
Designing a new once-daily formulation: Generating desired Cp Profile
Fast Medium Slow New
Time (h) Cp (ng/mL) Cp Cp Cp
0 0 0 0 0.00 1.0 39.61 26.16 18.55 25.00 1.5 69.30 46.13 31.71 34.00 2.0 92.84 60.91 40.50 42.00 3.0 118.68 87.56 56.94 54.00 4.0 107.25 90.39 61.71 62.00 6.0 69.16 78.23 63.00 70.00 8.0 45.98 59.26 53.11 72.00
10.0 28.14 39.16 36.24 70.00 12.0 18.08 26.83 26.99 65.00 14.0 11.91 17.91 17.26 56.00 16.0 8.66 13.20 11.58 48.00 20.0 4.27 7.19 5.89 34.00 24.0 2.79 3.76 2.95 24.00
How to decide the dose???
• Intuitively design a desired PK profile keeping in mind the disposition kinetics of the drug
• Calculate AUC of the known formulation and newly designed PK profile
• Now estimate required dose assuming linear dose-proportionality
Estimated Dose of New Formulation is 200 mg
Mechanistic IVIVC Case Study Using Simcyp

© Copyright 2012 Certara, L.P. All rights reserved.
Designing a new once-daily formulation: Optimising dose to get desired Cp Profile
How much is the desired dose???
• Use disposition parameters obtained previously in IVIVC exercise and estimate required dissolution profile to obtain desired Cp profile
• The best fit was able to achieve desired absorption phase but not the disposition
• This indicates that amount of drug is not sufficient to maintain desired Cp until 24 h
• More dose should be administered to achieve desired total exposure
0.000
10.000
20.000
30.000
40.000
50.000
60.000
70.000
80.000
0.0 5.0 10.0 15.0 20.0 25.0 30.0
Su
b P
lasm
a (
(ng
/mL
))
Time (Hours)
'Subject: 1': Predicted and observed values
Observe IPRED
Mechanistic IVIVC Case Study Using Simcyp

© Copyright 2012 Certara, L.P. All rights reserved.
Designing a new formulation : Optimise the desired dose to achieve desired Cp profile
0.000
10.000
20.000
30.000
40.000
50.000
60.000
70.000
80.000
0.0 5.0 10.0 15.0 20.0 25.0 30.0
Su
b P
lasm
a (
(ng
/mL
))
Time (Hours)
'Subject: 1': Predicted and observed values
Observe IPRED
Formulation AUC Dose No 0 0
Solution 346 50 Fast 791 100
Medium 812 100 Slow 696 100 New 1181 250
0
100
200
300
0 500 1000 1500D
ose (
mg
)
AUC
Estimated Dose
The dose - AUC relationship is not linear
The dose required to achieve the desired Cp profile is 250 mg Now predict the required in vivo dissolution to achieve desired Cp profile
Mechanistic IVIVC Case Study Using Simcyp

© Copyright 2012 Certara, L.P. All rights reserved.
0.000
10.000
20.000
30.000
40.000
50.000
60.000
70.000
80.000
0.0 5.0 10.0 15.0 20.0 25.0 30.0
Su
b P
lasm
a (
(ng
/mL
))
Time (Hours)
Desired and Predicted Cp Profiles
Observe IPRED
0.00
20.00
40.00
60.00
80.00
100.00
120.00
0 4 8 12 16 20 24
Dis
so
luti
on
Mean
(%
)
Time (h)
Required in vivo dissolution Profile
Time %Dissolved 0 0.00 1 6.29 2 8.98 4 16.31 6 23.33 8 30.40 12 46.36 16 63.69 24 99.89
• This is the required in vivo dissolution profile
• Use the established and validated IVIVC to obtain required in vitro dissolution profile from estimated in vivo dissolution profile
Designing a new formulation: Estimate required dissolution profile to achieve desired Cp profile
Mechanistic IVIVC Case Study Using Simcyp

© Copyright 2012 Certara, L.P. All rights reserved.
Designing a new formulation: Assessing the population variability of designed formulation
In none of the trials, Cp has exceeded MTC (100 ng/mL) and maintained Cp of more than MEC (20 ng/mL)
0
20
40
60
80
100
120
0 6 12 18 24 30
Syste
mic
Co
nc
en
trati
on
(n
g/m
L)
Time (h)
Mean Values of Systemic concentration in plasma of Sim-Metoprolol over Time
CSys - Trial 1 CSys - Trial 2 CSys - Trial 3 CSys - Trial 4
CSys - Trial 5 CSys - Trial 6 CSys - Trial 7 CSys - Trial 8
CSys - Trial 9 CSys - Trial 10 CSys Mean
• Simulation trials 10X10 with healthy volunteers aged 20-50
Mechanistic IVIVC Case Study Using Simcyp

© Copyright 2012 Certara, L.P. All rights reserved.
Designing a new formulation: Assessing the steady state performance of designed formulation
At steady state, Cp level was maintained within the therapeutic range of metoprolol.
• Simulated PK profile in healthy volunteers aged 20-50 for 7 days
67.93
26.84
79.73
25.16
79.07
27.96
80.90
28.54
77.86
27.23
81.15
0.00E+00
1.00E+01
2.00E+01
3.00E+01
4.00E+01
5.00E+01
6.00E+01
7.00E+01
8.00E+01
9.00E+01
0 24 48 72 96 120 144
Syste
mic
Co
ncen
trati
on
(n
g/m
L)
Time (h)
Mean Values of Systemic concentration in plasma of Sim-Metoprolol over Time
CSys
Mechanistic IVIVC Case Study Using Simcyp

© Copyright 2012 Certara, L.P. All rights reserved.
• Simcyp can also help to evaluate performance of this new formulation in elderly, paediatric and specific age groups
• Performance on various disease groups, ethnicity, etc. can be studied using Simcyp
• Metabolic DDIs could be evaluated for the designed formulation
• The simulated PK profiles could be linked to pharmacodynamics models to estimate and understand the efficacy of the designed formulation
Mechanistic IVIVC Case Study Using Simcyp

© Copyright 2012 Certara, L.P. All rights reserved.
THANK YOU

© Copyright 2012 Certara, L.P. All rights reserved.
Differing Permeation/Metabolism
In vitro
Conventional Deconvolution
Advantages of Mechanistic IVIVC
Mechanistic Deconvolution
In vitro
In v
ivo
Simple IVIVC Function
In v
ivo
Complex IVIVC Function
In vitro
Simple IVIVRs are
important during
formulation optimisation

© Copyright 2012 Certara, L.P. All rights reserved.
IVIVC and BCS Classes
BCS
Class
Solubility Permeability Controlling
Factor
IVIVC Expectation for IR
Formulations
Class I High High Gastric Emptying IVIVC expected, if dissolution rate is slower than gastric emptying rate
Class II Low High Dissolution/Sol IVIVC expected
Class III High Low Permeability Permeability is rate determining and limited or no IVIVC with dissolution
Class IV Low Low Diss/Sol/Perm Limited or no IVIVC is expected
Chilukuri et al. (2007) Pharmaceutical Product Development: In vitro in vivo correlation
IVIVC is expected and is used to obtain ‘Biowaiver’ for CR/ER products of Class I drugs as the release/dissolution becomes the rate limiting step
Mechanistic IVIVC models are useful for class III/IV drugs as they distinguish dissolution, GI transit and permeation processes and avoids confounding
IVIVC for drugs with nonlinearity in Fg, Fa and systemic clearance can not be modelled using conventional methods but can be effectively modelled using mechanistic models

© Copyright 2012 Certara, L.P. All rights reserved.
Why IVIVC?
• Current Simcyp Implementation: Predict PK profile of Oral formulation from in vitro dissolution, Peff and disposition parameters
Dissolution Time 0 1 2 3 4 5
%Diss 0 25 50 75 100 100
Interpolation
t
%D
ADAM + PBPK
Parameters
t
Cp
Assumption: in vitro dissolution == in vivo dissolution
In vitro Predicted
• In vitro dissolution profiles vary depending on the media, type of formulation and
other experimental conditions used.
• If validated relationship between in vitro and in vivo dissolution (IVIVC) is
obtained, it could be used to effectively predict PK(/PD) profiles new formulations

© Copyright 2012 Certara, L.P. All rights reserved.
Why IVIVC
Dissolution Time 0 1 2 3 4 5
%Diss 0 25 50 75 100 100
Interpolation
t
ADAM + PBPK
Parameters
t
Cp
In vitro Predicted
t
%D
In vivo
IVIVC
What IVIVC Relationship to use and How to Establish/Validate it?

© Copyright 2012 Certara, L.P. All rights reserved.
IVIVC and Its Components
0
50
100
150
-6 4 14 24
Pla
sm
a C
on
c
(ng
/mL
)
Time (h)
Formulation PK
0
20
40
60
80
100
0.0 4.0 8.0 12.0
%D
isso
lved
/Ab
so
rbe
d
Time (h)
In vivo Absorption/Dissolution
020406080
100
0.0 4.0 8.0 12.0
%D
isso
lved
Time (h)
In vitro Dissolution
y = 0.9941x R² = 0.9703
0
50
100
0 50 100
in v
ivo
%
Dis
so
lved
/Ab
so
rbed
in vitro % Dissolved
IVIVR
IVIVC: A predictive mathematical model describing the relationship between an in vitro property (usually drug dissolution or release) and a relevant in vivo response, e.g., amount of drug absorbed/dissolved.
DECONVOLUTION
IVIVC: The in vitro dissolution and in vivo input curves may be directly superimposable or may be made to be superimposable by the use of a scaling factor/function. Nonlinear correlations, while uncommon, may also be appropriate.
IVIVC
MODELS
MODELS
0
20
40
60
80
100
0.0 4.0 8.0 12.0Time (h)
IVIVR Predicted in vivo Abs
0
50
100
150
-6 4 14 24Time (h)
Predicted PK CONVOLUTION
Validation: External validation is recommended when only 2 formulations are used to establish IVIVC
VALIDATION

© Copyright 2012 Certara, L.P. All rights reserved.
Simcyp IVIVC – Two Stage
%D
STAGE 1
ADAM + PBPK
Parameters
t
Cp
In vivo
%D
In vitro Input
Discrete Data
Time 0 1 2 3 4 5
%Diss 0 25 50 75 100 100
Vivo
%D
IVIVC
Vitro %D
Observed
STAGE 2
Establish IVIVC
In vitro

© Copyright 2012 Certara, L.P. All rights reserved.
Single Stage IVIVC
In vitro
Dissolution
Time 0 1 2 3 4 5
%Diss 0 25 50 75 100 100
Interpolation
ADAM + PBPK
Parameters
In vitro
IVIVC
Predicted
In vivo IVIVC Function
And Initial
Parameters
IVIVC
Predicted
Observed
Iteratively estimate IVIVC Function Parameters
Which give best fit of predicted PK profile
to the observed PK Profile