conventional versus physiologically-based (pb)-ivivc ... · conventional versus...
TRANSCRIPT

Conventional versus Physiologically-Based (PB)-IVIVC:
Revisiting Some Successful and Failed Conventional
IVIVC Cases with PB-IVIVC
Nikunj Patel, Senior Research Scientist
Simcyp (a Certara Company)
AAPS Annual Meeting, 4th November 2014

© Copyright 2014 Certara, L.P. All rights reserved.
0
20
40
60
80
100
0 20 40 60 80 100
in v
ivo
% D
isso
lved
in vitro % Dissolved
How to Develop IVIVC?
http://chem4520.wikispaces.com/Absorption+(Laura)

© Copyright 2014 Certara, L.P. All rights reserved.
What is Deconvolution?
Response Input System behaviour
If you know R and S, you can find I
Input is the rate of release/dissolution from administered formulation
System behaviour is how the human body processes the drug (Disposition)
Response is the result (Plasma Concentration-time profile) of what happens
(system behaviour) to the drug after a particular input (formulation) is given to
the system
What you deconvolute and its quality depends on how you define the system and parameterise it
*

© Copyright 2014 Certara, L.P. All rights reserved.
Deconvolution: Limitations of Conventional Methods
Wagner-Nelson and Loo-Riegelman Methods
• Assumes human body (system) as one or two compartments
• Cannot be used for nonlinear elimination
• Deconvolutes systemic input rate which is a composite function of dissolution + GI Transit + Permeation + First Pass
Numerical Methods
• No physiological assumptions but mathematical assumptions: input site is the same for all formulations and input rate is constant (infusion) between two time points
• Depending on the UIR used, it deconvolutes a composite function of dissolution + GI Transit + Permeation + First Pass
Systemic Circulation
Elimination Rate
Input Rate
Distribution
Langenbucher (2003) EJPB 56(3), 429

© Copyright 2014 Certara, L.P. All rights reserved.
SOLID DOSAGE
DISSOLVED DRUG GUT WALL
Mechanistic Deconvolution: e.g. ADAM Model
in vivo dissolution is
deconvoluted separately
from GIT transit,
permeation, gut wall
metabolism and first pass
liver extraction
Gastric
Emptying
Luminal
Transit
LIVER PBPK DISTRIBUTION
MODEL Portal Vein
Dissolution
Absorption
Efflux/Influx
Metabolism
Degradation

© Copyright 2014 Certara, L.P. All rights reserved.
In vitro
Conventional Deconvolution
Advantages of Physiologically-based IVIVCs
Mechanistic Deconvolution
In vitro
In v
ivo
Simple IVIVC Function
In v
ivo
Complex IVIVC Function
In vitro
Simple IVIVCs are easy-
to-interpret and
important during
formulation optimisation
Dissolution Permeation Systemic Input
© Copyright 2014 Certara, L.P. All rights reserved.
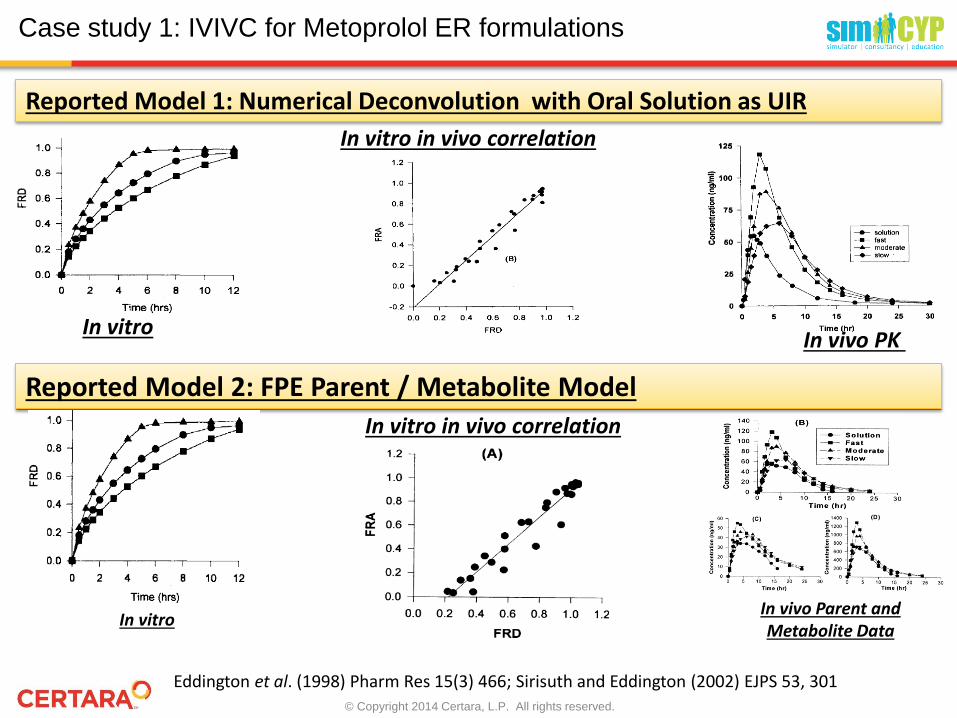
Case study 1: IVIVC for Metoprolol ER formulations
Reported Model 1: Numerical Deconvolution with Oral Solution as UIR
In vitro In vivo PK
In vitro in vivo correlation
Eddington et al. (1998) Pharm Res 15(3) 466; Sirisuth and Eddington (2002) EJPS 53, 301
Reported Model 2: FPE Parent / Metabolite Model
In vitro In vivo Parent and Metabolite Data
In vitro in vivo correlation

© Copyright 2014 Certara, L.P. All rights reserved.
Two-Stage Sequential Approach using Linear IVIVC
Patel et al. 2014 9th W PBP meeting, Lisbon

© Copyright 2014 Certara, L.P. All rights reserved.
Deconvolution methods comparison
9
ND method deconvolutes fraction absorbed (Fa(t)) rather than fraction dissolved (Fdiss(t)) even when oral solution is used as UIR whereas PB method deconvolutes all processes involved in absorption – Fdiss(t), Fa(t), Fpv(t) and F(t)

© Copyright 2014 Certara, L.P. All rights reserved.
Why fast release formulation not deconvoluted well with ND?
10
Gastric emtying controls significant proportion of absorption profile region for Fast formulation

© Copyright 2014 Certara, L.P. All rights reserved.
Physiologically Based Deconvolution at a Population Level
• Exploratory analysis of the individual subject PK data of the Metoprolol
oral formulations indicated significant BS and WS variability
• PBPK to identify sources of variability
– Given the small duration of the clinical study, only BS variability and
assumed the WS variability in disposition parameters to be negligible.
– WS as well as BS variability in dissolution and GI transit was
considered
UIR Characterisation
Deconvolution with WS and BS variability included
In vivo release/dissolution from Medium formulation is more variable which corresponds to partial AUC analysis of PK profiles
Poster Number M1328 – B Mistry et al, AAPS AM, 2014

© Copyright 2014 Certara, L.P. All rights reserved.
Physiologically Based Deconvolution at a Population Level
Assuming individual subject GI Transit (GET) is equal to Pop. Mean
Considering WS and BS variability in GI Transit (GET) for population
Poster Number M1328 – B Mistry et al, AAPS AM, 2014

© Copyright 2014 Certara, L.P. All rights reserved.
Case Study 2: Diltiazem (BCS I, BDDCS II) CR products
• Complexities involved
Gut-wall metabolism (formulation-dependent non-linearity)
Auto-inhibition of CYP3A4 by DTZ and its metabolite
Sirisuth et al, 2002 Biopharm Drug Dispos
Formulation %PE in AUC %PE in Cmax
PB ND* PB ND*
Fast 8.33 94 8.63 77.8
Medium -1.04 57.2 12.31 75.9
Slow -13.65 47.5 -5.05 65.9
AAPE (%) 7.68 66.3 8.66 73.2
Type of IVIVC Linear (PB) and Non-linear (ND)
* When all 3 formulations were used for IVIVC development.

© Copyright 2014 Certara, L.P. All rights reserved.
Diltiazem IVIVC: Analysis of Results
14

© Copyright 2014 Certara, L.P. All rights reserved.
Diltiazem: Considering auto-inhibition
• Is auto-inhibition clinically significant?
Tsao et al. 1990 “DTZ half-life was 50-100% higher after MD than SD”
Abernethy & Montamat 1987 Rowland Yeo et al 2010
Is an IVIVC or bio-equivalence established based upon a single dose valid at steady state for a drug with formulation-dependent first-pass and mechanism-based enzyme auto-
inhibition?

© Copyright 2014 Certara, L.P. All rights reserved.
Multi-dose studies for MR formulations
• The CHMP NfG on Modified Release Oral and transdermal Dosage Forms requires a multiple dose study for prolonged release products for drugs expected to show accumulation*
• For Diltiazem, accumulation is expected due to reduced first-pass and systemic clearance due to auto-inhibition but the dissolution is not expected to accumulate for Fast and Medium Release formulations
• PBPK models dissolution and absorption as separate processes hence allows simulation of MR formulation at steady state scenario after multi-dosing and estimate accumulation
• Can PB-IVIVC help to simulate such studies?
16
*EUFEPS BABP Network Open Discussion Forum: Revised European Guideline on Pharmacokinetic and Clinical Evaluation of Modified Release Dosage Forms. June 2013. Session III: Specific issues for BE assessment, by Alfredo García Arieta AEMPS, Madrid ES.

© Copyright 2014 Certara, L.P. All rights reserved.
Simulating SS exposure of ER-Diltiazem
• Such IVIVC linked PBPK simulations could help to evaluate exposure at steady state for ER products based upon single dose clinical studies
Formulation AUC Accumulation Index Fast 1.74
Medium 1.61 Slow 1.46

© Copyright 2014 Certara, L.P. All rights reserved.
Case study 3: IVIVC for Tramadol ER Formulation
In Vitro In Vivo Correlation
Linear Model- Time scaled Extended Model
Failed to predict
lower bioavailability
of slow formulation
US Patent 8158147; CDER, 2004, Tramadol Extended release tablets

© Copyright 2014 Certara, L.P. All rights reserved.
PB-IVIVC: Two-Stage Sequential Approach using Linear IVIVC
Internal Validation
External Validation
Prediction Formulation
Obs- Med Pred %PE Obs- Med Pred %PE
Dissolution LL Disso Specs 2746.3562 2283.3879 16.86 126.2574 117.1461 7.22
UL Disso Specs 2746.3562 2843.2808 -3.53 126.2574 137.0588 -8.56
AUC0-t (ng/mL.h) Cmax (ng/mL)UL & LL Dissolution
Specifications
Validation Formulation
Obs Pred %PE Obs Pred %PE
Fast-Formulation 2829.7451 2884.5825 -1.94 161.3640 139.9631 13.26
Internal Med Formulation 2746.3562 2518.9773 8.28 126.2574 118.4506 6.18
Slow Formulation 2331.2512 2245.0901 3.70 103.1680 102.3100 0.83
Validation Formulation
Obs Pred %PE Obs Pred %PE
External EXTR Med Formulation5270.2065 5607.0176 -6.39 281.9600 273.6927 2.93
EXTR Slow Formulation4662.9282 4673.4829 -0.23 233.0400 231.7150 0.57
AUC0-t (ng/mL.h) Cmax (ng/mL)
AUC0-t (ng/mL.h) Cmax (ng/mL)
Poster Number T3273 – S Pathak et al, AAPS AM, 2014

© Copyright 2014 Certara, L.P. All rights reserved.
Upper, Target and Lower
dissolution profiles of
Tramadol ER Formulation
Predicted Plasma profiles in
virtual population using
SimCYP PBPK Modelling Inter-occasional
variability
incorporated
before subjecting
it to BE
Application of Absorption Modelling to Predict Virtual Bioequivalence
Bioequivalence was determined
using Phoenix BE module
0.00
20.00
40.00
60.00
80.00
100.00
0.00 4.00 8.00 12.0016.0020.0024.000.00
40.00
80.00
120.00
160.00
200.00
0.00 8.00 16.00 24.00 32.00 40.00 48.00

© Copyright 2014 Certara, L.P. All rights reserved.
Objections to More Mechanistic Models
1 – Data hungry!
System vs drug/formulation data?
2- Makes many assumptions!
Assumptions are declared; unlike other models
3- It is not transparent!
Contradiction with previous item!
4- Does not add too much value!
Most of the value is in “internal facilitation” and “informed decision making”
5- Other modelling types can be done too!
Other models by their nature cannot go beyond the data which is used to drive
them (no extrapolation)
Slide Courtesy - Amin Rostami Hodjegan (Uni Manchester)

© Copyright 2014 Certara, L.P. All rights reserved.
Acknowledgements
• Simcyp
– Shriram Pathak
– David Turner
– Sebastian Polak
– Masoud Jamei
• University of Manchester
– Amin Rostami-Hodjegan (Seconded at Simcyp)
• US FDA
– Bipin Mistry
– Marilyn Martinez
• Jagiellonian University
– Aleksander Mendyk (Rivivc modelling)
• Simcyp Consortium

© Copyright 2014 Certara, L.P. All rights reserved.
Thank you for your
attention