mechanis c evalua on of a monitored pavement constructed
TRANSCRIPT
TRANSPORTES | ISSN: 2237-1346 199
Mechanis�c evalua�on of a monitored pavement
constructed with asphalt surface treatment Avaliação mecanicista de um trecho monitorado de pavimento asfál�co
construído com tratamento superficial duplo Hebert Oliveira Santos1, Lilian Ribeiro de Rezende2
1Universidade Federal de Goiás, Goiás – Brasil, [email protected] 2Universidade Federal de Goiás, Goiás – Brasil, [email protected]
Recebido: 18 de outubro de 2019 Aceito para publicação: 9 de julho de 2020 Publicado: 15 de dezembro de 2020 Editor de área: Kamilla Vasconcelos
ABSTRACT
This paper aims to present the preliminary results of a monitored highway track in the Brazilian state of Goiás, incorpora7ng mechanis7c analyses in order to contribute to the database of materials, technologies and performance for an asphalt pavement executed with Double Asphalt Surface Treatment (DAST) as the surface layer. In this study, labor-atory tests were performed with the materials in terms of characteriza7on, mechanical and resilient behavior for each layer, and checking the behavior of an improved lateri7c gravel with cement in three different contents. The pavement test sec7on was moni-tored during execu7on and up to 6 months a>er opening to traffic by determining de-flec7ons, macro and micro textures, ruAng measurement, traffic evalua7on and iden7-fica7on of apparent defects. The DAST design was also evaluated. The stresses and de-forma7ons that developed along the layers were obtained and the field modules were determined by back analysis. The results showed a mechanical performance gain with the addi7on of cement in the gravel. The results also show some problems during the pavement construc7on, the emergence of pathologies, high deforma7ons in the lower layers, and emulsion oversizing in the DAST.
RESUMO
Este ar7go obje7va apresentar os resultados preliminares de um trecho monitorados em Goiás, incorporando análises mecanicistas de modo a contribuir com o banco de dados de materiais, tecnologias e desempenho de um pavimento asfál7co executado com Tratamento Superficial Duplo (TSD). Para isso, nesta pesquisa foram realizados en-saios laboratoriais com os materiais em termos de caracterização, comportamento me-cânico e resiliente dos componentes de cada camada, verificando também o comporta-mento do cascalho melhorado com cimento em três teores diferentes. A seção de teste do pavimento foi monitorada durante a execução e até 6 meses após liberação do trá-fego, por meio da determinação das deflexões, das macro e microtexturas, da medida da trilha de roda, da avaliação do tráfego e da iden7ficação dos defeitos aparentes. O dimensionamento do TSD também foi avaliado. As tensões e deformações desenvolvi-das ao longo das camadas foram ob7das e os módulos de campo determinados por meio de retroanálise. Os resultados mostraram ganho de desempenho mecânico com a adi-ção de cimento no cascalho, falhas na execução, surgimento precoce de patologias, ele-vadas deformações nas camadas inferiores à base e superdimensionamento de emulsão no TSD.
Keywords:
Experimental track. Laboratory tests. Field tests. Pavement mechanics.
Palavras-chaves:
Trecho experimental. Ensaios de laboratório. Ensaios de campo. Mecânica dos pavimentos.
DOI:10.14295/transportes.v28i5.2211
1. INTRODUCTION
The sustainable development of a country depends on a transport system that combines productivity and quality. A regular infrastructure review is necessary for the system to increase its performance and adapt to new demands. In Brazil, road transport is the most used for both

Santos, H.O., Rezende, L.R. Volume 28 | Número 5 | 2020
TRANSPORTES | ISSN: 2237-1346 200
cargo and people. However, in Brazil only 13% of the highways are paved, and 57% have their general status classi%ied as reasonable, bad or very bad (CNT, 2019). The fact that more than half of the built pavements have problems is partly due to the design method that is still used for asphalt pavements, which involves a calculation process that is no longer adequate for cur-rent characteristics. In addition, other factors can contribute to the rapid degradation of Brazil-ian pavements such as: a lack of in-depth studies conducted for the materials used, a lack of adequate execution control, and the failure to monitor the performance of the post-construction structure.
There is also a gap in the production of research that studies the main themes involved in this process. The survey by Santiago and Soares (2015) of studies carried out in Brazil between 1990 and 2015 shows that, while the characterization of materials represents 60% of the total research, the sum of important parameters for design such as traf%ic, environmental factors and performance corresponds to only 30%.
In this context, the Brazilian Asphalt Technology Network (RTA), %inanced by Petrobras and the National Agency of Petroleum, Natural Gas and Biofuel (ANP), has the support of universi-ties that are conducting paving research, with the help of the National Department of Transport Infrastructure (DNIT). One of its actions is the monitoring of experimental pavement tracks, in a standardized way, with the objective of collecting systematic data on the behavior of national pavements. In 2018, the National Design Method (MeDiNa) was presented by DNIT based on data obtained by RTA. This is a Brazilian mechanistic-empirical method: mechanistic for ana-lyzing a stress-strain relationship in the pavement, and empirical because it needs calibration for stress‒strain models (Huang, 2003). The MeDiNa was developed from the SisPav software created by Franco (2007). Among the various works linked to the RTA, studies of the sections of the Fundao-RJ design (partnership between CENPES, COPPE/UFRJ and the City Hall of the UFRJ University City) of the %ive segments in the MG-202 road (Medrado, 2009) and the stretch on the BR-040 road (Souza Junior, 2018) were very important and fundamental to this process.
Thus, this article presents the preliminary results of one of the several monitored tracks in the state of Goias, Brazil, implanted in the GO-230, incorporating mechanical methods in order to contribute to the database of materials, technologies and performance of an asphalt pave-ment constructed with Double Asphalt Surface Treatment (DAST) as the surface layer.
2. MATERIALS AND METHODS
2.1. Materials
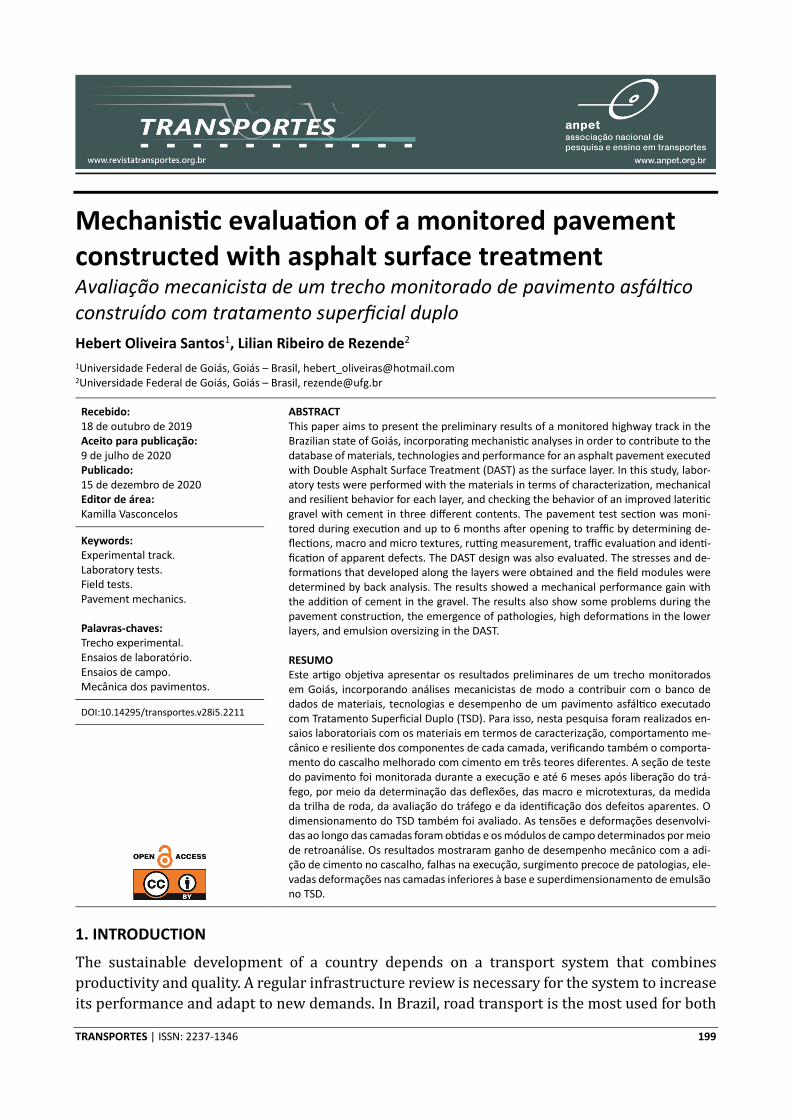
This study followed the execution of a 340 meter long experimental track located on the GO-230 highway that connects the cities of Mimoso de Goias and AD gua Fria de Goias, Goias State, Brazil. The design was developed by the State of Goias Infrastructure and Transport Agency (GOINFRA), using the conventional method based on the California Bearing Ratio (CBR) for an equivalent number of standard load (N) equal to 2.58 × 10⁶ vehicles. Figure 1 shows the built structure. Note that the choice of the Double Asphalt Surface Treatment (DAST) surface layer would not be indicated by the current Brazilian standards for the traf%ic level considered in the design. However, the reason for this choice was not formally clari%ied by the executing agency, and it is assumed that this was due to the lack of an asphalt-producing facility in the region of the work. Nine materials were studied in the laboratory, considering the materials used in the construction of the highway and the behavior of the base soil with different cement contents.
Santos, H.O., Rezende, L.R. Volume 28 | Número 5 | 2020
TRANSPORTES | ISSN: 2237-1346 201
Layer Sample Description
DAST BR2 Gravel type 2 – Granitic gneisses (1st layer) BR0 Gravel type 0 – Granitic gneisses (2nd layer) Emulsion Asphalt emulsion RR-2C
Base
BA Latertic gravel BA2C Latertic gravel + 2% de cement BA3C Latertic gravel + 3% de cement BA4C Latertic gravel + 4% de cement
Subbase SB Sandy laterite
Subgrade SL Lateritic clay
Figure 1. Design section for GO-230 and samples description.
Table 1 – Basic properties for aggregates and soils
Properties SL SB BA BA2C BA3C BA4C
Grain size distribution without dispersant
Gravel (%) 0.73 44.13 62.52 - - - Sand (%) 52.94 30.60 16.52 - - - Silt (%) 44.07 22.76 15.90 - - - Clay (%) 2.27 2.50 5.06 - - -
Grain size distribution with dispersant
Gravel (%) 0.73 44.13 62.52 - - - Sand (%) 38.90 24.67 14.50 - - - Silt (%) 13.12 15.97 10.22 - - - Clay (%) 47.25 15.23 12.76 - - -
Specific gravity and Atterberg limits
ρ (g/cm³) 2.678 2.735 2.728 - - -
wL (%) 43 39 37 40 - - wP (%) 28 22 19 21 - - PI (%) 15 17 18 19 - -
Classification
USCS ML SC SC - - - AASHTO A-7-6 A-2-6 A-2-6 - - - FERET Clay Silt sand Silt sand - - - MCT LG' LA' NG' - - - MCT (c’) 2.33 1.46 1.73 1.73 MCT (e’) 0.80 0.98 1.39 1.26 MCT (d’) 48.59 34.62 11.82 9.99 MCT (Pi-%) 10.00 35.00 100.00 0.00
Compaction and CBR
Energy SE IME ME ME ME ME wopt (%) 19.80 13.00 10.47 9.73 8.70 10.43
γdmax (kN/m³) 16.45 18.43 20.50 20.50 20.55 20.60
CBR (%) 16 69 76 92 - - S (%) 0.08 0.05 0.05 0.00 - - Note: ρ = specific gravity; wL = liquid limit; wP = Plastic limit; PI= Plasticity index; NP = non-plastic; AASHTO = American Association of State Highway and Transportation Officials; USCS = Unified Soil Classification System; MCT = Tropical Soil Classification; LG’ = Lateritic clay soil; LA’ =Lateritic sand soil; NG’ = Non-lateritic clay soil; c’, e’, d’, Pi = MCT indexes; wopt = Optimum water content,;
γdmax = maximum dry density; CBR = California Bearing Ratio; S = Swelling; SE= Standard energy (12 blows); IME= Intermodified energy (39 blows); ME= Modified energy (55 blows).
Santos, H.O., Rezende, L.R. Volume 28 | Número 5 | 2020
TRANSPORTES | ISSN: 2237-1346 202
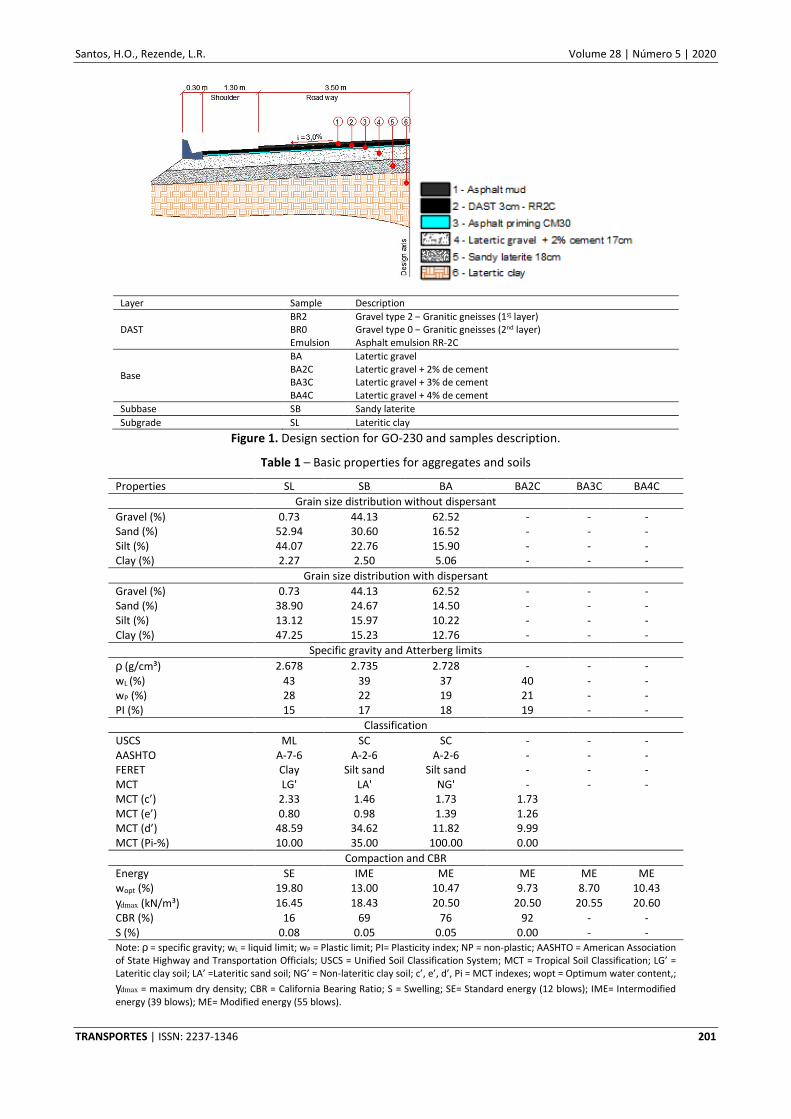
Table 1 presents a summary of the soil characterization and classi%ication data and the re-sults of the compaction, swelling and CBR tests. The subgrade, clay soil according to the Feret triangle, was classi%ied as A-7-6 soil (%ine clay soil) by AASHTO (American Association of State Highway and Transportation Of%icials) and identi%ied as LG' (lateritic clay soil) by the MCT (Min-iature, Compacted, Tropical) classi%ication. Base and subbase soils, classi%ied as silty sand by Feret, have a similar traditional classi%ication, A-2-6, but differ in the classi%ication for tropical soils. The subbase soil belongs to the LA' group (lateritic sandy soil) and can develop good me-chanical behavior. The base soil, on the other hand, belongs to the NG' group (non-lateritic clay soil) and may have limited use for paving. The incorporation of 2% cement appeared as an al-ternative to improve the parameters of the base soil.
2.2. Methods 2.2.1. Laboratory studies and construction technical control
The test for determining the Resilient Modulus (MR) was performed on soil samples compacted in a universal servo-hydraulic testing machine (UTM) with capacity of 30 kN following the in-structions of ME 134 (DNIT, 2018a) for soils without the addition of cement, and ME 181 (DNIT, 2018b) for cemented soils. The specimens (CP) with CPIIF-40 cement were cured in a humid chamber with relative humidity greater than 95% and a controlled temperature (25ºC) for 7 and 28 days. To predict the behavior, data regressions were performed to determine the param-eters of the models presented in Table 2 in order to identify the one that best represents the behavior of each material.
For reasons of optimization, the amount of material available and the fact that the dynamic triaxial test is not a destructive method, the CPs were used in an Uncon%ined Compression (UC) test, performed according to NBR 12770 (ABNT, 1992) and NBR 12025 (ABNT, 2012). It is note-worthy that the specimens had their moisture measured at the moment of compaction, before the MR tests were performed, and after the rupture in the RCS test, making it possible to observe that the average variation in absolute value of the water content before and after the rupture was 0.6%, which can be considered insuf%icient to have a signi%icant impact on the values of the obtained parameters.
The DAST layer was designed by the empirical method of the “red bottom tray” presented in ES-P 11 (DERT, 2000) and indicated by Silva (2018), as well as by the theoretical methods of Hanson, California, Linckenheyl and Tagle and Podesta, as cited by Pinto (2002). These data were compared with those of the DAST performed on the monitored track and required by ES 147 (DNIT, 2012). The aggregates used were also evaluated using the theoretical parameter performance-based uniformity coef%icient (PUC). The coef%icient is an indication of the quality of the aggregate to be used in surface treatments using granulometry. It evaluates individually, in each layer, the potential for aggregate loss and bleeding (Silva et al., 2018).
In the %ield, tests were carried out to determine the apparent speci%ic mass insitu according to ME 092 (DNER, 1994a) and moisture using the Speedy method according to ME 052 (DNER, 1994b). Regarding the DAST layer, the execution control was executed according to ES 147 (DNIT, 2012) in order to determine the temperature of the asphalt emulsion while inside the distribution truck, immediately before application. The application rates of both the asphalt emulsion and the aggregates of the %irst and second layers along the track were also determined by placing and weighing trays of known mass and area.

Santos, H.O., Rezende, L.R. Volume 28 | Número 5 | 2020
TRANSPORTES | ISSN: 2237-1346 203
Table 2 – Resilient modulus models from the literature
Models Equations
Compound MR=K1σ3K2σd
K3
Universal AASTHO MR=K1Pa � θ
Pa�
K2
�τoc
Pa+1�
K3
Universal Uzan-Witczak MR=K1θK2τocK3
Confining stress MR=K1σ3K2
Deviator stress MR=K1σdK2
Semi-log MR=10�K1-K2σd�
Hyperbolic MR=K1+K2σd
σd
Note: MR = Resilient modulus; σ3 = confining stress; σd = deviator stress (σ1-σ3); θ = bulk stress (θ = σ1 + σ2 + σ3); τoc = octahedral shear stress, (τoc = √2/3. σd); Pa = atmospheric pressure; K1, K2 e K3 = tests parameters
2.2.2. Monitoring
The monitoring evaluated the initial conditions of the pavement through the monitoring and analysis of degradations related to traf%ic. For that, a variety of %ield tests were done, as shown in Table 3.
Table 3 – Tests for pavement monitoring.: Field
Tests Standard 7 days 3 months 6 months
Deflection ME-133 (DNIT, 2010) X X X British pendulum E 303 (ASTM, 2018) X X X Sand patch E 965 (ASTM, 2015) X X X Visual inspection REDE (2010) X X X Permanent deformation (ATR) PRO 007 (DNIT, 2003) X X X Traffic MANUAL (DNIT, 2006) X
De%lections were determined with the Benkelman beam test with measures every 25 cm until completing 2 m and a %inal measurement 10 m from the standard truck to the starting point. The visual survey of defects was carried out according to the RTA procedure with a speci%ic methodology based on the procedures TER-005 (DNIT, 2003) and SHRP (1993). Finally, the traf-%ic survey was carried out using a manual (DNIT, 2006) counting methodology without weigh-ing the vehicles. The counting was done on seven consecutive days (March 13‒19 2019) from 6:00 am to 7:00 pm, thus adopting the precision level C (when there is a 90% probability that the value of the error is between 10% and 25%).
2.2.3. Structural analysis
The MeDiNa software does not allow the use of DAST when the traf%ic is greater than N = 9.99 × 10⁵. Therefore, for this analysis, the measured traf%ic was used. It is noteworthy that the perma-nent deformation test was not performed on the studied soils, so it is necessary to adopt already existing models from the software’s database for each one of them.
With the Elastic Multiple Lcomayer Analysis (AEMC) software, the stresses and deformations developed along the layers were calculated considering the load applied by the standard road axis of 8.2 tf. In addition to the structure adopted in the project, the analysis of two more struc-tures was also carried out, changing the cement content used in the base (3% and 4%). Considering the depth (z), points were determined on the surface, center and interface of the layers, and on the subgrade at 25 and 65 cm deep after the previous layer. According to the

Santos, H.O., Rezende, L.R. Volume 28 | Número 5 | 2020
TRANSPORTES | ISSN: 2237-1346 204
guidance for the AEMC software, to determine the points on the interface, pairs of points were de%ined at 0.001 cm below and above the interface. As for the distance perpendicular to the bearing (x), the determination of the points is a function of the type of road axis, being in the center of loading (x = 0), in the middle between the center and the inner rim of the wheel, in the center and on the rim of the outer wheel, and %ive points every 20 cm from the outer edge of the wheel.
2.2.4. Back analysis
In order to obtain the MR values of the pavement layers in the %ield after its construction, a back analysis of the Benkelman beam tests was executed using two software packages: BackMeDiNa, based on SisPav (Franco, 2007) and BAKFAA, the Federal Aviation Administration (FAA) soft-ware.
BackMeDiNa and BAKFAA were developed to work with data from Falling Weight De%lec-tometer (FWD) trials. Thus, for the calculation of MR, adaptations were necessary in the load value of the shaft and its application radius, as indicated by Theisen et al. (2009). The applica-tion load of 20.1 kN, a quarter of 8.2 tf, was de%ined, applied in an area of 0.035 m², due to the pressure of 560 kPa, corresponding to a circular plate with a radius of 10.69 cm. The stopping criterion for the calculation process was based on the Root Mean Square (RMS) error values, noting that BackMeDiNa considers values between 10 µm and 5 µm as a reasonable correlation and less than 5 µm as a good correlation.
3. RESULTS AND DISCUSSION
3.1. Laboratory tests
Altogether 33 CPs were tested with an average of a 99% degree of compaction and water con-tent variation, equal to 0.7% around the optimum. The %irst CP of the subgrade broke during the stress sequence of the conditioning phase. Therefore, the norm suggestion was adopted and the conditioning phase and the number of voltage pairs for the subgrade were reduced. In the anal-yses, the mean values of MR and UC were considered.
The subgrade samples compacted in standard Proctor energy showed an average MR of 190 MPa. The subbase and base samples compacted in the intermodi%ied (5 layers, 39 drops per layer and 4.5 kg impact hammer weight) and modi%ied energy, respectively, presented average modules of 329 and 348 MPa, values commonly found for subbase and base materials (Bernucci et al., 2006). For chemically stabilized soil, it is noteworthy that the addition of 2% cement did not generate a signi%icant change in the %irst 7 days, but at 28 days of curing it caused an increase of 85.8% (647 MPa) in the average value of the MR. The incorporation of 3% cement resulted, at 28 days, in an average MR value equal to 1275 MPa. For the soil with 4% cement after 28 days of curing, the average RM reached 4299 MPa. It appears that, even for low levels of cement, higher RM values could be expected. However, it should be noted that the stabilized soil is sap-rolitic; if the soil used was lateritic, perhaps better mechanical results could have been obtained. Rocha and Rezende (2017) obtained MR values in the order of 4000 MPa already with 7 days of curing for a mixture of 4% cement and lateritic gravel.
Table 4 presents the models that obtained the best behavior for each sample. Good results stand out for the model proposed by AASTHO. Bastos (2013) and Santos et al. (2019) studied similar soils and noticed the same behavior, highlighting that, despite the Brazilian tendency to use the composite model, further research is necessary. It was found that, for the samples with

Santos, H.O., Rezende, L.R. Volume 28 | Número 5 | 2020
TRANSPORTES | ISSN: 2237-1346 205
cement addition, the results obtained in the tests with 7 days of curing did not generate good predictions for any of the models used. This is because the chemical reactions are still very active in the %irst days, meaning that the mixture of the saprolitic soil with cement is still not stable.
For UC tests performed with the BA4C sample, the CPs were tested after 31 days due to the availability of the press. The results of UC at 28 days are presented together with those of MR in Figure 2a. The studied mixtures are treated, in principle, as soil improved with cement, since the incorporated contents are below 5% and no sample reached the resistance of 2.1 MPa, the minimum required by the ES 143 standard (DNIT, 2010).
Table 4 – Samples’ resilient modulus behavior
Sample Best model R² Equation
SL Universal AASTHO 0.74 MR=2962.387Pa � θ
Pa�
0.15919
�τoc
Pa+1�
0.18014
SB Compound 0.42 MR=347.31902σ30.19867σd
-0.23839
BA Universal Uzan-Witczak 0.84 MR=359.01772θ0.63465τoc-0.14182
BA2C-28D Universal AASTHO 0.93 MR=2255.41703Pa � θ
Pa�
-1.88363
�τoc
Pa+1�
2.39019
BA3C-28D Universal AASTHO 0.97 MR=28090.5077Pa � θ
Pa�
0.06645
�τoc
Pa+1�
-0.74728
BA4C-28D Universal AASTHO 0.93 MR=139156.445Pa � θ
Pa�
0.19956
�τoc
Pa+1�
-1.22881
Note: 28D= After 28 days curing; R2 = coefficient of determination.
Figure 2. MR and UC results after 28 days of curing: (a) for each soil and cement mixture sample; (b) for different cement
content
Figure 2b shows the growth of MR and UC generated by the addition of cement, where it is observed that the increase in MR is more signi%icant than that of UC for the content of 4% ce-ment. This increase in strength is explained by the pozzolanic reactions that develop over time in the chemical stabilization of soils, and the dynamic triaxial test seems to be more sensitive in obtaining the impact of altering the cement content. Thus, the addition of 4% cement caused a greater increase in stiffness, which may indicate that the soil is leaving the condition of being improved with cement and reaching that of soil-cement. Rocha and Rezende (2017) demonstrated, through microscopic analysis, that there are structural differences depending on the content of cement incorporated into the soil and this will have an impact on the structural
Santos, H.O., Rezende, L.R. Volume 28 | Número 5 | 2020
TRANSPORTES | ISSN: 2237-1346 206
behavior of the mixtures: while for 2% of cement, no changes were observed in the microstruc-ture, with 4% hydration products were observed, which crystallized in the form of needles, generated a reticulated mesh in the pore voids, and improved the mechanical behavior.
3.2. Construc�on technical control
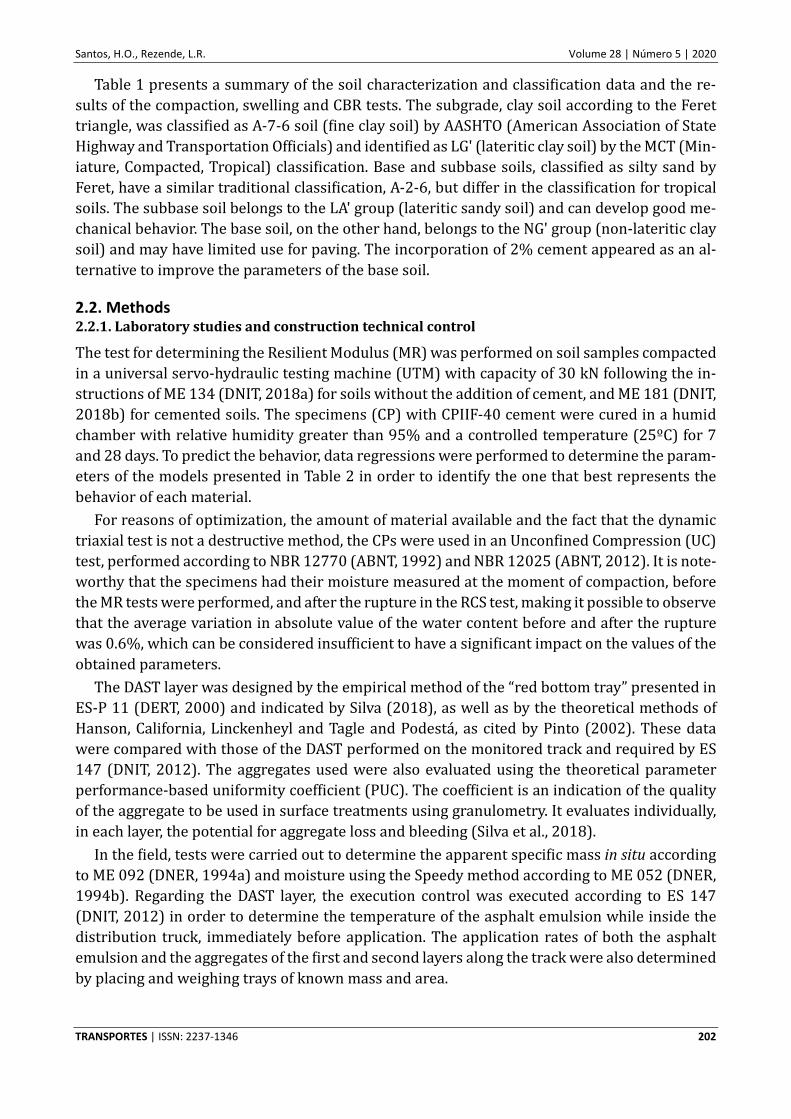
Table 5 presents the results of the sand replacement method and Speedy tests. It is observed that none of the layers reached a degree of compaction of 100%, so they were less rigid and more susceptible to deformations. All layers had water content lower than the optimum water content obtained in the laboratory (variation of 2.3%, 5.1% and 4.4% in the subgrade, subbase and base layers, respectively). The lack of a strict compaction control during construction, in terms of both water content and density, should impair the performance of the structure. It is assumed that the inspection did not notice such discrepancies due to the differences in the la-boratory compaction results performed by the executing company. Generally, when the soils are compacted in the dry branch, they may present higher values of suction and strength, but they are also more prone to the development of shrinkage cracks due to moisture loss. On the other hand, there may be a sudden reduction in resistance if there is saturation.
Table 5 – Field compaction control for geotechnical layers
Layer Stake Position w field w average w optimum Δ ρd field ρd average ρd maximum CG
(%) (%) (%) (%) (kg/m³) (kg/m³) (kg/m³) (%)
Subgrade
1602 LS 18.4
17.5 19.8 2.3
1493
1502 1645 91.3 1602 RS 18.4 1501
1597 LS 16.6 1502
1597 RS 16.5 1513
Subbase
1593 LS 6.0
7.9 13.0 5.1
1662
1584 1843 86.0 1606 RS 7.5 1561
1599 C 10.1 1531
Base with 2% of cement 1589 LS 6.0
6.1 9.7 4.4 1880
1909 2050 93.1 1597 C 6.2 1938
Note: LS = left side; RS = right side; C = center; w = water contend; Δ = water contend variation; ρd = dry density; CG = compaction grade.
Table 6 – DAST field control
Stake Layer Position
Asphalt Emulsion Aggregates
Temperature Ratio Ratio
initial final °C kg/m² kg/m² 1602 1630
1st
laye
r
For M 70.5 1.22 20.07
1602 1630 For AF 70.5 1.26 20.20
1602 1630 C 71.0 0.94 20.26
1561 1602 For M 71.5 1.26 20.16
1561 1602 For AF 71.0 1.19 19.70
1561 1602 C 71.0 1.07 20.26
Average 71.0 1.16 20.11
SD 0.35 0.13 0.21
CV (%) 0.5 11.0 1.1
1602 1630
2n
d la
yer
For M 70.0 1.26 10.20
1602 1630 For AF 70.5 1.22 10.26
1602 1630 C 70.0 1.22 10.13
1561 1602 For M 70.0 1.22 10.46
1561 1602 For AF 70.0 1.22 10.20
1561 1602 C 70.0 1.19 10.23
Average 70.0 1.22 10.25
SD 0.20 0.02 0.11
CV (%) 0.3 1.8 1.1
Note: M= Mimoso de Goiás; AF= Água Fria de Goiás; C = center, SD = standard variation, CV = coefficient of variation.

Santos, H.O., Rezende, L.R. Volume 28 | Número 5 | 2020
TRANSPORTES | ISSN: 2237-1346 207
3.3. DAST design
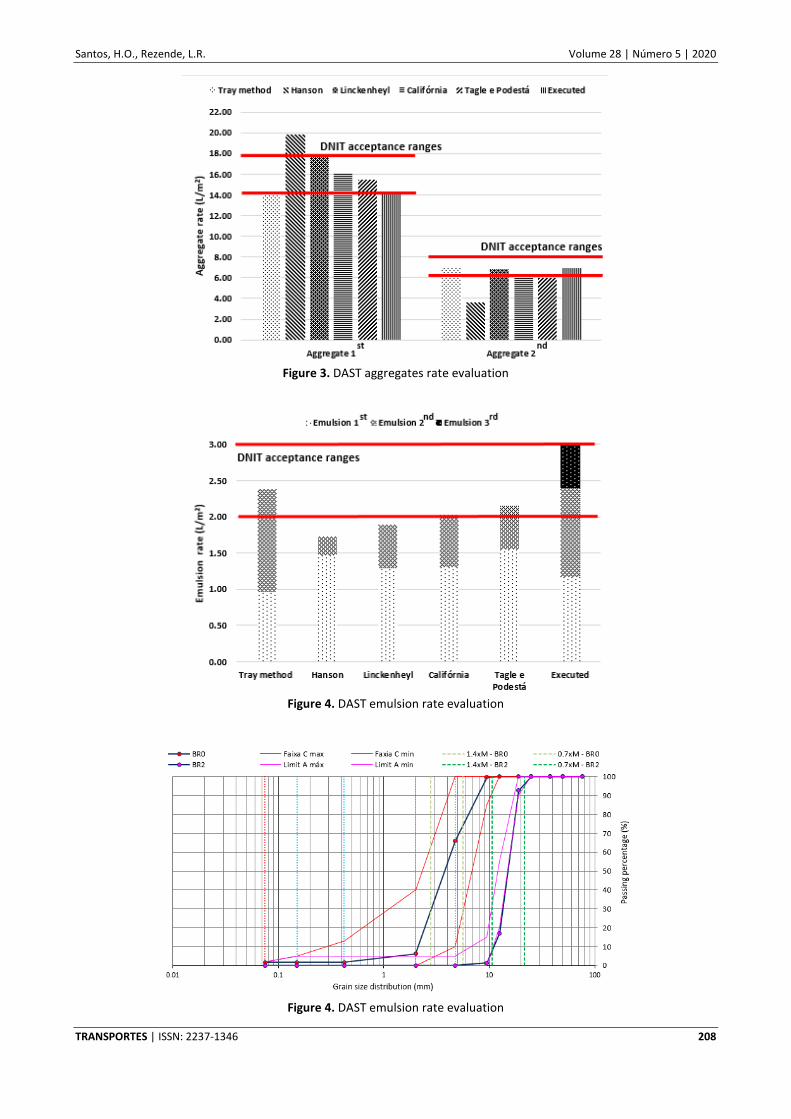
As shown in Figure 3, it is observed that when comparing the aggregate rate proposed by each method with the DNIT acceptance ranges: (i) the execution met the standard; (ii) the red bottom tray method obtained a result very similar to the one executed, also being at the lower threshold of the DNIT standard; (iii) indirect methods varied from 15 to 20 L/m² in the rates of the con-stituent aggregate of the %irst layer, presenting higher rates than the one performed, with the Hanson and Linckenheyl method being above the DNIT range; (iv) in the second layer only Han-son's method showed a signi%icant difference. The average of the aggregate rates obtained by indirect methods for the %irst layer was 17.29 L/m², a value close to the maximum allowed by the rule (17.75 L/m²) and higher than the empirical method (14.34 L/m²) and the one executed (14.27 L/m²). For the second layer, the average rate by indirect methods was 5.72 L/m², which is less than the minimum required by DNIT (6.76 L/m²) and lower than the rate performed (6.93 L/m²).
Figure 4 shows the comparison between the calculated, executed and standard application rates. DNIT requires that the sum of the emulsion applied in the two layers respects the range of 2 to 3 L/m². It is noticed that the executed emulsion application rate of 3 L/m², which corre-sponds to the three applications, is higher than that calculated by the tray method (2.39 L/m²), a method that also considers the application of the third layer of emulsion. It should be noted that all the theoretical methods determined considerably lower rates, with an average of 1.95 L/m², even with the determination of higher aggregate rates. Thus, it is concluded that the pave-ment was made with excess emulsion. This may explain the appearance of pathologies such as bleeding.
The granulometry of gravel type 0 and type 2 is shown in Figure 5, where the framing in the strips can be seen. The results of the analyses made by the PUC coef%icient are shown in Table 9. It can be seen that the BR2 sample has a value very close to zero, indicating high uniformity and a low risk of developing defects, since there is only 8% of aggregates susceptible to excess binder and 4% to pullout. The BR0 sample, the aggregate that makes up the top layer of the DAST, has a higher PUC value, showing that it is not very uniform and with greater susceptibility to the main issues in DAST, with 24% of aggregates susceptible to excess binder and 28% to pullout. Table 7 also presents the same calculations for the maximum and minimum ranges, A and C, proposed by DNIT in order to compare the limits of acceptance of the standard with re-spect to excess binder and the loss of aggregates. It is interesting to note that the bands are permissive when compared to the PUC: Band C, for example, allows 36% of excess binder and 28% of aggregate loss, that is, 64% of the layer on the verge of failure, these being the two most critical defects in TSPs which, when not treated, are the source of several other problems, such as combing, pans, and cracking, among others (Lee; Kim, 2008). It is up to each organization to de%ine its acceptance limits; the CentredeRecherchesRoutières (CRR, 1981), for example, con-siders an aggregate loss of 5‒10% acceptable. Therefore, with the development of other re-search and improvement in the use of PUC, it is expected that the regulations can be updated in order to minimize the occurrence of these pathologies.
It is worth mentioning that the PUC was proposed for the analysis of simple surface treat-ments, but it is also interesting to study its application for the analysis of DAST, especially with regard to the second layer of the DAST.
Santos, H.O., Rezende, L.R. Volume 28 | Número 5 | 2020
TRANSPORTES | ISSN: 2237-1346 208
Figure 3. DAST aggregates rate evaluation
Figure 4. DAST emulsion rate evaluation
Figure 4. DAST emulsion rate evaluation

Santos, H.O., Rezende, L.R. Volume 28 | Número 5 | 2020
TRANSPORTES | ISSN: 2237-1346 209
Table 7 – PUC results
BR0 DNIT C
maximum limit
DNIT C minimum
limit BR2
DNIT A maximum
limit
DNIT A minimum
limit
M 4 2.5 7.3 15.3 12.1 15.3
0.7M 2.8 1.8 5.1 10.7 8.5 10.7
1.4M 5.6 3.5 10.2 21.4 16.9 21.4
PEM 24% 36% 18% 8% 13% 8%
P2EM 72% 72% 89% 96% 86% 94%
PUC 0.33 0.50 0.20 0.08 0.15 0.09
Bleeding 24% 36% 18% 8% 13% 8%
Aggregate loss 28% 28% 11% 4% 14% 6% Note: M = median size; PEM = percentage passing at a given embedment depth of 0.7M; P2EM = percentage passing at twice the embedment depth of 1.4M; PUC = performase-based uniformity coefficient.
3.4. Monitoring
As the traf%ic survey was carried out for 13h over 7 days, it was necessary to use an hourly ex-pansion coef%icient to represent 24h. Based on the study by Freitas (2019), the daily average traf%ic (DAT) measured from 151 vehicles for 13h of monitoring was transformed into 227 ve-hicles for 24h. By making the traf%ic forecast for 10 years, with 3% annual growth, the number N was equal to 6.67 × 10⁵, a value lower than that considered in the highway project (N = 2.58 × 10⁶). It is noteworthy that at the time of the survey, the highway was not fully completed, which may explain the low volume of heavy vehicles traf%ic. The average speed of the vehicles was calculated divided into three categories: light vehicles had an average speed of 92 km/h, higher than the limit for the highway, which is 80 km/h; heavy vehicles and buses with 76 km/h and 77 km/h, respectively, both below the speed limit.
De%lection measurement and structural evaluation were performed using the Benkelman beam test. The average of the de%lection values, radius of curvature, coef%icient of variation and characteristic de%lection corrected by the seasonal factor are shown in Table 8. It appears that up to 3 months after opening to traf%ic, the de%lections did not vary signi%icantly. As for the 6-month monitoring, there was an increase in de%lections. The values obtained can be considered acceptable, but the fact that the de%lections increase rapidly may indicate early compromise of the structure, probably associated with the materials chosen for the surface and the base, as well as the construction %laws observed during the executive control.
The maximum recoverable de%lection (D0) is relevant to understand the behavior of the structure, because this value must be less than an allowable value. The PRO 11 standard (DNER, 1979) determines the permissible de%lections for the pavement according to the number “N”. As the highway was designed for traf%ic with the value of N = 2.58 × 10⁶, three N scenarios were de%ined for calculating the allowable de%lection: medium traf%ic (N = 105), heavy traf%ic (N = 106) and very heavy traf%ic (N = 107). The results obtained were 134.90, 89.95 and 59.98 ×10⁻² mm, respectively.
The structural evaluation is shown in Table 9 and is based on the allowable de%lections, characteristic de%lections and determined radius of curvature. For the initial and 3-month monitoring, all points showed good structural quality. For 6 months, the quality remained good for traf%ic levels of 105 and 106, while for 107 it decreased to regular. According to PRO 11 (DNER, 1979), when the characteristic de%lection is less than the allowable level and the radius of curvature greater than or equal to 100 m, the pavement has not yet reached its fatigue phase.

Santos, H.O., Rezende, L.R. Volume 28 | Número 5 | 2020
TRANSPORTES | ISSN: 2237-1346 210
Table 8 – Average of deflections
Position Initial stake
Final stake
Length (m)
R average
(m) D0 average
(10-2 mm) SD CV (%)
D0 characteristic
(10-2 mm)
7 days
Total 1589 1606 340 434.08 36.22 11.39 31 47.61 For Água Fria 1589 1606 340 449.67 34.19 14.66 43 48.85 For Mimoso 1589 1606 340 418.50 38.26 6.59 17 44.85
3 months
Total 1589 1606 340 731.5 33.26 11.27 34 53.44 For Água Fria 1589 1606 340 904.49 35.32 13.42 38 58.48 For Mimoso 1589 1606 340 558.51 31.20 8.53 27 47.67
6 months
Total 1589 1606 340 314.43 50.21 17.76 35 81.55 For Água Fria 1589 1606 340 348.93 42.68 19.52 46 74.64 For Mimoso 1589 1606 340 279.93 57.73 12.16 21 83.87 Note: R = bend radius; D0 = maximum deflection; SD= standard deviation; CV= coefficient of variation.
Table 9 – Structural analyses
Position N Dadm
(10-2 mm) Dp
(10-2 mm) R
(m) Dp/Dadm Structural quality
7 days
Total 105 134.9 47.61 434.08 0.35 GOD 106 89.95 47.61 434.08 0.53 GOD 107 59.98 47.61 434.08 0.79 GOD
For Água Fria 105 134.9 48.85 449.67 0.36 GOD 106 89.95 48.85 449.67 0.54 GOD 107 59.98 48.85 449.67 0.81 GOD
For Mimoso 105 134.9 44.85 418.5 0.33 GOD 106 89.95 44.85 418.5 0.5 GOD 107 59.98 44.85 418.5 0.75 GOD
3 months
Total 105 134.9 53.44 731.5 0.4 GOD 106 89.95 53.44 731.5 0.59 GOD 107 59.98 53.44 731.5 0.89 GOD
For Água Fria
105 134.9 58.48 904.49 0.43 GOD
106 89.95 58.48 904.49 0.65 GOD 107 59.98 58.48 904.49 0.97 GOD
For Mimoso 105 134.9 47.67 558.51 0.35 GOD 106 89.95 47.67 558.51 0.53 GOD 107 59.98 47.67 558.51 0.79 GOD
6 moths
Total 105 134.9 81.55 314.43 0.6 GOD 106 89.95 81.55 314.43 0.91 GOD 107 59.98 81.55 314.43 1.36 REGULAR
For Água Fria 105 134.9 74.64 348.93 0.55 GOD 106 89.95 74.64 348.93 0.83 GOD 107 59.98 74.64 348.93 1.24 REGULAR
For Mimoso 105 134.9 83.87 279.93 0.62 GOD 106 89.95 83.87 279.93 0.93 GOD 107 59.98 83.87 279.93 1.4 REGULAR
Note: N = traffic; Dadm= maximum deflection admissible; Dp= characteristic deflection; R= bend radius.
Table 10 shows the test results carried out for the macrotexture evaluation with the sand patch test and its classi%ication according to Aps (2006). The main characteristics that in%luence the texture are the grain size distribution, shape and texture of the aggregates (Aps, 2006). The %irst determination of the macrotexture, at time 0, was performed in the DAST, while the other two determinations, at 3 and 6 months, were performed after the application of the asphalt coating. The DAST is by nature a thick macrotexture and, according to Aps (2006), it tends to easily exceed the value of 1 mm of roughness height. In the %ield, an average roughness height of 1.98 mm (very coarse or very open classi%ication) was found, providing greater tire‒pave-ment friction, and greater noise. The other two tests performed after the execution of the

Santos, H.O., Rezende, L.R. Volume 28 | Número 5 | 2020
TRANSPORTES | ISSN: 2237-1346 211
asphalt coating presented similar macrotextures, with values of 0.52 mm and 0.56 mm, but smaller than that determined for the DAST, which was to be expected since the asphalt coating uses small size aggregates.
Table 10 – Macro and microtexture data
Macrotexture
7 days
Position Stake Diameter average (mm) HS (mm) Classification
For
Mim
oso
1591 115 2.31 Very coarse or Very open
1595 126.25 1.92 Very coarse or Very open
1599 136.25 1.65 Very coarse or Very open
1603 133.75 1.71 Very coarse or Very open
For
Águ
a
Fria
1593 105 2.77 Very coarse or Very open
1597 135 1.68 Very coarse or Very open
1601 126.25 1.92 Very coarse or Very open
1605 127.5 1.88 Very coarse or Very open
Average 125.63 1.98
Very coarse or Very open SD 10.75 0.38
CV (%) 8.6 19.4
3 months
For
Mim
oso
1591 245.42 0.51 Fairly thin
1595 260.83 0.45 Fairly thin
1599 258.33 0.46 Fairly thin
1603 239.58 0.53 Fairly thin
For
Águ
a
Fria
1593 233.75 0.56 Fairly thin 1597 236.25 0.55 Fairly thin 1601 242.08 0.52 Fairly thin 1605 229.17 0.58 Fairly thin
Average 243.18 0.52
Fairly thin SD 11.3 0.05
CV (%) 4.6 9
6 months
For
Mim
oso
1591 253.33 0.48 Fairly thin 1595 253.33 0.48 Fairly thin 1599 267.5 0.43 Fairly thin 1603 248.33 0.5 Fairly thin
For
Águ
a
Fria
1593 211.25 0.68 Average 1597 229.17 0.58 Fairly thin 1601 213.33 0.67 Average 1605 213.33 0.67 Average
Average 236.2 0.56
Fairly thin SD 22.14 0.1
CV (%) 9.4 18.7
For
Águ
a Fr
ia
1593 71.40 Rough 84.00 Very rough 73.80 Rough
1597 65.60 Rough 88.20 Very rough 64.80 Rough
1601 63.20 Rough 87.40 Very rough 69.00 Rough
1605 74.80 Rough 70.00 Rough 75.40 Very rough
For
M
imo
so 1591 55.00 Rough 83.00 Rough 73.60 Rough
1595 64.60 Rough 77.20 Very rough 81.40 Very rough
1599 74.60 Rough 79.40 Very rough 57.80 Rough
1603 77.80 Very rough 83.20 Very rough 74.00 Rough
Average 68.38
Rough
81.55
Very rough
71.23
Rough SD 7.61 5.93 7.24
CV (%) 11.1 7.3 10.2
Note: HS = average high; SD= standard deviation; CV= coefficient of variation.
Table 10 also presents the tests executed for the microtexture with the British Pendulum test and its classi%ication according to Aps (2006). The initial average friction resistance values were 68.38 BPN; the tests done 3 and 6 months after the execution of the asphalt mud showed values of 81.55 and 71.23 BPN, respectively. It is noticed that the application of a new layer increased the friction resistance, a value that decreased again after 6 months, most likely due to the pol-ishing of the aggregates. The asphalt pavement restoration manual (DNIT, 2006) suggests that
Santos, H.O., Rezende, L.R. Volume 28 | Número 5 | 2020
TRANSPORTES | ISSN: 2237-1346 212
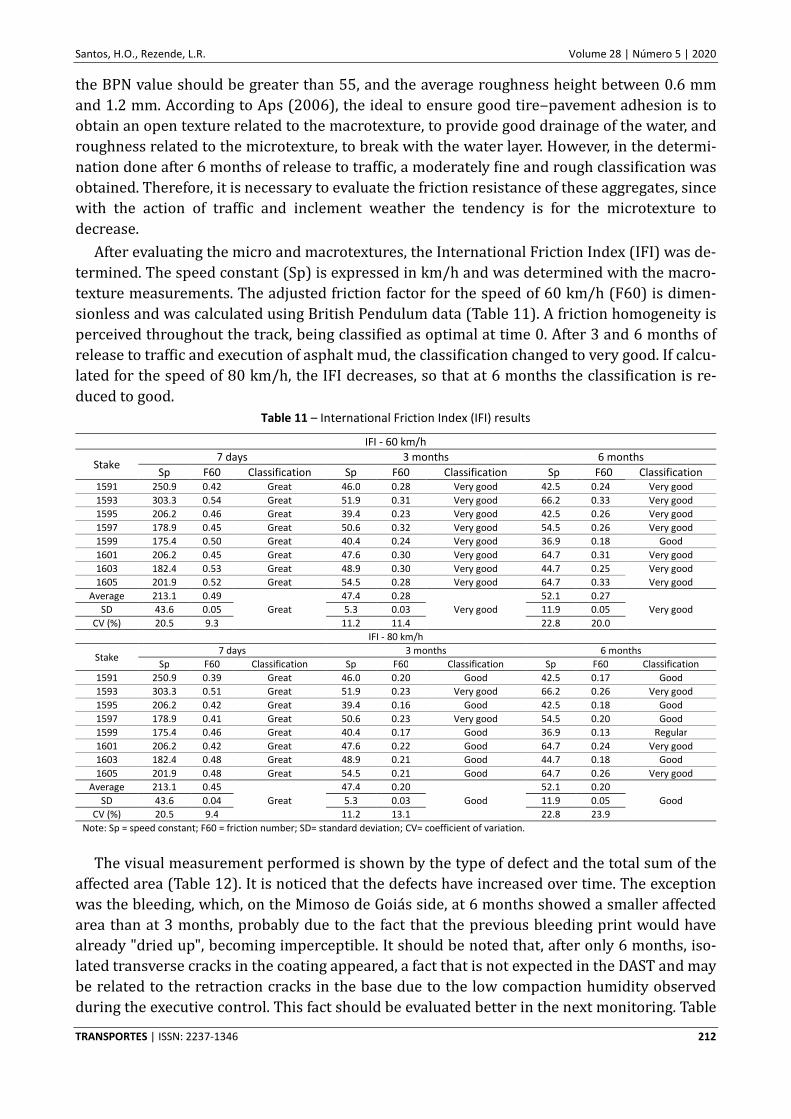
the BPN value should be greater than 55, and the average roughness height between 0.6 mm and 1.2 mm. According to Aps (2006), the ideal to ensure good tire‒pavement adhesion is to obtain an open texture related to the macrotexture, to provide good drainage of the water, and roughness related to the microtexture, to break with the water layer. However, in the determi-nation done after 6 months of release to traf%ic, a moderately %ine and rough classi%ication was obtained. Therefore, it is necessary to evaluate the friction resistance of these aggregates, since with the action of traf%ic and inclement weather the tendency is for the microtexture to decrease.
After evaluating the micro and macrotextures, the International Friction Index (IFI) was de-termined. The speed constant (Sp) is expressed in km/h and was determined with the macro-texture measurements. The adjusted friction factor for the speed of 60 km/h (F60) is dimen-sionless and was calculated using British Pendulum data (Table 11). A friction homogeneity is perceived throughout the track, being classi%ied as optimal at time 0. After 3 and 6 months of release to traf%ic and execution of asphalt mud, the classi%ication changed to very good. If calcu-lated for the speed of 80 km/h, the IFI decreases, so that at 6 months the classi%ication is re-duced to good.
Table 11 – International Friction Index (IFI) results
IFI - 60 km/h
Stake 7 days 3 months 6 months
Sp F60 Classification Sp F60 Classification Sp F60 Classification 1591 250.9 0.42 Great 46.0 0.28 Very good 42.5 0.24 Very good
1593 303.3 0.54 Great 51.9 0.31 Very good 66.2 0.33 Very good
1595 206.2 0.46 Great 39.4 0.23 Very good 42.5 0.26 Very good
1597 178.9 0.45 Great 50.6 0.32 Very good 54.5 0.26 Very good
1599 175.4 0.50 Great 40.4 0.24 Very good 36.9 0.18 Good
1601 206.2 0.45 Great 47.6 0.30 Very good 64.7 0.31 Very good
1603 182.4 0.53 Great 48.9 0.30 Very good 44.7 0.25 Very good
1605 201.9 0.52 Great 54.5 0.28 Very good 64.7 0.33 Very good
Average 213.1 0.49
Great
47.4 0.28
Very good
52.1 0.27
Very good SD 43.6 0.05 5.3 0.03 11.9 0.05
CV (%) 20.5 9.3 11.2 11.4 22.8 20.0
IFI - 80 km/h
Stake 7 days 3 months 6 months
Sp F60 Classification Sp F60 Classification Sp F60 Classification
1591 250.9 0.39 Great 46.0 0.20 Good 42.5 0.17 Good
1593 303.3 0.51 Great 51.9 0.23 Very good 66.2 0.26 Very good
1595 206.2 0.42 Great 39.4 0.16 Good 42.5 0.18 Good
1597 178.9 0.41 Great 50.6 0.23 Very good 54.5 0.20 Good
1599 175.4 0.46 Great 40.4 0.17 Good 36.9 0.13 Regular
1601 206.2 0.42 Great 47.6 0.22 Good 64.7 0.24 Very good
1603 182.4 0.48 Great 48.9 0.21 Good 44.7 0.18 Good
1605 201.9 0.48 Great 54.5 0.21 Good 64.7 0.26 Very good
Average 213.1 0.45
Great
47.4 0.20
Good
52.1 0.20
Good SD 43.6 0.04 5.3 0.03 11.9 0.05
CV (%) 20.5 9.4 11.2 13.1 22.8 23.9
Note: Sp = speed constant; F60 = friction number; SD= standard deviation; CV= coefficient of variation.
The visual measurement performed is shown by the type of defect and the total sum of the affected area (Table 12). It is noticed that the defects have increased over time. The exception was the bleeding, which, on the Mimoso de Goias side, at 6 months showed a smaller affected area than at 3 months, probably due to the fact that the previous bleeding print would have already "dried up", becoming imperceptible. It should be noted that, after only 6 months, iso-lated transverse cracks in the coating appeared, a fact that is not expected in the DAST and may be related to the retraction cracks in the base due to the low compaction humidity observed during the executive control. This fact should be evaluated better in the next monitoring. Table
Santos, H.O., Rezende, L.R. Volume 28 | Número 5 | 2020
TRANSPORTES | ISSN: 2237-1346 213
12 also shows the rutting or permanent deformation (ATR) results obtained after 6 months. The values found for permanent deformation are within those expected for a pavement with less than one year of release to traf%ic (average deformations around 2 and 3 mm) and similar to the values found by Perez (2016).
Table 12 – Visual inspection results and permanent deformation (ATR) 6 months after the pavement construction
Visual inspection
Position Type of defects 7 days 3 months 6 months Area (m²) Area (m²) Area (m²)
For
Águ
a Fr
ia
Polished aggregate - 0.07 1.16 Surface layer degradation 0,01 1,10 6,99
Exudation 0.04 1.32 1.64 Corrugation 0.02 0.02 0.28
Foot hole 0.02 0.03 0.12 Pavement patch - - 0.01
Crack isolated - - -
For
Mim
oso
Polished aggregate - 0.10 0.25 Surface layer degradation - 0.69 0.91
Exudation 0.06 4.26 0.11 Corrugation - 0.06 0.04
Foot hole - 0.06 0.57 Pavement patch - - -
Crack isolated - - 0.04
ATR
Stake For Água Fria city For Mimoso de Goiás city
Left side (cm) Right side (cm) Average (cm) Left side (cm) Right side (cm) Average (cm) 1589 0.00 0.00 0.00 0.20 0.20 0.20 1590 0.10 0.20 0.15 0.10 0.30 0.20 1591 0.20 0.20 0.20 0.00 0.30 0.15 1592 0.40 0.30 0.35 0.00 0.20 0.10 1593 0.20 0.30 0.25 0.00 0.30 0.15 1594 0.20 0.30 0.25 0.30 0.20 0.25 1595 0.20 0.40 0.30 0.20 0.40 0.30 1596 0.10 0.30 0.20 0.20 0.30 0.25 1597 0.20 0.40 0.30 0.20 0.30 0.25 1598 0.20 0.30 0.25 0.20 0.30 0.25 1599 0.40 0.40 0.40 0.20 0.30 0.25 1600 0.30 0.30 0.30 0.20 0.30 0.25 1601 0.50 0.60 0.55 0.20 0.30 0.25 1602 0.30 0.20 0.25 0.10 0.30 0.20 1603 0.30 0.20 0.25 0.00 0.50 0.25 1604 0.50 0.80 0.65 0.30 0.50 0.40 1605 0.40 0.80 0.60 0.10 0.10 0.10 1606 0.50 0.40 0.45 0.20 0.30 0.25
Average 0.28 0.36 0.32 0.15 0.30 0.23 SD 0.15 0.20 0.16 0.10 0.10 0.07
CV (%) 53 57 51 66 32 32
Note: SD= standard deviation; CV= coefficient of variation
However, in some places, RTA values greater than 8 mm were observed. For permanent de-formation, the value of 7 mm is considered alarming and 10 mm as the maximum allowed dur-ing the life of a pavement considered as part of the Main Arterial System, according to the Me-DiNa method. The Global Gravity Index (GGI) was also calcx’ulated, according to the standard PRO 006 (DNIT, 2003), which veri%ies that this parameter is indicated for the evaluation of other types of coating. In this study, the GGI was used for comparison only during monitoring. For the period of 6 months, the pavement of the side towards AD gua Fria was classi%ied as Bad (GGI = 81) and Mimoso as Regular (GGI = 55).
3.5. Structural analysis
The MeDiNa program does not consider the damage due to fatigue when it comes to DAST,

Santos, H.O., Rezende, L.R. Volume 28 | Número 5 | 2020
TRANSPORTES | ISSN: 2237-1346 214
and the performance analysis is related to the ATR. At the end of the 10 years of the project, a total ATR forecast equal to 6.90 mm was obtained. Comparing what was predicted by the pro-gram for 6 months of use (5.79 mm) and the value measured by monitoring (average of 1.50 mm to 3.60 mm), it is clear that the forecast is higher. This difference can be explained by the fact that, in this work, still no real permanent deformation data were obtained for the soils used in the pavement. Anyway, it is observed that in the 6 months of monitoring, on average between 30% and 46% of the total predicted ATR had already occurred.
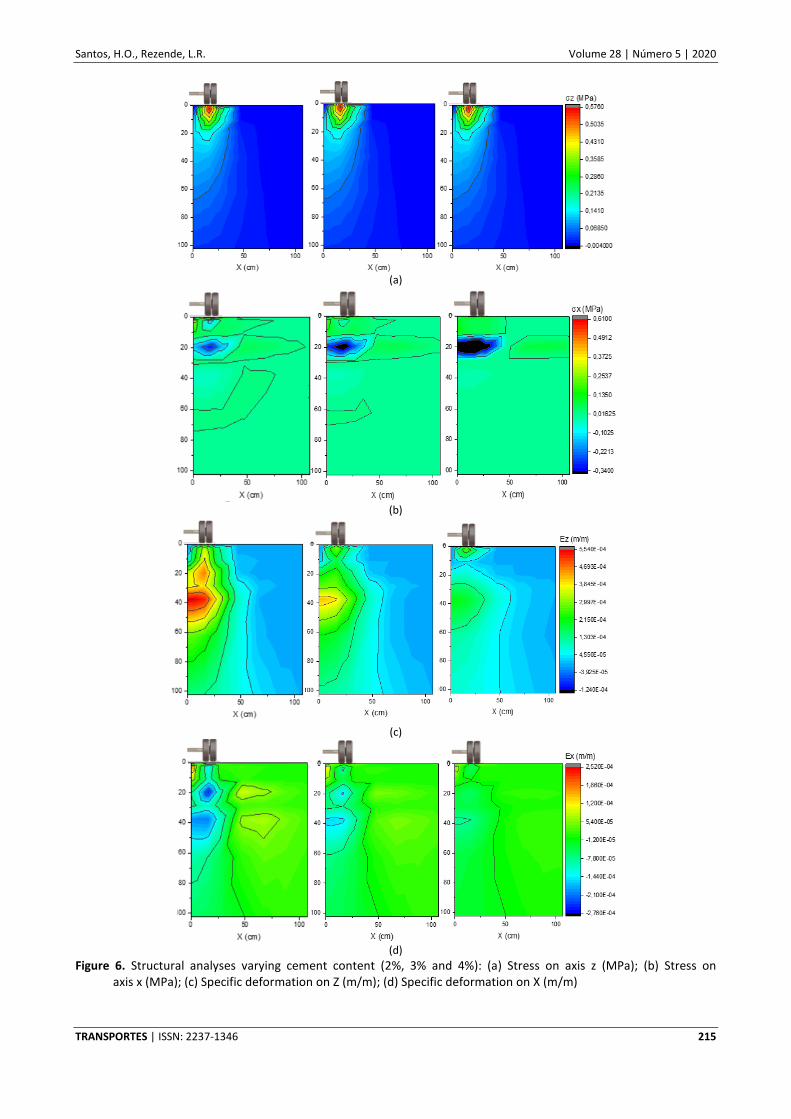
Figure 6 presents the pro%ile of the section studied for the analysis of stresses and strains. Positive values indicate that the point is in tension, while negative values indicate compression. Regarding the stresses along the depth (σz), they dissipate in a similar way even with the change of the base material. The displacements generated in the depth (Uz) were high in the subbase and in the subgrade (6.4 mm and 14.4 mm, respectively), while in the base it was 1.4 mm. Thus, the subgrade was responsible for 65.1% of the displacement, which agrees with its less resilient performance. It is interesting to note that, with the increase in the cement content at the base, and consequently the stiffness, the total deformations decreased.
Figure 6c shows the pro%ile of speci%ic displacements in depth (Ez). The subgrade is the layer with the worst performance. Noteworthy is the reduction in deformations due to the change in the base material. By analyzing the stresses along the distance perpendicular to the bearing (σx) (Figure 6b), the highest stresses occur at the interface between the base and the subbase and these stresses increase as the base stiffness also increases. The increase of stresses in the lower %iber of the base can result in the appearance of cracks, which may be re%lected on the surface.
However, the increase in stresses at (x) does not result in greater deformation on that axis. On the contrary, it can be seen that the deformations in (x) as well as in (z) decreased with increasing layer stiffness (Figure 6d). Ranadive and Tapase (2016) found that increasing the modulus of the base layer reduces ATR damage, a fact also observed by Das and Pandey (1999), Hadi and Bodhinayake (2003) and Behiry (2012). This analysis showed that the built structure presents high displacements in the lower layers, and this %inding, combined with the other executive problems already mentioned in the text, will contribute to the appearance of pathologies.
3.6. Back analysis
Figure 7 shows the average de%lection basins for each range in the three monitoring times com-pared to the basins calculated by the back analysis software. It is observed that the values of the back analyzed modules (1928, 586 and 271 MPa for base, subbase and subgrade, respectively) were higher than those found in the laboratory. One of the hypotheses for this difference is that the humidity below the optimum used in the %ield may have resulted in increased soil suction, which, according to Santos (2019) and Freitas, Rezende and Gitirana Jr. (2020), would generate an increase in RM. The error values obtained by BackMeDiNa were lower than those of BAKFAA, and BackMeDiNa was able to better adjust the measured curve regardless of its shape. With only 6 months of monitoring and with the high dispersion presented by the results obtained with the back analysis of data from the Benkelman beam, it was not possible to determine an increasing or decreasing behavior of the MR values for that short period of time.
Santos, H.O., Rezende, L.R. Volume 28 | Número 5 | 2020
TRANSPORTES | ISSN: 2237-1346 215
(a)
(b)
(c)
(d)
Figure 6. Structural analyses varying cement content (2%, 3% and 4%): (a) Stress on axis z (MPa); (b) Stress on axis x (MPa); (c) Specific deformation on Z (m/m); (d) Specific deformation on X (m/m)

Santos, H.O., Rezende, L.R. Volume 28 | Número 5 | 2020
TRANSPORTES | ISSN: 2237-1346 216
(a) (b)
(c) (d)
(e) (f)
Figura 7. Field deflection basins versus calculated deflection basins: (a) 7 days – for Água Fria; (b) 7 days - for Mimoso de Goiás; (c) 3 months - for Água Fria; (d) 3 months- for Mimoso de Goiás; (e) 6 months - for Água Fria; (f) 6 months - for Mimoso de Goiás.
6. CONCLUSIONS
After a laboratory study and initial %ield monitoring of the track implanted at GO-230, it was concluded that:
• the international classi%ication systems are %lawed when dealing with tropical soils, since the subbase and base samples have the same AASHTO, SUCS and Feret classi%ication, but differ when compared to the MCT methodology;
• the resistance parameters obtained in the laboratory show that the materials used in the base can present good behavior since they are compacted in the ideal water content and density, a fact that was not ful%illed in the pavement construction, as demonstrated in the compaction control;
• the incorporation of 2% cement into the base soil improved its properties. The addition of higher levels of cement raised the resistance parameters to another level and made
Santos, H.O., Rezende, L.R. Volume 28 | Número 5 | 2020
TRANSPORTES | ISSN: 2237-1346 217
the base more rigid. The point is that, as the base improved with 2% cement was com-pacted in a water content below the optimum, this procedure may have generated the formation of shrinkage cracks in the layer with re%lection for the surface;
• when the design of the DAST was evaluated, it was noticed that the acceptance ranges of the DNIT for the application of aggregates and emulsion are broad and generic. The ag-gregate that makes up the top layer of the DAST showed a high PUC value, with more than 50% of the layer prone to pullout or exudation, corroborating the issues found. It is recommended to use the PUC coef%icient to aid in the choice of aggregates to be used for DAST, given its easy implementation and its importance for the prevention of patholo-gies;
• the macrotexture measured in the TSD showed a signi%icant change due to the applica-tion of the asphalt mud, while the microtexture did not, since the value obtained after 6 months of release to traf%ic was similar to that found in the initial monitoring;
• the structural analysis showed high deformations in the subbase and subgrade, probably due to the lower resilience performance of the selected soils. The analysis of the struc-ture for higher cement contents showed that the increase in stiffness generated an in-crease in horizontal stresses at the base/subbase interface, but decreased the defor-mations generated and the consequent displacements that the layers presented;
• in the back analysis process, higher modulus values were obtained than those deter-mined in the laboratory, probably due to the lower water content values used in the %ield;
• the main question to be assessed is whether a pavement structure composed of sub-grade, subbase and base compacted in water content and with density lower than the ideal values, for an improved base with cement that will still present an increase in its stiffness over time covered by a thin layer of DAST, will perform well.
ACKNOWLEDGEMENTS The authors would like to thank the Brazilian Petroleum Company (PETROBRAS), the National Agency of Petroleum, Natural Gas and Biofuel (ANP), the Financier of Studies and Projects (FINEP), the National Council for Scienti%ic and Technological De-velopment (CNPq) and the Goias Infrastructure and Transport Agency (GOINFRA) for their support.
REFERENCES
ABNT (1992) NBR 12770: Solo coesivo - Determinaçao da resistencia a compressao nao con%inada - Metodo de ensaio. Associ-açao Brasileira de Normas Tecnicas, Rio de Janeiro.
ABNT (2012) NBR 12025: Solo-cimento — Ensaio de compressao simples de corpos de prova cilındricos — Metodo de ensaio. Associaçao Brasileira de Normas Tecnicas, Rio de Janeiro.
APS, MAD RCIA (2006) Classi%icaçao da aderencia pneu-pavimento pelo ındice combinado IFI – International Friction Index para revestimentos asfalticos. Tese de Doutorado, USP, Sao Paulo, 179p.
ASTM E 303-93(2018), Standard Test Method for Measuring Surface Frictional Properties Using the British Pendulum Tester, ASTM International, West Conshohocken, PA, 2018, www.astm.org
ASTM E 965-15(2019), Standard Test Method for Measuring Pavement Macrotexture Depth Using a Volumetric Technique, ASTM International, West Conshohocken, PA, 2019, www.astm.org
BASTOS, J. B. S. (2013) In%luencia da variaçao da umidade no comportamento de pavimentos da regiao metropolitana de For-taleza. Dissertaçao (Mestrado em Engenharia de Transportes) - UFC, Fortaleza, 164p.
BEHIRY, A. E. A. E. (2012) Fatigue and rutting lives in %lexible pavement. Ain Shams Engineering Journal, [s.l.], v. 3, n. 4, p.367-374. Elsevier BV. http://dx.doi.org/10.1016/j.asej.2012.04.008.
BERNUCCI, L. B., CERATTI, J. A. P., MOTTA, L. M. G., SOARES, J. B, Pavimentaçao Asfaltica: Formaçao Basica para Engenheiros, Rio de Janeiro, PETROBRAS-ABEDA, 2006. 3ª Reimpressao, 2010.
CENTRE DE RECHERCHES ROUTIE_ RES. Code de bonne pratique des enduits super%iciels. Bruxelles, 1981.
CNT (2019) Boletins tecnicos CNT. Confederaçao Nacional do Transporte (Org.) Brasılia: CNT: SEST: SENAT, 2019. 48 p.
DAS, A.; PANDEY, B. B. (1999) Mechanistic-Empirical Design of Bituminous Roads: An Indian Perspective. Journal of Transpor-tation Engineering, [s.l.], v. 125, n. 5, p.463-471, set. 1999. American Society of Civil Engineers (ASCE). http://dx.doi.org/10.1061/(asce)0733- 947x(1999)125:5(463)

Santos, H.O., Rezende, L.R. Volume 28 | Número 5 | 2020
TRANSPORTES | ISSN: 2237-1346 218
DERT (2000) CE. ES–P 11/00 Tratamento Super%icial Duplo. Especi%icaçoes gerais para serviços e obras rodoviarias. Pavimen-taçao. Departamento de Edi%icaçoes, Rodovias e Transportes Fortaleza, Ceara.
DNER (1979) Norma 011/79 Avaliaçao estrutural dos pavimentos %lexıveis. Departamento Nacional de Estradas de Rodagem, Rio de Janeiro, 1979. 16p.
DNER (1994) ME 052: Solos e agregados miudos – Determinaçao da umidade com emprego do “Speedy”. . Departamento Na-cional de Estradas de Rodagem Brasil, 1994. 4p.
DNER (1994) ME 092: Solo – Determinaçao da massa especı%ica aparente “in situ”, com emprego do frasco de areia. Departa-mento Nacional de Estradas de Rodagem Brasil, 1994. 5p.
DNIT (2003) PRO 006 Avaliaçao objetiva da superfıcie de pavimentos %lexıveis e semi-rıgidos - Procedimento. Departamento Nacional de Infraestrutura de Transportes Rio de Janeiro. Ministerio dos Transportes, Instituto de Pesquisas Rodoviarias. 10 p.
DNIT (2003) PRO 007 Levantamento para avaliaçao da condiçao de superfıcie de subtrecho homogeneo de rodovias de pavi-mentos %lexıveis e semi-rıgidos para gerencia de pavimentos e estudos e projetos Procedimento. Departamento Nacional de Infraestrutura de Transportes Rio de Janeiro. Ministerio dos Transportes, Instituto de Pesquisas Rodoviarias. 11 p.
DNIT (2006) Manual de estudos de trafego. Departamento Nacional de Infraestrutura de Transportes Rio de Janeiro. Publica-çao IPR – 723. Ministerio dos Transportes, Instituto de Pesquisas Rodoviarias. 388 p.
DNIT (2006) Manual de restauraçao pavimentos asfalticos. Departamento Nacional de Infraestrutura de Transportes Rio de Janeiro. Publicaçao IPR – 720. Ministerio dos Transportes, Instituto de Pesquisas Rodoviarias. 314 p.
DNIT (2010) ES 143: Pavimentaçao – Base de solo-cimento - Especi%icaçao de serviço. Departamento Nacional de Infraestru-tura de Transportes Brasil, 10p.
DNIT (2010) ME-133: Pavimentaçao – Delineamento da linha de in%luencia longitudinal da bacia de deformaçao por interme-dio da Viga Benkelman – Metodo de ensaio. Departamento Nacional de Infraestrutura de Transportes Brasil, 8p.
DNIT (2012) ES 147: Pavimentaçao asfaltica – Tratamento Super%icial Duplo. Departamento Nacional de Infraestrutura de Transportes Brasil, 10 p.
DNIT (2013) EM 165: Emulsoes asfalticas para pavimentaçao – Especi%icaçao de material. Departamento Nacional de Infraes-trutura de Transportes Brasil, 5p.
DNIT (2018) ME 134: Determinaçao do modulo de resiliencia de solos. Departamento Nacional de Infraestrutura de Trans-portes Brasil, 11p.(a)
DNIT (2018) ME 181: Pavimentaçao – Material Estabilizado Quimicamente – Determinaçao do modulo de resiliencia – Me-todo de ensaio. Departamento Nacional de Infraestrutura de Transportes Brasil, 16p.(b)
FRANCO, F. A. C. P. (2007) Metodo de Dimensionamento Mecanıstico-Empırico de Pavimentos Asfalticos – SisPav. 294p. Tese (Doutorado, Instituto Alberto Luiz Coimbra de Pos-Graduaçao e Pesquisa de Engenharia). Universidade Federal do Rio de Janeiro, 2007.
FREITAS, J. B. (2019) Analise de parametros para projetos mecanısticos-empıricos de pavimentos asfalticos em Goias. Disser-taçao (Mestrado em Engenharia Civil). UFG/GO, Goiania, 212p.
FREITAS, J. B.; REZENDE, L. R.; GITIRANA JR.; G. F. N. Prediction of the resilient modulus of two tropical subgrade soils consi-dering unsaturated conditions. Engineering Geology, Volume 270, 5 June 2020, Elsevier, https://doi.org/10.1016/j.enggeo.2020.105580.
HADI, M. N. S.; BODHINAYAKE, B. (2003) Non-linear %inite element analysis of %lexible pavements. Advances In Engineering Software, [s.l.], v. 34, n. 11-12, p.657-662, Elsevier BV. http://dx.doi.org/10.1016/s0965-9978(03)00109-1.
HUANG, Y. H. (2003) Pavement Analysis and Design. 2. ed. [s.l.]: Pearson, 792 p.
LEE, J.; KIM, Y. Understanding the Effects of Aggregate and Emulsion Application Rates on Performance of Asphalt Surface Treatments. Transportation Research Record: Journal of the Transportation Research Board, v. 2044, p. 71–78, 2008. Dis-ponıvel em: <http://trrjournalonline.trb.org/doi/10.3141/2044-08>
LOIOLA, P. R. R. (2009) Estudo de agregados e ligantes alternativos para emprego em tratamentos super%iciais de rodovias. 206p. Dissertaçao (Mestrado em Engenharia de Transportes). UFC/CE, Fortaleza.
MEDRADO, W. A. (2009) Caracterizaçao Geotecnica de Solos da Regiao Norte de Minas Gerais para Aplicaçao em Obras Rodo-viaria. Dissertaçao M. Sc. Escola de Minas/UFOP, Ouro Preto – MG.
PED REZ, J. S. L. (2016) Avaliaçao do desempenho de pavimentos %lexıveis dos segmentos monitorados de Urubici e Itapoa. 333p. Dissertaçao (Mestrado em Engenharia de Civil). UFSC/SC, Florianopolis.
PINTO, S. (2002) Tratamento Super%icial Betuminoso. Instituto Militar de Engenharia – IME/RJ.
RANADIVE, M. S.; TAPASE, A. B. (2016) Parameter sensitive analysis of %lexible pavement. International Journal of Pavement Research and Technology, [s.l.], v. 9, n. 6, p.466-472, nov. 2016. Elsevier BV. http://dx.doi.org/10.1016/j.ijprt.2016.12.001.
REDE TECNOLOD GICA DE ASFALTO. (2010) Manual de execuçao de trechos monitorados. Rio de Janeiro: PETROBRAS. 95 p.
ROCHA, M. T.; REZENDE, L. R. Estudo laboratorial de um solo tropical granular estabilizado quimicamente para %ins de pavi-mentaçao. Materia (Rio de Janeiro), [s.l.], v. 22, n. 4, p.1-25, 2 out. 2017. FapUNIFESP (SciELO). http://dx.doi.org/10.1590/s1517-707620170004.0229.
SANTIAGO, L. S, SOARES, J. B. (2015) Contribuiçoes ao desenvolvimento do novo metodo de dimensionamento de pavimentos asfalticos no Brasil. XXIX Congresso Nacional de Pesquisa em Transporte da ANPET. Ouro Preto. P 160-171.

Santos, H.O., Rezende, L.R. Volume 28 | Número 5 | 2020
TRANSPORTES | ISSN: 2237-1346 219
SANTOS, T. A.; SPECHT, L. P.; PINHEIRO, R. J. B.; CERATTI, J. A. P., BRITO, L. A. T. (2019) Avaliaçao da resistencia e da deforma-çao resiliente de quatro solos de subleitos rodoviarios no estado do Rio Grande do Sul. Transportes, [s.l.], v. 27, n. 1, p.48-64, 30 abr. 2019, http://dx.doi.org/10.14295/transportes.v27i1.1531.
SHRP (1993) Distress Identi%ication Manual for the Long-Term Pavement Performance Studies. The Strategic Highway Re-search Program. National Academy of Science. Washington, D.C., 1993.
SILVA, R. C.; BARROSO, S. H. A.; KIM, Y. R. (2018) Introduçao do coe%iciente de uniformidade para avaliaçao de revestimentos asfalticos do tipo tratamentos super%iciais. Transportes, [s.l.], v. 26, n. 1, p.42-53, 30 abr. 2018, http://dx.doi.org/10.14295/transportes.v26i1.1371
SILVA, R. C. (2018) Avaliaçao da dosagem dos tratamentos super%iciais por penetraçao de rodovias baseada na exsudaçao e na perda de agregados. 2018. 135p. Dissertaçao (Mestrado em Engenharia de Transportes). UFC/CE, Fortaleza.
SOUZA JUNIOR, J. G. S. (2018) Aplicaçao do novo metodo de dimensionamento de pavimentos asfalticos a trechos de uma ro-dovia federal. Dissertaçao M. Sc. UFRJ, Rio de Janeiro – RJ.
THEISEN, K. M.; MATTOS, J. R. G.; TREICHEL, D. S.; CERATTI, J. A. P. (2009) Metodo de retroanalise de bacias obtidas por carre-gamento de eixo padrao atraves do uso de softwares adaptados para FWD. Seminario de engenharia geotecnica do Rio Grande do Sul. Pelotas.