mechanical displacement induced in a piezoelectric structure: experimental measurement by laser...
TRANSCRIPT
Mechanical displacement induced in a piezoelectric structure: Experimental measurement by laser interferometry and simulation by a finite element method
Marcel Gindre, • Wladimir Urbach, • Roger H. Coursant, and Mathias Fink b• Laboratoires d'Electronique et de Physique appliquke, • • 94450 Limeil-Breviannes, France
(Received 23 June 1987; accepted for publication 31 March 1988)
From the knowledge of piezoelectric material tensorial components one can, by the finite element method, calculate the electrical impedance versus frequency and simulate the mechanical deformation of piezoelectric bars. Here, the simulation results obtained with lead zirconate-titanate and lead titanate ceramics are reported. In order to check the validity of the simulation, interferometric measurements of the mechanical deformation amplitude were performed. It is shown that these measurements are able to reveal the inhomogeneity of the materials under study and that a small error in the tensorial parameter absolute values leads to an inconsistent picture of simulated mechanical deformation.
PACS numbers: 43.88.Ar, 43.88.Fx, 43.85.Vb, 43.35.Yb
INTRODUCTION
During the past years, the quality of ultrasonic imaging in medicine has been considerably improved thanks to signal processing and electronic skill. Further improvements will probably be due to transducer optimization. ! Computer cal- culations allow the optimization of piezoelectric structures with respect to their electromechanical conversion qualities and to their vibration modes. These simulations exploit ei- ther one-dimensional or two-dimensional models. 2'3 Two-
dimensional modeling is necessary to optimize the design of up-to-date, real time, electronically scanned transducers like the ones used in ultrasonic medical imaging. One of the drawbacks to these approaches based on simulation is the use of simplifying asumptions implicitly made by fitting the characteristics of the simulated state of vibration to the ones
of an equivalent one-dimensional thickness-mode state of vibration (i.e., the so-called Mason's mode). It is then im- portant to compare the calculated results with the direct measurements of the vibrating transducer deformation.
To our knowledge, although there have been some at- tempts to correlate the predicted modes of piezoelectric structure vibrations with experimental measurements, most studies concern disk shaped transducers that allow analyti- cal calculation. For parallelepipedic transducers, most auth- ors have been interested only in comparison of calculated and measured resonance frequencies and not in the trans- ducer mechanical deformation that contains valuable infor-
mation for transducer design. 4 One of the more complete works done in this field is by Jungerman et al. 5 The authors, however, were rather interested in the general shape of the deformation calculated by the variational method. They do
Permanent address: Laboratoire d'lmagerie M6dicale Ultrasonore (C. N. R. S. (U. A. 593 ), C. H. U. COCHIN, 24 rue du Faubourg Saint-Jacques, 75674 Paris Cedex 14, France.
Permanent address: Groupe de Physique du Solide, Universit6 Paris VII, 2 place Jussieu, 75251 Paris Cedex 05, France. A member of the Philips Research Organization.
not provide the absolute values of either the estimated dis- placement amplitudes or the measured ones. Furthermore, in some cases a polymer film was stacked at the front of the transducer in order to increase the reflectivity for interfero- metric measurements; hence, the authors might bias the measured values of the transducer front plane displace- ments.
We have simulated the vibrations of two parallelepi- pedic transducers with identical geometrical shapes but made from two different piezoelectric materials. Both are commercially available under the following designations: PXE-5 (Philips), a commonly used lead zirconate-titanate piezoceramic, and C-24 (Toshiba), a lead titanate piezocer- amic with a modified composition leading to a strong elec- tromechanical anistropy that enhances pure compressional thickness mode. 4 The simulation has been performed using a finite element method software package extended to the cal- culation of the state of vibration of piezoelectric structures. 6 The calculated results have been compared with the direct measurements of the mechanical displacement amplitude by means of a laser interferometer. 7
After a brief description of the interferometer setup, we shall describe shortly the principle of the simulation. The results obtained by interferometry and simulation will be presented in Sec. III and discussed in Sec. IV.
I. OPTICAL SETUP DESCRIPTION
The description of the heterodyne interferometer oper- ation is aided by reference to Fig. 1..A coherent beam from an He-Ne laser passes through an acoustic cell driven at a frequency fR = coR/2z' = 70 MHz, which is much higher than any expected motion frequency of the transducer under study. The acoustic cell acts as a phase grating and gives rise to diffracted beams. The direct beam frequency is unshifted while the frequency of the first-order diffracted beam is shift- ed by an amount f•. Hereafter, the intensities of the refer- ence and target beams will be called I• and It, respectively.
11 J. Acoust. Soc. Am. 84 (1), July 1988 0001-4966/88/070011-09500.80 ¸ 1988 Acoustical Society of America 11
Redistribution subject to ASA license or copyright; see http://acousticalsociety.org/content/terms. Download to IP: 141.217.58.222 On: Thu, 27 Nov 2014 03:49:07

Target
Y(t)
Photo.diode •/••/•Acoust .optical cell
FIG. 1. (a) Schematic representation of the heterodyne interferometer; M•, M2, and M 3 are the mirrors. (b) Schematic representation of the signal de- tection. Depending on the detection mode, three different signal processings are indicated.
After the reflection upon a face of the transducer, the target beam is combined with the reference beam on the photo- diode. The photodiode output current I(t) is proportional to the light intensity
I(t) -- IE• (t) + Er(t)12 ,
where the electric fields are E• = E•o cos[ (w- w• )t ] and E r = Ero cos(wt + •).
Setting [E• I e = I• (K= R or T), one gets
I=I• +Ir+2m(I•Ir)•/2cos[o)•t+qb(t)], (1) where •b (t) carries the information of the transducer vibra- tion and m takes into account the interferometer imperfec- tions such as wave front mismatch, losses in coherence, etc.
If the target displacement from its average position is described by y(t), then •b(t) = •bo + 2ky(t), where •bo is the phase difference measured when y(t)= 0 and k = 2•r/A (A = 632.8 nm). With
qb(t) = qbo + 2kYsin(wrt) , (2)
the last term in Eq. ( 1 ) becomes
13 = 2m(IRIr)•/2 cos[wRt + •bo + 2kYsin(wrt) ] . (3)
For k Y,• 1, we obtain
13 = 2m(I•Ir)•/2(COS(O)Rt + q3o) + kY
X (cos[ (eoR + wr)t + •bo]
-- cos[ (oR -- wr)t + q3o] )) ß (4)
Equation (4) shows that, in in the frequency domain, the photodiode output will display three peaks: the carrier at eoR and two sidebands separated from the carrier by q- WT (Fig. 1 ).
The photodiode was purchased from EG&G ( 1-ns rise time). The signal passes through a controlled voltage ampli- fier system (low noise and bandwidth --•400 MHz) and the ' output is fixed at a preset level ( 10 dB re: 1 mW) and sent to
a spectrum analyzer. As derived from Eq. (4), the ratio of the sideband amplitude to the carrier amplitude directly gives the target's vibrational amplitude Y. Because the dy- namic range of the analyzer is limited to 70 dB, an alterna- tive system has to be used when small Y values ( 10-2 nm) must be measured: The signal is then filtered and only one of the sidebands is sent to the spectrum analyzer. Without further amplification or averaging, the lowest measured val- ue was Y = 10- 3 nm (Fig. 2).
II. PRINCIPLE OF NUMERICAL SIMULATION
The use of a finite element method in structural analysis started in the 1950s but its application to simulate the state of piezoelectric structure vibrations is more recent. Roughly, the finite element method s is a method of transformation
and approximation of a problem presented in an integral formulation, by the problem of linear algebraic formulation, where the coefficients are integral evaluations of the subar- eas (finite elements) of the area of resolution. Generally, the problem to be solved is expressed in a differential formula- tion and the integral formulation is obtained by means of the values of generalized functions defined on an.appropriate
i
1J301 lO -2
10 -•
Y (rim) K (•,'• - _40
- -60
_ -80
O0
I I I
10 10 2 10 3 ( mV )
(a)
(b)
FIG. 2. (a) Mechanical displacement amplitude versus transducer applied voltage: Vo sin 2•rfi if= 2.3 MHz) and (b) typical spectrum correspond- ing to Y= I nm.
12 J. Acoust. Soc. Am., Vol. 84, No. 1, July 1988 Gindre et aL' Displacement induced in a piezoelectric structure 12
Redistribution subject to ASA license or copyright; see http://acousticalsociety.org/content/terms. Download to IP: 141.217.58.222 On: Thu, 27 Nov 2014 03:49:07
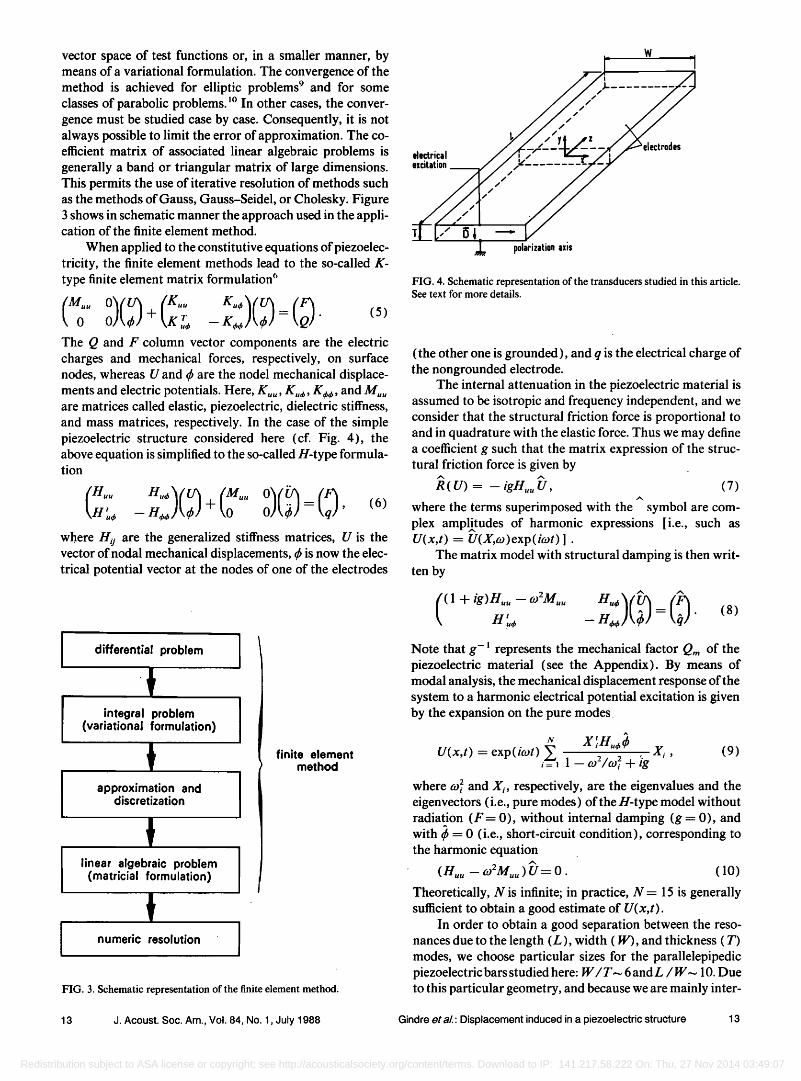
vector space of test functions or, in a smaller manner, by means of a variational formulation. The convergence of the method is achieved for elliptic problems 9 and for some classes of parabolic problems. lø In other cases, the conver- gence must be studied case by case. Consequently, it is not always possible to limit the error of approximation. The co- efficient matrix of associated linear algebraic problems is generally a band or triangular matrix of large dimensions. This permits the use of iterative resolution of methods such as the methods of Gauss, Gauss-Seidel, or Cholesky. Figure 3 shows in schematic manner the approach used in the appli- cation of the finite element method.
When applied to the constitutive equations of piezoelec- tricity, the finite element methods lead to the so-called K- type finite element matrix formulation 6
The Q and F column vector components are the electric charges and mechanical forces, respectively, on surface nodes, whereas U and •b are the nodel mechanical displace- ments and electric potentials. Here, K,,, K,•, K•, and M• are matrices called elastic, piezoelectric, dielectric stiffness, and mass matrices, respectively. In the case of the simple piezoelectric structure considered here (cf. Fig. 4), the above equation is simplified to the so-called H-type formula- tion
(H,, _ (0 (6)
where H e are the generalized stiffness matrices, U is the vector of nodal mechanical displacements, •b is now the elec- trical potential vector at the nodes of one of the electrodes
differential problem ]
integral problem (variational formulation)
,, ,
l approximation and
discretization
l linear algebraic problem
(matricial formulation)
t numeric resolution
finite element method
FIG. 3. Schematic representation of the finite element method.
FIG. 4. Schematic representation of the transducers studied in this article. See text for more details.
(the other one is grounded), and q is the electrical charge of the nongrounded electrode.
The internal attenuation in the piezoelectric material is assumed to be isotropic and frequency independent, and we consider that the structural friction force is proportional to and in quadrature with the elastic force. Thus we may define a coefficient g such that the matrix expression of the struc- tural friction force is given by
R(U) = -- igH,, U, (7)
where the terms superimposed with the symbol are com- plex amplitudes of harmonic expressions [i.e., such as U(x,t) = U(X, co)exp( icot) ] .
The matrix model with structural damping is then writ- ten by
m '.e, -- H• . ( 8 ) Note that g-i represents the mechanical factor Qm of the piezoelectric material (see the Appendix). By means of modal analysis, the mechanical displacement response of the system to a harmonic electrical potential excitation is given by the expansion on the pure modes
U(x,t) = exp(kot) • • • Xi , (9) i= 1 1 -- r_o - / r_o i + ;•
• and X•, respectively, are the eigenvalues and the where co• eigenvectors (i.e., pure modes) of the H-type model without radiation (F= 0), without internal damping (g = 0), and with • = 0 (i.e., short-circuit condition), corresponding to the harmonic equation
(H,, -- o:M,,) •r= 0. (10) Theoretically, N is infinite; in practice, N = 15 is generally sufficient to obtain a good estimate of U(x,t).
In order to obtain a good separation between the reso- nances due to the length (L), width (W), and thickness (T) modes, we choose particular sizes for the parallelepipedic piezoelectric bars studied here. W/T--• 6 and L / W--• 10. Due to this particular geometry, and because we are mainly inter-
13 J. Acoust. Soc. Am., Vol. 84, No. 1, July 1988 Gindre eta/.' Displacement induced in a piezoelectric structure 13
Redistribution subject to ASA license or copyright; see http://acousticalsociety.org/content/terms. Download to IP: 141.217.58.222 On: Thu, 27 Nov 2014 03:49:07
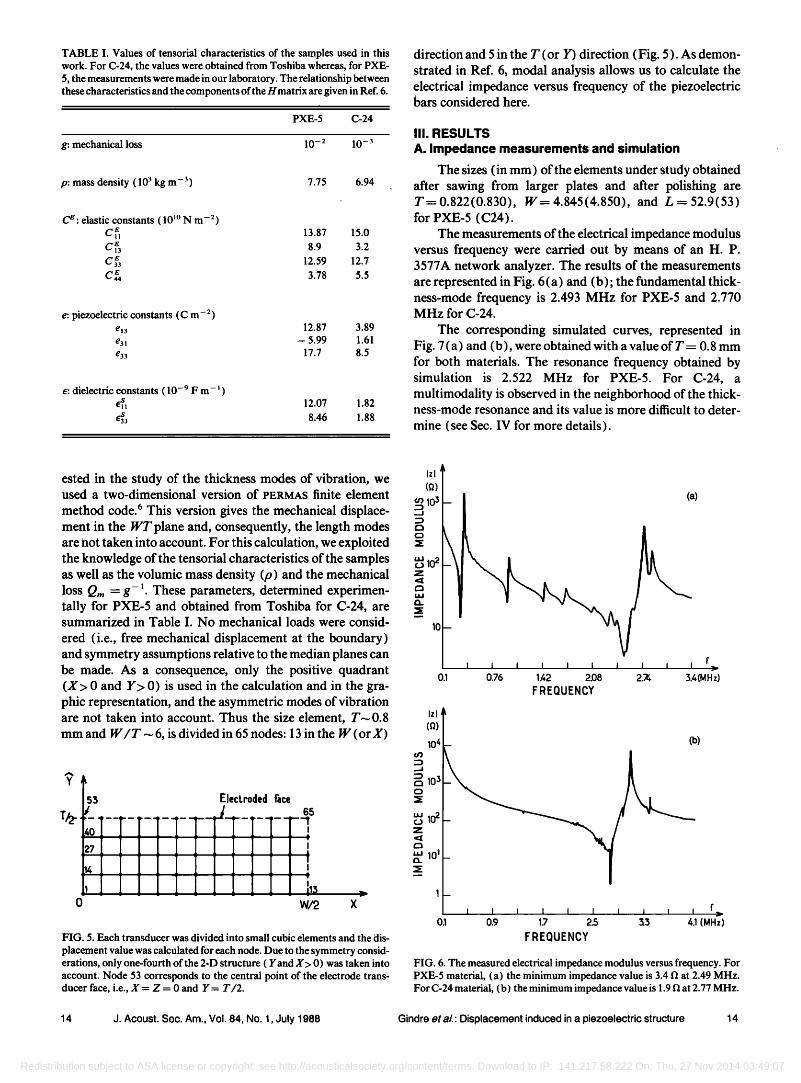
TABLE I. Values of tensoffal characteristics of the samples used in this work. For C-24, the values were obtained from Toshiba whereas, for PXE- 5, the measurements were made in our laboratory. The relationship between these characteristics and the components of the Hmatrix are given in Ref. 6.
PXE-5 C-24
g: mechanical loss 10- 2 1 O- 3
p: mass density ( 10 3 kg m- 3 ) 7.75 6.94
elastic constants ( 10 •ø N m -2) C•, 13.87 15.0 Cg 8.9 3.2 C3E3 12.59 12.7 Ce44 3.78 5.5
e: piezoelectric constants (C m- 2) ½13 12.87 3.89 ½3• -- 5.99 1.61 E33 17.7 8.5
dielectric constants ( 10 -9 F m- • ) • 12.07 1.82 43 8.46 1.88
direction and 5 in the T (or Y) direction (Fig. 5 ). As demon- strated in Ref. 6, modal analysis allows us to calculate the electrical impedance versus frequency of the piezoelectric bars considered here.
III. RESULTS
A. Impedance measurements and simulation
The sizes (in mm) of the elements under study obtained after sawing from larger plates and after polishing are T= 0.822(0.830), W= 4.845(4.850), and L = 52.9(53) for PXE-5 (C24).
The measurements of the electrical impedance modulus versus frequency were carried out by means of an H. P. 3577A network analyzer. The results of the measurements are represented in Fig. 6(a) and (b); the fundamental thick- ness-mode frequency is 2.493 MHz for PXE-5 and 2.770 MHz for C-24.
The corresponding simulated curves, represented in Fig. 7 (a) and (b), were obtained with a value of T -- 0.8 mm for both materials. The resonance frequency obtained by simulation is 2.522 MHz for PXE-5. For C-24, a multimodality is observed in the neighborhood of the thick- ness-mode resonance and its value is more difficult to deter-
mine (see Sec. IV for more details).
ested in the study of the thickness modes of vibration, we used a two-dimensional version of PERMAS finite element
method code. 6 This version gives the mechanical displace- ment in the WT plane and, consequently, the length modes are not taken into account. For this calculation, we exploited the knowledge of the tensorial characteristics of the samples as well as the volumic mass density (p) and the mechanical loss Qm = g-•. These parameters, determined experimen- tally for PXE-5 and obtained from Toshiba for C-24, are summarized in Table I. No mechanical loads were consid-
ered (i.e., free mechanical displacement at the boundary) and symmetry assumptions relative to the median planes can be made. As a consequence, only the positive quadrant (X> 0 and Y> 0) is used in the calculation and in the gra- phic representation, and the asymmetric modes of vibration are not taken into account. Thus the size element, T•0.8 mm and W/T.-.6, is divided in 65 nodes: 13 in the W (or X)
5:5 Electroded face
;--r- T-f-T- l- IIIIIIIII IIIIIIIIIII IIIIIIIIIII:,
o W/2 x
FIG. 5. Each transducer was divided into small cubic elements and the dis-
placement value was calculated for each node. Due to the symmetry consid- erations, only one-fourth of the 2-D structure ( Yand X> 0) was taken into account. Node 53 corresponds to the central point of the electrode trans- ducer face, i.e., X -- Z = 0 and Y-- T/2.
m) l
=• •o • (a)
• lO 2
I I I I I I I I i I t' 0.1 0.76 1.42 2.08 2.74 3.4(MHz)
FREQUENCY
(9)/ 104L
• lO 3
ua 10 •
1-
(b)
I I I ! I I I i I I f 0.1 0.9 1.7 2.5 .'5.3 4.1 (MHz)
FREQUENCY
FIG. 6. The measured electrical impedance modulus versus frequency. For PXE-5 material, (a) the minimum impedance value is 3.411 at 2.49 MHz. For C-24 material, (b) the minimum impedance value is 1.911 at 2.77 MHz.
14 J. A½oust. So½. Am., Vol. 84, No. 1, July 1988 Gindre et aL' Displacement induced in a piezoelectric structure 14
Redistribution subject to ASA license or copyright; see http://acousticalsociety.org/content/terms. Download to IP: 141.217.58.222 On: Thu, 27 Nov 2014 03:49:07
• 1E+03•-
ß , 1E+021--
• 1E+01
1E+00/ o 1 2
Frequenc]• (MHz)
(•)" 1E+04
E• 1E+03 -
'• 1E+02
1E+01 -
1E+00, 0
•lzl (b)
1 2
Frequency
i r (MHz)
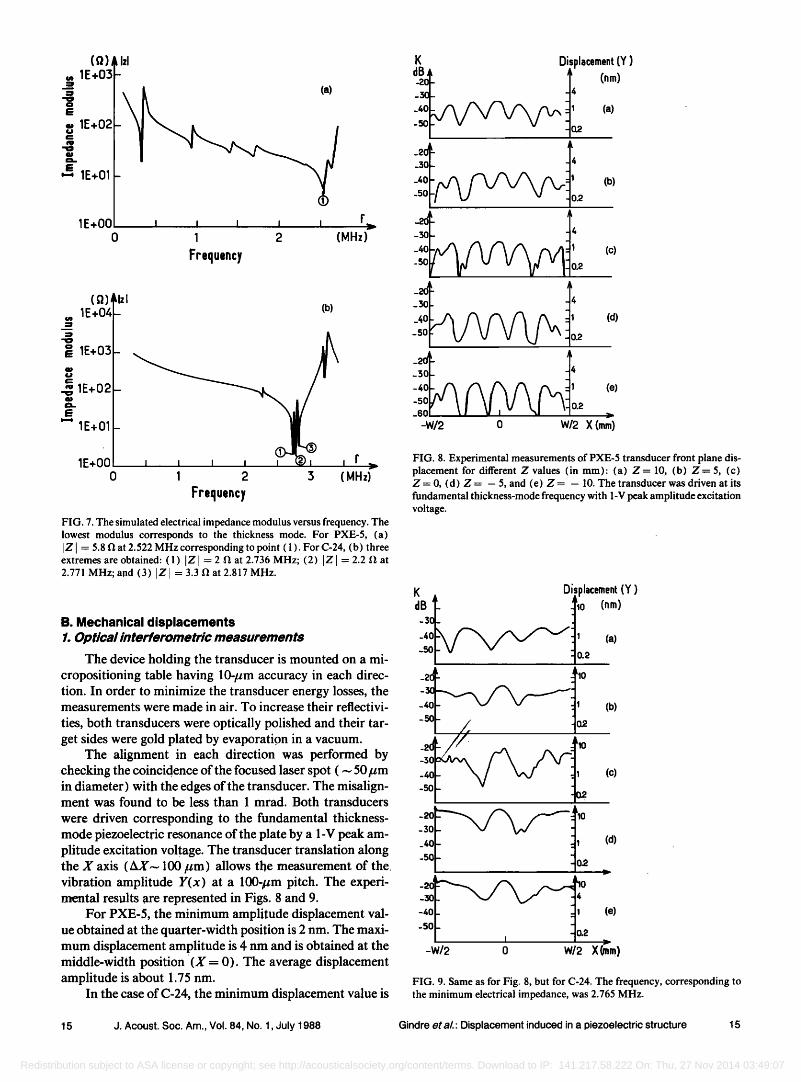
FIG. 7. The simulated electrical impedance modulus versus frequency. The lowest modulus corresponds to the thickness mode. For PXEo5, (a) IZI -- 5.8 f/at 2.522 MHz corresponding to point ( 1 ). For Co24, (b) three extremes are obtained: (1) IZI-- 2 • at 2.736 MHz; (2) Ill- 2.2 • at 2.771MHz; and (3) [Z l -- 3.3 • at 2.817 MHz.
B. Mechanical displacements 1. Optical interferometric measurements
The device holding the transducer is mounted on a mi- cropositioning table having 10-/zm accuracy in each direc- tion. In order to minimize the transducer energy losses, the measurements were made in air. To increase their reflectivi-
ties, both transducers were optically polished and their tar- get sides were gold plated by evaporation in a vacuum.
The alignment in each direction was performed by checking the coincidence of the focused laser spot ( in diameter) with the edges of the transducer. The misalign- ment was found to be less than 1 mrad. Both transducers
were driven corresponding to the fundamental thickness- mode piezoelectric resonance of the plate by a 1-V peak am- plitude excitation voltage. The transducer translation along the X axis (AX• 100/•m) allows the measurement of the vibration amplitude Y(x) at a 100-/•m pitch. The experi- mental results are represented in Figs. 8 and 9.
For PXE-5, the minimum amplitude displacement val- ue obtained at the quarter-width position is 2 nm. The maxi- mum displacement amplitude is 4 nm and is obtained at the middle-width position (X-- 0). The average displacement amplitude is about 1.75 nm.
In the case of C-24, the minimum displacement value is
K Displacement (Y)
d'•øoT • 4 (rim) ..
_20
_•0 (d) -5
.2
_2
_30 4
-40 •/-• 1 -50 .2 _6
-W/2 0
(e)
W/2 X (mm)
FIG. 8. Experimental measurements of PXE-5 transducer front plane dis- placement for different Z values (in mm): (a) Z= 10, (b) Z = 5, (c) Z -- 0, (d) Z = -- 5, and (e) Z = -- 10. The transducer was driven at its fundamental thickness-mode frequency with 1-V peak amplitude excitation voltage.
K . Displacement (Y)
d_B,o • t,o (rim)
" =1'
-4 (c)
-3ol- • • '1
50 02
-w/2 o w/2 X(mm)
FIG. 9. Same as for Fig. 8, but for C-24. The frequency, corresponding to the minimum electrical impedance, was 2.765 MHz.
15 J. Acoust. Soc. Am., Vol. 84, No. 1, July 1988 Gindre eta/.: Displacement induced in a piezoelectric structure 15
Redistribution subject to ASA license or copyright; see http://acousticalsociety.org/content/terms. Download to IP: 141.217.58.222 On: Thu, 27 Nov 2014 03:49:07
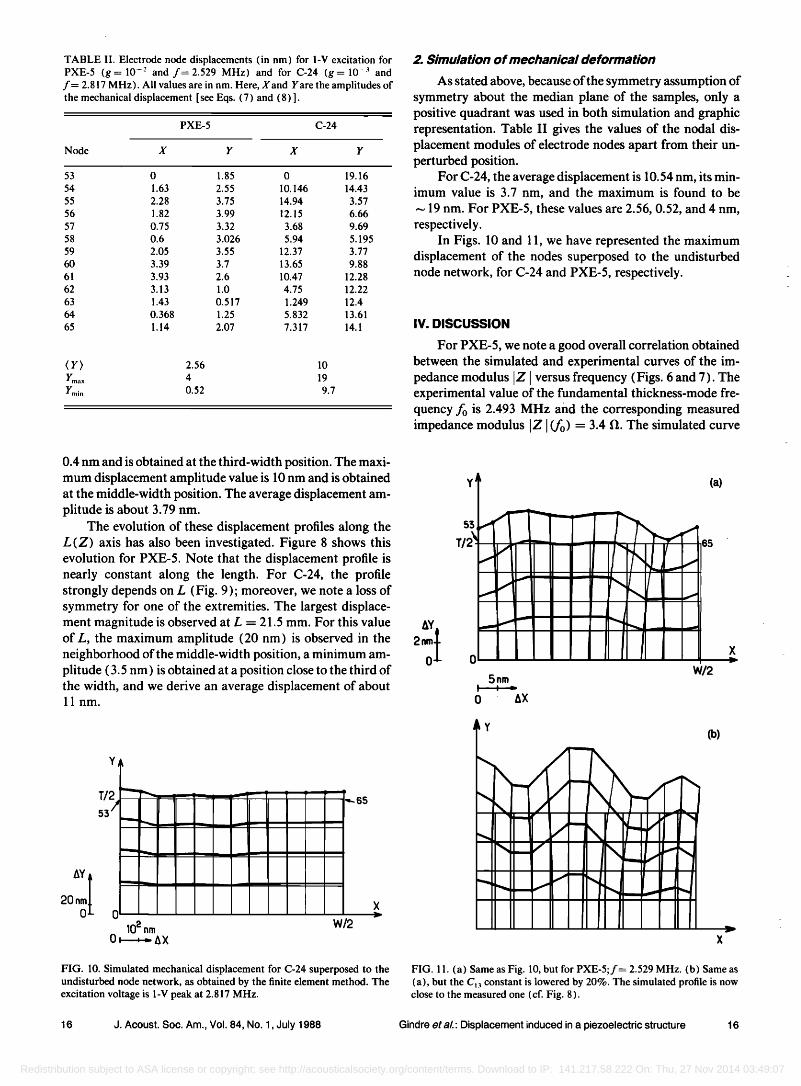
TABLE II. Electrode node displacements (in nm) for 1-V excitation for PXE-5 (g= 10 -2 and f= 2.529 MHz) and for C-24 (g= 10 -3 and f = 2.817 MHz). All values are in nm. Here, X and Y are the amplitudes of the mechanical displacement [ see Eqs. (7) and (8) ].
PXE-5 C-24
Node X Y X Y
53 0 1.85 0 19.16
54 1.63 2.55 10.146 14.43
55 2.28 3.75 14.94 3.57
56 1.82 3.99 12.15 6.66
57 0.75 3.32 3.68 9.69
58 0.6 3.026 5.94 5.195
59 2.05 3.55 12.37 3.77
60 3.39 3.7 13.65 9.88
61 3.93 2.6 10.47 12.28
62 3.13 1.0 4.75 12.22
63 1.43 0.517 1.249 12.4
64 0.368 1.25 5.832 13.61
65 1.14 2.07 7.317 14.1
(r) 2.56 10 Y. .... 4 19 Y. .... 0.52 9.7
0.4 nm and is obtained at the third-width position. The maxi- mum displacement amplitude value is 10 nm and is obtained at the middle-width position. The average displacement am- plitude is about 3.79 nm.
The evolution of these displacement profiles along the L(Z) axis has also been investigated. Figure 8 shows this evolution for PXE-5. Note that the displacement profile is nearly constant along the length. For C-24, the profile strongly depends on L (Fig. 9); moreover, we note a loss of symmetry for one of the extremities. The largest displace- ment magnitude is observed at L = 21.5 mm. For this value of L, the maximum amplitude (20 nm) is observed in the neighborhood of the middle-width position, a minimum am- plitude ( 3.5 nm) is obtained at a position close to the third of the width, and we derive an average displacement of about 11 nm.
T/2
0
10 • nm W/2 O•AX
2. Simulation of mechanical deformation
As stated above, because of the symmetry assumption of symmetry about the median plane of the samples, only a positive quadrant was used in both simulation and graphic representation. Table II gives the values of the nodal dis- placement modules of electrode nodes apart from their un- perturbed position.
For C-24, the average displacement is 10.54 nm, its min- imum value is 3.7 nm, and the maximum is found to be • 19 nm. For PXE-5, these values are 2.56, 0.52, and 4 nm, respectively.
In Figs. 10 and 11, we have represented the maximum displacement of the nodes superposed to the undisturbed node network, for C-24 and PXE-5, respectively.
IV. DISCUSSION
For PXE-5, we note a good overall correlation obtained between the simulated and experimental curves of the im- pedance modulus IZ I versus frequency (Figs. 6 and 7). The experimental value of the fundamental thickness-mode fre- quency fo is 2.493 MHz and the corresponding measured impedance modulus IZ I (f o) = 3.4 f•. The simulated curve
Y'• (a)
53,,,,•
x o o
w/2
o
FIG. 10. Simulated mechanical displacement for C-24 superposed to the undisturbed node network, as obtained by the finite element method. The excitation voltage is 1-V peak at 2.817 MHz.
FIG. 11. (a) Same as Fig. 10, but for PXE-5;f= 2.529 MHz. (b) Same as (a), but the CI3 constant is lowered by 20%. The simulated profile is now close to the measured one (cf. Fig. 8).
16 J. Acoust. Soc. Am., Vol. 84, No. 1, July 1988 Gindre eta/.' Displacement induced in a piezoelectric structure 16
Redistribution subject to ASA license or copyright; see http://acousticalsociety.org/content/terms. Download to IP: 141.217.58.222 On: Thu, 27 Nov 2014 03:49:07
leads tofo = 2.522 MHz and to [Z [ (fo) = 5.8 fl. The small discrepancy in fo values is not sensitive to the real thickness of the sample; thus, with T = 0.822 instead of 0.800 mm, the simulated value (fo = 2.46 MHz) is still at about a 3% error compared to the experimental one. The discrepancy between the measured and simulated values of IZ I (fo) remains signif- icant. This may be due to the weak frequency resolution that has been used in the present simulation and to the value of' the loss factor g that has just been estimated.
There is excellent agreement between measured and simulated values of the maximum displacement of the front surface of the PXE-5 transducer. However, the estimated
Izl
(•)
105
• 10 •
ua 103 z
ua 102
10-
0.2
- )
3 4(MHz)
FREQUENCY
105 (b)
10 3
10-
o,2 3
FREQUENCY 4 (MHz)
Izl
(•)
• 10 5
o 10 •
z • lO 3
_• lO •
lO
_ (c)
I I I I I I I I I I 0.2 3
FREQUENCY
4 (MHz)
minimum displacement is 2.5 times the measured one. This leads to an overestimation (--• 30%) of the average ampli- tude displacement. The most striking discrepancy between the simulation and the experimental data is observed when the shapes of displacement profiles are compared. Whereas the experimental measurements show a maximum displace- ment in the center of the sample, the simulated curve pre- sents a minimum at the same point. It must be pointed out, however, that a 20% variation in the piezoelectric constant C13 value used in the simulation will lead to a simulation profile close to the experimental one [cf. Fig. 11 (b) ]. Such an inaccuracy can be observed in the determination of ten-
Izl
105
10 • -
lO 3
lO_
0.2
- )
FREQUENCY
I r 4 (MHz)
Izl
(•)
• 10 5
•. lO •
z 10 3
10
_ )
I I [ I I I I I I I 0.2 3
FREQUENCY 4 (MHz)
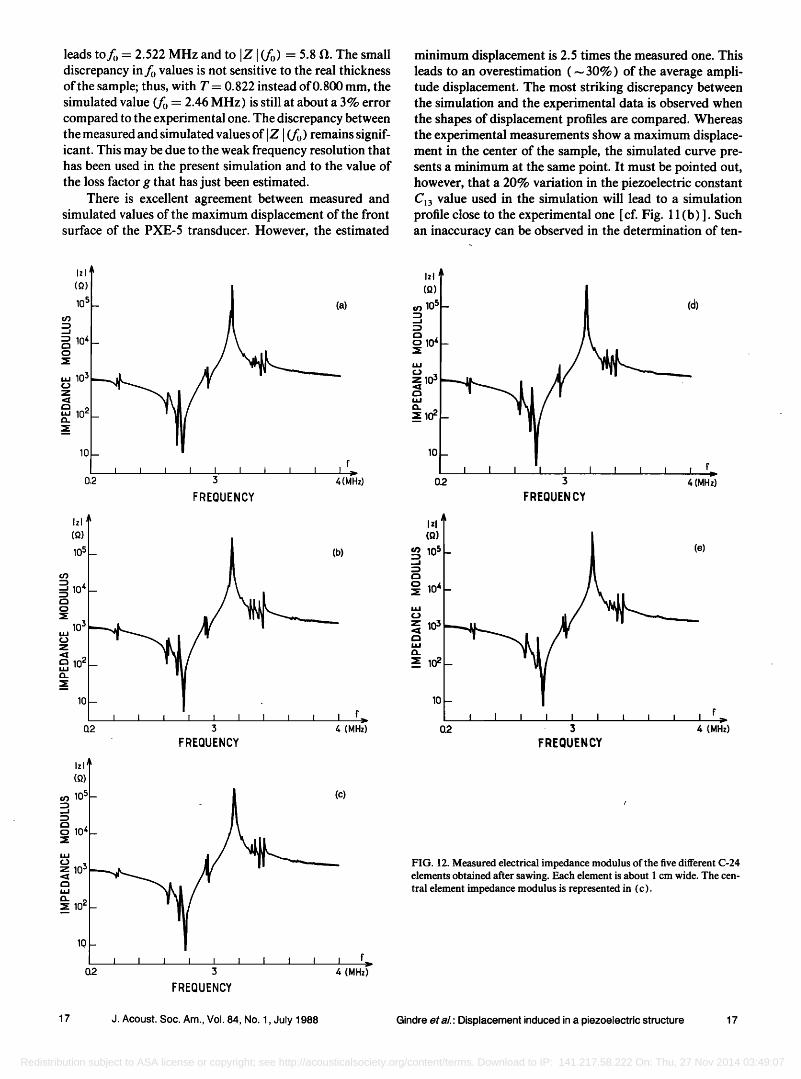
FIG. 12. Measured electrical impedance modulus of the five different C-24 elements obtained after sawing. Each element is about 1 cm wide. The cen- tral element impedance modulus is represented in (c).
17 J. Acoust. Soc. Am., Vol. 84, No. 1, July 1988 Gindre et al.: Displacement induced in a piezoelectric structure 17
Redistribution subject to ASA license or copyright; see http://acousticalsociety.org/content/terms. Download to IP: 141.217.58.222 On: Thu, 27 Nov 2014 03:49:07
sorial components of piezoelectric materials. In fact, in these measurements some of the constants like C•3 are obtained by using a combination of experimental results that are rarely determined with an accuracy better than 5%.
In the case of C-24, the shapes of displacement profiles are similar, but the measured values of displacement (Y) strongly depend on the L position. The agreement with sim- ulated values is obtained for L = 21.5 mm (i.e., 5 mm from the midposition). The measured values, rmax • 20 nm, Ymin = 3.5 nm, and (Y)•--11 nm, respectively, have to be compared with the simulated ones: Yrnax = 19 nm, Ymi. = 3.7 nm, and (Y) •-- 10.5 nm. The excellent agreement between the measured and simulated values might be fortu- nate: Indeed, because of the strong variation of the measured displacement values with L and the observed difference be- tween the simulated and the experimental curves of IZ I (f), we suspect that this transducer was made with a highly inho- mogeneous material. In order to check the validity of this hypothesis, we sawed the C-24 sample into five parts and performed impedance modulus measurements on each ele- ment.
The results presented in Fig. 12 clearly show, for each individual element, a triplet resonance frequency predicted by simulation. The position of the triplet varies from one sample to another; the triplet lowest impedance modulus moves from 2.735 MHz for sample No. 1 to 2.775 MHz for sample No. 4. This may explain the discrepancy between the measured and simulated values (Figs. 6 and 7). Roughly speaking, the C-24 material may be considered as a sum of individual, slightly different resonant networks, each with a different quality factor Q. Thus the equivalent network of the transducer under study presents a "resultant" resonance frequency leading to a simple minimum.
v. CONCLUSION
From the knowledge of piezoelectric material tensorial parameters, one can predict the behavior of parallelepipedic transducers. The predicted characteristicsmimpedance ver- sus frequency and the shape of front surface deformation of vibrating transducers--were compared with experimental values.
For both materials studied here, we observe fairly good agreement between the expected and the measured shapes of impedance versus frequency curves, and the fundamental thickness-mode resonance frequency is determined with an accuracy better than 5%. Furthermore, we have shown that any discrepancy between the predicted and the measured shape of the impedance curve strongly indicates the inhomo- geneity of the material under study, as was the case for C-24. This inhomogeneity was also detected by interferometric measurements of the vibration displacements of the trans- ducer front plane. Here again, the predicted and measured values of the maxima and minima of the amplitude of vibra-
tion_•e i•n reasonably fair agreement. The most striking dis- crepancy comes from the comparison between the simulated and measured deformation profile. The experimental mea- surements show a maximum displacement in the center of the front plane of the transducer, whereas the simulation
leads to a minimum. However, as we stated above, a vari- ation of 20% in the value of some tensorial parameters used in the simulation gives a more consistent picture of the trans- ducer vibration. Thus extreme care must be taken to avoid
any bias in the characteristics used in the simulation. In fact, 1% accuracy in the tensorial components used in the simula- tion is needed to correctly fit the experimental data. This could be done by increasing the number of one-dimensional samples used in the classical characterization method, l • and by taking into account the anisotropy of mechanical and electrical losses. 12
ACKNOWLEDGMENTS
Part of this study was founded by I. N. S. E. R. M. under Contract No. 823014 and by A. R. C. under Contract No. 6345. The authors also acknowledge the constructive re- marks of one of the referees.
APPENDIX: RELATION BETWEEN g AND @m
Here, Qm is defined as the ratio of the real and imagi- nary parts of the complex Young's modulus. 13 In the case of a free one-dimensional nonpiezoelectric material, the de- scriptive equations in the Fourier domain are
T(X, co) = C*( jco)S(x,co) , (A1)
8T(x,w) = _ w2 p U(x,w) , (A2) 8x
8U(x,w) S(x,w) = . (A3)
8x
Equation (A1) is the rheological equation and correspon- dence to the relation between the stress T(x,w) and the strain S( x,w ) , and C * (jco) = C( 1 + J/Qm ) is the complex Young's modulus, where C is the elastic coefficient and Qm the mechanical loss factor as defined previously. Equation (A2) is the mechanical balance, where p is the mass density and U(x,w) is the Fourier transform of the mechanical dis- placement. Equation (A3) is the relation between strain and mechanical displacement.
After some elementary substitutions, one gets
82U C*(jw) • = --pw2U, (A4)
8x 2
which is the one-dimensional wave propagation equation in the Fourier domain.
In terms of the finite element, 6 Eq. (A4) becomes K * U- (.o2MU = 0, (A5)
where M is the mass matrix and K * is the complex elastic stiffness matrix that can be expressed in the following form:
K* = (1 -!- 1/jQm)K, (A6)
where K is the real elastic stiffness matrix. By substitution of (A6) into (A5), we obtain
KU +j( 1/Qm )KU- ro2MU = 0. (A7)
If we consider now Eq. (8) expressed for a free (F = 0) nonpiezoelectric material (Hu, = O,Huu = Kuu ), we derive
Kuu U +jgKuu U-- ro2Muu U = 0. (A8)
18 J. Acoust. Soc. Am., Vol. 84, No. 1, July 1988 Gindre eta/.' Displacement induced in a piezoelectric structure 18
Redistribution subject to ASA license or copyright; see http://acousticalsociety.org/content/terms. Download to IP: 141.217.58.222 On: Thu, 27 Nov 2014 03:49:07
Identification between (A7) and (A8) leads to
g= I/Q,,. (A9)
On the other hand, in Eq. (A7), the friction force is (j/Q,,)KU and is related to the elastic force KU.
In piezoceramics (and contrary to piezoplastics), Q,, is independent of frequency, TM which implies that the friction force is proportional to and in quadrature with the elastic force.
•J. Donjon, "The place of ultrasonics in medical imaging," Acta Electron. 28,293 (1983).
2C. Mequio, R. H. Coursant, and P. Pesque, "Simulation of the acousto- electric response of piezoelectric structures by means of fast Fourier trans- form algorithms," Acta Electron. 28, 311 (1983).
3j. F. Gelly, A. Gardin, and C. Maerfeld, "A two dimensional model for the acoustical field generated by linear array used in B-scan echography," in Proceedings of the IEEE Ultrasonic Symposium, 27-29 October 1982, San Diego, CA (IEEE, New York, 1982), p. 805.
4R.H. Coursant, J. M. Tellier, and M. Naillon, "Characterization of piezo- electric ceramics used in multielement ultrasonic transducers for medical
imaging," in Proceedings of Ultrasonic International 85, 2-4 July 1985, London (Butterworth, Guildford, U. K., 1985), p. 563.
5R. L. Jungerman, P. Benett, A. R. Selfridge, B. T. Khuri-Yakub, and G. S. Kino, "Measurement of normal surface displacement for the characteri- zation of rectangular acoustic array elements," J. Acoust. Soc. Am. 76, 516 (1984).
6The name of the software package is PERMAS. It was derived from ASKA software and extended to piezoelectric deformation calcula-
tion by L. E. P. in collaboration with C. I. S. I. (35 Bd. Brune, 75680 Paris Cedex 14, France); cf. M. NailIon, R. H. Coursant, and F. Besnier, "Anal- ysis of piezoelectric structures by a finite element method," Acta Electron. 25(4), 341 (1983).
7For a review article, see J.P. Montchalin, "Optical detection of ultra- sound," in IEEE Trans. Ultrason. Ferroelectr. Freq. Control UFFC 33( 5 ), 485 (1986).
•See, for example, D. Boucher, M. Lagier, and C. Maerfeld, "Computation of the vibrational modes for piezoelectric array transducers using a mixed finite element-perturbation method," IEEE Trans. Sonics Ultrason. SU- 28(5), 318 (1981); O. C. Zienkiewicz, The Finite Element Method (McGraw-Hill, New York, 1977).
9p. G. Ciarlet, The Finite Element Method for Elliptic Problems (North- Holland, Amsterdam, The Netherlands, 1979).
•'P. G. Ciarlet, Introduction b l 'analyse num•rique matricielle et b l' optimis- ation (Masson et Cie Editeurs, Paris, 1982).
•R. Holland and E. P. Eer Nisse, "Accurate measurement of coefficients in ferroelectric ceramic," IEEE Trans. Sonics Ultrason. SU-16(4), 173 (1969).
•-'R. H. Coursant, P. Eyraud, L. Eyraud, M. Fink, and J. M. Tellier, "Prep- aration and characterization of lead titanate and lead metaniobate piezo- ceramic for ultrasonic tranducer design," in Proceedings of the 6th IEEE International Symposium on the Application of Ferroelectrics, 9-11 June 1986, Lehigh University (IEEE, New York, 1986), p. 442.
i3H. J. McSkimin, "Ultrasonic method for measuring the mechanical prop- erties of liquids and solids," in Physical Acoustics, edited by W. P. Mason (Academic, New York, 1964), Vol. I, part A, Chap. 4, p. 274.
i4R. a. Coursant, "Simulation of the acousto-electric response of ultrasonic narrow strip transducers with mechanical losses," in Proceedings of Ultra- sonics International 83, 12-14 July 1980, Halifax, Canada (Butterworth, Guildford, U. K., 1980), pp. 414-419.
19 J. Acoust. Soc. Am., Vol. 84, No. 1, July 1988 Gindre ot a/.: Displacement induced in a piezoelectric structure 19
Redistribution subject to ASA license or copyright; see http://acousticalsociety.org/content/terms. Download to IP: 141.217.58.222 On: Thu, 27 Nov 2014 03:49:07