mechanical behavior of biopolymer composite coatings on ... · 1 mechanical behavior of biopolymer...
TRANSCRIPT

Accepted Manuscript
Mechanical behavior of biopolymer composite coatings on plastic films bydepth-sensing indentation – A nanoscale study
Cesare Rovera, Carlo A. Cozzolino, Masoud Ghaani, Davide Morrone, RichardT. Olsson, Stefano Farris
PII: S0021-9797(17)31278-XDOI: https://doi.org/10.1016/j.jcis.2017.10.108Reference: YJCIS 22978
To appear in: Journal of Colloid and Interface Science
Received Date: 5 July 2017Revised Date: 24 October 2017Accepted Date: 29 October 2017
Please cite this article as: C. Rovera, C.A. Cozzolino, M. Ghaani, D. Morrone, R.T. Olsson, S. Farris, Mechanicalbehavior of biopolymer composite coatings on plastic films by depth-sensing indentation – A nanoscale study,Journal of Colloid and Interface Science (2017), doi: https://doi.org/10.1016/j.jcis.2017.10.108
This is a PDF file of an unedited manuscript that has been accepted for publication. As a service to our customerswe are providing this early version of the manuscript. The manuscript will undergo copyediting, typesetting, andreview of the resulting proof before it is published in its final form. Please note that during the production processerrors may be discovered which could affect the content, and all legal disclaimers that apply to the journal pertain.

1
Mechanical behavior of biopolymer composite coatings on
plastic films by depth-sensing indentation – A nanoscale study
Cesare Rovera,a Carlo A. Cozzolino,
a Masoud Ghaani,
a Davide Morrone,
b,c Richard T. Olsson,
d
Stefano Farrisa,e,*
a DeFENS, Department of Food, Environmental and Nutritional Sciences—Packaging Division,
University of Milan, via Celoria 2 – 20133 Milan, Italy
b R&D srl Tecnologie dei Materiali, Galleria Gandhi, 2 – 20017 Mazzo di Rho, Italy
c Nanovea Inc., 6 Morgan, Ste 156, Irvine, CA – 92618, USA
d Department of Fibre and Polymer Technology, School of Chemical Science and Engineering,
KTH Royal Institute of Technology, Teknikringen 56, SE-100 44 Stockholm, Sweden
e INSTM, National Consortium of Materials Science and Technology, Local Unit University of
Milan, via Celoria 2 – 20133 Milan, Italy
*Corresponding author. Tel.: +39 0250316654; Fax: +39 0250316672
E-mail address: [email protected] (S. Farris)
_________________________________________________________

2
ABSTRACT. Fundamental physical behaviors of materials at the nanoscale level are crucial when
local aspects govern the macroscale performance of nanocomposites, e.g., interface and surface
phenomena. Because of the increasing interest in biopolymer nanocomposite coatings for many
different applications (e.g., optical devices, displays/screens, and packaging), this work investigates
the potential of nanoindentation as a method for clarifying the interplay between distinct phases
(i.e., organic and inorganic) at local level in thin biopolymer films loaded with nanoparticles. The
nanomechanical features of pullulan nanocomposite coatings laid on polyethylene terephthalate
(PET) were quantified in terms of elastic modulus (E), hardness (H), and creep (C) through an
instrumented indentation test composed of a loading-holding-unloading cycle. Colloidal silica (CS)
and cellulose nanocrystals (CNCs) were used as spherical and rod-like nanoparticles, respectively.
An overall reinforcing effect was shown for all nanocomposite coatings over the pristine (unfilled)
pullulan coating. A size effect was also disclosed for the CS-loaded surfaces, with the highest E
value recorded for the largest particles (8.19 ± 0.35 GPa) and the highest H value belonging to the
smallest ones (395.41 ± 25.22 MPa). Comparing CS and CNCs, the addition of spherical
nanoparticles had a greater effect on the surface hardness than cellulose nanowhiskers (353.50 ±
83.52 MPa and 321.36 ± 43.26 MPa, respectively). As for the elastic modulus, the addition of CS
did not provide any improvement over both the bare and CNC-loaded pullulan coatings, whereas
the coating including CNCs exhibited higher E values (p < 0.05). Finally, CS-loaded pullulan
coatings were the best performing in terms of C properties, with an average indentation depth of
16.5 ± 1.85 nm under a load of ~190 μN. These results are discussed in terms of local distribution
gradients, surface chemistry of nanoparticles, and how nanoparticle aggregation occurred in the dry
nanocomposite coatings.

3
KEYWORDS: aggregation; biopolymer; cellulose nanocrystals (CNCs); coating; interface;
nanoindentation; nanocomposite; phase separation; pullulan; surface

4
1. Introduction
The progress in indentation testing over the past thirty years has allowed indentation to be
routinely performed on “nano” scales [1]. Nanoindentation, also referred to as “depth-sensing
indentation” (DSI), is nowadays a widely applied technique for the measurement of the mechanical
properties and behavior of material surfaces in the nanoscale range. After metals and ceramics, the
application of instrumented indentation techniques to nontraditional materials such as polymers and
biological materials has rapidly increased in the last decade [2]. Hardness and elastic modulus are
the main properties derived from a nanoindentation experiment. However, a variety of additional
physico-mechanical information can be gathered, including creep parameters, fracture toughness,
and residual stresses [3]. Recent progress in instrument engineering has made it possible to achieve
unprecedented performance in current apparatuses, overcoming previous bottlenecks, such as time-
consuming experiments and extensive calibration procedures [4]. For this reason, nanoindentation
now finds wide application not only in academia and research laboratories but also for quality
control in mass production industries, such as semiconductors, aerospace, micro electro-mechanical
systems (MEMS), monitors, optoelectronics, and, more recently, biological materials and food
products [3].
The most attractive feature of nanoindentation is its capability to provide detailed information
from a high local deformation (most used indenter tips have an area of approximately 0.0032 μm2)
[5], which is of great importance for systems with limited dimensionality, e.g., thin films and
coatings [6]. With the continuously emerging nanotechnologies in polymer manufacturing and
processing, nanoindentation has also become a necessary tool for the characterization of
nanostructured and nanocomposite polymeric materials. Not only does nanoindentation permit
identification of transition zones between phases in heterogeneous materials, but it has also been
proven to be a valuable technique to investigate filler content and size [7], filler dispersion [8], and,
in particular, adhesion at the nanofiller-polymer matrix interface at very low sensitivity ranges [9].

5
Moreover, the interest in the synthesis of biomimetic materials (e.g., synthetic skins [10], artificial
cell systems [11], and nanotextured implants [12] and functional particles [13]) has demonstrated
nanoindentation as the ideal method for probing local gradients and heterogeneities in natural
materials and for examining their hierarchical and multiscale organization. Nanoindentation can
therefore be expected to be a very useful method in the evolving field of bio-based polymer
nanocomposite systems that serve to replace oil-based polymers with polymers partially or totally
obtained from renewable resources because these systems often exhibit novel unexplored material
interactions at the surface of the nanophase. Within the field of biopolymer-based systems, the
development of biocomposite thin films and coatings incorporating nanobuilding blocks (NBBs)
has dramatically increased in recent years. In particular, the deposition of high-performance
bionanocomposite coatings on plastic films is emerging in different fields (e.g., optical devices,
displays and screens, and food packaging) to achieve extra benefits over conventional fillers while
fulfilling recent trends toward “green” strategies [14,15]. In these systems, the properties of the
nanocomposite layer depend largely on the interaction between the matrix and the filler [16]. Lack
of affinity at the interface between the two phases (biopolymer network and nanofiller) can possibly
arise for a number of reasons, such as chemical heterogeneity, thermodynamic incompatibility,
physical hindrance, molecular arrangements, etc. These can eventually lead to diverse undesirable
phenomena, e.g., interfacial de-bonding, phase segregation, filler aggregation/re-agglomeration, and
increase in void content, which may in turn dramatically affect the material’s performance in terms
of permeability of gases and vapors (increase in the diffusion coefficient) [17], mechanical integrity
(crack formation and propagation) [18], optical properties (scattering centers) [19], dielectric
performance (charge accumulation) [20], and thermal stability [21]. Therefore, the design of
nanocomposite coatings would benefit from a fast and robust technique that enables the quantitative
description of the mechanical performance on a nanoscale. However, to achieve this goal, it is
crucial to prevent any potential influence of the supporting substrate, which might happen
especially when thin and soft matters (e.g., most biopolymer coatings) with viscoelastic behavior

6
are deposited on stiffer substrates, such as plastic films. Making sure to obtain reliable information
uniquely related to the coating alone in nanoindentation experiments is thus indispensable to avoid
misleading results and misinterpretation of the coatings’ performance.
In this work, we report for the first time on nanoindentation experiments on biopolymer
nanocomposite coatings on a plastic film in an attempt to quantitatively assess the suitability of this
technique for this special case of double-layered systems (i.e., flexible plastic substrate and thin
biopolymer nanocomposite coating). More specifically, pullulan was used as a biopolymer phase
due to its striking features in terms of high flexibility and optical properties, which are due to its
fully amorphous organization [22,23]. Because of its uncharged nature, pullulan is able to interact
with polar counterparts (e.g., particles, polymers, etc.) bearing a positive, negative, or neutral
charge through ion-dipole and dipole-dipole (e.g., hydrogen bond) interactions. In addition, pullulan
aqueous solutions are stable over a broad range of pH, thus expanding the possibility to use this
biopolymer in different media. Colloidal silica (CS) and cellulose nanocrystals (CNCs) were used
as representative spherical and rod-like NBBs, respectively. Both particles find widespread use for
many different applications as nanoscale reinforcing fillers [24,25]. CS is used in papermaking,
packaging, construction, electronics, photography, metal casting, and in the production of paints,
beverages, and polishes [26], especially due to its optical (transparency and refractive index),
mechanical (scratch resistance), and thermal properties [27]. For example, addition of the silica
nanoparticle to the low-k organic thermosets has been demonstrated to enhance both the modulus
and the hardness while reducing the coefficient of thermal expansion of the resultant transparent
nanocomposite thin films [28]. Since the last decade, the interest in CNCs has dramatically
increased for a number of applications relevant to the fields of material science and biomedical
engineering due to its renewable nature, anisotropic shape, remarkable mechanical properties, good
biocompatibility, tailorable surface chemistry, and excellent optical properties [29]. CNCs have
been used to obtain transparent films, flexible displays, biomedical implants, fibers and textiles,
separation membranes, batteries, supercapacitors, and electroactive polymers [30]. Recently,

7
nanocellulose has been shown to have great potential to produce flexible, transparent, smooth, and
thermally stable substrates for printed electronics [31]. Polyetylene terephthalate (PET) film was
used in this work as a plastic substrate because of its widespread use, e.g., for the manufacturing of
flexible thin film cells for photovoltaic panels and as a first-choice material for a number of food
and pharmaceutical packaging applications.
Here, we demonstrate that nanoindentation can be advantageously used for the
nanomechanical characterization of thin coatings laid on a plastic film, enabling discrimination
between the contribution of substrate and coating on the mechanical parameters for specific loading
regimes. In addition, nanoindentation provides clear evidence of the reinforcing effect of NBBs on a
local scale, while simultaneously allowing the identification of nanofiller types in a reliable fashion.
2. Theoretical background
In a typical nanoindentation experiment, a “loading-holding-unloading” cycle is carried out
and a “loading vs. depth” plot obtained (Fig. 1a). Three-sided pyramid indenters (e.g., Berkovich
identers) find wide application due to geometrical reasons (e.g., self-similarity) and higher spatial
resolution over other shapes [32]. The “compliance” method is frequently used to calculate hardness
(H) and elastic modulus (E), relying on a number of theoretical models that assume a solely elastic
behavior of the material during unloading (while deformation during loading is assumed to be both
elastic and plastic). The Oliver and Pharr (OP) method is the most widely accepted nowadays [33].
Especially for elastic-plastic materials with limited pile-up (e.g., biopolymers), the OP method has
been demonstrated to work better than other approaches for data treatment, becoming a primary
technique for the mechanical investigation of thin films and small structural features [34]. For this
reason, the OP method is integrated in the software-assisted procedure of most instrumental DSI
equipment.

8
A cross-section of an indentation along with the parameters used in the OP theory is shown in
Fig. 1b. According to the power law method [32], the upper portion of the unloading curve can be
described by a power law relationship:
where P is the test load, hmax is the maximum indentation depth at the maximum loading (Pmax), hf is
the permanent (or residual) indentation depth after the removal of the test force (plastic
displacement), α is a constant, and m is a power law fitting constant related to material
characteristics. For Berkovich identers, m generally varies from 1.25 to 1.51. Note that the
difference hmax – hf represents the elastic component of the displacement, i.e., the amount of
displacement that is recovered by the material upon unloading (Erec, Fig. 1b). hf, α, and m are
unknown quantities that can be determined by an initial second-degree fitting followed by an
iterative procedure based on a least squares approach [3]. The slope of the initial (upper 10% to
50% of Pmax) unloading curve intersecting the depth axis at hc (see Fig. 1a) is defined as stiffness
(S):
The analysis of the first portion of the unloading part of the “load vs. displacement” curve can be
used to calculate the reduced modulus (Er), as defined by the following equation:
where the β parameter is a correction factor that, for Berkovich identers, has a value ranging
between 1.0226 and 1.085, with 1.05 being the most suitable value for most materials [34]; A is the
projected contact area determined from the indenter tip calibration. For a perfect Berkovich identer,
A = 24.5 hc2, with hc (contact depth) defined as:

9
where hmax is the maximum displacement (see Fig. 1a, b) and ε is a geometrical constant related to
the shape of the indenter [35]. In particular, ε = 0.72 for conical indenters, whereas it equals 0.75
and 1.00 for the paraboloid of revolution and flat punches, respectively. It is noted that the term (ε
Pmax)/S represents hs in Fig. 1b, namely the displacement of the surface at the perimeter of the
contact.
After gathering S and A from the indentation curve, the elastic modulus of the material (E) is
derived using the following equation:
where ν and νi are the Poisson’s ratio of the material and the indenter, respectively, whereas Ei is the
elastic modulus of the indenter. Finally, the hardness (H) of the material can be calculated as:
Of interest is also the calculation of the components of the indentation work. The total mechanical
work due to the indentation (Wtot) is composed of two terms, namely the plastic (irreversible)
deformation work (Wplast) associated with the first loading part and the elastic (reversible)
deformation (Welast) owing to the removal of the test load (second part of the indentation curve), so
that Wtot = Wplast + Welast (Fig. S1 of Supporting Information). By integrating the loading and
unloading curves, it is easy to gather Wtot and Wplast and, by subtracting the latter from the former,
Welast can be eventually determined. The elastic contribution of the total indentation work (η) is then
calculated as:

10
In addition, the creep of a material (C) can be obtained keeping the test loading constant for a
defined time span and calculating the change of the indentation depth as follows:
where h1 is the indentation depth at the start of the pause and h2 is the indentation depth at the end
of the pause.
3. Experimental
3.1. Materials
Pullulan powder (PF-20 grade, Mn ~200 kDa) was purchased from Hayashibara Biochemical
Laboratories Inc. (Okayama, Japan). Bindzil®
15/500 (particle size: 5 nm; polydispersity index:
22.5%; dry matter: 15 wt%; specific surface area: 500 m2 g
–1 at pH = 10.0), Bindzil
®15/750
(particle size: 4 nm; polydispersity index: 22.4%; dry matter: 15 wt%; specific surface area: 750
m2g
–1 at pH = 10.5), and Bindzil
® 2034 DI (particle size: 15 nm; polydispersity index: 27.3%; dry
matter: 34 wt%; specific surface area: 200 m2g
–1 at pH = 2.8) colloidal silica nanoparticle water
dispersions were purchased from AkzoNobel (Amsterdam, Netherlands) and coded as CS15/500,
CS15/750, and CS2034, respectively. Cellulose nanocrystals (CNCs) were obtained by acid catalyzed
hydrolysis according to the method used within our laboratory as described in a previous work [36].
The main physicochemical characteristics of the CNCs used in this work are fully described in
previous papers [36–38]. One-side corona-treated PET A-410 (JBF RAK LLC, Ras Al Khaimah,
United Arab Emirates) 12.0 ± 0.5 μm thick was kindly supplied by Metalvuoto spa (Roncello,
Italy).
3.2. Methods and characterization
3.2.1. Coating preparation

11
A pristine pullulan solution (10.0 wt% wet basis), coded as P, was prepared by mixing the
pullulan powder in cold water under gentle stirring (500 rpm) for 1 h at room temperature. Pullulan-
colloidal silica dispersions were prepared by addition of an aliquot of the raw CS water dispersion
in the pullulan solution so that a final CS concentration of 3 wt% (wet basis on the total weight, i.e.,
30 wt% with respect to dry pullulan) was achieved for the three samples (i.e., P-CS15/500, P-CS15/750,
and P-CS2034). In the same way, an aliquot of a freshly prepared CNC water dispersion was added to
the pullulan solution to obtain a final CNC concentration of 0.3 wt% (wet basis on the total weight,
i.e., 3.6 wt% with respect to dry pullulan) for the sample P-CNC. After mixing for 24 h at 500 rpm
and 25 °C, all the formulations were left to rest for an additional 24 h before coating deposition.
Milli-Q water (18.3 MΩ·cm) was used throughout the experiments.
3.2.2. Coating deposition
The deposition of the water dispersions on the corona-treated side of PET was performed using
an automatic applicator (AB 3400, TQC B.V., Capelle aan den Ijssel, The Netherlands) in
accordance with the ASTM D823-07, Practice C, at a constant speed of 150 mm min−1
. In order to
reset any possible difference arising from the different concentrations of the water dispersions,
Mayer rods with selected engraved patterns were used. Two type B infra-red (IR) lamps of 1440 W
(Helios Italquartz srl, Cambiago, Italy) in combination with a constant and perpendicular flux of
mild air (25.0 ± 0.3 °C for 2 min) at a distance of 40 cm from the applicator were used for solvent
evaporation. A final dry thickness of 3.5 m was achieved for all five dry coatings. All coated films
were stored in a polycarbonate vacuum (-0.06 MPa) desiccator (Lab Companion line, Jeio Tech
Co., Ltd., Daejeon, South Korea) under dry conditions for an additional two weeks before analyses.
3.2.3. Indentation test
The nanoindentation test was performed with a PB1000 Nanovea Mechanical Tester equipped
with a Nano Module (Nanovea, Irvine, CA, USA). The use of the advanced Nano Module allowed

12
us to apply very low target loads, in the range of [40 µN – 400 mN], using a piezo driver while
monitoring the load with an independent load cell and fine recording the position of the indenter
inside the material with an independent capacitive depth sensor. A multichannel 24-bit acquisition
card controlled every sensor and actuator. The samples were glued on sample holders and let dry for
30 minutes before testing in the environment enclosure of the instrument at 23 °C and 40% RH. For
soft, thin film, it is important to apply very low loads and be able to monitor the position while
applying, holding, and unapplying the load. To define the parameter of the test, we applied the
widely adopted 10% rule [4]. Accordingly, in order to minimize the effect of the substrate
properties of the measurement of the film properties, the indentation depth should be no more than
10% of the film thickness. This rule has its basis in the determination of hardness testing, where the
intention is to restrict the extent of the plastic zone to the film material. To demonstrate the absence
of any interference of the PET substrate on the coating’s properties, we first gathered the hardness
value (H, MPa) of the PET-coated surfaces (i.e., both the coating surface and the PET surface) and
of the bare (i.e., uncoated) PET surface through nanoindentation tests with the following testing
conditions: maximum load 0.2 mN; indentation depth 120 nm; and loading/unloading rate 800
μN/min. Second, we performed the same test as above but at different maximum loadings (0.1 mN,
0.2 mN, 0.3 mN, 0.5 mN, 0.7 mN, 1.0 mN, and 1.2 mN), with the goal of pinpointing the depth
boundary for an independent measurement of the coating’s nanomechanical properties.
To evaluate both the mechanical properties and distribution effects (e.g., the uniformity of the
fillers in the polymeric matrix or the presence of surfacing nanoparticles), and taking into account
the morphological differences between the fillers, two different test conditions were set, as reported
in Table 1. A reference sample of a pure pullulan film was used in both steps. In step 1, the tests
were performed in a matrix of 10×8 indentations with a spacing of 0.3 µm in depth control at the
maximum depth of 40 nm. In this way, we made sure that the indentations were reciprocally
independent, i.e., the area on each individual indentation cycle was not influenced by the previous
cycle. In step 2, because of the larger average size of the fillers, we decided to perform the tests in a

13
matrix of 6×6 indentations with a spacing of 1 µm in load control at a maximum load of 200 µN.
Poisson’s ratio of the material (ν) and the indenter (νi) were fixed at 0.3 and 0.2, respectively.
3.2.4. 2D and 3D plots of mechanical data
2D and 3D maps of elastic modulus (E, GPa), hardness (H, MPa), and creep (C, nm) were
obtained using the command-line driven graphing utility Gnuplot 5.0. In the maps, different colors
denote different values of the investigated parameter (E, H, or C) as collected from the matrix of the
indentation tests. Therefore, each plot carries only the information related to the mechanical
properties of the material in each testing site for the chosen matrix, i.e., the mechanical properties of
the testing area for each material.
3.2.5. ζ-potential of nanoparticles
Nanocolloidal dispersions were characterized in terms of electrokinetic potential through phase
analysis light scattering (PALS) technology using a particle analyzer Litesizer 500 (Anton Paar,
Graz, Austria). ζ-potential (mV) and conductivity (mS/cm) of “as-received” nanocolloidal water
dispersions were determined at 25.0 ± 0.1 °C by means of a 35 mW diode laser (λ = 658 nm) and at
a 15° detection angle.
3.2.6. Statistical analysis
The statistical significance of the differences in films’ properties and behavior was determined
via one-way analysis of variance using StatgraphicsPlus 4.0 software (STSC, Rockville, MD,
USA). The mean values, where appropriate, were separated by a least significant difference (LSD)
multiple range test at p < 0.05.
4. Results and Discussion
4.1. Influence of the plastic substrate

14
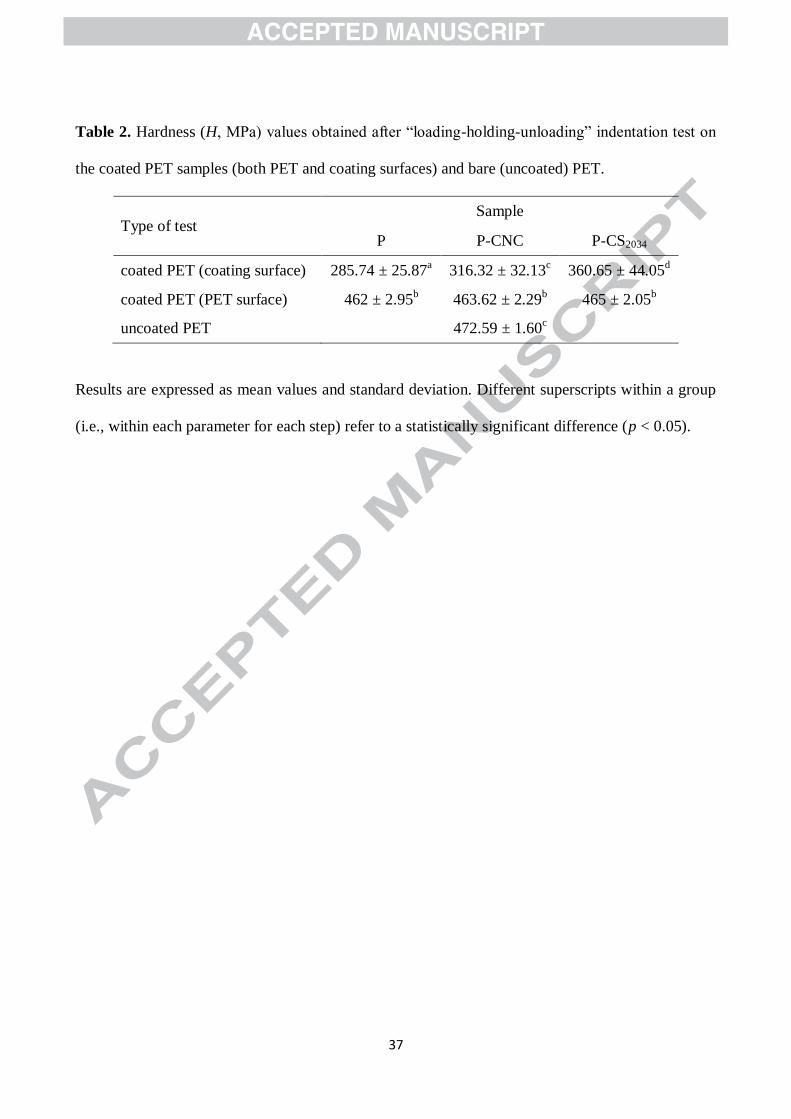
A first set of experiments was carried out on the coated PET samples and bare PET. The hardness
values of the coatings, of the PET surface supporting the coating, and of the bare PET are reported
in Table 2. For the three coating surfaces, H was significantly lower compared to the same
parameter calculated for the plastic substrate. Interestingly, the bare PET surface exhibited a higher
H value compared to the same surface coated with the three different coating formulations (i.e., P,
P-CNC, and P-CS2034). A tentative explanation for this observation could be related to the
absorption of water molecules by the PET upon coating deposition, with subsequent deterioration of
the mechanical performance of the plastic material.
In order to clarify the effect of the indentation loading, the indentation test described above
was repeated using the same setting, but at seven different loads. The values of H and the
penetration depth as a function of the maximum loads for the coating P-CNC are displayed in Fig.
2. The S-shaped plot indicates that for low loadings (i.e., 0.1 mN and 0.2 mN) the value of hardness
(~ 31 MPa) solely relates to the coating. In other words, even a 100% increase in the load applied
on the coating surface did not affect the final H value significantly (while a significant increase in
the penetration depth from 116.7 nm to 155.5 nm was observed). As the loading values were
increased, a convolution of the effect “substrate + coating” was disclosed by approaching the H
value of the substrate (~ 470 MPa). Indeed, for loads > 0.3 mN, the recorded values of H exceeded
500 MPa, suggesting the reinforcing effect of the coating on the hardness performance of the
material. Eventually, a plateau was reached when the H values did not change any longer for any
further increase in the load applied (at least within the maximum loading range investigated).
It can therefore be concluded that the indentation test is able to discriminate between plastic
substrate and coating, provided that an adequate setup is appropriately fixed. More specifically, for
indentation loads < 0.2mN and penetration depths < 155 nm, the nanomechanical behavior of the
coating is independent from the substrate. Above those values, the influence of the substrate starts
to affect the overall measurement, leading to an overestimation of the hardness of the coating.

15
4.2. First step – size effect
In the first step of the experiment, we compared the pristine pullulan coating and the
bionanocomposite coatings P-CS15/500 and P-CS15/750 in order to test the capability of the
nanoindentation approach to i) detect differences arising from the addition of the silica
nanoparticles in the main biopolymer phase and ii) discriminate between nanoparticles of the same
shape but different size and surface area (4 and 5 nm, with 500 and 750 m2/g, respectively). The
“load-penetration depth” curves of samples P, P-CS15/500, and P-CS15/750 are displayed in Fig. S2 of
Supporting Information. From these curves, which are typical of elastic-plastic modes of
deformation, both E (GPa) and H (MPa) parameters were calculated for the three coating samples,
as reported in Table 3. There was a significant difference between the three samples as far as both E
and H are concerned. In particular, sample P exhibited the lowest hardness and elastic modulus
values, while sample P-CS15/500 showed the highest elastic modulus and sample P-CS15/750 showed
the highest hardness. This was reflected in the final total work induced by the indentation on the
samples’ surfaces (Fig. 3a), with Wtot equal to 0.228 ± 0.014 pJ, 0.284 ± 0.016 pJ, and 0.314 ± 0.020
pJ for samples P, P-CS15/500, and P-CS15/750, respectively. It is interesting to note that the elastic part
of the indentation work (η) scaled proportionally with Wtot values (Fig. 3b), accounting for ~ 27%, ~
31%, and ~ 34% of the total work for samples P, P-CS15/500, and P-CS15/750, respectively.
For a better interpretation of these results, we have generated the 3D plots of H distribution on
a representative surface of 2.70×2.10 μm2
for the three samples (Fig. 4). There is an obvious
difference between the bare pullulan coating on one hand and the two nanocomposite coatings on
the other hand, the former having a more even (besides lower) hardness distribution compared to
the composite formulations. Irrespective of the type of particles loaded in the main biopolymer
phase, the addition of colloidal silica had a significant reinforcing effect on the matrix, as
demonstrated by the overall increase of H values (compare the green background of samples P-
CS15/500 and P-CS15/750 with the blue background of sample P). Furthermore, the surface of sample
P-CS15/500 (Fig. 4, center) revealed a more homogeneous distribution of the nanoparticles compared

16
with sample P-CS15/750 (Fig. 4, right), which exhibited a more spiked pattern. Apparently, the
addition of smaller particles with higher surface area drove the formation of larger domains
separated from the main biopolymer matrix. The extensive clustering observed for sample P-
CS15/750 is therefore suggested to explain its higher hardness values. These results confirm previous
findings on the effect of CS nanoparticles loaded in fossil-based polymer matrices [5]. Overall, the
reinforcing effect of CS nanoparticles observed in this work is within the same order of magnitude
as the values recorded for both thermoset (e.g., epoxy and polyacrylates) and thermoplastic
matrices. As far as the latter are concerned, Bhattacharya and Chaudhry fabricated biocompatible
nanocomposites made of silica-reinforced poly (vinyl alcohol (PVA) [39], to which pullulan has
been approached for many different physicochemical properties [40]. The highest indentation
modulus of 8.1 GPa was in line with the P-CS samples tested in this study. However, this value was
obtained for the nanocomposite with 54.6 wt% nanosilica, whereas E for the nanocomposite with
28.1 wt% silica (i.e., a concentration similar to that used in this study) decreased to 3.4 GPa. This
difference can be first explained considering the very low E value (0.3 GPa) found for the neat
polymer (PVA) compared with the pristine pullulan coating tested here (~ 6.3 GPa). In addition, the
authors used 80 nm average diameter silica nanoparticles and poly(allylamine hydrochloride)
(PAH) as a counter ion of the negatively charged silica nanoparticles to prevent their aggregation.
4.3. Second step – shape effect
In the second part of our investigation, we carried out a series of experiments to compare the
impact of rod-like and spherical nanoparticles (cellulose nanocrystals and colloidal silica,
respectively) on the main pullulan phase. The E and H values extrapolated from the “load-
displacement” indentation curves for the three different coatings are reported in Table 3. There was
a significant difference between the three samples with regard to the H parameter. While the bare
pullulan coating (sample P) was the softer one, the addition of spherical nanoparticles (sample P-
CS2034) apparently had a greater effect on the surface hardness compared to the cellulose
17
nanowhiskers (sample P-CNC). However, the same conclusion cannot be drawn for the E parameter
because the addition of colloidal silica did not result in any apparent improvement compared with
both the bare pullulan coating and the coating loaded with CNCs. Conversely, the P-CNC coating
exhibited E values significantly higher than P, reflecting the high elastic modulus of CNCs (the
average value being around 130 GPa) [41], which is one of the most attractive mechanical features
of these nanoparticles [42]. We have explained these results in terms of the different distribution of
the NBBs within the main biopolymer matrix. Regarding to this scope, we have generated 2D maps
of the three parameters quantified within this second step of the investigation—namely, elastic
modulus, hardness, and creep—on representative 6 × 6 μm2 surfaces for the three samples (Fig. 5).
If we look at the maps of H, which better reflects the local distribution of the individual phases (i.e.,
biopolymer and NBBs), we can notice the well-defined “two-color” pattern for sample P-CS2034
(row b, right column of Fig. 5) compared to the evenly colored pattern of sample P (row b, left
column of Fig. 5) and the randomly colored pattern of sample P-CNC (row b, center column of Fig.
5).
Such a “two-color” pattern stems from a nonuniform distribution of CS nanoparticles, which
in turn gives rise to local aggregation and clustered silica domains (the “down” orange part of the
panel) as compared with unloaded (i.e., pristine) pullulan regions (the “up” violet part of the panel).
This behavior, which was not observed for the colloidal silica nanoparticles used in the first step of
this work, was detected throughout the indentation experiments on the P-CS2034 surface. This
apparent discrepancy between CS types, besides the size effect of the starting spherical particles,
can be plausibly explained in terms of surface chemistry. While CS15/500 and CS15/750 are anionic
nanoparticles (i.e., the net negative charge can play a role in preventing cluster formation, or
aggregation), CS2034 are zero-charge nanoparticles (i.e., particle aggregation by, e.g., hydrogen
bonding is favored). More specifically, the measured ζ-potential of the CS15/500 and CS15/750
colloidal dispersions was – 45.9 ± 1.1 mV and – 15.2 ± 0.7 mV, whereas the ζ-potential of the

18
CS2034 sample was – 1.8 ± 0.3 mV (see Fig. S3). The different electric behavior of the three
colloidal silica nanoparticles is also confirmed by the conductivity values, which were equal to
4.417 mS/cm, 7.010 mS/cm, and 0.599 mS/cm according to the light scattering experiments. This
would explain a co-continuous structure with that of pullulan for CS15/500 and CS15/750 nanoparticles
on one hand a more clustered morphology due to small aggregates for CS2034 nanoparticles. The
impact of the nanoparticle distribution on the local mechanical properties of the nanocomposite
coatings is further evidenced if one considers the contribution of the two distribution regions on the
overall value of both E and H. As clearly shown in Fig. 6, the “up” part of the panel (namely the
CS-poor region) exhibits nanomechanical features very similar to those of the bare pullulan coating
(6.95 ± 0.77 GPa and 296.25 ± 59.83 MPa for E and H, respectively) insomuch as the two data sets
can be superimposed. On the contrary, the “down” part of the panel (namely the CS-rich region)
gives rise to a data cloud shifted to higher values for both E and H (7.70 ± 0.65 GPa and 410 ±
58.55 MPa, respectively).
A different scenario was disclosed as far as the C parameter is concerned. The average creep
value (i.e., the indentation depth calculated after applying a load of ~195 μN) is significantly lower
for the coating P-CS2034 (16.5 ± 1.85 nm) compared with the coating surfaces P (21.07 ± 2.46 nm)
and P-CNC (21.33 ± 3.90), irrespective of the specific zone of the indented areas (Fig. 7). This is
confirmed by the creep map of the sample P-CS2034 in Fig. 5 (line c, right column), where a
homogeneously colored violet surface can be detected. These results can be explained considering
the maximum load of 200 μN set for the second step of the analysis. This means that C can be
affected by the z-axis distribution of the NBBs. Because of morphology effects (geometry and
dimensions), it is plausible that CS nanoparticles fell into the pullulan matrix to a higher extent than
CNCs, which would explain the lower sensitivity of the P-CS2034 coating to compressive stresses.
These observations support the idea that the C value relies more on a mean distribution of the
nanoparticles at a microscale, rather than on local gradients, which instead was observed for both E
and H. Therefore, the addition of CS nanoparticles, although not homogeneously dispersed in the

19
main biopolymer matrix, yielded a more cohesive surface, while CNCs did not result in any
significant difference in terms of creep as compared with the pristine pullulan coating surface.
This can be ascribed to the lower effective surface area of CNCs than of CS nanoparticles, as
pointed out by Brinkmann et al. [43]. The surface area of CNCs dispersed in water can be a few
hundred m2/g, the variability depending on the size distribution of the crystals; for example, the
expected surface area range for particles with average lengths and cross sections of 100-200 nm and
4-5 nm, respectively, can be estimated to be between 400 and 500 m2/g. In reality, the surface area
dramatically decreases (up to even two orders of magnitude lower) for dry aggregated CNCs, as
demonstrated by Olsson et al. for dry bacterial nanocellulose (surface area ~ 100 m2/g) [44]. The
solvent removal during the preparation of thin films and coatings (as in this work) promotes the
formation of aggregates or agglomerates with a very small accessible surface area, which in turn
would affect the interaction at the interface with the main polymer matrix (e.g., pullulan molecular
chains in this work).
5. Conclusions
As confirmed by recent works [see ref. 6], nanoindentation is a versatile instrumental
approach for in-depth mechanical characterization of a material’s surface at the local level, i.e., at
the nanometer scale. The rising interest in biopolymer systems has prompted scientists to expand
the use of this technique beyond conventional applications on fossil-based materials.
Nanoindentation, in particular, is increasingly used in the field of bionanocomposite materials, for
which understanding the interface/interphase nature is crucial in order to fully exploit the size effect
of the nanoparticles with the ultimate goal of improving the final performance of the biopolymer
phase. However, according to the literature, the information on the use of nanoindentation for
bionanocomposite materials pertains almost exclusively to stand-alone films [45–50]. In practice,
today’s market applications (e.g., displays, photovoltaic cells, and packaging materials) employ
biopolymer nanocomposites in the form of thin films and coatings laid on a supporting substrates,

20
in most cases flexible materials such as plastics [14]. Duan et al. dealt with nanoindentation
experiments on thin biopolymer composites, but they focused primarily on the development of
analytical models to study how the elastic modulus changes with the penetration for simple
composite materials [51].
In this work, we used nanoindentation to gather nanomechanical information of biopolymer
nanocomposite coatings deposited on a plastic film. First, we provided evidence that the substrate’s
mechanical properties do not affect the mechanical characterization of the coating if a suitable
instrumental setup is pinpointed. Second, the addition of NBBs to generate bionanocomposite
coatings was successfully discriminated from the bare biopolymer system, and new nanomechanical
features, quantified in terms of elastic modulus, hardness, and creep, were described. The impact of
NBBs geometry on the nanomechanical performance of the final nanocomposite coatings was also
addressed in light of some surface chemistry considerations. This has revealed unexpected
behaviors for round-shaped NBBs, for which the local distribution played a crucial role in the
hardness performance, whereas it turned out to be less influential on the overall creep behavior of
the material. In the same way, it was clarified that the reinforcement of the pullulan coatings loaded
with CNCs can be plausibly attributed to the high elastic modulus of the individual crystals
dispersed in the main polymer matrix. However, the low accessibility of the surface area of dry
CNCs (and thus the reduced interaction with the main pullulan phase) may explain the inferior
creep performance of the same bionanocomposite surface.
The findings arising from this work may represent a step forward to expand the use of
nanoindentation for the special application on bionanocomposite coatings deposited on relatively
thin and flexible substrates, e.g., plastics, while gaining a better fundamental physical understanding
of the local mechanical behavior of the coating interphases and their relationship with the substrate
underneath.
Acknowledgments

21
The authors acknowledge the support of the University of Milan “Research Support Plan 2015–
2017”, Line 2, grant # 15-6-3024000-402.
References
[1] C. A. Schuh, Nanoindentation Studies of Materials, Mater. Today 9 (2006) 32–40.
[2] D. M. Ebenstein, K. J. Wahl, A comparison of JKR-based methods to analyze quasi-static
and dynamic indentation force curves, J. Colloid Interface Sci. 298 (2006) 652–662.
[3] Y. T. Cheng, C. M. Cheng, Scaling, Dimensional Analysis, and Indentation Measurements,
Mater. Sci. Eng. R 44 (2004) 91–149.
[4] A. C. Fischer-Cripps, Critical Reviews of Analysis And Interpretation of Nanoindentation
Test Data, Surf. Coat. Technol. 200 (2006) 4153–4165.
[5] N. A. Sakharova, J. V. Fernandes, J. M. Antunes, M. C. Oliveira, Comparison Between
Berkovich, Vickers and Conical Indentation Tests: A Three-Dimensional Numerical Simulation
Study, Int. J. Solids Struct. 46 (2009) 1095–1104.
[6] A. M. Díez-Pascual, M. A. Gómez-Fatou, F. Ania, A. Flores, Nanoindentation in Polymer
Nanocomposites, Prog. Mater. Sci. 67 (2015) 1–94.
[7] J. Shao, Y. Wang, X. Chen, X. Hu, C. Du, Nanomechanical Properties of Poly(L-Lactide)
Nanofibers After Deformation, Colloids Surf., B. 120 (2014) 97–101.
[8] B. Das, K. E. Prasad, U. Ramamurty, C. N. R. Rao, Nano-Indentation Studies on Polymer
Matrix Composites Reinforced by Few-Layer Graphene, Nanotechnology 20 (2009) 125705–
125710.

22
[9] A. Flores, M. Naffakh, A. M. Díez-Pascual, F. Ania, M. A. Gómez-Fatouk, Evaluating the
Reinforcement of Inorganic Fullerene-Like Nanoparticles in Thermoplastic Matrices by Depth-
Sensing Indentation, J. Phys. Chem. C 117 (2013) 20936–20943.
[10] N. Funk, M. Vera, L. J. Szewciw, F. Barthelat, M. P. Stoykovich, F. J. Vernerey,
Bioinspired Fabrication and Characterization of a Synthetic Fish Skin for the Protection of Soft
Materials, ACS Appl. Mater. Interfaces 7 (2015) 5972–5983.
[11] E. Callard Preedy, S. Perni, P. Prokopovich, Cobalt and Titanium Nanoparticles Influence
on Mesenchymal Stem Cell Elasticity and Turgidity, Colloids Surf., B. 157 (2017) 146–156.
[12] N. Wang, A.-M. Trunfio-Sfarghiu, D. Portinha, S. Descartes, E. Fleury, Y. Berthier, J.-P.
Rieu, Nanomechanical and Tribological Characterization of the MPC Phospholipid Polymer
Photografted onto Rough Polyethylene Implants, Colloids Surf., B. 108 (2013) 285–294.
[13] C. Stauch, T. Ballweg, W. Stracke, R. Luxenhofer, K. Mandel, Burstable Nanostructured
Micro-Raspberries: Towards Redispersible Nanoparticles from Dry Powders, J. Colloid
Interface Sci. 490 (2017) 401–409.
[14] I. U. Unalan, G. Cerri, E. Marcuzzo, C. A. Cozzolino, S. Farris, Nanocomposite Films and
Coatings Using Inorganic Nanobuilding Blocks (NBB): Current Applications and Future
Opportunities in the Food Packaging Sector, RSC Adv. 4 (2014) 29393–29428.
[15] J. W. Rhim, H. M. Park, C. S. Ha, Bio-Nanocomposites for Food Packaging Applications,
Prog. Polym. Sci. 38 (2013) 1629–1652.
[16] G. Kickelbick, Concepts for the Incorporation of Inorganic Building Blocks into Organic
Polymers on a Nanoscale, Prog. Polym. Sci. 28 (2003) 83–114.
[17] J. M. Fuentes-Alventosa, L. Introzzi, N. Santo, G. Cerri, A. Brundu, S. Farris, Self-
Assembled Nanostructured Biohybrid Coatings by an Integrated ‘Sol-Gel–Intercalation’
Approach, RSC Adv. 3 (2013) 25086–25096.

23
[18] S. Farris, L. Introzzi, J. M. Fuentes-Alventosa, N. Santo, R. Rocca, L. Piergiovanni, Self-
Assembled Pullulan-Silica Oxygen Barrier Hybrid Coatings for Food Packaging Applications, J.
Agric. Food Chem. 60 (2012) 782–790.
[19] L. Introzzi, T. O. J. Blomfeldt, S. Trabattoni, S. Tavazzi, N. Santo, A. Schiraldi, L.
Piergiovanni, S. Farris, Ultrasound-Assisted Pullulan/Montmorillonite Bionanocomposite
Coating with High Oxygen Barrier Properties, Langmuir 28 (2012) 11206–11214.
[20] B. X. Du, J. Li, W. Du, Surface Charge Accumulation and Decay on Direct fluorinated
Polyimide/Al2O3 Nanocomposites, IEEE T. Dielect. El. In. 20 (2013) 1764–1771.
[21] A. Allahverdi, M. Ehsani, H. Janpour, S. Ahmadi, The Effect of Nanosilica on Mechanical,
Thermal and Morphological Properties of Epoxy Coating, Prog. Org. Coat. 75 (2012) 543–548.
[22] P. Dais, S. Vlachou, F. Taravel, 13C Nuclear Magnetic Relaxation Study of Segmental
Dynamics of the Heteropolysaccharide Pullulan in Dilute Solutions, Biomacromolecules 2
(2001) 1137–1147.
[23] L. Introzzi, J. M. Fuentes-Alventosa, C. A. Cozzolino, S. Trabattoni, S. Tavazzi, C. L.
Bianchi, A. Schiraldi, L. Piergiovanni, S. Farris, ‘Wetting enhancer’ Pullulan Coating for
Antifog Packaging Applications, ACS Appl. Mater. Interfaces 4 (2012) 3692–3700.
[24] R. E. Patterson, Preparation and Uses of Silica Gels and Precipitated Silicas. In Colloidal
silica: Fundamentals and Applications; H. E. Bergna, W. O. Roberts, (Eds.), CRC Press: Boca
Raton, FL. 131 (2005) 779–788.
[25] A. Dufresne, Nanocellulose: From Nature to High Performance Tailored Materials; Walter
de Gruyter GmbH: Berlin (2013).
[26] F. Ullmann, M. Bohnet, Ullmann’s encyclopedia of industrial chemistry, 7th ed.; J. Wiley
& Sons: Weinheim, NY (2009).

24
[27] H. Zou, S. Wu, J. Shen, Polymer/Silica Nanocomposites: Preparation, Characterization,
Properties, and Applications, Chem. Rev. 108 (2008) 3893–3957.
[28] Q. Lin, S. A. Cohen, L. Gignac, B. Herbst, D. Klaus, E. Simonyi, J. Hedrick, J.
Warlaumont, H-J. Lee, W-L. Wu, Low Dielectric Constant Nanocomposite Thin Films Based
on Silica Nanoparticle and Organic Thermosets, J. Polym. Sci. Part B Polym. Phys 45 (2007)
1482–1493.
[29] T. Abitbol, A. Rivkin, Y. Cao, Y. Nevo, E. Abraham, T. Ben-Shalom, S. Lapidot, O.
Shoseyov, Nanocellulose, a Tiny Fiber with Huge Applications, Curr. Opin. Biotech. 39 (2016)
76–88.
[30] R. J. Moon, A. Martini, J. Nairn, J. Simonsen, J. Youngblood, Cellulose Nanomaterials
Review: Structure, Properties and Nanocomposites, Chem. Soc. Rev. 40 (2011) 3941–3994.
[31] F. Hoeng, A. Denneulin, J. Bras, Use of Nanocellulose in Printed Electronics: a review,
Nanoscale 8 (2016) 13131–13154.
[32] M. F. Doerner, W. D. Nix, A Method for Interpreting the Data from Depth-Sensing
Indentation Instruments, J. Mater. Res. 1 (1986) 601–609.
[33] W. C. Oliver, G. M. Pharr, An Improved Technique for Determining Hardness and Elastic
Modulus Using Load Displacement Sensing Indentation Experiments, J. Mater. Res. 7 (1992)
1564–1583.
[34] W. C. Oliver, G. M. Pharr, Measurement of Hardness and Elastic Modulus by Instrumented
Indentation: Advances in Understanding and Refinements to Methodology, J. Mater. Res. 19
(2004) 3–20.
[35] M. Martin, M. Troyon, Fundamental Relations Used in Nanoindentation: Critical
Examination Based on Experimental Measurements, J. Mater. Res. 17 (2002) 2227-2234.

25
[36] F. Li, P. Biagioni, M. Finazzi, S. Tavazzi, L. Piergiovanni, Tunable Green Oxygen Barrier
Through Layer-By-Layer Self-Assembly of Chitosan and Cellulose Nanocrystals, Carbohydr.
Polym. 92 (2013) 2128–2134.
[37] F. Li, P. Biagioni, M. Bollani, A. Maccagnan, L. Piergiovanni, Multi-Functional coating of
Cellulose Nanocrystals for Flexible Packaging Applications, Cellulose 20 (2013) 2491–2504.
[38] F. Li, E. Mascheroni, L. Piergiovanni, The Potential of Nanocellulose in the Packaging
Field: A Review, Packag. Technol. Sci. 28 (2015) 475–508.
[39] M. Bhattacharya, S. Chaudhry, High-Performance Silica Nanoparticle Reinforced Poly
(Vinyl Alcohol) as Templates for Bioactive Nanocomposites, Mater. Sci. Eng. C 33 (2013)
2601–2610.
[40] S. Farris, I. U. Unalan, L. Introzzi, J. M. Fuentes-Alventosa, C. A. Cozzolino, Pullulan-
Based Films and Coatings for Food Packaging: Present Applications, Emerging Opportunities,
and Future Challenges, J. Appl. Polym. Sci. 131 (2014) 40539–40551.
[41] A. Dufresne, Nanocellulose: A New Ageless Bionanomaterial, Mater. Today 16 (2013)
220–227.
[42] Y. Habibi, L. A. Lucia, O. J. Rojas, Cellulose Nanocrystals: Chemistry, Self-Assembly,
and Applications, Chem. Rev. 110 (2010) 3479–3500.
[43] A. Brinkmann, M. Chen, M. Couillard, Z. J. Jakubek, T. Leng, L. J. Johnston, Correlating
Cellulose Nanocrystal Particle Size and Surface Area, Langmuir 32 (2016) 6105−6114.
[44] R. T. Olsson, M. A. S. Azizi Samir, G. Salazar Alvarez, L. Belova, V. Strom, L. A.
Berglund, O. Ikkala, J. Nogues, U. W. Gedde, Making Flexible Magnetic Aerogels and Stiff
Magnetic Nanopaper Using Cellulose Nanofibrils as Templates, Nat. Nanotechnol. 5 (2010)
584–588.

26
[45] J. Sahari, S. M. Sapuan, E. S. Zainudin, M. R. Ishak, M. A. Maleque, M. Y.M. Zuhri, R.
Akhtar, Nanoindentation and the Low Velocity Impact Response of Biofibre, Biopolymer and
its Biocomposite Derived from Sugar Palm Tree, Curr. Org. Synth. 14 (2017) 227–232.
[46] A. Rath,S. Mathesan, P. Ghosh, Nanomechanical Characterization and Molecular
Mechanism Study of Nanoparticle Reinforced and Cross-Linked Chitosan Biopolymer, J. Mech.
Behav. Biomed. Mater. 55 (2016) 42–52.
[47] S. Rjafiallah, N. Benseddiq, S. Guessasma, Effect of Interface Properties on the Effective
Properties of Biopolymer Composite Materials, Mat.-wiss. u.Werkstofftech. 41 (2010) 265–269.
[48] S. Guessasma, M. Sehaki, D. Lourdin, A. Bourmaud, Viscoelasticity Properties of
Biopolymer Composite Materials Determined Using Finite Element Calculation and
Nanoindentation, Comput. Mater. Sci. 44 (2008) 371–377.
[49] D. Verma, K. S. Katti, D. R. Katti, B. Mohanty, Mechanical Response and Multilevel
Structure of Biomimetic Hydroxyapatite/Polygalacturonic/Chitosan Nanocomposites, Mater.
Sci. Eng. C 28 (2008) 399–405.
[50] S.-F. Wang, L. Shen, W.-D. Zhang, Y.-J. Tong, Preparation and Mechanical Properties of
Chitosan/Carbon Nanotubes Composites, Biomacromolecules 6 (2005) 3067–3072.
[51] P. Duan, S. Bull, J. Chen, Modeling the Nanomechanical Responses of Biopolymer
Composites During the Nanoindentation, Thin Solid Films 596 (2015) 277–281.

1
Figure captions
Fig. 1. (a) Idealized load-displacement indentation curve. (b) Exemplification of the cross-sectional
profile during a loading-unloading indentation cycle with some relevant parameters (adapted from
ref. 33).
Fig. 2. Hardness (H, MPa) and penetration depth (nm) as a function of the maximum load (mN) on
the surface of the coating P-CNC deposited on the PET plastic substrate.
Fig. 3. (a) Total work (Wtot) and (b) elastic part of the indentation work (η) obtained from 80
indentation cycles on samples P (––), P-CS15/500 (––), and P-CS15/750 (––).
Fig. 4. Three-dimensional images of hardness (H, MPa) distribution on representative portions
(2.70 × 2.10 μm2) of the coating surface of samples P (left), P-CS15/500 (center), and P-CS15/750
(right).
Fig. 5. Two-dimensional maps of (a) elastic modulus (E, GPa), (b) hardness (H, GPa), and (c) creep
(C, nm) distribution on representative portions (6 × 6 μm2) of the coating surface of samples P
(left), P-CNC (center), and P-CS2034 (right).
Fig. 6. “Hardness vs. elastic modulus” plots for the coatings P (––), P-CS2034 – “up” region (––),
and P-CS2034 – “down” region (––).

2
Fig. 7. “Creep vs. maximum force” for the coatings P (––), P-CNC (––), and P-CS2034 – “up” region
(––). Error bars are for standard deviations.

29

30

31

32

33

34

35

36
Table 1. Main parameters set for step 1 and step 2 of the indentation test.
Parameter Value
Step 1
Loading Linear
Control Depth Control
Indenter Berkovich
Max Depth 40 [nm]
Pause at Max Load 10 [s]
Loading Rate 800 [µN/min]
Unloading Rate 800 [µN/min]
Step 2
Loading Linear
Control Load Control
Indenter Berkovich
Max Load 200 [µN]
Pause at Max Load 10 [s]
Loading Rate 800 [µN/min]
Unloading Rate 800 [µN/min]
37
Table 2. Hardness (H, MPa) values obtained after “loading-holding-unloading” indentation test on
the coated PET samples (both PET and coating surfaces) and bare (uncoated) PET.
Type of test Sample
P P-CNC P-CS2034
coated PET (coating surface) 285.74 ± 25.87a
316.32 ± 32.13c
360.65 ± 44.05d
coated PET (PET surface) 462 ± 2.95b
463.62 ± 2.29b
465 ± 2.05b
uncoated PET 472.59 ± 1.60c
Results are expressed as mean values and standard deviation. Different superscripts within a group
(i.e., within each parameter for each step) refer to a statistically significant difference (p < 0.05).

38
Table 3. Elastic modulus (E) and hardness (H) obtained from the nanoindentation tests on the
different coating surfaces.
Coating sample E (GPa) H (MPa)
Step 1
P 6.31 ± 0.37a
286.18 ± 16.97A
P-CS15/500 8.19 ± 0.35b
381.89 ± 16.47B
P-CS15/750 7.88 ± 0.42c
395.41 ± 25.22C
Step 2
P 6.91 ± 0.73a
290.47 ± 29.69A
P-CNC 7.73 ± 1.51b
321.36 ± 43.26B
P-CS2034 7.33 ± 0.82ab
353.50 ± 83.52C
Results are expressed as mean values and standard deviation. Different superscripts within a group
(i.e., within each parameter for each step) refer to a statistically significant difference (p < 0.05).

39
Graphical Abstract