graphene oxide/hydroxyapatite composite coatings ...lbmd.coe.pku.edu.cn/pdf/2014carbon.pdf ·...
TRANSCRIPT

C A R B O N 6 7 ( 2 0 1 4 ) 1 8 5 – 1 9 7
.sc ienced i rec t .com
Avai lab le a t wwwScienceDirect
journal homepage: www.elsevier .com/ locate /carbon
Graphene oxide/hydroxyapatite composite coatingsfabricated by electrophoretic nanotechnology forbiological applications
0008-6223/$ - see front matter � 2013 Elsevier Ltd. All rights reserved.http://dx.doi.org/10.1016/j.carbon.2013.09.080
* Corresponding author: Fax: +86 10 6275 3404.E-mail address: [email protected] (Y. Cheng).
Ming Li a, Qian Liu a, Zhaojun Jia a, Xuchen Xu a, Yan Cheng a,*, Yufeng Zheng a,b,Tingfei Xi a, Shicheng Wei a,c
a Center for Biomedical Materials and Tissue Engineering, Academy for Advanced Interdisciplinary Studies, Peking University, Beijing 100871,
People’s Republic of Chinab Department of Materials Science and Engineering, College of Engineering, Peking University, Beijing 100871, People’s Republic of Chinac Department of Oral and Maxillofacial Surgery, School of Stomatology, Peking University, Beijing 100081, People’s Republic of China
A R T I C L E I N F O
Article history:
Received 24 April 2013
Accepted 27 September 2013
Available online 8 October 2013
A B S T R A C T
Graphene oxide (GO) was firstly employed as nanoscale reinforcement fillers in hydroxyap-
atite (HA) coatings by a cathodic electrophoretic deposition process, and GO/HA coatings
were fabricated on pure Ti substrate. The transmission electron microscopy observation
and particle size analysis of the suspensions indicated that HA nanoparticles were uni-
formly decorated on GO sheets, forming a large GO/HA particle group. The addition of
GO into HA coatings could reduce the surface cracks and increase the coating adhesion
strength from 1.55 ± 0.39 MPa (pure HA) to 2.75 ± 0.38 MPa (2 wt.% GO/HA) and
3.3 ± 0.25 MPa (5 wt.% GO/HA), respectively. Potentiodynamic polarization and electro-
chemical impedance spectroscopy studies indicated that the GO/HA composite coatings
exhibited higher corrosion resistance in comparison with pure HA coatings in simulated
body fluid. In addition, superior (around 95% cell viability for 2 wt.% GO/HA) or comparable
(80–90% cell viability for 5 wt.% GO/HA) in vitro biocompatibility were observed in compar-
ison with HA coated and uncoated Ti substrate.
� 2013 Elsevier Ltd. All rights reserved.
1. Introduction
Graphene oxide (GO), the oxygenated counterpart of one-
atom thick graphene sheet, has been applied in various bio-
technologies such as biosensor [1], cellular imaging [2],
nanoprobe [3,4], drug delivery and so on [5,6], due to its extre-
mely large surface area, ease of chemical functionalization,
good biocompatibility and biostability. Moreover, GO shows
desirable dispersion behavior and possesses good mechanical
property. The reactive oxygenic groups, present on the edges
(carbonyl and carboxyl groups) and planes (hydroxyl and
epoxide groups) of GO sheets, can stabilize the dispersion of
GO in aqueous media, enhance the interfacial bonding within
the components, and facilitate the stress transfer in the com-
posites [7], which render GO as attractive and promising
nanoscale reinforcement fillers in biocomposites (incorpo-
rated into either a polymer or an inorganic matrix) [8]. Im-
proved mechanical properties have been observed in GO-
based chitosan [9], gelatin [10], starch [11], and poly(e-capro-
lactone) (PCL) [12] biopolymer composites. The GO-based
chitosan biocomposites displayed a significantly improve-
ment in tensile strength and Young’s modulus by about
122% and 64%, respectively, with the addition of 1 wt.% GO
[9]. In addition, GO increased the bioactivity of gelatin [10]

186 C A R B O N 6 7 ( 2 0 1 4 ) 1 8 5 – 1 9 7
and PCL [12] during biomineralization, by promoting the
nucleation of hydroxyapatite (HA) nanoparticles in simulated
body fluid (SBF).
HA is a bioactive calcium phosphate ceramic [Ca10(PO4)6(-
OH)2] with chemical and crystallographic similarity to that
of natural apatite in bones and has been currently used in
hard tissue engineering for bone repair or regeneration, and
as bioactive coatings on Ti-based alloys for orthopedic appli-
cations to improve the integration between the implants
and bone tissues. However, the inferior wear resistance and
fracture toughness of pure HA cannot match the mechanical
behavior of natural bone and would hinder its clinical appli-
cation in major load-bearing devices as coating materials.
To solve this problem, materials such as polyethylene [13],
Al2O3 [14], TiO2 [15], Y2O3 [16], yttria stabilized zirconia (YSZ)
[17], Ni3Al [18] and carbon nanotubes (CNT) [19] are used as
reinforcements in HA to improve its mechanical properties.
Although increased mechanical properties have been ob-
tained, these reinforcements (e.g. CNT, due to the presence
of metallic catalyst therein) could usually impair the biologi-
cal property of HA or have adverse effects on adjacent tissues
[20]. And some reinforcing material (e.g., ZrO2) could induce
the decomposition of HA during the fabrication process, lead-
ing to a substantially reduction in the bioactivity of HA [18].
Recently, more and more research works have been de-
voted to the fabrication of graphene or its derivatives rein-
forced HA biocomposites [21–27]. The incorporation of
graphene or its derivatives in HA composites has been re-
ported in several literatures using in situ synthesis method
[21–23], biomimetic mineralization process [24,25], spark plas-
ma sintering (SPS) technique [26], radio-frequency chemical
vapor deposition [27], electrospinning method [28] and so
on. Compared with pure HA, the HA-1 wt.% reduced GO
(rGO) composites exhibited a substantial increase in hardness
(25.8%), elastic modulus (47.6%) and fracture toughness
(203%), with enhanced proliferation and alkaline phosphate
expression level of human osteoblast cells [29]. And graph-
ene/HA composite produced by SPS showed an improved
in vitro osteoblast adhesion and apatite mineralization [30].
Besides, increase of hardness and elastic modulus was also
observed in GO/HA, chitosan/GO/HA and polylactic acid/GO/
HA composites [21,28]. The cytotoxicity of the graphene-
based fillers shown a dose-dependent [31]. And most of the
resulting composites displayed a favorable biological perfor-
mances toward the proliferation and growth of L929 fibroblast
cells [21,25], MC3T3-E1 pre-osteoblast cells [16,20] and MG63
human osteosarcoma cells [21].
In the present study, GO is chosen as a credible and supe-
rior alternative to CNT as nanofillers in HA matrix [21]. GO can
be produced simply in large scale with significantly low cost
and little impurities (metals) as opposed to CNT, a significant
advantages for synthesizing high-performance biocompos-
ites. And GO displays a better performance than other rein-
forcement phases at low nanofiller loading in terms of
enhancing various mechanical properties [32,33]. In addition,
GO is an emerging material with good biocompatibility [34] as
well as antibacterial activity [35], which provide promising
opportunities to improve orthopedic implant application [36].
Despite the attractive advantages and progress in prepara-
tion of this novel HA composites, the employment of
graphene/GO/rGO as nano reinforcements in bioactive HA
coatings, to our knowledge, has not been reported. Therefore,
a pilot and preliminary work was conducted on the fabrica-
tion of GO/HA composite coatings by electrophoretic deposi-
tion (EPD). EPD is a well developed, economical and versatile
coating technique to deposit charged micro/nano particles
in suspension on conductive substrates under an electrical
field. Its application for producing HA coatings in orthopedic
and dental implant has been widely explored [37] with the
advantages of good stoichiometry control, high deposition
rate and throughput, desirable coating uniformity, large-area
deposition, and precisely controllable thickness of the result-
ing coatings [38]. This coating technique is also reliable and
applicable to manipulate graphene and graphene-containing
systems to fabricate advanced nanostructured coatings for
various applications [39].
Herein, a homogeneous GO/HA composite coating was
prepared on commercial pure Ti (cp Ti) using EPD process.
Ethanol was employed as solvent in the present study to min-
imize the evolution of gases at the electrodes which could
have adverse effects on the quality of the deposited coatings.
Compared with pure EPD-HA coating, this novel coating could
effectively enhance its adhesion strength on the substrate
and prevent the formation of cracks, increase the corrosion
resistance of Ti. The in vitro biocompatibility of the resulting
samples with L929 murine fibroblast cell lines and MG63 hu-
man osteoblast-like cell lines were evaluated using cell count-
ing kit 8 (CCK8) assay and direct contact method.
2. Experimental
2.1. Materials
Nano GO platelets were obtained from Angstron Material LLC,
USA. HA nanoparticles were purchased from Nanjing Emper-
or Nano Material Co., Ltd., China. All other reagents and sol-
vents of analytical grade were provided by Sinopharm
Chemical Reagent Co., Ltd. and used as received without fur-
ther purification unless otherwise noted.
2.2. EPD process
Three kinds of suspension (with a constant solid loading of
5 mg/mL) were prepared and denoted as HA, 2GO/HA and
5GO/HA, which containing 0 wt.%, 2 wt.% and 5 wt.% GO
platelets of the total powders, respectively. Specifically, the
mixture of GO and HA powders (600 mg) were added into
120 mL ethanol in 200 mL glass beaker and ultrasonically
treated for 5 h to ensure its homogeneous distribution. The
pH values of the suspensions were adjusted to 3–4 by HNO3
and NH3ÆH2O. Prior to deposition, the suspensions were rested
for 1 h to allow suspension equilibrium and to ensure the sed-
imentation of the big or agglomerated particles.
The cp Ti plate was cut into 10 mm · 10 mm · 1 mm sheets
and polished by SiC paper to 400 grit, ultrasonically cleaned in
acetone, alcohol and distilled water, respectively, and dried at
room temperature. Prior to the deposition, the Ti sheets were
further activated by etching and oxidizing in acid solution
(HNO3:HF:H2O = 28.8:2.4:70) for 3 min. The deposition process

C A R B O N 6 7 ( 2 0 1 4 ) 1 8 5 – 1 9 7 187
was conducted in a 200 mL glass beaker at a constant voltage
of 30 V and deposition times of 1–5 min, with a stainless steel
electrode (anode) and a Ti substrate (cathode) 2 cm apart.
Magnetic stirring was employed to maintain the homoge-
neous dispersion of the particles during the whole EPD pro-
cess (depicted in Fig. 1). After that, the coated samples were
removed carefully from the EPD cell and dried horizontally
in air at room temperature for 24 h, and then sintered in a
vacuum furnace with nitrogen backfilling at 600 �C for 1 h.
2.3. Characterization
The suspension was characterized by transmission electron
microscope (TEM, H-9000NAR, Hitachi). The particle size dis-
tribution and the zeta potential of the suspension were eval-
uated by Zetasizer Nano ZS90 (Malvern Instruments, UK)
using dynamic light scattering.
The coating morphology was investigated by environmen-
tal scanning electron microscopy (ESEM, AMRY 1-1910FE). The
phase of the coatings was evaluated by X-ray diffraction (XRD)
using a Rigaku DMAX 2400 diffractometer with a step size of
4�/min. Raman measurement was performed using a Raman
Imaging Microscope System (Renishaw 1000). The coatings
were peeled off the substrate and subjected to thermo-gravi-
metric analysis (TGA, TA instrument, Q50) at a heating rate of
10 �C/min from 20 �C to 800 �C under a 100 mL N2 per min
purge, in order to obtain the actual composition of the depos-
ited GO/HA coatings.
Adhesion strength of the sintered samples were tested
according to ASTM F1044-99 [40] using a universal testing ma-
chine (Instron 5960) with a 10 kN load cell and speed of
1.0 mm/min. An epoxy resin was glued on the full top of the
coating and cured at 60 �C for 2 h in an oven. The mechanical
apparatus can be found in reference [40]. Five samples in each
group were tested and the average adhesion strength was cal-
culated as the maximum load/contact area.
Fig. 1 – Schematic illustration of the EPD process. (A c
Electrochemical experiment was performed by a com-
puter-controlled Auto lab CHI 650C in SBF at 37 ± 0.1 �C(pH = 7.4), using a conventional three-electrode cell with a
working electrode (the specimen), the Pt counter electrode
and a saturated calomel electrode (SCE) as the reference elec-
trode. The SBF was prepared strictly according to the protocol
in reference [41]. Anodic polarization experiments were con-
ducted after the specimen immersed in SBF for 1 h under
open-circuit conditions and performed at a rate of 60 mV/
min. Electrochemical impedance spectroscopy (EIS) were ac-
quired with an AC amplitude range of �10 mV to 10 mV and
evaluated in the frequency range from 10�2 Hz to 104 Hz.
The EIS data were interpreted in Bode amplitude and phase
angle plots using ZSimpWin program.
2.4. In vitro biocompatibility
The in vitro biocompatibility of the GO/HA coated Ti sheets to
L929 cell lines and MG63 cell lines was evaluated using CCK8
assay (Dojindo). Cells were seeded directly on the samples
(be sterilized by ultraviolet-radiation for at least 2 h prior
to the cell seeding process) at a density of 5 · 104 cells/mL
in 24-well cell culture plates (Corning, NY; 500 lL/well) and
incubated in the Dulbecco’s modified eagle’s medium
(DMEM) supplemented with 10% fetal bovine serum,
100 U mL�1 penicillin and 100 lg mL�1 streptomycin in a
humidified atmosphere with 5% CO2 at 37 �C. The control
groups involved the use of DMEM as negative control and
10% DMSO DMEM as positive control. After 1, 3 and 5 days
incubation, CCK-8 solution was added to each well for fur-
ther 3 h incubation. Then the medium was transferred to a
new 96-well cell culture plates and its optical density (OD)
was performed by a spectrophotometer (Elx-800, bio-Tek
instruments) at 450 nm wavelength, with a reference wave-
length of 630 nm. The cell viability was expressed in the per-
centage as following:
olor version of this article can be viewed online.)
188 C A R B O N 6 7 ( 2 0 1 4 ) 1 8 5 – 1 9 7
Cell viabilty ð%Þ ¼ OD ðtestÞ �OD ðblankÞOD ðnegative controlÞ �OD ðblankÞ � 100%
The typical cellular attachment and spread morphologies
on the coated cp Ti were evaluated by SEM after Au sputter-
ing. Basically, after 3 days incubation under the culturing con-
dition mentioned above, the samples with cells were rinsed in
phosphate buffer saline (PBS) and fixed in 2.5% glutaralde-
hyde for 2 h, followed by dehydration in ethanol/distilled
water series and finally dried in air.
2.5. Statistical analysis
All quantitative data are expressed as mean ± standard devi-
ations with n = 3. Statistical analysis was performed by one-
way analysis of variance (ANOVA) followed by Tukey’s post
hoc tests using SPSS 19.0 and p-values less than 0.05 were
considered statistically significant.
3. Results and discussion
3.1. Characterization of the suspensions and depositionrate
During the deposition process, the particle size and the stabil-
ity of the suspension play a significant role in the uniformity
of the coatings, and thus we first characterized the suspen-
sion [42]. The dispersion behavior of the received HA nano-
particles and the GO/HA particle groups after being
ultrasonically treated in ethanol for 5 h were revealed by
TEM observation in Fig. 2, as well as their optical photos
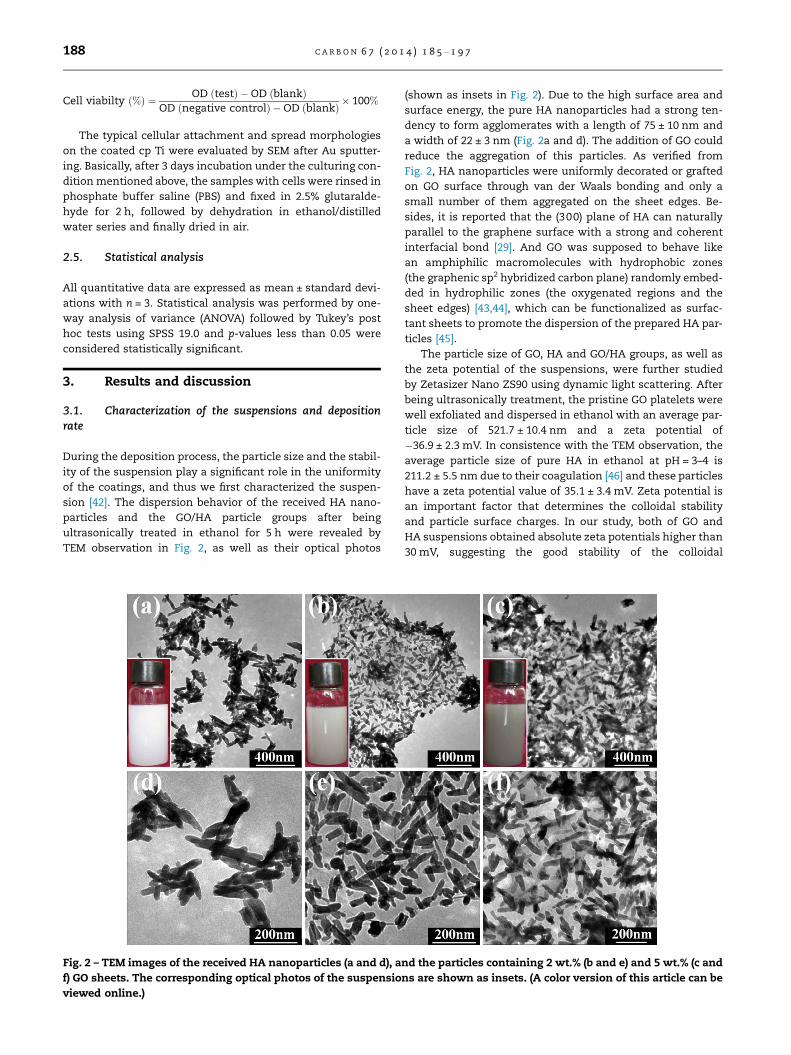
Fig. 2 – TEM images of the received HA nanoparticles (a and d), a
f) GO sheets. The corresponding optical photos of the suspensio
viewed online.)
(shown as insets in Fig. 2). Due to the high surface area and
surface energy, the pure HA nanoparticles had a strong ten-
dency to form agglomerates with a length of 75 ± 10 nm and
a width of 22 ± 3 nm (Fig. 2a and d). The addition of GO could
reduce the aggregation of this particles. As verified from
Fig. 2, HA nanoparticles were uniformly decorated or grafted
on GO surface through van der Waals bonding and only a
small number of them aggregated on the sheet edges. Be-
sides, it is reported that the (300) plane of HA can naturally
parallel to the graphene surface with a strong and coherent
interfacial bond [29]. And GO was supposed to behave like
an amphiphilic macromolecules with hydrophobic zones
(the graphenic sp2 hybridized carbon plane) randomly embed-
ded in hydrophilic zones (the oxygenated regions and the
sheet edges) [43,44], which can be functionalized as surfac-
tant sheets to promote the dispersion of the prepared HA par-
ticles [45].
The particle size of GO, HA and GO/HA groups, as well as
the zeta potential of the suspensions, were further studied
by Zetasizer Nano ZS90 using dynamic light scattering. After
being ultrasonically treatment, the pristine GO platelets were
well exfoliated and dispersed in ethanol with an average par-
ticle size of 521.7 ± 10.4 nm and a zeta potential of
�36.9 ± 2.3 mV. In consistence with the TEM observation, the
average particle size of pure HA in ethanol at pH = 3–4 is
211.2 ± 5.5 nm due to their coagulation [46] and these particles
have a zeta potential value of 35.1 ± 3.4 mV. Zeta potential is
an important factor that determines the colloidal stability
and particle surface charges. In our study, both of GO and
HA suspensions obtained absolute zeta potentials higher than
30 mV, suggesting the good stability of the colloidal
nd the particles containing 2 wt.% (b and e) and 5 wt.% (c and
ns are shown as insets. (A color version of this article can be

C A R B O N 6 7 ( 2 0 1 4 ) 1 8 5 – 1 9 7 189
dispersions [47]. In the GO/HA colloidal systems, the HA parti-
cles may be captured and partially neutralized by the highly
negatively charged GO sheets. Therefore, compared with pure
HA suspensions, the addition of GO into HA could result in lar-
ger particle groups and lower zeta potentials (346.6 ± 7.8 nm
and 30.3 ± 1.5 mV for 2GO/HA; 372.1 ± 12.2 nm and
28.3 ± 2.5 mV for 5GO/HA).
The deposition rate was measured using weight method.
During the coating process, a constant solid concentration
of 5 mg/mL was used for all the experiments. It can be seen
from Fig. 3 that, the deposit mass increased with the deposi-
tion time. The deposition rate of GO/HA composite coating
decreased with the addition of GO and increased with the
deposition voltage. Varying the relative concentration of GO
sheets, the deposition time and voltage would lead to changes
in the GO/HA composite coatings weight.
The weight of the deposited coatings per unit area (w) of Ti
substrate can be approximately interpreted by Hamaker
equation [42,48]:
w ¼ flCVL
� �t ð1Þ
where f is the Hamaker factor, l is the electrophoretic mobil-
ity, C is particle concentration, V is the applied potential, L is
the distance between the electrodes, and t is the deposition
time. The electrophoretic mobility is determined by the fol-
lowing Henry equation [49]:
l ¼ 2
3
e0erng
fðjrÞ ð2Þ
where e0 is the permittivity of vacuum, er is the relative per-
mittivity of the solvent, f is the zeta potential of the particles,
g is the viscosity of the solvent, and f(jr) is the Henry coeffi-
cient. This coefficient has a close relationship with the thick-
ness of the double layer (1/j) and the core radius (r) of the
particle, and in our study, f(jr) is 1.5 which is referred to the
Smoluchowski approximation [49].
It is expected from Eq.(1) that the mass of the deposits
shows a liner dependence on time, provided that the applied
potential over the deposit is constant. However, as can be
analyzed by Fig. 3a, the deposition rate decreases along with
Fig. 3 – The weight versus deposition time for the coatings prep
contents at deposition voltage of 30 V (a), and with 2 wt.% GO at
can be viewed online.)
the prolonged deposition time, due to the formation of an
insulating HA bioceramic or GO/HA biocomposite layer on
Ti substrate, which will result in the reduction of potential
drops in the suspension. During the EPD process, the elec-
trophoretic velocity (m) of the particles can be described as
[50]:
m ¼ QE4prg
ð3Þ
where Q, r and E represent the charge, particle radius, and the
potential difference applied to the suspension, respectively.
Therefore, particles with different Q/r ratios have various
electrophoretic mobilities [51]. From the particle size and zeta
potential analysis results, the Q/r ratios for HA, 2GOHA and
5GOHA can be determined as 0.175, 0.087 and 0.076 mV/nm
in descending order, respectively. Consequently, the addition
of GO would reduce deposition rate of HA particles, as shown
in Fig. 3b.
3.2. Surface morphology and microstructure of thecomposite coatings
Fig. 4 shows the surface morphology of the composite coat-
ings after air drying and sintering. From the macroscopic
observation (as shown in the optical photos in Fig. 4), we
can see that, compared with the pure HA coating, the GO/
HA coatings had no cracks and peeling from the Ti surface.
In addition, for the HA coatings, the increase of deposition
time could result in more cracks and severe coating detach-
ment. However, from the microscopic view under SEM obser-
vation, we can see that both of the HA (Fig. 4a) and GO/HA
(Fig. 4b and c) coatings on the Ti sheets displayed some mi-
cro-cracks; nevertheless obvious less and small crack can be
seen for the GO/HA coatings in comparison with HA coatings,
indicating that GO could effectively inhibit cracks creation
and propagation. Moreover, from the optical micrographs
(Fig. 4e and f), it can be observed that GO sheets were homo-
geneously distributed in the HA matrix with shining brown
color. The cross-sectional images of the coated samples were
also displayed in Fig. 4g–i, with the coating thickness of
ared from 5 mg/mL GO/HA suspension with different GO
different deposition voltage (b). (A color version of this article

Fig. 4 – SEM images (a–c), optical micrographs (d–f) and cross-sectional images (g–i) of the GO/HA composite coating
morphologies on Ti sheets after 1 min deposition at 30 V with 0 wt.% (a, d and g), 2 wt.% (b, e and h) and 5 wt.% (c, f and i) GO
contents after sintering at 600 �C for 1 h. The corresponding optical photos of the samples after 1 min deposition, as well as
3 min and 5 min deposition, are shown under the SEM images. The arrows in (e and f) indicate the shining brown GO sheets
embedded in HA matrix. (A color version of this article can be viewed online.)
190 C A R B O N 6 7 ( 2 0 1 4 ) 1 8 5 – 1 9 7
52.8 lm for pure HA, for 42.1 lm 2GO/HA and 35.1 lm for 5GO/
HA.
Several factors have been proposed for the formation and
propagation of cracks in EPD coatings such as drying stresses
within the coatings, the mismatch of thermal expansion be-
tween coatings and substrate, or the weak particle binding
strength as the coating thickens [52,53]. When the samples
were taken out from the suspension, the evaporation of eth-
anol in air and the sintering treatment would lead to the
shrinkage of HA coatings and generate cracks, especially in
the cases of thicker deposits (as verified in the optical photos
in Fig. 4) [42]. This adverse effect could be alleviated by adding
GO sheets into the coatings. Zhang et al. [30] have illustrated
that the main mechanisms that prevent crack propagation in
graphene-based HA composites are frictional pull out, crack
deflection and crack bridging by graphene sheets. Due to its
high specific surface area and intrinsic thermodynamically
unstable property [54], GO displayed a nanostructured folding
and scrolling morphology near membrane edges, which are
supposed to enhance the mechanical interlocking with HA
nanoparticles and decrease the shrinkage of the HA coatings
during drying and sintering. Besides, these two dimensional
nanofillers could form effective reinforcement network with-
in the HA matrix to reduce the crack formation by bridging ef-
fect and increase the load-transfer efficiency between HA
matrix and GO fillers [30]. When the GO contents increased
to 5 wt.%, a relatively rough surface was observed (Fig. 4c),
which is preferable for natural bone in-growth. The rough-
ened 5GO/HA coating surface may originate from the large
particle size and low stability of the 5GO/HA suspensions as
verified from the results of TEM and Zeta potentials analysis.
This suggested that higher GO contents could result in coar-
ser surface. Besides, the deposition voltage and pH values of
the suspensions also have significant influences on the
microstructures of the resulting coatings; Hasan [55] have
produced GO-based films by EPD method with either a rela-
tively smooth (anodic deposition under high pH values) and
flat morphology or a porous microstructure (cathodic deposi-
tion under low pH values).
The effect of GO sheets on the bonding strength of the
coatings to the Ti substrate was measured according to
ASTM F1044-99 [40]. The adhesion strength for HA, 2GO/HA
and 5GO/HA coatings were 1.55 ± 0.39 MPa, 2.75 ± 0.38 MPa
and 3.3 ± 0.25 MPa, respectively, indicating GO could effec-
tively increase the binding strength of the coatings. Besides,
as shown in Fig. 4, GO could prevent peeling of the coatings
by transferring and eliminating the residual stress therein.
This is possibly due to the reduction in the mismatch of
the thermal expansion coefficients between the coatings
and Ti substrate by adding GO sheets into the HA layer,
and the increased cohesive strength within the HA nanopar-
ticles and GO nanofillers [24]. Moreover, some binding

C A R B O N 6 7 ( 2 0 1 4 ) 1 8 5 – 1 9 7 191
materials could be used to further enhance the binding
strength and biocompatibility of the GO/HA coatings, such
as chitosan, hyaluronic acid, aliginate and so on [56]. These
EPD coatings could be prepared on substrates of various
shapes and porous structures, and shaped according to the
bone defect size and shape [37].
The HA powders, pristine GO platelets and GO/HA com-
posite coatings were subjected to TGA analysis before sinter-
ing treatment (see Fig.5). Due to the high thermal stability of
HA, the HA powders and GO/HA composite coatings showed a
slow and less weight loss behavior during the heating process
from room temperature to 600 �C. On the contrary, GO plate-
lets suffered a dramatic 28% weight loss from 150 �C to
300 �C, and reached to 49.5% weight loss at 600 �C, because
of the pyrolysis of the labile oxygenic functional groups on
the GO surface. As shown in the inset, by contrast, there were
only 1.2% and 2.5% weight loss for 2GO/HA and 5GO/HA coat-
ings around 200 �C, which are also originated from the re-
moval of oxygenic groups as small molecules, such as H2O,
CO2, CO and so on [57]. It has been reported that thermal
treatment is one of the most simple and effective deoxygen-
ating approaches for reducing GO to graphene [57,58]. There-
fore, it is expected that the electrophoretically deposited GO/
HA composite coatings were partially reduced during the sin-
tering at 600 �C for 1 h under nitrogen atmosphere, which was
confirmed by the following Raman analysis.
The XRD patterns of the resulting samples are shown in
Fig. 6a and the diffraction peaks are assigned to GO (PDF#
09-0432) and Ti substrate. A strong and sharp (002) peak of
the pristine GO sheets at 2h = 11.1� was observed in the inset
of Fig. 6a, corresponding to an interlayer distance of 7.88 A
[21]. However the GO peaks were not detected in the XRD
analysis, most likely due to the damage of their crystallo-
graphic order and irregular arrays of atoms in three dimen-
sions [21,29]. Therefore, Raman analysis was employed to
identify the existence and property of the GO nano fillers in
the composite coatings. Both of the typical D band
(�1355 cm�1, originated from the disorder in the aromatic
Fig. 5 – TGA analysis of the pristine GO platelets, HA
coatings and GO/HA composite coatings prepared from
suspension with 2% and 5% GO contents. (A color version of
this article can be viewed online.)
structure or the graphene edges) and G band (�1593 cm�1,
due to the in plane vibration of the sp2 carbon atoms) in GO
were observed in Fig. 6b [59], together with characteristic Ra-
man peaks for HA at 447, 594 and 961 cm�1, which are attrib-
uted to the doubly degenerate bending mode m2(PO3�4 ), triply
degenerate bending mode m3(PO3�4 ) and totally symmetric
stretching mode m1(PO3�4 ), respectively [60]. The ratio of the
intensities of the two bands (ID/IG) could be used to determine
the sp2 domain size of graphite-based materials. Compared
with the pristine GO sheets (without sintering; ID/IG = 1.15),
the 2GO/HA (ID/IG = 0.88) and 5GO/HA (ID/IG = 0.83) displayed
low ID/IG values reflected the removal of defects and the con-
version of sp3 to sp2 carbons [61] during the post sintering of
the samples. Therefore the EPD GO/HA coatings were partially
reduced during the post sintering in our study.
3.3. Corrosion property of the coated samples
The corrosion resistance of the coated Ti in SBF was evaluated
by open circuit potential (OCP)-time measurements, anodic
polarization experiments and electrochemical impedance
analysis.
Compared with that of the bare Ti, the OCP-time curves of
all the coated (HA, 2GO/HA and 5GO/HA) specimens shifted
upwards (the noble direction) with initial minor fluctuations
and reached to the average potentials of �0.19, �0.15 and
�0.14 V after 60 min, respectively, which indicates the im-
proved corrosion resistance behavior of the coatings onto Ti.
Besides, the 5GO/HA coatings prepared under a potential of
30 V for 1 min displayed a higher OCP values than all the oth-
ers, with better anticorrosive property. As for the anodic
polarization plots shown in Fig. 7b, all the coated samples
have higher corrosion potential (Ecorr) and lower corrosion
current density (Icorr) than that of bare Ti, as listed in Table 1.
These values suggest that the HA and GO/HA coatings could
effectively increase the anti-corrosion properties of the Ti
substrate in SBF at 37 ± 0.1 �C (pH = 7.4). And the 5GO/HA
coating provided the most satisfactory protection upon Ti
among other samples.
In order to study the stability and corrosion resistance of
the GO/HA composite coatings, impedance spectra of the
samples at Ecorr after immersion 60 min in SBF are presented
in the form of Nyquist plots in Fig. 8(a) and Bode-phase and
Bode-magnitude plots in Fig. 8(c). It can be seen from the Ny-
quist plots (Fig. 8(a)) that the diameters of the semicircle for
the coated samples are bigger in comparison with that of
the Ti in SBF, which suggests the increase of the corrosion
resistance of the samples, with sort order of 5GO/HA > 2GO/
HA > HA > Ti. All the samples exhibit a linear slope around
�1 of the impedance spectra in Bode-log|Z| plots and display
a nearly capacitive nature across a wide range of frequency
in Bode-Phase angle plots in Fig. 8(b), indicating a characteris-
tic of passive coating response [62,63]. The impedance spectra
were further fitted with an equivalent circuit using ZSimpWin
software with the Re(QfRf) model for the uncoated Ti, in which
the Re represents the resistance of the electrolyte, Rf and Qf
represent the polarization resistance of the passive layer on
Ti substrate and the double-layer capacitance of the passive
layer-electrolyte interface. As for the electrophoretically
coated samples, the fitted curves were obtained using

Fig. 7 – Open-circuit potential vs time measurements (a), and anodic polarization plots (b) in SBF for the uncoated and HA,
2GO/HA and 5GO/HA coatings electrophoretically deposited onto the surface of Ti for 1 min under a constant potential of 30 V
and being sintered at 600 �C for 1 h. The inset table in (b) shows the corrosion potential (Ecorr) and corrosion current density
(Icorr) of the samples. (A color version of this article can be viewed online.)
Fig. 6 – The XRD patterns (a) and Raman spectra (b) of the HA, 2GO/HA and 5GO/HA composite coatings on Ti after 1 min
deposition and being sintered at 600 �C for 1 h. (A color version of this article can be viewed online.)
Table 1 – Electrochemical parameters of the uncoated and HA, 2GO/HA and 5GO/HA coated Ti substrate.
Re nf Rf Qf np Qp Rp nb Qb Rb
X cm2 kX cm2 lF cm�2 lF cm�2 kX cm2 lF cm�2 kX cm2
Ti 31 0.91 74.6 80.7 – – – – – –HA 29 – – – 0.823 13.90 4.70 0.861 15.90 119.02GOHA 30.9 – – – 0.867 4.77 5.32 0.734 10.80 152.05GOHA 33.32 – – – 0.887 2.94 70.4 0.623 2.60 438.0
192 C A R B O N 6 7 ( 2 0 1 4 ) 1 8 5 – 1 9 7
Re(Qp(Rp(RbQb))) model based on a two layer structure (an in-
ner compact layer and an outer relatively porous and un-
sealed layer), in which Re also represents the resistance of
the electrolyte, Rb represents the charge-transfer resistance
of the porous coatings, Rp represents the polarization resis-
tance of the Ti substrate, Qp represents the capacitance of
the compact inner passive layer, and Qb represents the electri-
cal double layer capacitance at the coating-electrolyte inter-
face [64]. The parameter values of the fitting results are
shown in Table 1. And the circuit displayed a perfect fit for
the experimental data with chi-square values below 10�3. As
can be seen in Table 1, compared with the Rf and Qf values
of the pristine Ti, the coated samples present higher Rb and
lower Qb, which predict the improvement in the corrosion
resistance of the coated samples.
The electrochemical analysis results above suggest that all
the coatings could effectively increase the corrosion resis-
tance of Ti in SBF. And the addition of GO into the HA coating
could further inhibit the corrosion process of the Ti substrate.
This could be ascribed to the uniform and compact coating
morphology, and the strong binding strength of the GO/HA
coatings to Ti substrate. Combined with the SEM observation,
as it can be seen in Fig. 9b-1, the pure HA coating contains
many cracks, which makes it easier for SBF solution to diffuse

Fig. 8 – Nyquist (a), and Bode (b) plots in SBF for the uncoated and HA, 2GO/HA and 5GO/HA coated Ti for 1 min under a
constant potential of 30 V and being sintered at 600 �C for 1 h. (A color version of this article can be viewed online.)
C A R B O N 6 7 ( 2 0 1 4 ) 1 8 5 – 1 9 7 193
into the coating and renders the Ti substrate vulnerable to
corrosion. Meanwhile the HA coatings could still provide
effective and obvious corrosion protection on the substrate
by acting as an insulating barrier, compared with the un-
coated and sintered Ti sheets. Although HA nanoparticles
showed a higher deposition rate than that of the GO/HA par-
ticle groups, which resulted in a higher coating thickness, the
HA coating exhibited less corrosion resistant behavior than
those of the GO/HA composite coatings. In terms of the
2GO/HA coating (Fig. 9b-2), the GO sheets within the sintered
HA layer could be functionalized as reinforcement network
and make the coating more compact and better corrosion
resistant. And increased protective effect of the coating on
Ti substrate was observed in 5GO/HA coating. When the GO
contents increased to 5 wt.% in the GO/HA suspensions, the
deposited GO sheets within the HA matrix, could connect
with each other, stack together (Fig. 9b-3) and provide a ‘tor-
tuous path’, effectively preventing penetrating of SBF solution
into the coatings and protecting the Ti substrate from corro-
sion. Meanwhile, as a pilot study, further research should be
Fig. 9 – The equivalent electrical circuit models fitted for the unc
for HA (b-1), 2GO/HA (b-2) and 5GO/HA (b-3) coatings after the sin
conducted to shade light on the in vivo corrosion behavior
of the GO/HA coatings, and the effects of the GO fillers on
the osseointegration and bone healing rate.
3.4. In vitro biocompatibility evaluation
Fig. 10 shows the in vitro L929 cell and MG63 cell viability cul-
tured with the uncoated and GO/HA coated Ti samples in
DMEM for 1, 3 and 5 days, respectively. The cells cultured with
pure cp Ti and HA coated Ti samples shown no statistical dif-
ferences in cell viability, but displayed lower cell viability than
that of the 2GO/HA coated samples. This indicates that com-
pared with pure HA coating, the presence of GO fillers could
promote the proliferation of L929 cells and MG63 cells [29].
It is reported that graphene or GO shows a positive effect on
SAOS-2 cells (Human osteoblast-like cell line) adhesion and
proliferation, and possesses the potential to induce mesen-
chymal stromal cells differentiation into the osteoblast line-
age [65–67]. The differentiation rate is comparable to the
one achieved with BMP-2 growth factor [66,67], thus it is
oated (a), and coated Ti (b) in SBF solution. Structure models
tering. (A color version of this article can be viewed online.)
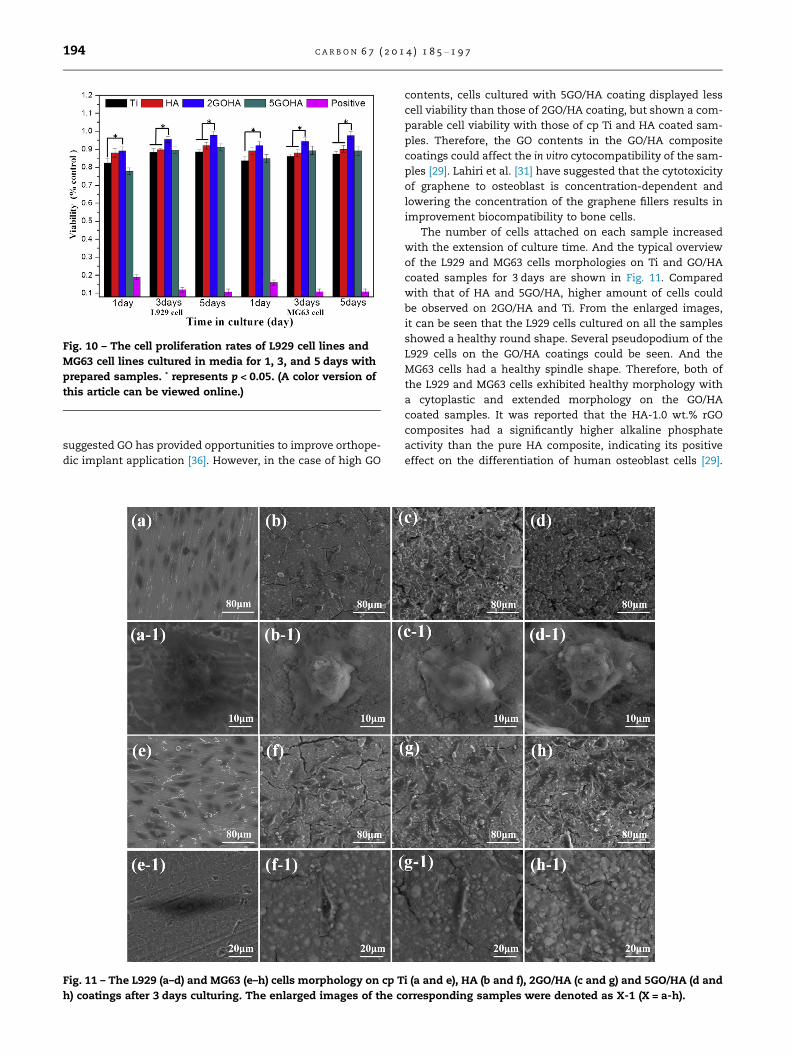
Fig. 10 – The cell proliferation rates of L929 cell lines and
MG63 cell lines cultured in media for 1, 3, and 5 days with
prepared samples. * represents p < 0.05. (A color version of
this article can be viewed online.)
194 C A R B O N 6 7 ( 2 0 1 4 ) 1 8 5 – 1 9 7
suggested GO has provided opportunities to improve orthope-
dic implant application [36]. However, in the case of high GO
Fig. 11 – The L929 (a–d) and MG63 (e–h) cells morphology on cp T
h) coatings after 3 days culturing. The enlarged images of the c
contents, cells cultured with 5GO/HA coating displayed less
cell viability than those of 2GO/HA coating, but shown a com-
parable cell viability with those of cp Ti and HA coated sam-
ples. Therefore, the GO contents in the GO/HA composite
coatings could affect the in vitro cytocompatibility of the sam-
ples [29]. Lahiri et al. [31] have suggested that the cytotoxicity
of graphene to osteoblast is concentration-dependent and
lowering the concentration of the graphene fillers results in
improvement biocompatibility to bone cells.
The number of cells attached on each sample increased
with the extension of culture time. And the typical overview
of the L929 and MG63 cells morphologies on Ti and GO/HA
coated samples for 3 days are shown in Fig. 11. Compared
with that of HA and 5GO/HA, higher amount of cells could
be observed on 2GO/HA and Ti. From the enlarged images,
it can be seen that the L929 cells cultured on all the samples
showed a healthy round shape. Several pseudopodium of the
L929 cells on the GO/HA coatings could be seen. And the
MG63 cells had a healthy spindle shape. Therefore, both of
the L929 and MG63 cells exhibited healthy morphology with
a cytoplastic and extended morphology on the GO/HA
coated samples. It was reported that the HA-1.0 wt.% rGO
composites had a significantly higher alkaline phosphate
activity than the pure HA composite, indicating its positive
effect on the differentiation of human osteoblast cells [29].
i (a and e), HA (b and f), 2GO/HA (c and g) and 5GO/HA (d and
orresponding samples were denoted as X-1 (X = a-h).

C A R B O N 6 7 ( 2 0 1 4 ) 1 8 5 – 1 9 7 195
Although graphene and its derivatives reinforced HA com-
posites could promote the adhesion and proliferation of
L929 fibroblast cells [21,25], MC3T3-E1 pre-osteoblast cells
[26,28,68] and MG63 human osteosarcoma cells [21], adverse
effect was also reported [26]. Thus, further researches should
be conducted to shed light on the biocompatibility of this
novel GO/HA coatings/composites and explore the possibility
of applying them to implants of load-bearing hard tissue
replacements.
4. Conclusion
It has been demonstrated that the novel GO reinforced HA
composite coatings were firstly successfully prepared on Ti
sheet using EPD method and the GO nanofillers therein could
be further partially reduced in the post sintering of the sam-
ples. During the coating process in ethanol at pH value of 3–4,
the addition of GO could reduce the deposition rate of the HA
nanoparticles. Microstructural analysis indicated that GO
sheets within the sintered HA layer was benefit to reduce
the coating cracks and prevented the coating detachment
effectively. Compared with pure HA coatings, the GO/HA coat-
ings had enhanced adhesion strength and corrosion resis-
tance, and the 5GO/HA coating provided the most
satisfactory protection upon Ti among other samples. In vitro
cytotoxicity evaluation suggested that compared with pure
HA coated and Ti substrate, the presence of GO fillers could
promote the proliferation of L929 cells and MG63 cells for
2GO/HA coated samples, and comparable to 5GO/HA coated
samples. These results could pave the way for the fabrication
of novel graphene-based HA composite coatings for biological
applications with combined improvement in mechanical
property and biocompatibility.
Acknowledgements
This work was supported by National Natural Science Foun-
dation of China (Nos. 31070846 and 30870623), National High
Technology Research and Development Program of China
(No. 2011AA030103), and National Basic Research Program
(973) of China (Nos. 2009CB930004 and 2012CB619102).
R E F E R E N C E S
[1] Feng LY, Chen Y, Ren JS, Qu XG. A graphene functionalizedelectrochemical aptasensor for selective label-free detectionof cancer cells. Biomaterials 2011;32(11):2930–7.
[2] Peng C, Hu WB, Zhou YT, Fan CH, Huang Q. Intracellularimaging with a graphene-based fluorescent probe. Small2010;6(15):1686–92.
[3] He SJ, Song B, Li D, Zhu CF, Qi WP, Wen YQ, et al. A graphenenanoprobe for rapid, sensitive, and multicolor fluorescentDNA analysis. Adv Funct Mater 2010;20(3):453–9.
[4] Wang Y, Li ZH, Hu DH, Lin CT, Li JH, Lin YH. Aptamer/graphene oxide nanocomplex for in situ molecular probing inliving cells. J Am Chem Soc 2010;132(27):9274–6.
[5] Sun XM, Liu Z, Welsher K, Robinson JT, Goodwin A, Zaric S,et al. Nano-graphene oxide for cellular imaging and drugdelivery. Nano Res 2008;1(3):203–12.
[6] Yang XY, Zhang XY, Liu ZF, Ma YF, Huang Y, Chen Y. High-efficiency loading and controlled release of doxorubicinhydrochloride on graphene oxide. J Phys Chem C2008;112(45):17554–8.
[7] Stankovich S, Dikin DA, Dommett GHB, Kohlhaas KM,Zimney EJ, Stach EA, et al. Graphene-based compositematerials. Nature 2006;442(7100):282–6.
[8] Mukhopadhyay P, Gupta RK. Trends and frontiers ingraphene-based polymer nanocomposites. Plast Eng2011;67(1):32–42.
[9] Yang X, Tu Y, Li L, Shang S, Tao X. Well-dispersed chitosan/graphene oxide nanocomposites. ACS Appl Mater Interfaces2010;2(6):1707–13.
[10] Wan C, Frydrych M, Chen B. Strong and bioactive gelatin–graphene oxide nanocomposites. Soft Matter2011;7(13):6159–66.
[11] Li R, Liu C, Ma J. Studies on the properties of graphene oxide-reinforced starch biocomposites. Carbohydr Polym2011;84(1):631–7.
[12] Wan C, Chen B. Poly (e-caprolactone)/graphene oxidebiocomposites: mechanical properties and bioactivity.Biomed Mater 2011;6(5):055010.
[13] Fang L, Leng Y, Gao P. Processing and mechanical propertiesof HA/UHMWPE nanocomposites. Biomaterials2006;27(20):3701–7.
[14] Huang JC, Ni YJ, Wang ZC. Preparation of hydroxyapatitefunctionally gradient coating on titanium substrate using acombination of electrophoretic deposition and reactionbonding process. Surf Coat Technol 2010;204(21):3387–92.
[15] Zhang B, Kwok CT. Hydroxyapatite–anatase–carbonnanotube nanocomposite coatings fabricated byelectrophoretic codeposition for biomedical applications. JMater Sci – Mater Med 2011;22(10):2249–59.
[16] Parente P, Sanchez-Herencia AJ, Mesa MJ, Ferrari B.Functionalizing Ti-surfaces through the EPD of HA/NanoY2O3. J Phys Chem B 2013;117(6):1600–7.
[17] Khor K, Gu Y, Pan D, Cheang P. Microstructure andmechanical properties of plasma sprayed HA/YSZ/Ti–6Al–4Vcomposite coatings. Biomaterials 2004;25(18):4009–17.
[18] Choi JW, Kong YM, Kim HE, Lee IS. Reinforcement ofhydroxyapatite bioceramic by addition of Ni3Al and Al2O3. JAm Ceram Soc 1998;81(7):1743–8.
[19] Ustundag CB, Avciata O, Kaya F, Kaya C. Hydrothermallymixed hydroxyapatite-multi wall carbon nanotubescomposite coatings on biomedical alloys by electrophoreticdeposition. J Phys Chem B 2013;117(6):1571–6.
[20] Lahiri D, Ghosh S, Agarwal A. Carbon nanotube reinforcedhydroxyapatite composite for orthopedic application: areview. Mat Sci Eng C-Mater 2012;32(7):1727–58.
[21] Li M, Wang Y, Liu Q, Li Q, Cheng Y, Zheng Y, et al. In situsynthesis and biocompatibility of nano hydroxyapatite onpristine and chitosan functionalized graphene oxide. J MaterChem B 2013;1(4):475–84.
[22] Neelgund GM, Oki A, Luo Z. In-situ deposition ofhydroxyapatite on graphene nanosheets. Mater Res Bull2013;48(2):175–9.
[23] Rodrıguez-Lorenzo Luis M, Benito-Garzon Lorena, Barroso-Bujans Fabienne, Fernandez Mar. Synthesis andbiocompatibility of hydroxyapatite in a graphite oxidematrix. Key Eng Mater 2008;396–398:477–80.
[24] Kim S, Ku SH, Lim SY, Kim JH, Park CB. Graphene–biomineralhybrid materials. Adv Mater 2011;23(17):2009–14.
[25] Liu H, Xi P, Xie G, Shi Y, Hou F, Huang L, et al. Simultaneousreduction and surface functionalization of graphene oxidefor hydroxyapatite mineralization. J Phys Chem C2012;116(5):3334–41.
[26] Zhu J, Wong HM, Yeung KWK, Tjong SC. Spark plasmasintered hydroxyapatite/graphite nanosheet and

196 C A R B O N 6 7 ( 2 0 1 4 ) 1 8 5 – 1 9 7
hydroxyapatite/multiwalled carbon nanotube composites:mechanical and in vitro cellular properties. Adv Eng Mater2011;13(4):336–41.
[27] Biris AR, Mahmood M, Lazar M, Dervishi E, Watanabe F,Mustafa T, et al. Novel multicomponent and biocompatiblenanocomposite materials based on few-layer graphenessynthesized on a gold/hydroxyapatite catalytic system withapplications in bone regeneration. J Phys Chem C2011;115(39):18967–76.
[28] Ma HB, Su WX, Tai ZX, Sun DF, Yan XB, Liu B, et al.Preparation and cytocompatibility of polylactic acid/hydroxyapatite/graphene oxide nanocomposite fibrousmembrane. Chinese Sci Bull 2012;57(23):3051–8.
[29] Liu Y, Huang J, Li H. Synthesis of hydroxyapatite-reducedgraphite oxide nanocomposites for biomedical applications:oriented nucleation and epitaxial growth of hydroxyapatite. JMater Chem B 2013;1(13):1826–34.
[30] Zhang L, Liu W, Yue C, Zhang T, Li P, Xing Z, et al. A toughgraphene nanosheet/hydroxyapatite composite withimproved in vitro biocompatibility. Carbon 2013;61(1):105–15.
[31] Lahiri D, Dua R, Zhang C, de Socarraz-Novoa I, Bhat A,Ramaswamy S, et al. Graphene nanoplatelet-inducedstrengthening of ultrahigh molecular weight polyethyleneand biocompatibility in vitro. ACS Appl Mater Interfaces2012;4(4):2234–41.
[32] Rafiee MA, Rafiee J, Wang Z, Song H, Yu ZZ, Koratkar N.Enhanced mechanical properties of nanocomposites at lowgraphene content. ACS Nano 2009;3(12):3884–90.
[33] Walker LS, Marotto VR, Rafiee MA, Koratkar N, Corral EL.Toughening in graphene ceramic composites. ACS Nano2011;5(4):3182–90.
[34] Wang K, Ruan J, Song H, Zhang J, Wo Y, Guo S, et al.Biocompatibility of graphene oxide. Nanoscale Res Lett2011;6(8).
[35] Akhavan O, Ghaderi E. Toxicity of graphene and grapheneoxide nanowalls against bacteria. ACS Nano2010;4(10):5731–6.
[36] Yang L, Zhang L, Webster TJ. Carbon nanostructures fororthopedic medical applications. Nanomedicine2011;6(7):1231–44.
[37] Boccaccini A, Keim S, Ma R, Li Y, Zhitomirsky I.Electrophoretic deposition of biomaterials. J R Soc Interface2010;7(Suppl. 5):S581–613.
[38] Fukada Y, Nagarajan N, Mekky W, Bao Y, Kim HS, Nicholson P.Electrophoretic deposition-mechanisms, myths andmaterials. J Mater Sci 2004;39(3):787–801.
[39] Chavez A, Shaffer MSP, Boccaccini AR. Applications ofgraphene electrophoretic deposition. A review. J Phys Chem B2013;117(6):1502–15.
[40] Albayrak O, El-Atwani O, Altintas S. Hydroxyapatite coatingon titanium substrate by electrophoretic deposition method:effects of titanium dioxide inner layer on adhesion strengthand hydroxyapatite decomposition. Surf Coat Technol2008;202(11):2482–7.
[41] Kokubo T, Takadama H. How useful is SBF in predictingin vivo bone bioactivity? Biomaterials 2006;27(15):2907–15.
[42] Besra L, Liu M. A review on fundamentals and applications ofelectrophoretic deposition (EPD). Prog Mater Sci2007;52(1):1–61.
[43] Kim J, Cote LJ, Kim F, Yuan W, Shull KR, Huang J. Grapheneoxide sheets at interfaces. J Am Chem Soc2010;132(23):8180–6.
[44] Lee D, De Los Santos VL, Seo J, Felix LL, Bustamante DA, ColeJ, et al. The structure of graphite oxide: investigation of itssurface chemical groups. J Phys Chem B 2010;114(17):5723–8.
[45] Withers N. Graphene oxide: surfactant sheets. Nat Chem2010. http://dx.doi.org/10.1038/nchem.741.
[46] Ma J, Liang CH, Kong LB, Wang C. Colloidal characterizationand electrophoretic deposition of hydroxyapatite on titaniumsubstrate. J Mater Sci – Mater Med 2003;14(9):797–801.
[47] Coelho JM, Moreira JA, Almeida A, Monteiro FJ. Synthesis andcharacterization of HAp nanorods from a cationic surfactanttemplate method. J Mater Sci – Mater Med 2010;21(9):2543–9.
[48] Dor S, Ruhle S, Ofir A, Adler M, Grinis L, Zaban A. Theinfluence of suspension composition and deposition modeon the electrophoretic deposition of TiO2 nanoparticleagglomerates. Colloid Surf A 2009;342(1–3):70–5.
[49] Doane TL, Chuang CH, Hill RJ, Burda C. Nanoparticle zeta-potentials. Acc Chem Res 2012;45(3):317–26.
[50] Kim KH, Ramaswamy N. Electrochemical surfacemodification of titanium in dentistry. Dent Mater J2009;28(1):20–36.
[51] Zhitomirsky I, Gal-Or L. Electrophoretic deposition ofhydroxyapatite. J Mater Sci – Mater Med 1997;8(4):213–9.
[52] Jarernboon W, Pimanpang S, Maensiri S, Swatsitang E,Amornkitbamrung V. Effects of multiwall carbon nanotubesin reducing microcrack formation on electrophoreticallydeposited TiO2 film. J Alloy Compd 2009;476(1–2):840–6.
[53] Sarkar P, De D, Rho H. Synthesis and microstructuralmanipulation of ceramics by electrophoretic deposition. JMater Sci 2004;39(3):819–23.
[54] Meyer J, Geim A, Katsnelson M, Novoselov K, Obergfell D,Roth S, et al. On the roughness of single- and bi-layergraphene membranes. Solid State Commun 2007;143(1–2):101–9.
[55] Hasan SA, Rigueur JL, Harl RR, Krejci AJ, Gonzalo-Juan I,Rogers BR, et al. Transferable graphene oxide films withtunable microstructures. ACS Nano 2010;4(12):7367–72.
[56] Grandfield K, Sun F, FitzPatrick M, Cheong M, Zhitomirsky I.Electrophoretic deposition of polymer-carbon nanotube-hydroxyapatite composites. Surf Coat Technol 2009;203(10–11):1481–7.
[57] Chen CM, Huang JQ, Zhang Q, Gong WZ, Yang QH, Wang MZ,et al. Annealing a graphene oxide film to produce a freestanding high conductive graphene film. Carbon2012;50(2):659–67.
[58] Jeong HK, Lee YP, Jin MH, Kim ES, Bae JJ, Lee YH. Thermalstability of graphite oxide. Chem Phys Lett 2009;470(4–6):255–8.
[59] Kudin KN, Ozbas B, Schniepp HC, Prud’homme RK, Aksay IA,Car R. Raman spectra of graphite oxide and functionalizedgraphene sheets. Nano Lett 2008;8(1):36–41.
[60] Koutsopoulos S. Synthesis and characterization ofhydroxyapatite crystals: a review study on the analyticalmethods. J Biomed Mater Res 2002;62(4):600–12.
[61] Cheng M, Yang R, Zhang LC, Shi ZW, Yang W, Wang DM, et al.Restoration of graphene from graphene oxide by defectrepair. Carbon 2012;50(7):2581–7.
[62] Balamurugan A, Balossier G, Michel J, Ferreira JMF.Electrochemical and structural evaluation of functionallygraded bioglass-apatite composites electrophoreticallydeposited onto Ti6Al4V alloy. Electrochim Acta2009;54(4):1192–8.
[63] Wang Y, Li H, Cheng Y, Wei S, Zheng Y. Corrosionperformances of a nickel-free Fe-based bulk metallic glass insimulated body fluids. Electrochem Commun2009;11(11):2187–90.
[64] Lewis G, Vejerla R, Mishra S. One equivalent electrical circuitis applicable to model the interface between the passivesurface layer on an orthopaedic alloy and a biosimulatingaqueous solution. Bio-Med Mater Eng 2007;17(2):97–108.
[65] Kalbacova M, Broz A, Kong J, Kalbac M. Graphene substratespromote adherence of human osteoblasts and mesenchymalstromal cells. Carbon 2010;48(15):4323–9.

C A R B O N 6 7 ( 2 0 1 4 ) 1 8 5 – 1 9 7 197
[66] Lee WC, Lim CHYX, Shi H, Tang LAL, Wang Y, Lim CT, et al.The origin of enhanced stem cell growth and differentiationon graphene and graphene oxide. ACS Nano2011;5(9):7334–41.
[67] Nayak TR, Andersen H, Makam VS, Khaw C, Bae S, Xu X,et al. Graphene for controlled and accelerated osteogenic
differentiation of human mesenchymal stem cells. ACS Nano2011;5(6):4670–8.
[68] Kim S, Ku SH, Lim SY, Kim JH, Park CB. Graphene–biomineralhybrid materials. Adv Mater 2011;23(17):2009–14.