measuring u.s. military readiness jason forrester, michael ... · pdf filepage 100 spring 2001...
TRANSCRIPT
99
PERSPECTIVES
Measuring U.S. Military Readiness
Jason Forrester,Michael O’Hanlon, and
Micah Zenko
© National Security Studies Quarterly Volume VII, Issue 2 (Spring 2001).
ARE U.S. ARMED FORCES READY? THAT IS, CAN THEY ACCOMPLISH THE
likely near-term missions that they are designed to handle? Thesequestions were central in the 2000 presidential campaign, not to
mention in congressional hearings throughout the last half-decade. Phrasingthe issue in this way leaves aside the broader strategic question of whatAmerica’s military should be ready for—a question that is admittedly atleast as important, but different. Measuring and understanding traditionalmilitary readiness, narrowly defined, is difficult and contentious enoughthat it warrants separate treatment. We attempt to provide such an as-sessment here. On the whole, today’s U.S. military is in goodshape—comparable in general to typical levels during the 1980s. It is notas ready as the military of the early 1990s, however, and several trendlines have continued downward in recent years. Existing problems re-quire prompt attention before readiness deteriorates to the point where itsignificantly affects U.S. military capabilities and security interests.
CURRENT AND FUTURE U.S. MILITARY READINESS
To assess military readiness, the proper approach is to inquire if the U.S.armed forces have enough of the right types of skilled and adequatelytrained personnel, and if they own adequate stocks of equipment in good
Michael O’Hanlon is a senior fellow at the Brookings Institution. This article is adapted froma chapter in Defense Policy Choices for the Bush Administration (Brookings Institution Press,2001) for which Mr. Forrester and Mr. Zenko performed much of the research.

PAGE 100 SPRING 2001 • NSSQ
Perspectives • Forrester, O’Hanlon, and Zenko
working order. Although a plethoraof readiness statistics and stories ex-ist, all ultimately bear on these twobroad issues.
Analyzing readiness in this wayis intentionally somewhat narrow.It focuses on the nuts and bolts ofwell-understood military opera-tions. It does not address thebroader question of strategic readi-ness—whether the United States asa country has prepared for the righttypes of threats, and developed theright types of policy instruments toaddress them. This article simplyfocuses on the internal consistencyof Pentagon plans. Given how theDepartment of Defense and theU.S. Government as a whole haveassessed and described threats tothe country’s interests, have theyalso maintained military forces ca-pable of handling those likelythreats?
Even when the question of mili-tary readiness is put in these ratherlimited, technical terms, it is a diffi-cult and contentious matter. In fact,it was this rather narrow questionthat played heavily in the recentpresidential campaign. Then-TexasGovernor George W. Bush allegedthat the military was suffering from“long neglect,” having been under-funded and over-used during theClinton-Gore administration, withtwo Army divisions simply unready
for combat and many other unitsstrained and weakened. Vice Presi-dent Gore and his running mate,Senator Joseph Lieberman, claimedin rebuttal that the U.S. military wasin outstanding condition. With a fewexceptions, these debates were gen-erally not about broader matters ofstrategy and grand strategy. Theywere about the day-to-day condi-tion of military personnel,equipment, and individual combatunits. But even if the issue wassomewhat overrated in the presi-dential race, it is nonethelessimportant.
It was to the credit of then-Gov-ernor Bush and his running mate,former Defense Secretary RichardCheney, that they raised the issueof readiness, and largely to the Re-publican-led Congress’s credit thatmeasures have been taken in recentyears to improve readiness. Thatsaid, available data and other infor-mation suggest that the Democrats’claims during the 2000 campaignwere mostly right. Today’s military,while strained and in some casesoverworked, remains strong andcompetent to handle the kinds ofmissions contemplated by currentPentagon plans. As General HenryH. Shelton, the chairman of theJoint Chiefs of Staff, pointed out,Bush was plainly wrong when hesaid in his speech to the Republi-
NSSQ • SPRING 2001 PAGE 101
Measuring U.S. Military Readiness
can National Convention that twoArmy divisions were unready forduty. The data Bush used was old,and no longer valid. Moreover, in abroader sense, the reason those di-visions had been declared “un-ready” was that they were partiallyinvolved in on-going operations inthe Balkans. The fact that the Pen-tagon considered them unreadybecause they were deterringSlobodan Milosevic and helpingkeep the peace in an area of keyU.S. national interest in Europe,rather than training to fight in Iraqor North Korea, is an artifact of astrange and somewhat myopicreadiness measurement systemmaking little strategic sense.1
Indeed, some readiness indica-tors should simply not be taken tooseriously. As another example, thepurported cruise missile shortagethat Dick Cheney criticized duringthe 2000 presidential race still leftthe United States with an inventoryof almost ten times as many cruisemissiles as it used in Desert Storm.2
The shortage of a new weapon, thejoint direct attack munition (JDAM),in Operation Allied Force in 1999was not due to negligence in mili-tary planning or inattention toreadiness, but to the fact that JDAM
was new at the time, and only amodest number had been producedby the time NATO went to war against
Serbia.3
In a broader sense, however,there are enough signs of strain inthe force that more remedial mea-sures are called for. By mostreadiness indicators—such as thequality of people, mission-capablerates of equipment, and rigor oftraining—the U.S. military’s condi-tion was as good in 2000 as it hadbeen through most of the 1980s.However, readiness in 2000 was notas good as in 1990 or 1992; readi-ness levels did head downwardduring most of the Clinton-Goreera. That trend was beginning to bearrested by the time of the 2000presidential campaign. But it re-mained—and remains—worrisomenonetheless. The men and womenof the U.S. armed forces, while stillshowing reasonably good moraleand performing very well in mis-sions abroad, are more discouragedabout life and conditions within themilitary than they have been in twodecades.
Moreover, given how muchtoday’s military is being used, andhow much smaller it has become, itmay not be adequate for readinesslevels to be comparable to their1980s values. Such a statement iscounterintuitive, given how manyresources Ronald Reagan devotedto the military. But the armed forcesof the 1980s were focused at least
PAGE 102 SPRING 2001 • NSSQ
Perspectives • Forrester, O’Hanlon, and Zenko
as much on deterring a major warthat never happened and was not,by then, particularly likely to hap-pen, as on conducting variousoperations around the world.Today’s armed forces have moreimmediate and frequent missions,and are deterring conflicts in thePersian Gulf and Korea that areprobably more likely than was athird world war between NATO andthe Warsaw Pact by Reagan’s time.By such reasoning, today’s militaryshould be more ready than Presi-dent Reagan’s had to be.
The following assessment ofreadiness examines the issue fromfive perspectives. The first focuseson spending for readiness. The nexttwo pertain to the near-term pre-paredness of the military—readiness in its most literal sense.One focuses on the condition ofequipment, and the other on thequality, preparedness, and availabil-ity of personnel. The Clinton-Goreadministration deserves a fairly highgrade in these first three categories.However, for the next two catego-ries—ensuring equipment readinessand personnel readiness for the de-cade to come—it deserves only amediocre grade. Because U.S. mili-tary equipment is aging rapidly, andbecause many personnel feel over-worked and over-deployed, acontinuation of recent trends in
hardware and in personnel coulderode readiness over the yearsahead. Fortunately, there are someindications that the recent negativetrends are being reversed, but thecountry is hardly out of the woodsyet.
Spending for ReadinessThere is no clear single account forreadiness, but the operations andmaintenance (O&M) budget is thebest proxy. It funds everything fromtraining to repairs to purchases ofspare parts to deployments. (Fund-ing for personnel is considered aspart of a broader analysis in the fol-lowing section.)
Per active-duty person, re-sources for operation and mainte-nance increased greatly in recentyears—from levels around $52,000in 1985, to $56,000 in 1990, to$74,000 by 2000 (as measured ineach case in constant 2001 dollars).4
That is a very large increase. How-ever, it overstates actual funding forreadiness, since there are increas-ingly large parts of the O&M budgetthat do not fund readiness-relatedactivities.
To make budget comparisonsmeaningful, one should subtract outspending for types of O&M activi-ties that have become much greaterin recent years. They include envi-ronmental cleanup, frequent

NS
SQ • S
PR
ING 2001
PA
GE 103
Me
asu
ring
U.S
. Milita
ry Re
ad
ine
ss23.5
24
24.5
25
25.5
26
26.5
27
27.5
28
1973 1974 1975 1976 1977 1978 1979 1980 1981 1982 1983 1984 1985 1986 1987 1988 1989 1990 1991 1992 1993 1994 1995 1996 1997 1998 1999 Mar-00
0
10
20
30
40
50
60
70
80
90
100
MEAN AGE(LEFTSCALE)
MEANMONTHS OFSERVICE(RIGHTSCALE)
Source: Department of Defense, Office of the Assistant Secretary of Defense (Force Management Policy), 1998 Population Representation in the Military Services , p. D-16, (http://dticaw.dtic.mil/prhome/poprep98/html/d16.html [May 16, 2000]).
Figure 1. Age and Experience of U.S. Troops, 1973-2000

PAGE 104 SPRING 2001 • NSSQ
Perspectives • Forrester, O’Hanlon, and Zenko
contingencies abroad, spare partspurchases formerly made out of theprocurement budget—as well asmore expensive health care and toolarge of a base infrastructure. Ac-counting for such effects, adjustedresources for O& M remain about$65,000 per person in constant dol-lar terms.5 That would seem tosuggest more than ample funding.
But again, it is not quite sosimple. Historical trends since 1970show a typical real increase in O&M
spending per uniformed member ofthe armed forces at roughly 2% peryear. So over a decade, one mightexpect costs that were $56,000 in1990 to grow to at least $65,000 in2000. As a result, even if substan-tial additional resources are beingpoured into readiness accounts, itis not obvious that the increaseshave been adequate.
There are two points here. First,net O&M costs will probably keepgoing up, even if privatizations,base closures, and other economiesare successfully achieved. Thus, thehistorical record suggests that realO&M costs per capita will continueto grow. In fact, even allowing forpossible savings from privatizationsand other reforms, it would be ex-cessively optimistic to assumeannual per-capita cost growth ofless than 1% in real terms. Second,to gain real insight into the state of
U.S. military readiness, one mustlook deeper, and at more specificmeasures. The broad spending data,not surprisingly, are insufficient.
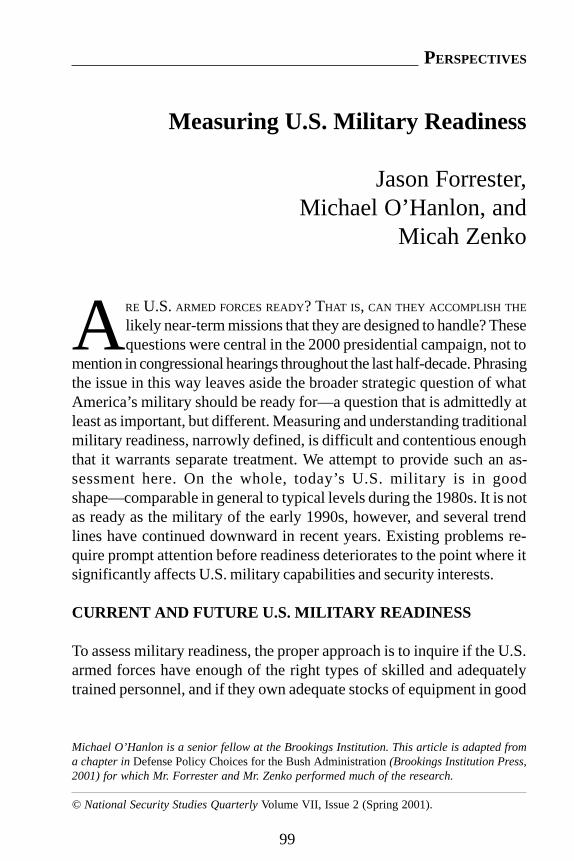
Readiness of Personnel TodayConsider therefore the men andwomen of the military. By somemetrics, they have never been bet-ter.6 As measured by time inuniform, personnel are more expe-rienced than in the Reagan and Bushyears (see Figure 1). Their scoreson aptitude tests are higher than inmost of the Reagan years, thoughlower than the Bush and earlyClinton years (see Figure 2). Bythese metrics, conditions generallypeaked in the mid-1990s, but re-main very strong today, and nearpeak levels.
Training remains rigorous aswell. Whether it is miles driven pertank crew per year, flight hours perfighter pilot per month, steamingdays per ship per quarter, or someother metric of the intensity of train-ing and exercises, today’s levelscompare favorably with those of the1980s and early 1990s. In somecases they are 10% less, but morecommonly they are within 5% of thenumerical goals used under Presi-dents Reagan and Bush—and thebenefits of improved simulatorsshould not be ignored either.7
NS
SQ • S
PR
ING 2001
PA
GE 105
Me
asu
ring
U.S
. Milita
ry Re
ad
ine
ss
Figure 2. Aptitude Scores of Enlisted Recruits 1973-2000*
0
1 0
2 0
3 0
4 0
5 0
6 0
7 0
8 0
1973
1974
1975
1976
1977
**
1978
**
1979
**
1980
**
1981
**
1982
1983
1984
1985
1986
1987
1988
1989
1990
1991
1992
1993
1994
1995
1996
1997
1998
1999
2000
***
Source: Department of Defense, Office of the Assistant Secretary of Defense (Force Management Policy), 1998 Population Representation in theMilitary Services, p. D-16, (http://dticaw.dtic.mil/prhome/poprep98/html/d13.html [May 16, 2000]) and Alphonso Maldon, Jr., Assistant Secretaryof Defense for (Force Management Policy), "Prepared Testimony Before the Senate Committee on Armed Services Personnel Subcommittee,"February 24, 2000, (http://www.senate.gov/~armed_services/statemnt/2000/000224am.pdf [May 19, 2000]).
* Many individuals taking the test ultimately do not join the military, but their scores constitute a database against which one can evaluate those whoare enlisted.**ASVAB misonomering, 1977-1981. ASVAB = Armed Services Vocational Aptitude Battery. AFQT is one component of ASVAB.*** 2000 data current as of March.
Percent of recruits scoring above average on the Armed Forces Qualification Test (AFQT)

PA
GE
106
SP
RIN
G 20
01 •
NSS
Q
Per
spec
tives
• F
orre
ster
, O’H
anlo
n, a
nd Z
enko
4.8 5.5 5 4.8
7.15.5
7
11.7
14.3
4 4 43 3
2
4.1 3.6 4.1 4.2 3.72.2 2.6 2.4 3 2.8 3.6
4.8 5.5
-6.2
-3.6
-0.8-1.7
-0.5
-5.8
1.4
8.1
0.8-0.3 0.4 1.1
-0.6-2.1
-0.7-1.8
-0.11.2 0.7
-0.4 -0.2 -0.50.7 1.2 1.4 1.6 2.3
-6.5
-10
-5
0
5
10
15
20
74 75 76 77 78 79 80 81 82 83 84 85 86 87 88 89 90 91 92 93 94 95 96 97 98 99
Jan-
00
Jul-0
0
Nominal increase
Real increase
Sources: Office of the Under Secretary of Defense for Personnel and Readiness, Defense Manpower Requirements Report, Fiscal Year2001, (May 2000), Table 6-2, Percentage Pay Raises, p. 71 (http://dticaw.dtic.mil/prhome/docs/fy2001.pdf [June 12, 2000]) and MinneapolisFederal Reserve, Consumer Price Index, 1913-present, (http://minneapolisfed.org/economy/calc/hist1913.html [June 12, 2000]).
* Overall average percentage increase in basic pay, basic allowance for quarters, and basic allowance for subsistence.
Pe
rce
nn
t
Figure 3. Military Pay Raises,* 1974-2000
NSSQ • SPRING 2001 PAGE 107
Measuring U.S. Military Readiness
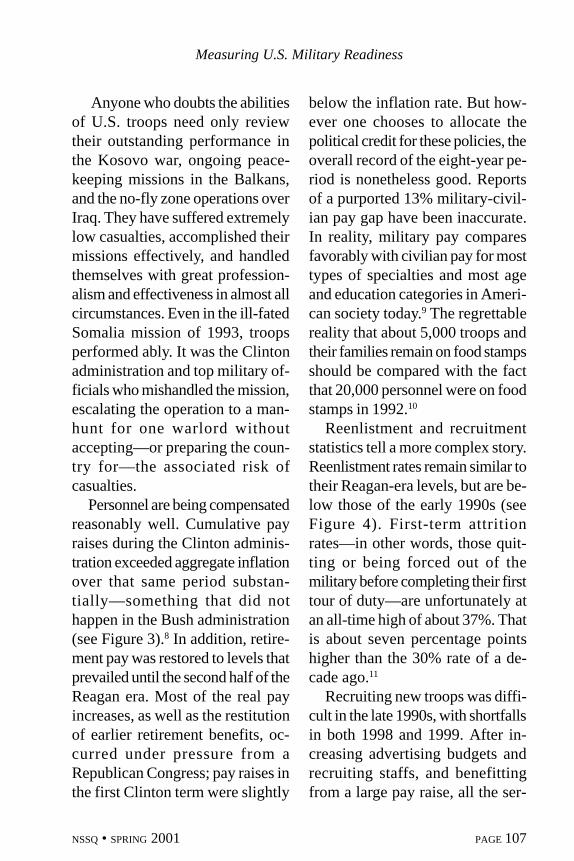
Anyone who doubts the abilitiesof U.S. troops need only reviewtheir outstanding performance inthe Kosovo war, ongoing peace-keeping missions in the Balkans,and the no-fly zone operations overIraq. They have suffered extremelylow casualties, accomplished theirmissions effectively, and handledthemselves with great profession-alism and effectiveness in almost allcircumstances. Even in the ill-fatedSomalia mission of 1993, troopsperformed ably. It was the Clintonadministration and top military of-ficials who mishandled the mission,escalating the operation to a man-hunt for one warlord withoutaccepting—or preparing the coun-try for—the associated risk ofcasualties.
Personnel are being compensatedreasonably well. Cumulative payraises during the Clinton adminis-tration exceeded aggregate inflationover that same period substan-tially—something that did nothappen in the Bush administration(see Figure 3).8 In addition, retire-ment pay was restored to levels thatprevailed until the second half of theReagan era. Most of the real payincreases, as well as the restitutionof earlier retirement benefits, oc-curred under pressure from aRepublican Congress; pay raises inthe first Clinton term were slightly
below the inflation rate. But how-ever one chooses to allocate thepolitical credit for these policies, theoverall record of the eight-year pe-riod is nonetheless good. Reportsof a purported 13% military-civil-ian pay gap have been inaccurate.In reality, military pay comparesfavorably with civilian pay for mosttypes of specialties and most ageand education categories in Ameri-can society today.9 The regrettablereality that about 5,000 troops andtheir families remain on food stampsshould be compared with the factthat 20,000 personnel were on foodstamps in 1992.10
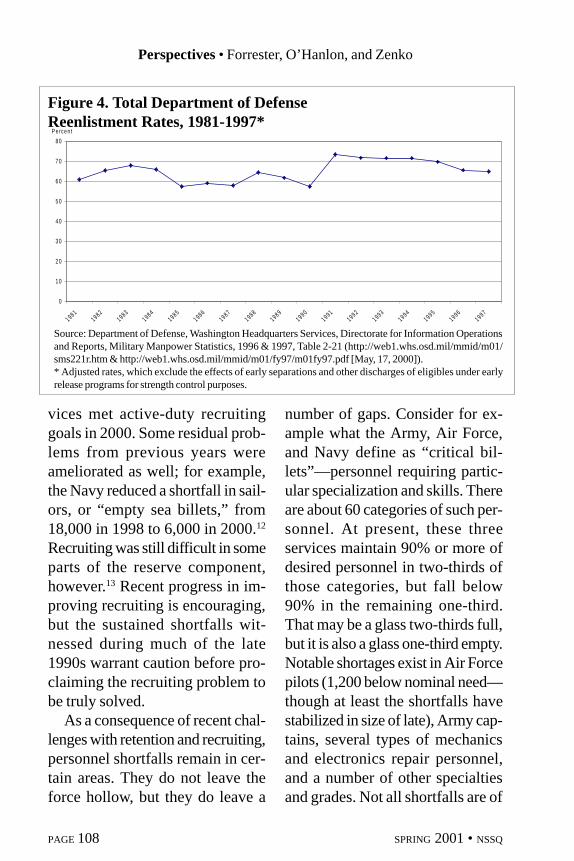
Reenlistment and recruitmentstatistics tell a more complex story.Reenlistment rates remain similar totheir Reagan-era levels, but are be-low those of the early 1990s (seeFigure 4). First-term attritionrates—in other words, those quit-ting or being forced out of themilitary before completing their firsttour of duty—are unfortunately atan all-time high of about 37%. Thatis about seven percentage pointshigher than the 30% rate of a de-cade ago.11
Recruiting new troops was diffi-cult in the late 1990s, with shortfallsin both 1998 and 1999. After in-creasing advertising budgets andrecruiting staffs, and benefittingfrom a large pay raise, all the ser-
PAGE 108 SPRING 2001 • NSSQ
Perspectives • Forrester, O’Hanlon, and Zenko
0
1 0
2 0
3 0
4 0
5 0
6 0
7 0
8 0
19811982
19831984
19851986
19871988
19891990
19911992
19931994
19951996
1997
P e rce n t
S o u rce : D epartm en t o f D e fen se , W ash ing to n H ead qu arte rs S erv ices, D irec to ra te fo r In fo rm atio n O p era tio n s and R ep orts , M il i ta ry M a n po w er S ta tis t ics, 19 9 6 & 1 9 97 , T ab le 2 -2 1 (h ttp ://w eb1 .w h s .o sd .m il/m m id /m 01 /sm s22 1 r.h tm & h ttp ://w eb1 .w h s .o sd .m il/m m id /m 01 /fy9 7 /m 0 1 fy97 .p d f [M ay, 1 7 , 2 0 00 ] ).
* A d jus te d ra tes , w h ic h e x c lu d e the ef fe c ts o f e a rly se p a rat io n s a nd o the r d isc h a rg e s o f e lig ib le s u nd e r e a r ly re le a se p ro g ra m s fo r stren g th c o n tro l p u rp o se s.
vices met active-duty recruitinggoals in 2000. Some residual prob-lems from previous years wereameliorated as well; for example,the Navy reduced a shortfall in sail-ors, or “empty sea billets,” from18,000 in 1998 to 6,000 in 2000.12
Recruiting was still difficult in someparts of the reserve component,however.13 Recent progress in im-proving recruiting is encouraging,but the sustained shortfalls wit-nessed during much of the late1990s warrant caution before pro-claiming the recruiting problem tobe truly solved.
As a consequence of recent chal-lenges with retention and recruiting,personnel shortfalls remain in cer-tain areas. They do not leave theforce hollow, but they do leave a
number of gaps. Consider for ex-ample what the Army, Air Force,and Navy define as “critical bil-lets”—personnel requiring partic-ular specialization and skills. Thereare about 60 categories of such per-sonnel. At present, these threeservices maintain 90% or more ofdesired personnel in two-thirds ofthose categories, but fall below90% in the remaining one-third.That may be a glass two-thirds full,but it is also a glass one-third empty.Notable shortages exist in Air Forcepilots (1,200 below nominal need—though at least the shortfalls havestabilized in size of late), Army cap-tains, several types of mechanicsand electronics repair personnel,and a number of other specialtiesand grades. Not all shortfalls are of
Figure 4. Total Department of DefenseReenlistment Rates, 1981-1997*
Source: Department of Defense, Washington Headquarters Services, Directorate for Information Operationsand Reports, Military Manpower Statistics, 1996 & 1997, Table 2-21 (http://web1.whs.osd.mil/mmid/m01/sms221r.htm & http://web1.whs.osd.mil/mmid/m01/fy97/m01fy97.pdf [May, 17, 2000]).* Adjusted rates, which exclude the effects of early separations and other discharges of eligibles under earlyrelease programs for strength control purposes.

NSSQ • SPRING 2001 PAGE 109
Measuring U.S. Military Readiness
great concern; some could be ad-dressed successfully simply bymanning the highest-priority posi-tions first. Others are more serious,and affect combat capability.14 Theymay require targeted pay raises orother inducements to attract andkeep adequate numbers of individu-als with the requisite abilities.
Morale is fair. In 1999, 65% ofall officers and 46% of enlisted per-sonnel said that they were satisfiedwith their lives (those dissatisfiedtotaled 18% and 31%, respec-tively). But those numbers are notoutstanding, and are down fromearlier levels.15 All in all, 51% ofpersonnel said it was likely that theywould stay in the military for an
extended period, while 35% saidthey were likely to leave—reason-able numbers but not excellent ones.The overwhelming majority of ser-vicemen, 75%, believe that theywould have more free time if theyworked in the private sector (seeFigure 5). Most work more than 40hours a week, and nearly half hadworked more than 50 hours theweek before being surveyed in arecent study. These numbers do notdescribe a force in crisis, but theydo reflect a military feeling over-worked and strained.16
Readiness of Equipment TodayAs for available weaponry, mostU.S. military equipment is not in
6675
3620 19
34
147
30
0
20
40
60
80
Total compensation Personal/family timeavailable
Retirement Benefits
Civilian better No difference/Don't know Military Better
Source: Norman J. Rabkin, "Military Personnel: Preliminary Results of DOD's 1999 Survey of Active Duty Members," presented to Subcommittee on Military Personnel, House Committee on Armed Services, GAO/T-NSIAD-00-110 , Mar. 8, 2000, (http://www.gao.gov/cgi-bin/getrpt?GAO/T-NSIAD-00-110 [May 19,2000]).
Percent
Figure 5. Troop Perceptions About Civilian and MilitaryLife, 1999
Source: Norman J. Rabkin, "Military Personnel: Preliminary Results of DOD's 1999 Surveyof Active Duty Members," presented to Subcommittee on Military Personnel, HouseCommittee on Armed Services, GAO/T-NSIAD-00-110 , Mar. 8, 2000, (http://www.gao.gov/cgi-bin/getrpt?GAO/T-NSIAD-00-110 [May 19,2000]).

PAGE 110 SPRING 2001 • NSSQ
Perspectives • Forrester, O’Hanlon, and Zenko
quite as good shape as it was a de-cade ago. It is still comparable tothe condition of weaponry duringthe early and middle years of theReagan era.
The armed forces generally mea-sure equipment readiness in termsof “mission capable rates”—thepercentage of weapons that are im-mediately usable for major combattasks, and not awaiting repair orotherwise out of commission. Al-though rates vary greatly from oneweapon to another, “mission ca-pable” rates were typically about75% in the mid-1980s and 80% orso in the early 1990s. They are gen-erally back around 75% today.Historically, that is good, but not
excellent, and ultimately not quitegood enough given how much isbeing asked of today’s military fromKorea to the Taiwan Strait to thePersian Gulf to the Balkans.
If one looks more closely at thedetails, they vary greatly. Notably,Air Force mission capable rates aredown more than ten percentagepoints over the last decade (see Fig-ure 6).17 Navy ships continue todeploy dependably, and at ratessimilar to those of the past—butships that are not on deployment areon average less ready, should theybe needed in a crisis, than a decadeago. On the other hand, Armyequipment remains every bit asready as a decade ago (see Figure
0
10
20
30
40
50
60
70
80
90
100
91 92 93 94 95 96 97 98 99 00
Year
Per
cent
age
Active
All Air Force
Air ForceReserve andNational Guard
Source: Lt. Col. Dennis E. Daley, Aircraft/Missile Support Division, HQ USAF/Installations and Logistics (ILSY), June 5, 2000, personal communication.
Figure 6. U.S. Air Force Mission Capable Rates
Source: Lt. Col. Dennis E. Daley, Aircraft/Missile Support Division, HQ USAF/Installations and Logistics(ILSY), June 5, 2000, personal communication.

NSSQ • SPRING 2001 PAGE 111
Measuring U.S. Military Readiness
7). Marine Corps aircraft, despite aspate of temporary groundings forsafety-related reasons in 2000, alsoremain just as mission-capable asthey were in the early 1990s (seeFigure 8). Navy aviation readinessrates have dropped off a bit sincethe early 1990s, but not by nearlyas much as those of the Air Force(see Table 1). Marine Corps groundequipment appears to have declinedin overall readiness since the early1990s—though by no more than 1%or 2%, with recent trends positive.18
The military’s overall readinessmay not be captured, however, bythe average readiness of all of its
equipment. Some systems may bemore important than others. Also,if a critical single system or type ofsystem—such as a transport ship orplane, or electronic warfare air-craft—is not functional, an entirewar plan can fall apart. As such,downturns in the readiness of spe-cific systems must be watchedcarefully, and addressed quickly incertain cases regardless of the av-erage caliber of equipment readi-ness. Moreover, given how fre-quently today’s U.S. military isbeing used, and its smaller size rela-tive to earlier eras, readiness levelsequal to those of the Reagan era
Figure 7. Readiness of U.S. Army Equipment
0
10
20
30
40
50
60
70
80
90
100
87 88 89 90 91 92 93 94 95 96 97 98 99
Per
cent
age
Vehicles
Aviation
Source: U.S. Army communications to author, 2000.
Vehicles include: M1A1, M1A2, M2, M3, M109A6, M8, HEMTT, HMMWV, FMTV, MLRS, PATRIOT, AVENGER.Aviation includes: AH-64, OH-58D, UH-60, CH-47.
Source: U.S. Army communications to author, 2000.
Vehicles include: M1A1, M1A2, M2, M3, M109A6, M8, HEMTT, HMMWV, FMTV, MLRS, PATRIOT, AVENGER.Aviation includes: AH-64, OH-58D, UH-60, CH-47.

PAGE 112 SPRING 2001 • NSSQ
Perspectives • Forrester, O’Hanlon, and Zenko
may not be good enough. The lev-els attained during the early 1990sshould be viewed as the propergoals for today, even if they wereunusually excellent in historicalterms.
But the broad message of thesegauges, while not perfect and not acause for complacency, is reassur-ing nonetheless. The averagefighter, ship, tank, or other majormilitary system is as likely to be as
0
10
20
30
40
50
60
70
80
90
100
91 92 93 94 95 96 97 98 99 thruMay2000Ye a r
Per
cent
age
Active
Reserve
Source: MSgt David L. Davis , Aviation Analyst, Aviation Logis tics Support Branch, Headquarters United States Marine Corps, Pentagon, W ashington, DC, July 5, 2000, personal com m unication.
Note: Inc ludes both Active and Reserve com ponents.
Figure 8. Overall U.S. Marine Corps AircraftMission Capable Rates
Table 1. Navy Aircraft Mission Capable Rates
1990 70%1995 72%1999 69%
Source: Capt. L. B. Callis, Director Fleet Support Department, Naval Air Systems Command,“Aviation Maintenance Supply Readiness (AMSR),” July 19, 2000 [http://www.nalda.navy.mil/amsr/19jul00.ppt]; and Deborah Clay-Mendez, Richard L. Fernandez, and Amy Belasco, “Trendsin Selected Indicators of Military Readiness, 1980 through 1993,” Congressional Budget Office,March 1994, p. 71.
Note: Categories of aircraft covered by data may have changed slightly. Data indicate overallapproximate readiness levels for all years.
Source: MSgt David L. Davis, Aviation Analyst, Aviation Logistics Support Branch, Headquarters UnitedStates Marine Corps, Pentagon, Washington, DC, July 5, 2000, personal communication.
Note: Includes both Active and Reserve components.

NS
SQ • S
PR
ING 2001
PA
GE 113
Me
asu
ring
U.S
. Milita
ry Re
ad
ine
ss
Figure 9. Worldwide U.S. Active-Duty Military Deaths by Cause, 1980-1998
0
20
40
60
80
100
120
140
1980 1981 1982 1983 1984 1985 1986 1987 1988 1989 1990 1991 1992 1993 1994 1995 1996 1997 1998
TOTAL
ACCIDENT
ILLNESS
HOMICIDE
SELF-INFLICTED
Source: Department of Defense, Worldwide U.S. Active Duty Military Nonhostile Deaths by Manner: 1980-1998 , W ashington Headquarters Services, Directorate for Information Operations and Reports, 1998, (http://web1.whs.osd.mil/mmid/casualty/manner.htm [May 18, 2000]).
* Does not include deaths from hostile action, of which there were 563 over the period, including 256 in Lebanon, 18 in Grenada, 23 in Panama, 148 in Operation Desert Storm, 29 in Somalia, and 19 in Saudi Arabia.
Deaths* per 100,000 troops

PAGE 114 SPRING 2001 • NSSQ
Perspectives • Forrester, O’Hanlon, and Zenko
fit for combat today as it was half-way through Ronald Reagan’smilitary buildup.
Altogether, the quality of people,equipment and training has giventhe United States a military in veryfine shape. In addition, it has pro-duced a very good safety record.Despite occasional problems in cer-tain parts of the force,19 overallaccident rates per person duringtraining and deployments are as lowor lower than they have ever been,according to Pentagon data (seeFigure 9).
SUSTAINING READINESS INTHE NEXT DECADE
PersonnelAlthough things look generally goodtoday, there are cracks in the readi-ness of U.S. armed forces that, ifallowed to worsen, could change thebasic readiness picture within a fewyears. Most notably, frequent andextended deployments have keptpeople away from home and fami-lies, and caused many personnel towork excessively long hourswhether on deployment or at homebase. Selectively scaling back U.S.military deployments in places wherethey are less than essential wouldhelp readiness and morale consider-ably. But many other measureswould be useful to adopt as well.
Recent pay raises and efforts tomake overseas deployments morepredictable have improved some ofthe downward trends in recruitingand retention of late. But the situa-tion remains worrisome, andrequires further steps to reduce thestrain on personnel and improvetheir well-being. Additional stepsshould include increasing the num-bers of specialized units that arefrequently deployed, or movingsome frequently deployed unitsfrom the reserve component to theactive-duty force structure.
For example, Army data showsthat 12,000 more personnel wouldbe needed to relieve excessive bur-dens on existing “high demand/lowdensity” units, such as those man-ning PATRIOT defense batteries,making up military police units, andproviding expertise in the areas ofnuclear, biological, and chemicalweapons. Generalizing this type ofpolicy on high demand/low densityunits to the other services mightmake for a total increase of 20,000to 30,000 active-duty personnel incertain types of specialties. (Sincethe Navy and Marine Corps are ac-customed to deployments, it isespecially the Army and Air Forcewhere needs are likely greatest,though the Navy does not haveenough electronic jamming air-craft.) Corresponding annual costs
NSSQ • SPRING 2001 PAGE 115
Measuring U.S. Military Readiness
might be $1 billion to $1.5 billionfor salaries, making for a total pricetag of $2 billion or more onceequipment is included.20 Alterna-tively, by prudently changing thecurrent two-major theater warframework to a somewhat less man-power-intensive two-war require-ment, the Pentagon could add thesepositions without increasing over-all active-duty end strength.
The military services also shouldcontinue to find innovative ways todistribute deployment demandsaround more of the force structure.Doing so is admittedly difficult, forit can involve slightly reducing vigi-lance for regional warfighting. Forexample, the Army has been hesi-tant at times about allowing the 25th
infantry division, based in Hawaiiand intended for rapid deploymentto Korea in the event of a war there,to conduct other missions—thoughultimately part of the 25th did de-ploy to Haiti.
The Army should also carry outits planned policy to fully man what-ever number of divisions it retains—even if that means cutting anotherdivision, or shrinking the size of allof them—so that deploying one unitdoes not require “borrowing” per-sonnel from another. At present,this borrow-to-deploy policy causesa harmful ripple effect throughoutmuch of the force.
Other military services shouldmake changes as well. Consider thatof the U.S. Air Force’s 40 airbornewarning and control system (AWACS)crews, only 27 are fully trained, andof those 27, commanders in the Pa-cific region do not approve of thedeployment of the six they controlout of the region. That leaves theremaining 21 to do a job in the restof the world that requires close totwice that number.21 Such policiesare not wise. To the extent that theyhave the effect of driving capablepeople out of the military, they canhurt medium-term readiness morethan they protect immediate com-bat readiness. Solutions shouldinvolve increasing the numbers ofsuch types of units, and fully usingexisting capabilities to handle on-going operations.
As for improvements in compen-sation, targeted pay increases forcertain specialties, or better benefitssuch as an expansion of the off-basehousing reimbursement, now makemore sense than another generalpay increase across the force. Per-sonnel shortfalls are far moresignificant in some parts of the forceand some areas of expertise thanothers.
If there is to be another step toimprove the well-being of alltroops, a pay raise well above therate of inflation probably makes less
PAGE 116 SPRING 2001 • NSSQ
Perspectives • Forrester, O’Hanlon, and Zenko
sense than a step such as fully re-imbursing individuals for theirhousing costs. That measure wouldcost $1.5 billion a year, and increasehousing reimbursement rates from85% to 100%. It would also havethe benefit of alleviating demand foron-base housing, which the Depart-ment of Defense is having a hardtime renovating (and which itshould probably not spend a greatdeal of time focused on, given thatthis function is not within its coreexpertise). An additional step, simi-lar in spirit, would be to make surethat subsidized day care is availableto all those military families that de-sire it, at a cost of roughly $1 billiona year. These steps would makecompensation more fair as well—at present, some individuals gethousing and day-care benefits whileothers do not.22
EquipmentRemedies are also needed on thehardware front. Much of the equip-ment bought during the Reagan erais starting to wear out. Combat jets,for example, will soon average 15years in age—and it is generallythought prudent to retire them af-ter about 20 years of service(meaning that average age shouldusually be around 10 years). Com-bat helicopters face similarproblems; their current average age
is around 22 years, but their ex-pected lifetimes are somewhat lessthan 30.23
At least fighter jets are scheduledto be replaced. The situation is notso fortunate for other types of sys-tems. There are no plans to replaceArmy transport helicopters, mari-time patrol aircraft, and a numberof support planes that carry outmissions such as refueling and elec-tronic warfare.24
So while near-term equipmentreadiness is still good, the Bush ad-ministration will need to devise asound procurement plan that buyssubstantial numbers of new plat-forms reasonably quickly in orderto make sure that equipment re-mains ready into the future. Theprocurement issue should beviewed as a simple matter of ensur-ing readiness, and military safety, inthe years ahead, in addition to anaspect of the revolution in militaryaffairs. Revolution or not, the U.S.military needs mission-worthy sys-tems that have not drasticallyexceeded their service lifetimes.The civilian and uniformed leader-ship owe it to the men and womenof the armed forces to provide themequipment that is safe and reliable.
At present, there is no assurancethey will do so. The military ser-vices, in keeping their ambitious andprobably unaffordable agendas for
NSSQ • SPRING 2001 PAGE 117
Measuring U.S. Military Readiness
modernizing equipment, are puttingsophisticated weaponry ahead ofreadiness and the well-being of theirown personnel. They are not doingso intentionally. But that is the ef-fect of holding onto an unrealis-tically expensive modernizationprogram.
The effect of this policy is pre-dictable, and lamentable. Dollarswill not suffice to buy new weap-ons—which are sure to grow incost—in the numbers intended. Asa result, weapons production sched-ules will be stretched out, leadingto purchases of fewer new planesand ships and trucks per year thannow envisioned. Existing equip-ment will therefore have to beretained far beyond prudent retire-ment dates. Mission capable ratesfor key weapons will decline fur-ther. Accident and fatality rates fortroops, which have improved con-tinuously for many years includingthe last eight, will at some pointprobably start growing again. Al-lowing that to happen, in an effortto purchase expensive weapons inlarge numbers, is unacceptable. In-stead, the Pentagon must devisesound and practical weapons pro-curement plans, focusing on lessexpensive weaponry than it nowprefers, and it must sustain thoseplans with little slippage in the yearsahead.
CONCLUSION
Today’s U.S. military readiness re-mains quite good. In fact, lookingacross a host of indicators—thequality of troops, rigor of training,mission-capable rates of variousaircraft and ground vehicles andships, and even recruiting and re-tention statistics—overall condi-tions are generally comparable tothose of the Reagan years on a per-son-for-person basis.
That is not to say that everythingis excellent, or to argue for com-placency. Today’s generally highreadiness does not change the factthat a number of specific problemsexist in particular parts of the force.Moreover, overall readiness issomewhat fragile. Military moraleis not as good as in the 1980s,meaning that the possibility existsthat serious shortfalls of high-qual-ity people could develop ifcircumstances take a further turnfor the worse. In addition, agingequipment requires systematic re-placement—not necessarily withthe F-22s, V-22s, joint strike fight-ers, and DD-21s that the servicesnow prefer, but with dependableand reliable platforms of some type.
Some solutions to problems withmorale are best addressed by reduc-ing overseas military deploymentswhere possible. Radical cutbacks
PAGE 118 SPRING 2001 • NSSQ
Perspectives • Forrester, O’Hanlon, and Zenko
are not needed. But it should bepossible to reduce the numbers ofMarines on Okinawa, of carrierbattle groups and other ships in theMediterranean, of Air Force aircraftover the skies of Iraq, and of Armytroops in Bosnia (though notKosovo).25
Whatever happens on the de-ployment and modernization fronts,however, O&M costs for ensuringreadiness are likely to keep goingup. Personnel costs may not growgreatly, but per capita operating andmaintenance costs are likely to in-crease roughly 1% a year in realterms. By 2010, ensuring readinessis likely to require another $10 bil-lion in annual spending onoperations and support than it doestoday—even if President Bush andthe Congress do what they should,and close more military bases whilealso seeking other economies. U.S.military readiness today may begood, but it is not to be taken forgranted, and it does not comecheap.
ENDNOTES
1. See Steven Lee Myers, “What War-Ready Means, In Pentagon’sAccounting,” New York Times, 4September 2000.
2. David Von Drehle, “Cheney StepsUp Criticism of Military Readi-ness,” Washington Post, 31 August
2000.3. For a rendition of some of the prob-
lems revealed in Operation AlliedForce, see John Robinson, “Readyor Not?” Washington Post, 7 Sep-tember 2000.
4. Office of the Under Secretary ofDefense (Comptroller), NationalDefense Budget Estimates for FY2001 (Washington, DC: Depart-ment of Defense, March 2000),131-133, 215.
5. See Michael O’Hanlon, How to Bea Cheap Hawk: The 1999 and 2000Defense Budgets (Washington, DC:Brookings Institution Press, 1998),141-142.
6. See for example, Anton Jareb andMatt Robinson, Readiness Supportfor the Marines (Alexandria, VA:Center for Naval Analyses, 2000),7.
7. See Department of Defense, “FY2001 Defense Budget: BriefingSlides,” February 2000; andO’Hanlon, How to Be a CheapHawk, 144-146.
8. See Office of the Under Secretaryof Defense (Comptroller), NationalDefense Budget Estimates for FY2001, 56.
9. See Richard Fernandez, What Doesthe Military “Pay Gap” Mean?(Washington, DC: CongressionalBudget Office, June 1999).
10. Greg Jaffe, “Military Could FacePotential Problems with Modern-ization,” Wall Street Journal, 5September 2000.
11. Statement for the Record of
NSSQ • SPRING 2001 PAGE 119
Measuring U.S. Military Readiness
Norman J. Rabkin, Director, Na-tional Security Preparedness Issues,National Security and InternationalAffairs Division, General Account-ing Office, “Military Personnel:First-Term Recruiting and AttritionContinue to Require Focused At-tention,” GAO/T-NSIAD-00-102, 24February 2000, 1-4.
12. Jaffe, “Military Could Face Poten-tial Problems with Modernization.”
13. Steven Lee Myers, “Military Re-serves Are Falling Short in FindingRecruits,” New York Times, 28August 2000.
14. Department of Defense, QuarterlyReadiness Report to the Congress,April-June 2000 (August 2000).
15. For evidence of a decline over time,see Edwin Dorn and others, Ameri-can Military Culture in theTwenty-First Century (Washington,DC: Center for Strategic and Inter-national Studies, 2000), 75.
16. Statement of Norman J. Rabkin,Director, National Security Pre-paredness Issues, National Securityand International Affairs Division,General Accounting Office, “Mili-tary Personnel: Preliminary Resultsof DOD’s 1999 Survey of ActiveDuty Members,” GAO/T-NSIAD-00-110, 8 March 2000.
17. Air Force officials sometimes de-scribe a drop of more than 20%,but that reflects a different, lesstransparent, and less useful way ofmeasuring readiness—it refers tothe “C” ratings of units, a compli-cated and subjective and fickle
indicator, rather than the more ob-jective indicator of mission capablerate. For recent information on such“C” ratings, see “Ryan AddressesReadiness Concerns before Con-gress,” U.S. Air Force Perspectives(Washington, DC: Air Force Officeof Public Affairs, October 2000),1.
18. Jareb and Robinson, ReadinessSupport for Marines, 8.
19. A notable example of a problem in2000 was the highest rate of Navyship groundings and collisions since1992. Thankfully, associated fatali-ties were few in number. See JamesW. Crawley, “Navy Calls for SafetyReview by Whole Fleet,” San Di-ego Union-Tribune, 16 September2000.
20. See General Accounting Office,Contingency Operations: Provid-ing Critical Capabilities PosesChallenges, GAO/NSIAD-00-164,July 2000; and Laurinda Zeman,Making Peace While StayingReady for War: The Challenges ofU.S. Military Participation inPeace Operations (Washington,DC: Congressional Budget Office,1999), xix.
21. General Accounting Office, Con-tingency Operations, 15-16.
22. Congressional Budget Office, Bud-get Options for National Defense(Washington, DC: CongressionalBudget Office, March 2000), 78-82.
23. See Statement of Lane Pierrot,Congressional Budget Office, on
PAGE 120 SPRING 2001 • NSSQ
Perspectives • Forrester, O’Hanlon, and Zenko
Aging Military Equipment beforethe Subcommittee on Military Pro-curement, House Committeee onArmed Services, 24 February 1999,4.
24. See Pierrot Statement, 4; andFrances Lussier, An Analysis ofU.S. Army Helicopter Programs(Washington, DC: CongressionalBudget Office, 1995), 24.
25. For additional discussion, seeMichael O’Hanlon, “Come PartlyHome, America,” Foreign Affairs,(March/April 2001): 2-8.