measuring the impacts of the delivery system on project performance— design-build and design
TRANSCRIPT

U.S. DEPARTMENT OF COMMERCETechnology Administration National Institute of Standards and Technology
Measuring the Impacts of the Delivery System on Project Performance— Design-Build and Design-Bid-Build Stephen R. Thomas Candace L. Macken Tae Hwan Chung Inho Kim
Office of Applied EconomicsBuilding and Fire Research Laboratory Gaithersburg, MD 20899
NIST GCR 02-840

Measuring the Impacts of the Delivery System on Project Performance—Design-Build and Design-Bid-Build Stephen R. Thomas, Candace L. Macken, Tae Hwan Chung, and Inho Kim Construction Industry Institute 3925 West Braker Lane Austin, TX 78759-5316
Prepared For:
Robert E. Chapman Office of Applied Economics Building and Fire Research Laboratory
National Institute of Standards and Technology Gaithersburg, MD 20899-8603
Under Contract 43NANB010937
November 2002
U.S. DEPARTMENT OF COMMERCE Donald L. Evans, Secretary TECHNOLOGY ADMINISTRATION Philip J. Bond, Under Secretary for Technology NATIONAL INSTITUTE OF STANDARDS AND TECHNOLOGY Arden L. Bement, Jr., Director
NIST GCR 02-840
U.S. Department of Commerce Technology Administration National Institute of Standards and Technology
Office of Applied Economics Building and Fire Research Laboratory Gaithersburg, MD 20899

ii
iii
Foreword The mission of the Building and Fire Research Laboratory (BFRL) of the National Institute of Standards and Technology (NIST) is to meet the measurement and standards needs of the building and fire safety communities. To achieve its mission, BFRL’s research is focused on advancing the performance, productivity, and cost-effectiveness of built facilities over their life cycle. This report, prepared for NIST by the Construction Industry Institute (CII), is a source document for on-going research being conducted by BFRL to better serve those who design and construct commercial buildings and industrial facilities. Commercial buildings include private- and public-sector office buildings, institutional buildings, and service businesses. Industrial facilities include facilities where the manufacturing of products or commodities takes place, utilities, and government facilities. The objective of this research effort was to produce a comprehensive set of information that documents the economic impacts of the project delivery system on project outcomes. Comparisons between design-build (DB) projects and design-bid-build (DBB) projects were used to model the impacts of the project delivery system on project outcomes. This information enables key construction industry stakeholders—both owners and contractors—to measure and evaluate the merits of each type of project delivery system. The DB and DBB project delivery systems differ in several important ways. Thus, it is instructive to specify what constitutes each project delivery system in order to promote a more complete understanding of how to measure the impacts of the project delivery system on project outcomes. A DB project delivery system is one where the owner contracts with a single entity to perform both design and construction under a single design-build contract. Contractually, design-build offers the owner a single point of responsibility for design and construction services. Portions or all of the design and construction may be performed by a single design-build entity or may be subcontracted to other companies. A DBB project delivery system is one where the owner contracts separately with a designer and a constructor. The owner normally contracts with a design company to provide “complete” design documents. The owner or owner’s agent then usually solicits fixed price bids from construction contractors to perform the work. One contractor is usually selected and enters into an agreement with the owner to construct the facility in accordance with the plans and specifications. A great deal of anecdotal evidence has been published about the superiority of the DB project delivery system. However, a majority of construction industry projects still use the DBB project delivery system. A detailed, authoritative, and readily accessible set of information is needed to enable construction industry stakeholders to measure and evaluate the merits of each type of project delivery system. The CII Benchmarking and Metrics database, which is composed

iv
exclusively of actual project execution experiences, is the product from which this information was developed. The research effort described in this report includes (1) a statistical analysis of a broad cross-section of projects from the CII Benchmarking and Metrics database and (2) a synthesis of findings. This two-pronged approach is designed to provide the reader with an understanding of how the project delivery system affects project outcomes. Robert E. Chapman Office of Applied Economics Building and Fire Research Laboratory National Institute of Standards and Technology Gaithersburg, MD 20899-8603

v
Abstract This study, sponsored by the National Institute for Standards and Technology (NIST), was designed to meet two objectives: to produce a comprehensive information set that documents the impacts of the project delivery system on project outcomes, and to provide the construction industry a means by which it may measure and evaluate the economic value of the design-build and the design-bid-build project delivery systems. The study consisted of four tasks. The first was a statistical analysis of a broad cross-section of projects from the Construction Industry InstituteTM (CIITM) Benchmarking and Metrics (BM&M) database. The second was to tabulate key database characteristics and important findings from the Task 1 statistical analysis. Task 3 was the statistical analysis and tabulation of four subsets of projects from the CII database: by sector, industry group, cost category, and project nature. The fourth task was the preparation and delivery of this technical report, which synthesizes the findings from Tasks 1-3 of this research effort. The analytic data set is comprised of all U.S. domestic and international projects submitted by owners and contractors between 1997 and 2000 using versions 2.0 through 6.0 of the CII Benchmarking and Metrics questionnaire. Using information reported on the BM&M questionnaire, both owner and contractor-submitted projects were classified as either design-build (DB) or design-bid-build (DBB) projects. The results were presented for both owner and contractors in tables that compared DB and DBB projects overall and by each of the four subsets of projects. The results of this study show that on average DB projects were about four times larger than DBB projects in terms of project cost. Public sector projects made less use of the DB project delivery system than private sector projects. Industrial projects made greater use of DB than did building projects. Overall, owner-submitted DB projects outperformed DBB projects in cost, schedule, changes, rework, and practice use, although statistically significant differences were found only for schedule, changes, rework, and practice use. Contractor-submitted DB projects overall outperformed DBB projects in changes, rework, and practice use, but the difference was statistically significant only for change performance. Contractor-submitted DBB projects overall outperformed DB projects in schedule, and the difference was statistically significant. Pre-project planning and project change management practice use had the greatest impacts on cost performance for owner-submitted DB and DBB projects. Team building practice use had the greatest schedule performance impact on owner-submitted DB projects. Project change management and team building practice use had the greatest impacts on contractor-submitted DB project performance. Project change management occurred most frequently as the practice that had the greatest performance impact among contractor-submitted DBB projects.
Key Words Design-build; design-bid-build; project delivery system; practice use; performance outcomes; performance norms; fast tracking.

vi

vii
Table of Contents
Foreword _____________________________________________________________ iii
Abstract _______________________________________________________________v
List of Tables __________________________________________________________ ix
List of Figures ________________________________________________________ xii
Executive Summary ___________________________________________________ xiii
1. Introduction__________________________________________________________1 1.1 Study Purpose and Scope ________________________________________1 1.2 Study Tasks and Deliverables_____________________________________3
2. Description of the Analytic Dataset_______________________________________5 2.1 Statistical Considerations ________________________________________6 2.2 Characteristics of the Analytic Data Set _____________________________6
3. Performance and Practice Use Outcomes_________________________________15 3.1 Overall Owner and Contractor Outcomes___________________________15 3.1.1 Owner Outcomes _____________________________________________15 3.1.2 Contractor Outcomes __________________________________________17 3.1.3 Section Summary _____________________________________________19 3.2 Sector-Related Outcomes for Owners _____________________________20 3.3 Industry Group-Related Outcomes for Owners and Contractors _________22 3.3.1 Owner Outcomes _____________________________________________22 3.3.2 Contractor Outcomes __________________________________________24 3.3.3 Section Summary _____________________________________________26 3.4 Cost Category-Related Outcomes for Owners and Contractors __________28 3.4.1 Owner Outcomes _____________________________________________28 3.4.2 Contractor Outcomes __________________________________________29 3.4.3 Section Summary _____________________________________________31 3.5 Project Nature-Related Outcomes for Owners and Contractors__________33 3.5.1 Owner Outcomes _____________________________________________33 3.5.2 Contractor Outcomes __________________________________________34 3.5.3 Section Summary _____________________________________________36 3.6 Chapter Summary _____________________________________________37
4. Relationship Between Practice Use and Performance Outcomes______________41 4.1 Caveat: Correlation Is Not Causation _____________________________41 4.2 Owner DB and DBB Projects ____________________________________41 4.3 Contractor DB and DBB Projects_________________________________43
5. Effects of Fast Tracking and Schedule Adherence on Safety Performance _____45 5.1 Fast Track and Non-Fast Track Project Effects ______________________45 5.2 Schedule Adherence Effects _____________________________________47
6. Summary, Conclusions, and Recommendations ___________________________49

viii
6.1 Performance and Practice Use ___________________________________49 6.2 Fast Tracking and Schedule Adherence ____________________________49 6.3 Recommendations for Future Research ____________________________50
Appendix A – Statistical Notes____________________________________________51
Appendix B – Metric Definitions__________________________________________53
Appendix C – Project Phase Definitions____________________________________57
Appendix D – Sample Sizes for Performance and Practice Use Metrics__________59
Appendix E – Correlation Between Practice Use and Performance Outcomes ____69
Appendix F – References ________________________________________________93

ix
List of Tables
Table ES.1 Summary of Overall Performance and Practice Use Outcomes_________ xiv
Table 1.1 Benchmarking & Metrics Questionnaire Contents by Version _____________2
Table 2.1 Average Project Cost—Owner DB and DBB Projects __________________14
Table 2.2 Average Project Cost—Contractor DB and DBB Projects _______________14
Table 3.1 Summary of Mean Performance Outcomes by Project Delivery System— All Owners ___________________________________________________16
Table 3.2 Summary of Mean Performance Outcomes by Project Delivery System— All Contractors ________________________________________________18
Table 3.3 Summary of Mean Performance Outcomes by Sector— Owner DB and DBB Projects _____________________________________21
Table 3.4 Summary of Mean Performance Outcomes by Industry Group— Owner DB and DBB Projects _____________________________________23
Table 3.5 Summary of Mean Performance Outcomes by Industry Group— Contractor DB and DBB Projects _________________________________25
Table 3.6 Summary of Mean Performance Outcomes by Cost Category— Owner DB and DBB Projects _____________________________________28
Table 3.7 Summary of Mean Performance Outcomes by Cost Category— Contractor DB and DBB Projects _________________________________30
Table 3.8 Summary of Mean Performance Outcomes by Project Nature— Owner DB and DBB Projects _____________________________________33
Table 3.9 Summary of Mean Performance Outcomes by Project Nature— Contractor DB and DBB Projects _________________________________35
Table 3.10a Performance Summary for Cost, Schedule, and Safety ________________38
Table 3.10b Performance Summary for Change, Rework, and Practice Use _________38
Table 4.1 Correlation of Performance Outcomes—Owner DB and DBB Projects_____42
Table 4.2 Correlation of Performance Outcomes—Contractor DB and DBB Projects _43
Table 5.1 Effects of Fast Tracking on Safety Performance— Owner DB and DBB Projects _____________________________________45
Table 5.2 Effects of Fast Tracking on Safety Performance— Contractor DB and DBB Projects _________________________________46
Table 5.3 Effects of Schedule Adherence on Safety Performance— Owner DB and DBB Projects _____________________________________47
Table 5.4 Effects of Schedule Adherence on Safety Performance— Contractor DB and DBB Projects _________________________________48
Table D.1 Sample Sizes by Project Delivery System—All Owners_________________59

x
Table D.2 Sample Sizes by Project Delivery System—All Contractors______________60
Table D.3 Sample Sizes By Sector—Owner DB and DBB Projects ________________61
Table D.4 Sample Sizes by Industry Group—Owner DB and DBB Projects _________62
Table D.5 Sample Sizes by Industry Group—Contractor DB and DBB Projects ______63
Table D.6 Sample Sizes by Cost Category—Owner DB and DBB Projects __________64
Table D.7 Sample Sizes By Cost Category—Contractor DB and DBB Projects_______65
Table D.8 Sample Sizes by Project Nature—Owner DB and DBB Projects __________66
Table D.9 Sample Sizes by Project Nature–Contractor DB and DBB Projects _______67
Table E.1a Correlation of Pre-Project Planning Use with Performance Outcomes— Owner DB and DBB Projects _____________________________________69
Table E.1b Maximum Potential Improvement in Performance through Pre-Project Planning—Owner DB and DBB Projects __________________70
Table E.2a Correlation of Constructability Use with Performance Outcomes— Owner DB and DBB Projects _____________________________________71
Table E.2b Maximum Potential Improvement in Performance through Constructability Use—Owner DB and DBB Projects __________________72
Table E.3a Correlation of Project Change Management Use with Performance Outcomes—Owner DB and DBB Projects ___________________________73
Table E.3b Maximum Potential Improvement in Performance through Change Management Use—Owner DB and DBB Projects ______________74
Table E.4a Correlation of Design/Information Technology Use with Performance Outcomes–Owner DB and DBB Projects ____________________________75
Table E.4b Maximum Potential Improvement in Performance through Design/Information Technology Use—Owner DB and DBB Projects ______76
Table E.5a Correlation of Team Building Use with Performance Outcomes— Owner DB and DBB Projects _____________________________________77
Table E.5b Maximum Potential Improvement in Performance through Team Building Use—Owner DB and DBB Projects____________________78
Table E.6a Correlation of Zero Accident Techniques with Performance Outcomes— Owner DB and DBB Projects _____________________________________79
Table E.6b Maximum Potential Improvement in Performance through Zero Accident Techniques Use—Owner DB and DBB Projects___________80
Table E.7a Correlation of Pre-Project Planning Use with Performance Outcomes—Contractor DB and DBB Projects________________________81
Table E.7b Maximum Potential Improvement in Performance through Pre-Project Planning Use—Contractor DB and DBB Projects___________82

xi
Table E.8a Correlation of Constructability Use with Performance Outcomes— Contractor DB and DBB Projects _________________________________83
Table E.8b Maximum Potential Improvement in Performance through Constructability Use—Contractor DB and DBB Projects _______________84
Table E.9a Correlation of Project Change Management Use with Performance Outcomes—Contractor DB and DBB Projects________________________85
Table E.9b Maximum Potential Improvement in Performance through Change Management Use—Contractor DB and DBB Projects ___________86
Table E.10a Correlation of Design/Information Technology Use with Performance Outcomes—Contractor DB and DBB Projects________________________87
Table E.10b Maximum Potential Improvement in Performance through Design/Information Technology Use—Contractor DB and DBB Projects __88
Table E.11a Correlation of Team Building Use with Performance Outcomes— Contractor DB and DBB Projects _________________________________89
Table E.11b Maximum Potential Improvement in Performance through Team Building Use—Contractor DB and DBB Projects ________________90
Table E.12a Correlation of Zero Accident Techniques Use with Performance Outcomes—Contractor DB and DBB Projects________________________91
Table E.12b Maximum Potential Improvement in Performance through Zero Accident Techniques Use—Contractor DB and DBB Projects _______92

xii
List of Figures Figure 1.1 Data Analysis and Tabulation Tasks _______________________________ 3 Figure 2.1 Owner and Contractor Projects by Delivery System___________________ 5 Figure 2.2 Contractor Projects by Function __________________________________ 6 Figure 2.3 Owner DB and DBB Projects by Sector ____________________________ 7 Figure 2.4 Owner DB and DBB Projects by Location __________________________ 8 Figure 2.5 Contractor DB and DBB Projects by Location _______________________ 8 Figure 2.6 Owner DB and DBB Projects by Industry Group _____________________ 9 Figure 2.7 Contractor DB and DBB Projects by Industry Group_________________ 10 Figure 2.8 Owner DB and DBB Projects by Project Cost ______________________ 10 Figure 2.9 Percentage Share by Delivery System and Project Cost, Owners________ 11 Figure 2.10 Contractor DB and DBB Projects by Project Cost __________________ 11 Figure 2.11 Percentage Share by Delivery System and Project Cost, Contractors ___ 12 Figure 2.12 Owner DB and DBB Project by Project Nature ____________________ 12 Figure 2.13 Contractor DB and DBB Projects by Project Nature ________________ 13

xiii
Executive Summary What is the relationship between capital facility project performance and the project delivery system utilized to execute it? Does the project delivery system affect safety performance? This study, funded by the National Institute of Standards and Technology (NIST), attempts to provide answers to these questions by comparing the performance of owner and contractor-submitted capital projects that used one of two project delivery methods: design-build (DB) and design-bid-build (DBB). The source data for this study were extracted from the Construction Industry Institute’s Benchmarking and Metrics database, which comprises over 1,000 projects submitted by both owner and contractor companies. The database includes comprehensive information about cost, schedule, safety, changes and rework performance on a project-by-project basis and about the use of selected practices considered to be essential in improving project performance. For this study, the practices analyzed were pre-project planning, constructability, project change management, design/information technology, team building, and zero accident techniques. Among owners, the use of the DBB delivery system dominated with nearly 75% of the projects having used it. Among contractors, the proportions represented by each of the delivery systems were more evenly split: slightly more than 56% of the projects used DBB and almost 44% used DB. Although the DBB delivery system tended to dominate overall, the relationship between project size and choice of delivery system was one in which larger projects tended to use DB more often. For owner-submitted projects costing less than $15 million, the DB delivery system represented about 18% of all projects; for those costing between $15 million and $50 million, DB represented about 25% of all projects; for projects costing more than $50 million, DB represented nearly 47%. The results were even more dramatic for contractor-submitted projects. DB represented about 23% of all projects under $15 million, slightly more than 51% of all projects between $15 and $50 million, and nearly 79% of all projects over $50 million. The analytic dataset was first analyzed at the lowest level of detail to make overall comparisons, and then subdivided into 4 subsets: public and private sector, building and industrial projects, project cost category (<$15 million; $15-$50 million; and >$50 million), and project nature (Additions; Grass Roots; and Modernizations). Performance and practice use comparisons between DB and DBB projects yielded a wealth of detailed information that supported the following observations shown in tabular format. Table ES.1 summarizes the overall results. DB or DBB indicates the better performing delivery system for the metric category shown below. Text that is not bolded indicates better performance based only on observed, not statistically significant, differences. Bold text indicates that the differences were statistically significant.

xiv
Table ES.1 Summary of Overall Performance and Practice Use Outcomes
Cost Schedule Safety Owner Contractor Owner Contractor Owner Contractor Overall DB1 -- DB DBB -- --
Changes Rework Practice Use Owner Contractor Owner Contractor Owner Contractor
Overall DB DB DB DB1 DB DB1
1 Observed difference, not statistically significant -- No difference in performance Bold indicates significant difference, p< 0.05
Taken altogether, there seemed to be a performance advantage for owners when the DB delivery system was used. Based on observed differences, owner-submitted DB projects outperformed DBB projects in terms of cost. However, overall there were no statistically significant differences between owner-submitted DB and DBB projects for cost or safety. Schedule, change, rework, and practice use performance were significantly better among owner submitted DB projects. For contractors, the performance advantage of one delivery system over the other was not as clear. There were no significant differences between contractor-submitted DB and DBB projects for cost, safety, rework, or practice use. It was observed that contractor-submitted DB projects had better performance in rework and practice use, however. In schedule performance, contractor-submitted DBB projects significantly outperformed DB projects. In change performance, though, DB projects performed significantly better than DBB projects. Practice use seemed to be a driver of performance results as much as project delivery system. When the same practices had the greatest impact on DB and DBB performance improvement, DB and DBB project performance was not significantly different. When the practices that had the most impact on performance were different for DB and DBB projects, performance outcomes were also different. Safety incentive use seemed to have a notable influence on safety performance among DB and DBB projects. Contrary to expectations, fast tracked owner-submitted DBB projects had better safety performance than non-fast tracked DBB projects. Likewise, behind schedule owner-submitted DB projects had better safety performance than either ahead of schedule or on-time DB projects. Preliminary investigation showed that these projects also made greater use of safety contract incentives. As expected, ahead of schedule owner and contractor-submitted DBB projects had better safety performance than either on-time or behind schedule projects.

1
1. Introduction A project delivery system has been defined as the set of “relationships, roles and responsibilities of project team members and the sequence of activities required” for the deployment of a capital project.1 Given the fact that project objectives vary on a project-to-project basis, no one project delivery system is sufficient to address them. Indeed, recent research has outlined twelve distinct project delivery systems.2 Two of the most commonly used project delivery systems, design-build (DB) and design-bid-build (DBB), are the focus of this study. Each has its advantages, with the former often cited as being a good candidate for large or highly complex projects, and the latter offering the checks and balances of a well-understood delivery system in which the level of risk is minimized through firm control of the design and construction processes. Of course, both have disadvantages as well. One of the potential disadvantages of the DB approach regards cost containment. Since a design and construction firm is hired before the actual design process begins, a firm cost cannot be established early in the life of a project.3 As for the DBB approach, the greatest potential disadvantage comes in the way of schedule because of the sequential nature of the project activities. There has been little empirical evidence to date, however, that establishes quantifiable evidence of the superiority of one approach over the other.
1.1 Study Purpose and Scope Using the Construction Industry Institute (CII) Benchmarking and Metrics (BM&M) database, this study seeks to measure the impact that the use of these delivery systems has on selected performance outcomes and practice use. The database currently comprises over 1,000 projects submitted by both owners and contractors and represents actual project experience systematically collected since 1996. While the type of information collected has remained relatively the same over this time period, changes have been made in specific areas of questionnaire content and format to accommodate new developments resulting from CII research and to enhance the user interface. Seven versions of the questionnaire have been produced. Each version of the questionnaire collected data on the five following performance metrics: cost, schedule, safety, changes, and rework. Practice use metrics have also been collected in each questionnaire version, but the number of practices measured has expanded over time. Version 1.0 gathered data on four practices and versions 2.0 through 4.0 gathered information on six. Version 5.0 collected data on eight practices; and versions 6.0 and 7.0 included nine practices. Productivity metrics were included in versions 6.0 and 7.0. Table 1.1 shows the major components of each version of the BM&M questionnaire.
1 Sanvido VE and Konchar MD, “Project Delivery Systems: CM at Risk, Design-Build, Design-Bid-Build,” Construction Industry Institute, Austin, Texas, April 1998. 2 Construction Industry Institute, “Owner’s Tool for Project Delivery and Contract Strategy Selection,” Austin, Texas, September 2001. 3 Gould FE and Joyce NE, Construction Project Management, 2002.

2
Table 1.1 Benchmarking & Metrics Questionnaire Contents by Version
Version 1.0 2.0 3.0 4.0 5.0 6.0 7.0
Performance Metrics
Cost Schedule
Safety Changes Rework
Productivity Practice Use
Metrics
Pre-project Planning
Constructability Team Building Zero Accident
Techniques
Project Change Management
Design/Information Technology*
Materials Management
Planning for Startup
Quality Management
This was redesigned and renamed Automation and Integration in Version 7.0. For the purposes of this study, only Versions 2.0 through 6.0 of the questionnaire were used since these contained the most complete set of data on the practices analyzed. Data from both domestic and international projects were included. The resulting analytic dataset was divided into four categories: owner DB projects, owner DBB projects, contractor DB projects, and contractor DBB projects. The categorization was determined by analyzing the Project Participants section of the BM&M questionnaire. In this section, respondents were asked to indicate the functions performed by each company participating in the project and the approximate percentage of the function that each company performed. Owner projects were defined as DB if the same company performed over 50% of both the design and construction functions; otherwise, owner projects were defined as DBB. Note that for purposes of this analysis, projects that would be considered to be EPC (Engineer, Procure, and Construct) were included in the DB category. Like owner-submitted projects, contractor-submitted projects were categorized as DB if the same company performed the
3
majority of the design and construction functions based on the percentages of the functions performed. Contractor projects were categorized as DBB if the company performed either of the following: 1) the design function only, 2) the construction function only, 3) greater than 50% of the design and less than 50% of the construction, or 4) greater than 50% of the construction and less than 50% of the design. Among owner and contractor-submitted projects, there was a relatively small number of projects that were difficult to classify due to missing or incomplete data. A secondary set of decision rules was developed for these projects using available data, such as, the amount of design work completed at the start of construction. Projects that could not be classified by these rules were excluded from the analysis. The resulting analytic data set comprised 326 owner projects and 291 contractor projects. The five performance outcomes (cost, schedule, safety, changes, and rework) and the following practices, pre-project planning, constructability, project change management, design/information technology (D/IT), team building, and zero accidents, were compared between owner DB and owner DBB projects, and contractor DB and contractor DBB projects. The practices analyzed were limited to the above six because it is for these that the most data are available. Minimal amounts of data are currently available for the other practices, rendering analysis of these impractical. Special emphasis was also placed on analyzing how safety performance was affected by fast tracking versus non-fast tracking, and by adherence to planned construction duration.
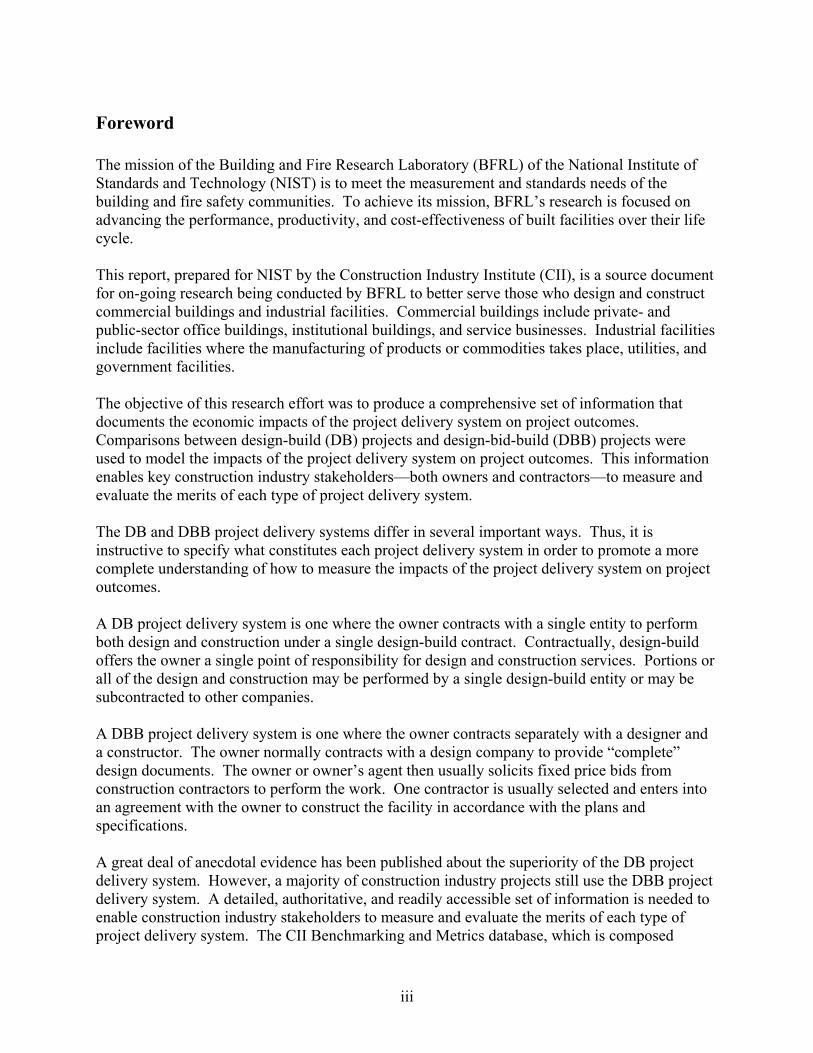
1.2 Study Tasks and Deliverables The National Institute of Standards and Technology (NIST), U.S. Department of Commerce, funded this study to evaluate the impacts of the project delivery system on project outcomes within the construction industry. The study comprised four tasks. Figure 1.1 depicts three of these. Figure 1.1 Data Analysis and Tabulation Tasks
DB Projects
Owner Projects
ContractorProjects
Sector
DBB Projects
Industry
Sector
Industry
Nature
Cost Category
DB Projects
Industry
Nature
Cost Category
Industry Nature
Cost Category
Task 3
DBB Projects
Nature
Cost Category
Tasks 1 and 2

4
Task 1 consisted of an analysis of a broad cross-section of projects from the CII Benchmarking and Metrics (BM&M) database. Task 2 was the tabulation of key database characteristics and important findings from the Task 1 analysis. Task 3 consisted of statistical analyses of four subsets of owner-submitted projects, by sector, industry group, project cost and project nature, and three subsets of contractor-submitted projects, by industry group, project cost and project nature. Task 4 is this report, which synthesizes the findings from Tasks 1, 2, and 3.

5
2. Description of the Analytic Dataset This study included 617 domestic and international projects for which the project delivery system was determined to be either design-build (DB) or design-bid-build (DBB). Of these, 82 were owner DB projects, and 244 were owner DBB projects. Contractor projects were also divided by project delivery system. One hundred twenty-eight of these were DB projects, and 163 were DBB projects. Figure 2.1 Owner and Contractor Projects by Delivery System
Within these four major categories, the data were also analyzed by industry group, project cost, and project nature. The industry groups were classified as Industrial, which included both heavy and light industrial projects, and Buildings. Three project cost categories were used, less than $15 million, $15 to $50 million, and greater than $50 million. Projects were also analyzed by project nature, which was divided into Additions, Grass Roots, and Modernizations. Figure 2.2 shows the breakdown of contractor-submitted projects by function. There were 128 projects for which the contractor performed the majority of the design and construction functions; these were classified as DB projects for the purposes of this study. The remaining 163 projects were classified as DBB because the contractor performed 1) only the design or the construction function, or 2) the majority of the design (construction) function but less than 50% of the other function. There were 92 projects that fell into the latter category.
Contractor
DB128 ProjectsDBB
163 Projects
Owner
DB82 projects
DBB244 Projects

6
Figure 2.2 Contractor Projects by Function
2.1 Statistical Considerations All projects in the CII database that reported information using Versions 2.0 through 6.0 of the BM&M questionnaire were eligible for inclusion in the analysis. In some cases, however, item responses were excluded from the detailed analysis because they were deemed to be statistical outliers based on the decision rule described in Appendix A. The number of projects included in the tables that follow was also reduced by item nonresponse and CII confidentiality rules. A direct effect of these considerations is that although the data in Figures 2.1 through 2.13 and Tables 2.1 and 2.2 below include all the projects in the analytic data set, the data in Tables 3.1 through 5.4 include only those data values that are more typical of the values found throughout the entire distribution of projects.4 All data have been aggregated to totals within any category to ensure that no individual project could be identified in any charts or tables. When the risk of identifying any project increased due to the small number of projects in a given category, the data for that category were suppressed to ensure confidentiality. Appendix A explains the CII confidentiality policy and its application.
2.2 Characteristics of the Analytic Data Set The analytic database included all domestic and international projects meeting the criteria outlined above. Figures 2.1 through 2.13 depict the analytic data set in chart or graph format. The distribution of owner-submitted projects was depicted as five different subsets of data: by sector, project location, industry group, project cost, and project nature. The distribution of 4 Chapter 3 focuses on key metrics and outcome measures (see Appendix B) over the various phases of the project execution process (see Appendix C). Appendix D shows the sample sizes for each combination of key metrics and outcomes.
44.1
31.7
13.111.0
0
10
20
30
40
50
Design Only ConstructionOnly
Design &Construction
Percent of Projects by Function
Perc
ent o
f Pro
ject
s
DBDBB
7
contractor-submitted projects was subsetted into four groups: by project location, industry group, project cost, and project nature. Each individual owner grouping is presented followed by the comparable contractor grouping to better assess differences and similarities in the use of the project delivery systems.
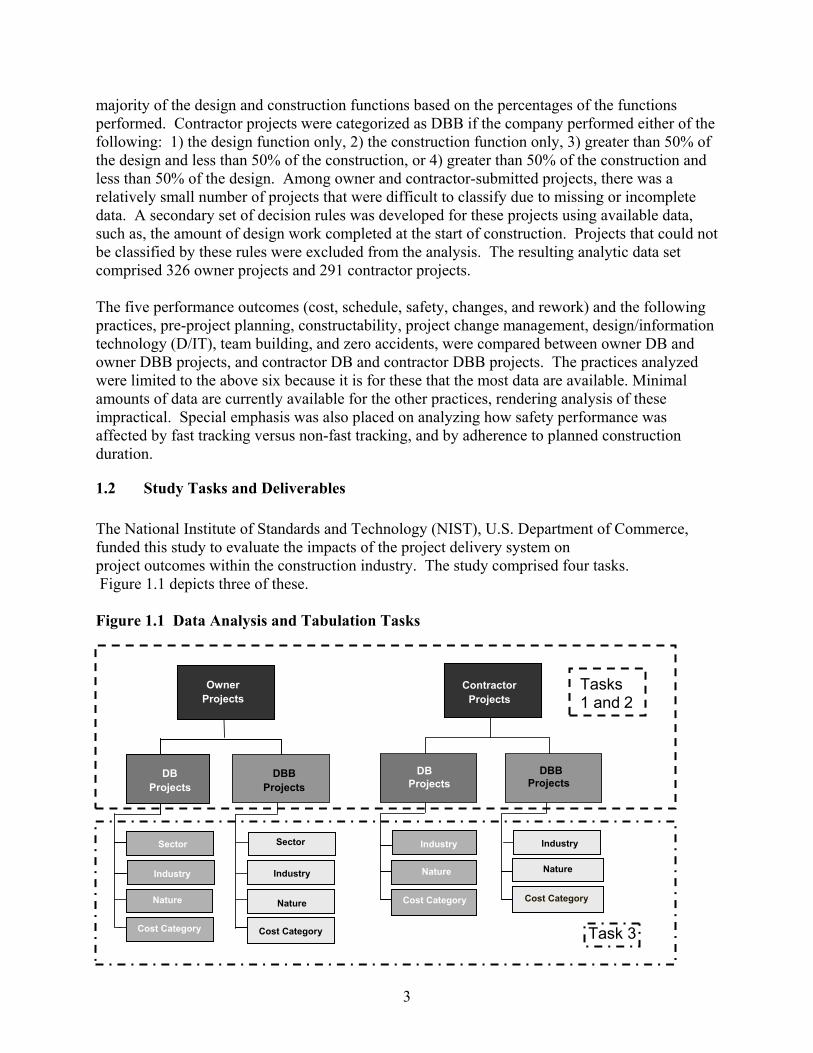
Figure 2.3 Owner DB and DBB Projects by Sector
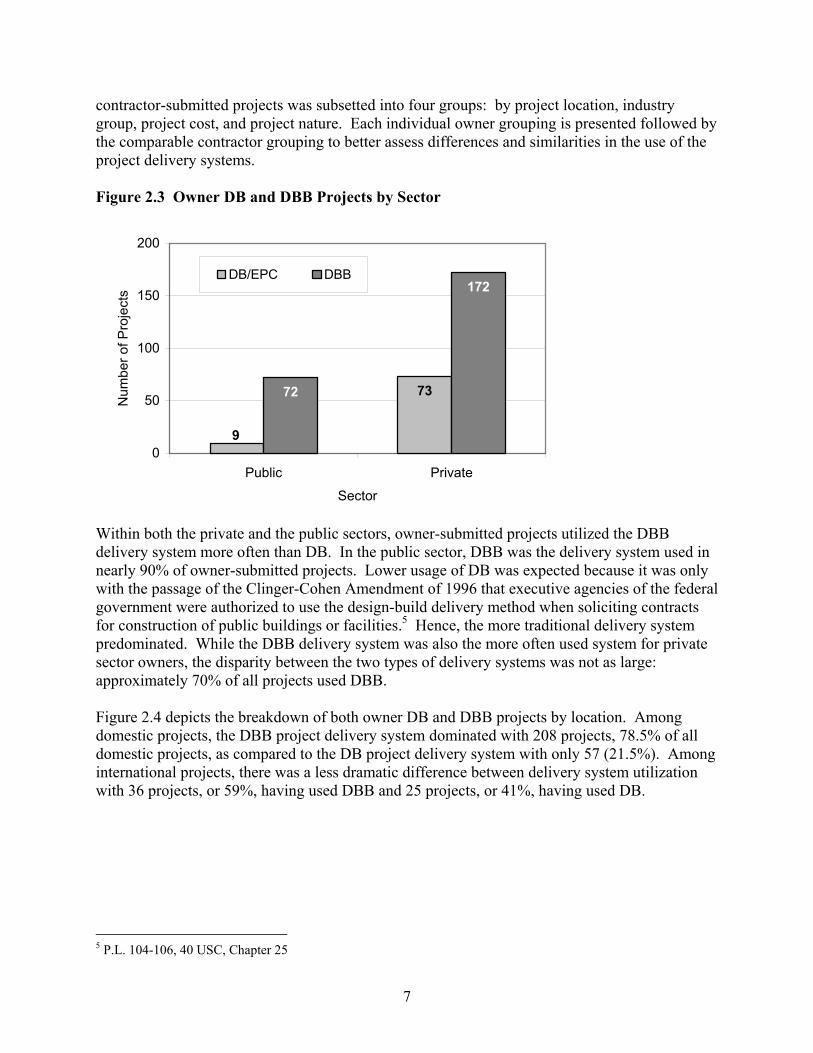
Within both the private and the public sectors, owner-submitted projects utilized the DBB delivery system more often than DB. In the public sector, DBB was the delivery system used in nearly 90% of owner-submitted projects. Lower usage of DB was expected because it was only with the passage of the Clinger-Cohen Amendment of 1996 that executive agencies of the federal government were authorized to use the design-build delivery method when soliciting contracts for construction of public buildings or facilities.5 Hence, the more traditional delivery system predominated. While the DBB delivery system was also the more often used system for private sector owners, the disparity between the two types of delivery systems was not as large: approximately 70% of all projects used DBB. Figure 2.4 depicts the breakdown of both owner DB and DBB projects by location. Among domestic projects, the DBB project delivery system dominated with 208 projects, 78.5% of all domestic projects, as compared to the DB project delivery system with only 57 (21.5%). Among international projects, there was a less dramatic difference between delivery system utilization with 36 projects, or 59%, having used DBB and 25 projects, or 41%, having used DB.
5 P.L. 104-106, 40 USC, Chapter 25
9
7372
172
0
50
100
150
200
Public Private
Sector
Num
ber o
f Pro
ject
s
DB/EPC DBB
8
Figure 2.4 Owner DB and DBB Projects by Location
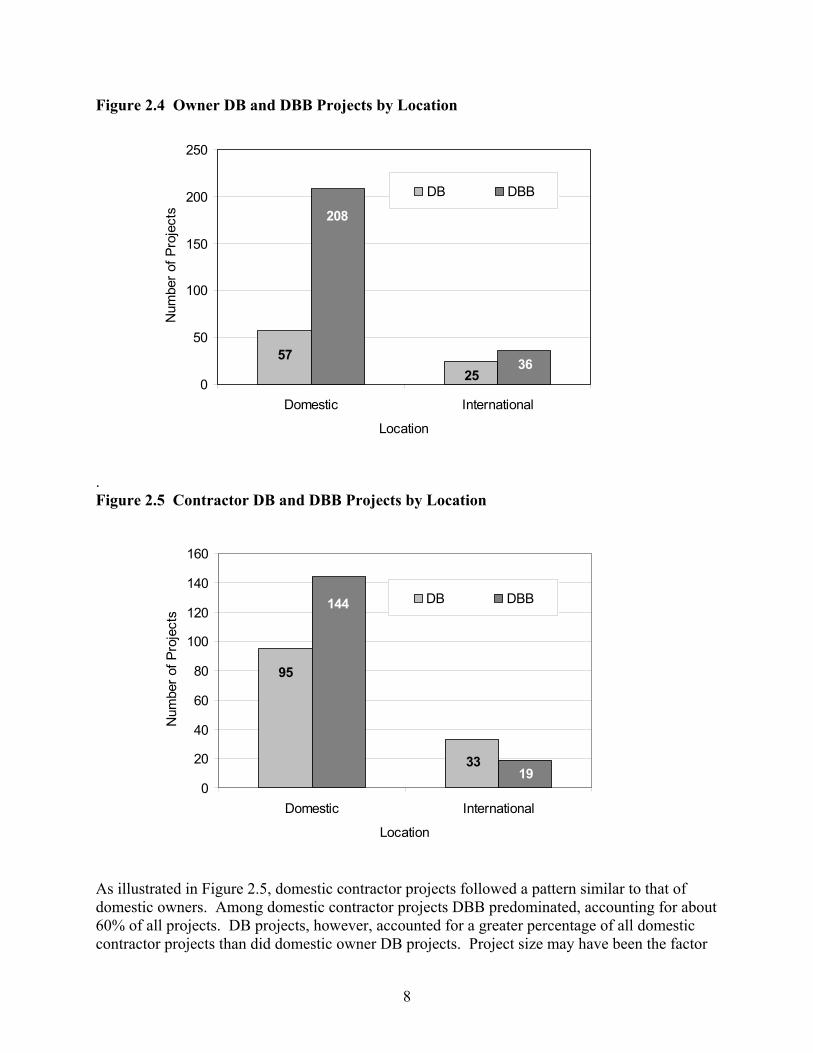
. Figure 2.5 Contractor DB and DBB Projects by Location
As illustrated in Figure 2.5, domestic contractor projects followed a pattern similar to that of domestic owners. Among domestic contractor projects DBB predominated, accounting for about 60% of all projects. DB projects, however, accounted for a greater percentage of all domestic contractor projects than did domestic owner DB projects. Project size may have been the factor
95
33
144
190
20
40
60
80
100
120
140
160
Domestic International
Location
Num
ber o
f Pro
ject
s
DB DBB
2557 36
208
0
50
100
150
200
250
Domestic International
Location
Num
ber o
f Pro
ject
sDB DBB
9
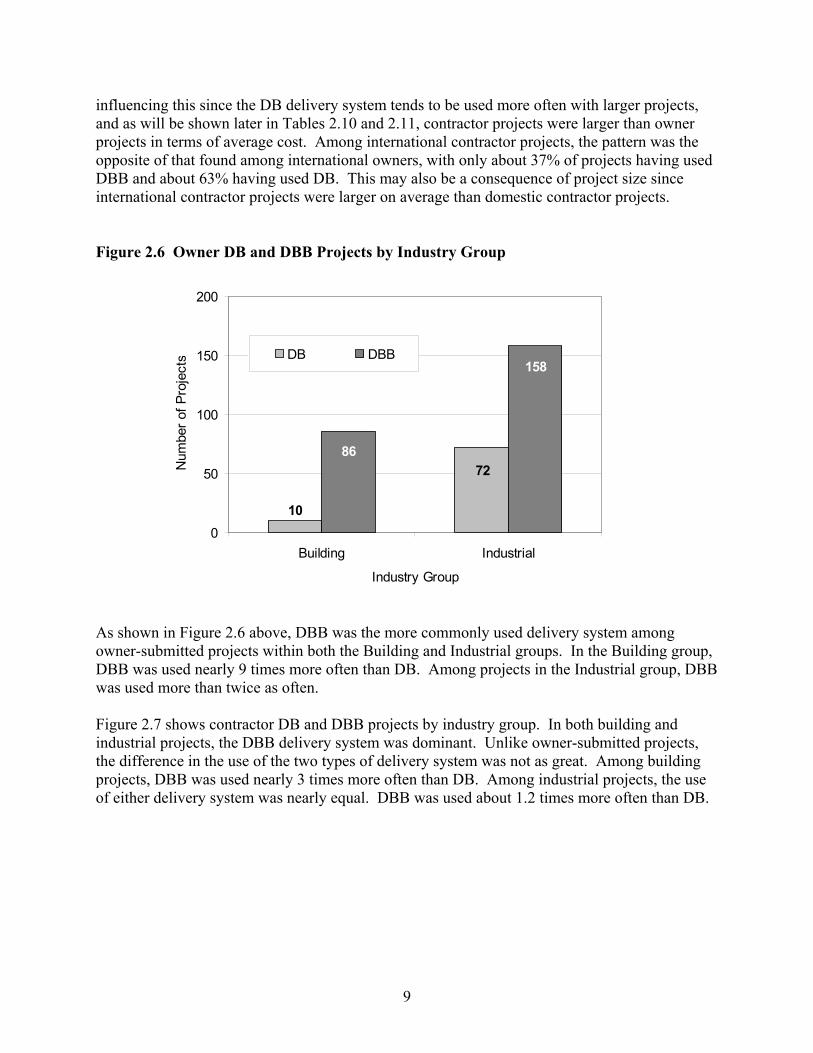
influencing this since the DB delivery system tends to be used more often with larger projects, and as will be shown later in Tables 2.10 and 2.11, contractor projects were larger than owner projects in terms of average cost. Among international contractor projects, the pattern was the opposite of that found among international owners, with only about 37% of projects having used DBB and about 63% having used DB. This may also be a consequence of project size since international contractor projects were larger on average than domestic contractor projects.
Figure 2.6 Owner DB and DBB Projects by Industry Group
As shown in Figure 2.6 above, DBB was the more commonly used delivery system among owner-submitted projects within both the Building and Industrial groups. In the Building group, DBB was used nearly 9 times more often than DB. Among projects in the Industrial group, DBB was used more than twice as often. Figure 2.7 shows contractor DB and DBB projects by industry group. In both building and industrial projects, the DBB delivery system was dominant. Unlike owner-submitted projects, the difference in the use of the two types of delivery system was not as great. Among building projects, DBB was used nearly 3 times more often than DB. Among industrial projects, the use of either delivery system was nearly equal. DBB was used about 1.2 times more often than DB.
10
7286
158
0
50
100
150
200
Building Industrial
Industry Group
Num
ber o
f Pro
ject
s DB DBB

10
Figure 2.7 Contractor DB and DBB Projects by Industry Group
Figure 2.8 Owner DB and DBB Projects by Project Cost Figure 2.8 shows that DBB was the more commonly used delivery system in owner- submitted projects across all cost categories, even for projects costing $50 million or more. It was clearly the dominant delivery system in projects costing less than $15 million, and was also used more often among projects in the $15 to $50 million cost range.
2135 26
59
155
300
50
100
150
200
<$15MM $15MM-$50MM >$50MM
Cost Category ($ MM)
Num
ber o
f Pro
ject
s
DB DBB
5
123
14
149
0
50
100
150
200
Building Industrial
Industry Group
Num
ber o
f Pro
ject
s DB DBB

11
Note, however, that as project size increased the relative share of DB projects also increased. As shown in Figure 2.9, DB represented about 18% of all projects under $15 million, nearly 25% of all projects between $15 and $50 million, and almost 47% of all projects costing $50 million or more. Figure 2.9 Percentage Share by Delivery System and Project Cost, Owners Figure 2.10 Contractor DB and DBB Projects by Project Cost
By cost category, contractor DB and DBB projects seemed to fit the usage pattern as described in the literature. The lowest cost projects, those costing less than $15 million, tended to use the
59
3138
16
107
40
0
25
50
75
100
125
150
<$15MM $15MM-$50MM >$50MM
Cost Category ($ MM)
Num
ber o
f Pro
ject
s
DB DBB
Owner
17.7% 46.6%24.7%
82.3% 75.3%
53.4%
0.0%
20.0%
40.0%
60.0%
80.0%
100.0%
<$15MM $15-$50MM >$50MM
Cost Category ($ MM)
Rel
ativ
e Pe
rcen
tage
DB DBB

12
DBB delivery system more often, and the highest cost projects, those costing greater than $50 million, tended to use DB more often. Projects in the mid-range used DB and DBB nearly equally as often. As with owners, the relative share of DB projects to DBB projects increased as project size increased, but the shift was more dramatic among contractors as illustrated in Figure 2.11. DB accounted for over 22% of projects in the under $15 million range, slightly more than 51% of projects in the $15 to $50 million cost range, and nearly 79% of projects in the over $50 million range. Figure 2.11 Percentage Share by Delivery System and Project Cost, Contractors
Figure 2.12 Owner DB and DBB Project by Project Nature
272233
122
62 60
0
50
100
150
200
Add on Grass Roots Modernization
Project Nature
Num
ber o
f Pro
ject
s DB DBB
Contractor
77.5%48.7%
78.7%
22.5% 21.3%51.3%
0.0%
20.0%
40.0%
60.0%
80.0%
100.0%
<$15MM $15MM-$50MM >$50MM
Cost Category ($ MM)
Rel
ativ
e Pe
rcen
tage
DB DBB

13
It is believed that the DBB delivery system is more often used with smaller, less complex projects and that DB is more often used with larger, more complex ones. As may have been expected, Figure 2.12 shows that DBB was more commonly used as the delivery mechanism among owner-submitted addition and modernization projects since these tended to be smaller in terms of cost. Even among owner-submitted grass roots projects, however, DBB was used nearly twice as often. Figure 2.13 Contractor DB and DBB Projects by Project Nature
As seen in Figure 2.13 above, contractor-submitted projects, on the other hand, tended to fit the pattern described in the literature, that is, lower cost utilized DBB more often and higher cost projects utilized DB more often. As might have been expected, the relatively lower cost addition and modernization projects tended to use DBB while grass roots projects tended to use DB more often.
Tables 2.1 and 2.2 summarize average project cost for owner and contractor DB and DBB projects by each of the groupings discussed above. In general, DB projects tended to be larger than DBB projects for both owners and contractors.
24
42
6254
61
48
0
20
40
60
80
100
Add on Grass Roots Modernization
Project Nature
Num
ber o
f Pro
ject
s
DB DBB

14
Table 2.1 Average Project Cost—Owner DB and DBB Projects
Category Owner DB Projects ($ millions)
Owner DBB Projects ($ millions)
Public 69.5 21.0 Private 81.7 23.4 Domestic 44.8 22.8 International 165.2 22.0 Buildings 52.3 15.6 Industrial 84.0 26.4 <$15 Million 7.9 6.0 $15-$50 Million 29.9 26.9 >$50 Million 216.2 98.7 Addition 84.8 16.4 Grass Roots 84.8 31.5 Modernization 71.9 21.5 All Owners 80.5 22.7
Owner-submitted DB projects tended to be much larger in all of the subsets analyzed. The only exception to this trend occurred when projects were subsetted by project size. DB and DBB projects in the less than $15 million and the $15 to $50 million cost ranges were similar in size. Overall, owner-submitted DB projects were over three and one-half times larger than DBB projects. Table 2.2 Average Project Cost—Contractor DB and DBB Projects
Category Contractor DB
Projects ($ millions)
Contractor DBB Projects
($ millions) Domestic 62.7 21.9 International 225.1 41.7 Buildings 20.1 15.9 Industrial 108.0 24.9 <$15 Million 9.7 4.9 $15-$50 Million 29.2 27.9 >$50 Million 202.9 150.0 Addition 86.6 22.8 Grass Roots 126.1 41.3 Modernization 80.4 10.5 All Contractors 104.6 24.1
Like owner-submitted projects, contractor-submitted DB projects tended to be larger in all subsets analyzed. Overall, contractor DB projects were more than four times as large as contractor DBB projects.

15
3. Performance and Practice Use Outcomes This chapter discusses performance and practice use outcomes for owner DB and DBB projects and contractor DB and DBB projects. The first five sections are a detailed discussion of the analytic results for overall outcomes, and for sector, industry group, cost category and project nature. Each of these sections contains a summary that highlights the key findings in the detailed discussions that precede it. The sixth section is a chapter summary that attempts to condense the section summaries into a broad review of the key findings within the chapter. It is hoped that this organization will allow the reader the choice of focusing either on the section or chapter summaries without missing the substance of the detailed discussions.
3.1 Overall Owner and Contractor Outcomes Tables 3.1 and 3.2 show overall performance and practice use outcomes for owner and contractor-submitted DB and DBB projects. In interpreting these data, and the data in the remainder of the tables in this chapter, note that for all performance metrics, cost, schedule, safety, changes, and rework performance, lower scores generally indicate better performance. For practice use, pre-project planning, constructability, project change management, D/IT, team building, and zero accident techniques, higher scores indicate better performance. To determine whether performance was statistically significantly different between the two delivery systems, t-tests (two-tailed, p< 0.05) were performed. A two-tailed test was chosen over a one-tailed test in this analysis because the underlying alternate hypothesis was that performance outcomes were not equal between the delivery methods. Had the alternate hypothesis been that one delivery method was better than the other, a one-tailed test would have been appropriate. Significant differences are important in deciding whether factors other than random chance may have influenced an outcome. In this analysis, the differences in performance and practice use scores that were significant at p< 0.05 means that there was at most only 5 chances out of 100 that the differences seen were due to chance alone, and by extension that some factor(s) other than chance were influencing the outcomes. Statistical significance does not mean practical significance, however. Even if the difference between two performance or practice use metrics were statistically significant, the numeric difference may be so small that it is rendered unimportant.
3.1.1 Owner Outcomes With the exception of startup cost growth, cost performance was better among DB projects in all cost-related metrics, but there was a statistically significant difference only in the construction phase cost factor. The construction phase cost factor was significantly lower for DB projects than it was for DBB projects. Better performance was observed among DB projects when comparing the startup phase cost factor to performance among DBB projects, although at p=0.148 the difference only approached significance. While not statistically significant, the
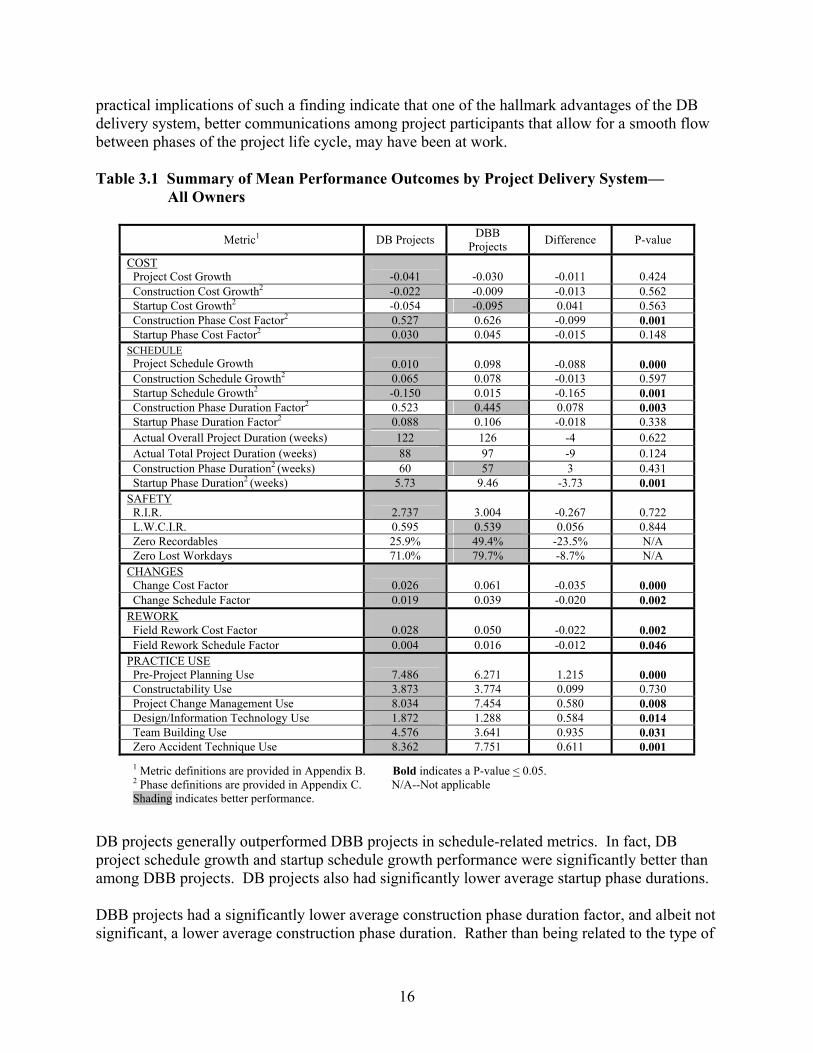
16
practical implications of such a finding indicate that one of the hallmark advantages of the DB delivery system, better communications among project participants that allow for a smooth flow between phases of the project life cycle, may have been at work. Table 3.1 Summary of Mean Performance Outcomes by Project Delivery System—
All Owners
Metric1 DB Projects DBB Projects Difference P-value
COST Project Cost Growth
-0.041
-0.030
-0.011
0.424
Construction Cost Growth2 -0.022 -0.009 -0.013 0.562 Startup Cost Growth2 -0.054 -0.095 0.041 0.563 Construction Phase Cost Factor2 0.527 0.626 -0.099 0.001 Startup Phase Cost Factor2 0.030 0.045 -0.015 0.148 SCHEDULE Project Schedule Growth
0.010
0.098
-0.088
0.000
Construction Schedule Growth2 0.065 0.078 -0.013 0.597 Startup Schedule Growth2 -0.150 0.015 -0.165 0.001 Construction Phase Duration Factor2 0.523 0.445 0.078 0.003 Startup Phase Duration Factor2 0.088 0.106 -0.018 0.338 Actual Overall Project Duration (weeks) 122 126 -4 0.622 Actual Total Project Duration (weeks) 88 97 -9 0.124 Construction Phase Duration2 (weeks) 60 57 3 0.431 Startup Phase Duration2 (weeks) 5.73 9.46 -3.73 0.001 SAFETY R.I.R.
2.737
3.004
-0.267
0.722
L.W.C.I.R. 0.595 0.539 0.056 0.844 Zero Recordables 25.9% 49.4% -23.5% N/A Zero Lost Workdays 71.0% 79.7% -8.7% N/A CHANGES Change Cost Factor
0.026
0.061
-0.035
0.000
Change Schedule Factor 0.019 0.039 -0.020 0.002 REWORK Field Rework Cost Factor
0.028
0.050
-0.022
0.002
Field Rework Schedule Factor 0.004 0.016 -0.012 0.046 PRACTICE USE Pre-Project Planning Use
7.486
6.271
1.215
0.000
Constructability Use 3.873 3.774 0.099 0.730 Project Change Management Use 8.034 7.454 0.580 0.008 Design/Information Technology Use 1.872 1.288 0.584 0.014 Team Building Use 4.576 3.641 0.935 0.031 Zero Accident Technique Use 8.362 7.751 0.611 0.001
1 Metric definitions are provided in Appendix B. Bold indicates a P-value < 0.05. 2 Phase definitions are provided in Appendix C. N/A--Not applicable Shading indicates better performance.
DB projects generally outperformed DBB projects in schedule-related metrics. In fact, DB project schedule growth and startup schedule growth performance were significantly better than among DBB projects. DB projects also had significantly lower average startup phase durations. DBB projects had a significantly lower average construction phase duration factor, and albeit not significant, a lower average construction phase duration. Rather than being related to the type of
17
delivery system used, this may have been related to project size. A separate analysis showed that at $80.5 million, the average cost of DB projects was over three and one-half times larger than DBB projects at $22.7 million (p=0.003). Given this, it follows that if the average project cost of DB projects was over 3-1/2 times larger, and construction duration was only 3 weeks longer, there clearly must be construction schedule benefits that can be attributed to the DB delivery system. Safety results were mixed. DB projects had a slightly lower Recordable Incidence Rate (RIR), and a slightly higher Lost Workday Case Incidence Rate (LWCIR), but the differences were not significant. Compared to DB projects, DBB projects had a much higher percentage of zero recordables (25.9% vs. 49.4%) and a higher percentage of zero lost workdays (71.0% vs. 79.7%.) as would be expected since zero accidents are easier to achieve on smaller projects. DB projects significantly outperformed DBB projects in both changes and rework. It was difficult, nonetheless, to separate the influences resulting in better change performance by DB projects. Due to the fact that the same company performs both design and construction functions, there may have been a disincentive to report or record certain changes.6 However, it was also possible that having the same company perform both design and construction functions mitigated the need for changes due to better communications flow inherent in the DB delivery system. Of the six practices analyzed, DB projects had statistically significant better scores in pre-project planning use, project change management use, D/IT use, team building use, and zero accident technique use. DB projects also scored higher in constructability use, but the difference was not statistically significant. The significant difference in average project size between DB and DBB may have had an influence on the practice use scores seen here. Since larger projects generally exhibit greater use of practices, it may have been project size rather than delivery system that resulted in the difference in practice use performance.
3.1.2 Contractor Outcomes Table 3.2 shows overall performance for contractor-submitted DB and DBB projects. As with owner-submitted projects, t-tests were performed to determine whether there were any significant differences in performance between the two delivery systems. With respect to cost, DB projects generally performed worse than DBB projects, but performance outcomes were not significantly different. The difference in the project budget factor approached significance (p=0.108), with DB projects performing worse than DBB projects. This finding may be a result of the manner in which changes were handled in DB projects. Change performance was better for DB projects, perhaps due to under reporting certain changes, which, in turn, would inflate the project budget factor for DB projects as compared to DBB projects. Definitions of these metrics can be found in Appendix B. 6 Gould FE and Joyce NE, Construction Project Management, 2002

18
Table 3.2 Summary of Mean Performance Outcomes by Project Delivery System— All Contractors
Metric1 DB Projects DBB Projects Difference P-value
COST Project Budget Factor
0.966
0.948
0.018
0.108
Project Cost Growth 0.038 0.056 -0.018 0.347 Construction Cost Growth2 0.135 0.117 0.018 0.674 SCHEDULE Project Schedule Growth
0.030
0.028
0.002
0.904
Construction Schedule Growth2 0.051 0.012 0.039 0.050 Project Schedule Factor 0.988 0.968 0.020 0.036 Construction Phase Duration2 (weeks) 64 50 14 0.001 SAFETY R.I.R.
1.792
2.019
-0.227
0.568
L.W.C.I.R. 0.118 0.066 0.052 0.097 Zero Recordables 23.6% 44.3% -20.7% N/A Zero Lost Workdays 61.2% 84.1% -22.9% N/A CHANGES Change Cost Factor
0.061
0.126
-0.065
0.000
Change Schedule Factor 0.027 0.033 -0.006 0.308 REWORK Field Rework Cost Factor
0.025
0.030
-0.005
0.517
Field Rework Schedule Factor 0.012 0.014 -0.002 0.815 PRACTICE USE Pre-Project Planning Use
5.217
5.699
-0.482
0.101
Constructability Use 4.636 4.195 0.441 0.108 Project Change Management Use 7.515 7.877 -0.362 0.098 Design/Information Technology Use 2.276 2.161 0.115 0.672 Team Building Use 3.999 3.899 0.100 0.799 Zero Accident Technique Use 8.923 7.678 1.245 0.000 1 Metric definitions are provided in Appendix B. Bold indicates a P-value < 0.05. 2 Phase definitions are provided in Appendix C. N/A--Not applicable Shading indicates better performance.
DBB projects outperformed DB projects in all schedule-related metrics. There was a significant difference in performance for three of the four schedule-related metrics, with DBB outperforming DB projects in construction schedule growth, project schedule factor, and construction phase duration. There was no significant difference in project schedule growth. In an attempt to explain these findings, it is worth reviewing how contractor DB and DBB projects were defined. Projects were defined as DB when the contractor performed the majority of the design and construction functions. They were defined as DBB if the contractor performed the design function only, the construction function only, or either the majority of the design (construction) function and less than 50% of the other function. Since three of the four schedule metrics require the use of predicted durations, DBB contractors may have been better able to predict duration either because of the function they performed or the point in time at which they began the project. In the case of design only contractors, predicting duration may have been made easier because many of the factors that lead to schedule growth, such as unforeseen site conditions or unexpected delays in the procurement and delivery of materials, were not part of

19
their scopes of work. In the case of construction only contractors, prediction may have been facilitated by the fact that they were able to make predictions later in the life cycle of a project about only one of the major functions. In general, safety performance was mixed. There were no significant differences in the RIR or LWCIR, although the difference in the LWCIR for DB and DBB projects (0.118 vs. 0.066) approached significance (p=0.097). DBB projects also performed better in the percentage of zero recordables and zero lost workdays. These findings may be attributable to the fact that for the design only contractors, zero recordables and zero lost workdays were easier to achieve on the smaller DBB projects. DB projects had better observed performance in both changes and rework than did DBB projects. With respect to the change cost factor, DB projects performed significantly better than DBB projects. DB projects also tended to have better performance in practice use, although performance was significantly better in only zero accident technique use. Differences in pre-project planning use, constructability use, and project change management use approached significance. DBB projects outperformed DB projects in the first and the third practices listed above. DB projects outperformed DBB projects in constructability use.
3.1.3 Section Summary
Among owners, DB projects outperformed DBB projects in four of the cost-related metrics,
project cost growth, construction cost growth, construction phase cost factor, and startup phase cost factor, but the difference in performance was only significant for the construction phase cost factor.
Among contractors, DB projects had better performance in only one out of the three cost-related metrics, project cost growth, but the differences were not significant.
Owner-submitted DB projects generally outperformed DBB projects in seven out of the nine
schedule-related metrics, but the difference was significant only for project schedule growth, startup schedule growth, and startup phase duration.
COST: Owner-submitted DB projects had better performance in all but 1 out of the 5 cost-related metrics analyzed. Contractor-submitted DB projects had better performance in only 1 out of the three cost-related metrics.
SCHEDULE: Owner-submitted DB projects performed significantly better in 3 out of the 9 schedule metrics analyzed. Contractor-submitted DB projects performed significantly worse in 3 out of the 4 metrics analyzed.

20
Contractor-submitted DB projects performed worse than DBB projects in schedule-related metrics, and the differences were significant in 3 out of the 4 metrics analyzed, construction schedule growth, project schedule factor, and construction phase duration.
Owner-submitted and contractor-submitted DB projects generally had better safety
performance in the RIR and worse performance in the LWCIR, but there were no significant differences between the two project delivery systems.
Owner-submitted DB projects outperformed DBB projects in changes and rework, and the
differences were significant.
Contractor-submitted DB projects outperformed DBB projects in changes and rework, but the difference was significant only for the change cost factor.
Owner-submitted DB projects outperformed DBB projects in all practice use metrics. The
differences were significant in five out of the six practices analyzed: pre-project planning, project change management, D/IT, team building, and zero accident techniques.
Contractor-submitted DB projects generally outperformed DBB projects, but the difference was significant only in zero accident technique use.
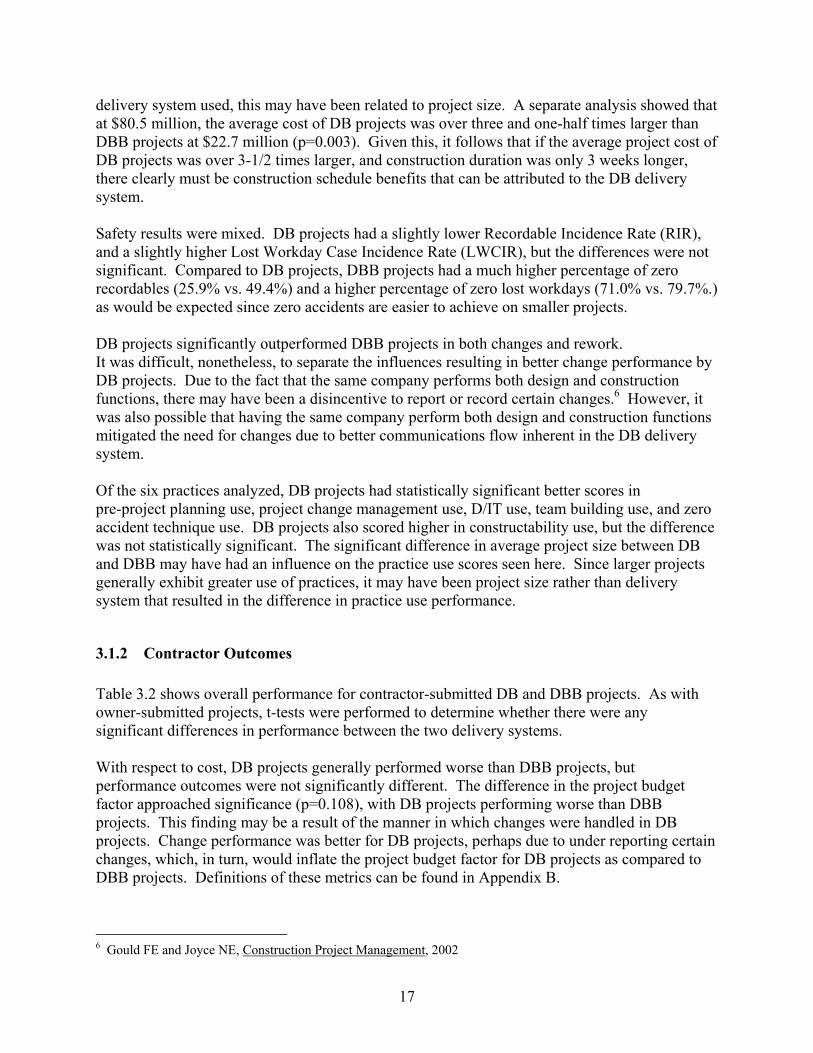
3.2 Sector-Related Outcomes for Owners Table 3.3 shows the difference in project performance by public and private sector projects. Since there were too few public sector DB projects for publication purposes, comparisons will only be made between private sector DB and DBB projects.
SAFETY: Safety performance was mixed for both owner-submitted and contractor-submitted DB and DBB projects.
CHANGES: Owner-submitted DB projects performed significantly better in the change cost and change schedule metrics. Contractor-submitted DB projects performed significantly better only in the change cost factor. REWORK: Owner-submitted DB projects performed significantly better in rework. Contractor-submitted DB projects outperformed DBB projects, but there were no significant differences between the two.
PRACTICE USE: Owner-submitted DB projects performed significantly better in 5 out of the 6 practices analyzed. Contractor-submitted DB projects performed significantly better in 1 out of the 6 practices.
21
Table 3.3 Summary of Mean Performance Outcomes by Sector— Owner DB and DBB Projects
Public Projects Private Projects
Metric1 DB DBB DB DBB
COST Project Cost Growth
C.T.
-0.034
-0.049
-0.028
Construction Cost Growth2 C.T. 0.017 -0.025 -0.019 Startup Cost Growth2 C.T. -0.080 -0.028 -0.097 Construction Phase Cost Factor2 C.T. 0.827 0.512 0.547 Startup Phase Cost Factor2 C.T. 0.063* 0.031 0.042 SCHEDULE Project Schedule Growth
C.T.
0.169
0.008
0.071
Construction Schedule Growth2 C.T. 0.117 0.064 0.063 Startup Schedule Growth2 C.T. -0.004* -0.152 0.018 Construction Phase Duration Factor2 C.T. 0.483 0.531 0.429 Startup Phase Duration Factor2 C.T. 0.114 0.084 0.104 Actual Overall Project Duration (weeks) C.T. 152 115 115 Actual Total Project Duration (weeks) C.T. 129 82 85 Construction Phase Duration2 (weeks) C.T. 76 59 49 Startup Phase Duration2 (weeks) C.T. 12.74 5.90 8.79 SAFETY R.I.R.
C.T.
2.728
2.728
3.088
L.W.C.I.R. C.T. 1.257 0.457 0.304 Zero Recordables C.T. 55.6% 24.5% 47.5% Zero Lost Workdays C.T. 66.7% 73.2% 84.0% CHANGES Change Cost Factor
C.T.
0.069
0.027
0.058
Change Schedule Factor C.T. 0.045 0.013 0.037 REWORK Field Rework Cost Factor
C.T.
0.039
0.029
0.052
Field Rework Schedule Factor C.T. 0.031 0.003 0.008 PRACTICE USE Pre-Project Planning Use
C.T.
4.689
7.570
6.928
Constructability Use C.T. 3.223 4.016 4.000 Project Change Management Use C.T. 6.413 8.066 7.894 Design/Information Technology Use C.T. 1.230 1.887 1.311 Team Building Use C.T. 3.237 4.669 3.808 Zero Accident Technique Use C.T. 6.396 8.457 8.277
1 Metric definitions are provided in Appendix B. * = Statistical warning indicator. See Appendix A. 2 Phase definitions are provided in Appendix C. C.T. = Data not shown per CII confidentiality policy. Shading indicates better performance. See Appendix A.
Private DB projects outperformed DBB projects in both project and construction cost growth, but private DBB projects performed better in startup cost growth. Schedule performance was mixed. Private DB projects performed better in project and startup schedule growth, but private DBB projects performed slightly better in construction schedule growth. For the two safety-related incidence rates, performance was mixed. Private DB projects had better performance in the RIR, while private DBB projects had better performance in the LWCIR. Private DBB projects had nearly twice the percentage of zero recordables than did private DB projects (47.5% vs. 24.5%), but such an outcome may have been a function of smaller average project size, in which the risk of accidents was mitigated by shorter construction

22
phase durations. Private DB projects had better performance in both changes and rework, which is consistent with the findings for owners in Section 3.1.1. Private DB projects also had better performance in all practices measured.
3.3 Industry Group-Related Outcomes for Owners and Contractors
3.3.1 Owner Outcomes Table 3.4 shows the difference in owner-submitted project performance by industry group. The discussion will first focus on comparisons between DB and DBB industrial projects. Since similar comparisons cannot be made within building projects due to small cell sizes, comparisons will then be made between DBB building and DBB industrial projects.

23
Table 3.4 Summary of Mean Performance Outcomes by Industry Group— Owner DB and DBB Projects
Building Projects Industrial Projects
Metric1 DB DBB DB DBB
COST Project Cost Growth
C.T.
-0.018
-0.050
-0.036
Construction Cost Growth2 C.T. 0.023 -0.033 -0.025 Startup Cost Growth2 C.T. C.T. -0.052 -0.112 Construction Phase Cost Factor2 C.T. 0.858 0.491 0.509 Startup Phase Cost Factor2 C.T. 0.058* 0.030 0.043 SCHEDULE Project Schedule Growth
C.T.
0.126
0.006
0.085
Construction Schedule Growth2 C.T. 0.107 0.058 0.065 Startup Schedule Growth2 C.T. -0.013 -0.144 0.021 Construction Phase Duration Factor2 0.618* 0.500 0.510 0.415 Startup Phase Duration Factor2 C.T. 0.098 0.082 0.107 Actual Overall Project Duration (weeks) 160* 150 116* 113
Actual Total Project Duration (weeks) 121* 127 84 82 Construction Phase Duration2 (weeks) C.T. 75 57 47 Startup Phase Duration 2(weeks) C.T. 10.49 5.76 9.25 SAFETY R.I.R.
C.T.
3.597
2.846
2.823
L.W.C.I.R. C.T. 1.465 0.599 0.236 Zero Recordables C.T. 52.8% 24.5% 48.3% Zero Lost Workdays C.T. 66.7% 70.2% 84.0% CHANGES Change Cost Factor
C.T.
0.059
0.025
0.063
Change Schedule Factor C.T. 0.041 0.013 0.038 REWORK Field Rework Cost Factor
C.T.
0.049
0.031
0.050
Field Rework Schedule Factor C.T. 0.021 0.003 0.012 PRACTICE USE Pre-Project Planning Use
C.T.
4.662
7.558
7.127
Constructability Use C.T. 3.097 4.097 4.121 Project Change Management Use C.T. 6.574 8.136 7.930 Design/Information Technology Use C.T. 1.021 1.948 1.421 Team Building Use C.T. 3.841 4.753 3.538 Zero Accident Technique Use 7.221* 6.577 8.521 8.341
1 Metric definitions are provided in Appendix B. * = Statistical warning indicator. See Appendix A. 2 Phase definitions are provided in Appendix C. C.T. = Data not shown per CII confidentiality policy. Shading indicates better performance. See Appendix A.
Owner-submitted DB industrial projects performed better than DBB industrial projects in all cost-related metrics with the exception of startup cost growth. With respect to schedule-growth, DB projects outperformed DBB projects in three of the performance metrics that are the most important in determining project schedule performance, project schedule growth, construction schedule growth, and startup schedule growth. Construction phase duration was on the average 10 weeks more for DB projects than for DBB projects, which was expected given that DB projects were considerably larger. DBB projects had better performance in the RIR and the LWCIR. DBB projects outperformed DB projects in zero recordables and zero lost workdays, perhaps related to project size and accident risk exposure. DB industrial projects performed

24
better in both the changes and rework categories. DB industrial projects had better mean performance scores in all practices measured with the exception of constructability use, in which DBB industrial projects had better mean performance scores. Comparing DBB building projects and DBB industrial projects, there were generally better outcomes for industrial projects than for buildings. In four of the five cost-related metrics for which comparable data were available, DBB industrial projects outperformed DBB buildings. These findings are consistent with the results of other analyses of the BM&M database: industrial projects, particularly heavy industrial projects, outperform building projects. DBB industrial projects also outperformed DBB building projects in most schedule-related metrics. Particularly interesting was that for the four measures of duration DBB industrials outperformed DBB buildings. Considering average project cost as a proxy for project size, industrial projects, with an average cost of $26.4 million, would have been expected to have had longer durations than building projects, with an average cost of $15.6 million. Perhaps the scheduling inefficiencies of DBB projects are exacerbated for building projects. Industrial projects outperformed building projects in three of the four safety metrics analyzed. Notable were the differences in the RIR and the LWCIR. Industrials had an RIR of 2.823 and an LWCIR of 0.236, while buildings had an RIR and LWCIR of 3.597 and 1.465, respectively. Particularly strong performance was observed in industrial project zero lost workdays where the larger industrial projects performed better than the smaller building projects. Seldom do larger projects outperform on this metric. Changes and rework performance outcomes were mixed. The differences between the two groups were small, making it difficult to determine better performance. Industrial projects outperformed building projects in practice use, achieving better scores in all practices analyzed, with the exception of team building use. This may have been related to project size, since larger projects tend to make greater use of these practices. Industrial projects also tend to be more process oriented, using process improving practices more often.
3.3.2 Contractor Outcomes Table 3.5 compares the performance outcomes of contractor-submitted projects by industry group. Note that the data in this table mirror the data shown in Table 3.2, since contractor-submitted projects were largely industrial projects. As with owners in the previous section, the discussion will first focus on comparisons between DB and DBB industrial projects and then on comparisons between DBB building and DBB industrial projects.

25
Table 3.5 Summary of Mean Performance Outcomes by Industry Group— Contractor DB and DBB Projects
1 Metric definitions are provided in Appendix B. * = Statistical warning indicator. See Appendix A. 2 Phase definitions are provided in Appendix C. C.T. = Data not shown per CII confidentiality policy. Shading indicates better performance. See Appendix A.
Among industrial projects, cost performance was mixed. Remembering that lower scores indicate better performance, DB industrial projects had worse performance in the project budget factor and construction cost growth. DB projects had better performance in project cost growth. As stated earlier in Section 3.1.2, these results may have been influenced by metric definitions and the way in which changes may have been accounted for in DB projects. Industrial DB projects had slightly worse schedule performance than DBB projects. It may be the case that DBB projects as they were defined in this study were better able to predict project duration because many included only one of the major functions performed in the project, design or construction. As in the case of two of the cost-related metrics, project budget factor and construction cost growth, the impact of the way changes were accounted for may have affected these results, also. Safety performance was mixed, with DB projects having had better performance in the RIR and DBB projects having had better performance in the LWCIR. Change performance was better for
Building Projects Industrial Projects Metric1
DB DBB DB DBB COST Project Budget Factor
C.T.
0.972*
0.965
0.946
Project Cost Growth C.T. 0.068* 0.039 0.055 Construction Cost Growth2 C.T. 0.064* 0.140 0.126 SCHEDULE Project Schedule Growth
C.T.
0.019*
0.028
0.029
Construction Schedule Growth2 C.T. 0.005* 0.050 0.013 Project Schedule Factor C.T. 0.952* 0.988 0.969 Construction Phase Duration2 (weeks) C.T. 55* 64 49 SAFETY R.I.R.
C.T.
C.T.
1.755
1.939
L.W.C.I.R. C.T. 0.000* 0.118 0.078 Zero Recordables C.T. C.T. 23.1% 39.3% Zero Lost Workdays C.T. 100.0%* 60.6% 81.0% CHANGES Change Cost Factor
C.T.
0.091*
0.062
0.129
Change Schedule Factor C.T. C.T. 0.027 0.035 REWORK Field Rework Cost Factor
C.T.
C.T.
0.026
0.028
Field Rework Schedule Factor C.T. C.T. 0.012 0.013 PRACTICE USE Pre-Project Planning Use
C.T.
4.425*
5.176
5.813
Constructability Use C.T. 2.444* 4.668 4.347 Project Change Management Use C.T. 7.582* 7.542 7.907 Design/Information Technology Use C.T. 1.206* 2.342 2.252 Team Building Use C.T. 2.595* 4.027 4.014 Zero Accident Technique Use C.T. 6.071* 8.934 7.918

26
DB projects, as may have been expected. Rework performance was only slightly better for DB projects than it was for DBB projects. DB projects generally outperformed DBB projects in practice use. The former had better (higher) practice use scores in all practices measured except for pre-project planning use and project change management use. This is particularly puzzling since DB contractors would be more likely to be involved in pre-project planning than DBB contractors, but it may be that the greater use of fast-tracking among DB projects had a negative impact on the amount of time available for front end planning. Neither DBB buildings nor industrials had an advantage over the other in terms of cost. Due to small cell sizes for building projects, the interpretation of the results for all comparisons between buildings and industrials should be approached with caution. DBB buildings had better schedule performance than did industrials. For the two published safety metrics for buildings, LWCIR and zero lost workdays, building projects seemed to outperform industrial projects. The LWCIR for buildings was 0.000 compared to 0.078 for industrials, and the former had no lost work days as compared to the latter with 81% zero lost workdays. DBB industrial projects had better practice use scores in all of the practices analyzed, as might have been expected from project size.
3.3.3 Section Summary
Owner-submitted DB industrial projects performed better than DBB industrial projects in
project cost growth, construction cost growth, construction phase factor, and startup phase cost factor. DBB industrials performed better in startup cost growth.
For contractor-submitted DB and DBB industrial projects, cost performance was mixed. This may have been due to the way in which changes were accounted for. Changes may not have been identified as distinct cost-related items in some projects, but they may have been reflected in overall cost.
Among owners, DB projects having had better performance in project schedule growth,
construction schedule growth, and startup schedule growth, as well as the startup phase duration factor and startup phase duration; DBB projects had better performance in the remaining four.
COST: Owner-submitted DB projects performed better in 4 out of the 5 cost-related metrics analyzed. Cost performance was mixed for contractor-submitted projects.
SCHEDULE: Owner-submitted DB projects had better performance in the three schedule-related metrics that are most important in determining schedule performance. Contractor-submitted DB projects had worse performance in 3 out of the 4 metrics analyzed.

27
Among contractors, DB industrial projects had worse schedule performance than DBB
projects in construction schedule growth, project schedule factor, and construction phase duration.
Owner-submitted DB industrial projects had worse safety performance than DBB projects in
the four safety metrics analyzed, and notably in the RIR and the LWCIR.
For contractor-submitted projects, performance was mixed with DB projects having had better performance in the RIR, and DBB projects having had better performance in the LWCIR.
For owners, DB industrial projects performed better in both the changes and rework
categories.
For contractors, change performance was better for DB industrial projects, and rework performance was only slightly better for DB projects than it was for DBB projects.
Owner-submitted DB industrial projects had better mean scores in all practices measured with
the exception of constructability use, in which DBB industrial projects had better mean performance scores.
Contractor-submitted DB projects generally outperformed DBB projects in the intensity of practice use. These projects performed better in constructability use, D/IT use, team building use, and zero accident technique use.
SAFETY: Owner-submitted DB projects had worse safety performance. Contractor-submitted DB and DBB projects had mixed safety performance.
CHANGES: Owner and contractor-submitted DB projects had better performance. REWORK: Owner-submitted projects DB projects had better performance. Contractor-submitted DB projects performed only slightly better in rework.
PRACTICE USE: Owner-submitted DB projects had better performance in 5 out of the 6 practices analyzed. Contractor-submitted DB projects had better performance in 4 of the 6 practices.

28
3.4 Cost Category-Related Outcomes for Owners and Contractors
3.4.1 Owner Outcomes Table 3.6 summarizes mean performance outcomes for owner-submitted DB and DBB projects by cost category. Shading indicates better performance within individual cost categories for DB and DBB projects. Table 3.6 Summary of Mean Performance Outcomes by Cost Category—
Owner DB and DBB Projects
<$15 Million $15-$50 Million >$50 Million Metric1
DB DBB DB DBB DB DBB COST Project Cost Growth
-0.034
-0.037
-0.032
-0.023
-0.061
-0.008
Construction Cost Growth2 -0.050 -0.018 -0.025 0.006 0.015 0.006 Startup Cost Growth2 -0.100 -0.167 -0.076* -0.014 0.009* -0.055* Construction Phase Cost Factor2 0.534 0.659 0.580 0.561 0.474 0.592 Startup Phase Cost Factor2 0.044* 0.048 0.020* 0.044 0.022* 0.037* SCHEDULE Project Schedule Growth
0.015
0.119
-0.021*
0.062
0.028
0.063
Construction Schedule Growth2 0.081 0.072 0.003* 0.112 0.097 0.044 Startup Schedule Growth2 -0.125* 0.007 -0.155* 0.009 -0.173* 0.047* Construction Phase Duration Factor2 0.479 0.407 0.531 0.503 0.578 0.538 Startup Phase Duration Factor2 0.076 0.097 0.071* 0.094 0.120 0.158 Actual Overall Project Duration (weeks) 109 114 108 140 155 170 Actual Total Project Duration (weeks) 78 87 79 107 112 138 Construction Phase Duration2 (weeks) 46 47 53 68 86 92 Startup Phase Duration2 (weeks) 3.24 7.69 7.56* 10.25 7.65* 16.71* SAFETY R.I.R.
3.198
3.154
3.559*
1.767
1.120*
4.259
L.W.C.I.R. 1.018 0.618 0.483* 0.363 0.172* 0.480 Zero Recordables 45.8% 63.5% 16.7%* 40.0% 6.3%* 4.3% Zero Lost Workdays 79.2% 87.8% 63.2%* 80.0% 68.4%* 48.0% CHANGES Change Cost Factor
0.021*
0.064
0.027*
0.058
0.029
0.056
Change Schedule Factor 0.027 0.031 0.014* 0.074 0.008* 0.032* REWORK Field Rework Cost Factor
0.031*
0.044
C.T.
0.062
0.024*
0.050*
Field Rework Schedule Factor 0.004* 0.015 C.T. 0.022* C.T. C.T. PRACTICE USE Pre-Project Planning Use
7.479
6.053
7.445
6.736
7.529
6.493
Constructability Use 3.505 3.768 3.654 3.759 4.599 3.836 Project Change Management Use 8.137 7.368 7.739 7.696 8.129 7.416 Design/Information Technology Use 1.280 1.283 1.542* 1.316 2.882 1.254 Team Building Use 3.614 2.906 4.360 4.620 6.080 5.445 Zero Accident Technique Use 8.077 7.429 8.317 8.250 8.783 8.400
1 Metric definitions are provided in Appendix B. * = Statistical warning indicator. See Appendix A. 2 Phase definitions are provided in Appendix C. C.T. = Data not shown per CII confidentiality policy. Shading indicates better performance. See Appendix A.

29
Within cost category, cost performance was mixed with neither delivery system clearly dominant except in the $15 to $50 million cost range. DB projects within this cost range tended to outperform DBB projects. In general, schedule performance was better for DB projects in all cost categories. For schedule metrics that were clearly associated with absolute project size, such as actual overall project duration, actual total project duration, and construction and startup phase duration, the choice of the DB delivery method did seem to have an influence on performance. This was most likely due to the fact that DB projects better allow for overlaps in the design-procurement-construction sequence. For safety metrics associated with absolute project size, zero recordables and zero lost workdays, DB projects performed worse than DBB projects in the under $15 million and $15 to $50 million ranges despite longer project durations for DBB projects. This may be attributed to the fact that the DBB mechanism is more often used on less complex projects, with less risk of accident exposure. DB projects performed better than DBB in the over $50 million cost range. The RIR and the LWCIR reported by DB projects in this range were also better than the rates reported by both DB and DBB projects in the lower two cost ranges. The small size of the sample of DB projects costing over $50 million may partially explain this surprising finding since there is usually an inverse relationship between project size and safety performance, with performance decreasing as project size increases. It may also have been attributable to the use of safety contract incentives, commonly used with the reimbursable contracts of DB projects, that may have had a direct influence on reported safety performance. Change and rework performance tended to be better for DB projects in all cost categories. The greater use of pre-project planning and change management by DB projects may account for this difference. This may have also been a direct result of the delivery system, in which the lack of checks and balances may promote not reporting or recording certain changes or rework. In general, practice use scores were higher for DB projects than for DBB projects. Consistently greater practice use among DB projects was found at the greater than $50 million cost range, where DB projects were on average over two times as large as DBB projects.
3.4.2 Contractor Outcomes Table 3.7 shows mean performance outcomes for contractor-submitted projects by cost category. Shading indicates better performance within cost category.

30
Table 3.7 Summary of Mean Performance Outcomes by Cost Category— Contractor DB and DBB Projects
<$15 Million $15-$50 Million >$50 Million Metric1
DB DBB DB DBB DB DBB COST Project Budget Factor
0.955
0.952
0.981
0.918
0.962
1.004*
Project Cost Growth 0.024 0.081 0.056 0.000 0.035 0.059* Construction Cost Growth2 0.064 0.119 0.134 0.070 0.175 0.208* SCHEDULE Project Schedule Growth
0.971
0.961
0.996
0.975
0.992
0.993*
Construction Schedule Growth2 0.078 0.015 0.045 -0.002 0.040 0.026* Project Schedule Factor 0.051 0.034 0.023 0.014 0.023 0.032* Construction Phase Duration2 (weeks) 39 39 54 55 84 89 SAFETY R.I.R.
1.381*
1.769
2.369
1.530
1.569
4.044*
L.W.C.I.R. 0.000* 0.023 0.150 0.051 0.141 0.261* Zero Recordables 57.9%* 60.5% 23.5% 31.8% 9.5% 10.0%* Zero Lost Workdays 100.0%* 97.4% 72.7% 80.0% 39.2% 40.0%* CHANGES Change Cost Factor
0.065
0.148
0.080
0.103
0.048
0.037*
Change Schedule Factor 0.033 0.035 0.029 0.035 0.023 C.T. REWORK Field Rework Cost Factor
0.017*
0.026
0.027
0.033*
0.028
0.033*
Field Rework Schedule Factor C.T. 0.005 0.009* C.T. 0.013* C.T. PRACTICE USE Pre-Project Planning Use
5.098
5.601
5.486
5.830
5.108
6.060*
Constructability Use 3.729 3.480 4.370 5.792 5.295 5.323* Project Change Management Use 7.639 7.639 7.401 8.596 7.522 7.819* Design/Information Technology Use 1.241 1.157 2.175 3.184 2.916 4.298* Team Building Use 1.637 2.788 3.745 5.889 5.377 6.572* Zero Accident Technique Use 8.690 6.749 8.997 9.454 8.989 9.328*
1 Metric definitions are provided in Appendix B. * = Statistical warning indicator. See Appendix A. 2 Phase definitions are provided in Appendix C. C.T. = Data not shown per CII confidentiality policy. Shading indicates better performance. See Appendix A.
Cost performance was mixed. DB projects in the under $15 million and over $50 million categories tended to exhibit better cost performance than similarly classified DBB projects. DBB projects costing $15 to $50 million outperformed DB projects in the same cost range. Regarding schedule, contractor-submitted DBB projects tended to outperform DB projects in the under $15 million and $15 to $50 million cost ranges. In the over $50 million range DB projects outperformed DBB projects in three of the four schedule-related metrics. Safety performance for DB projects in the under $15 million range was better in the RIR, LWCIR, and zero lost workdays than it was for DBB projects, but due to the small cell sizes for DB projects in this range, these findings should be interpreted with caution. In the $15 to $50 million category, DB projects had worse performance than DBB projects. In the over $50 million category, DB projects appeared to have the advantage. Change and rework performance were somewhat better for DB projects in most cost categories. For both DB and DBB projects, the best change scores were achieved by projects in the greater

31
than $50 million range, as would have been expected since large projects tend to have more formal processes for managing changes. For the field rework cost factor, DB projects tended to perform better in all cost categories. Practice use performance in the under $15 million category was mixed with better DB performance for constructability, D/IT, and zero accident techniques. DBB projects made greater use of practices than DB projects in the two highest cost ranges. This pattern is opposite that of owners with respect to cost category (see Table 3.6) and of contractors with respect to industry group (see Table 3.5). In general, practice use tended to increase with project size for both DB and DBB projects.
3.4.3 Section Summary
For owner-submitted projects, cost performance tended to be better for DB projects in all cost
ranges. However, it was only for projects in the $15 to $50 million cost range that DB projects dominated.
For contractor-submitted projects, DB projects in the less than $15 million and the over $50 million categories tended to exhibit better cost performance; DBB projects in the $15 to $50 million exhibited better cost performance.
In general, schedule performance was better for owner-submitted DB projects in all cost
categories. DB schedule performance tended to be worse in the construction phase duration factor across all cost categories.
Contractor-submitted DB projects outperformed DBB projects in the over $50 million cost range. DBB projects had better performance in the under $15 million and $15 to $50 million cost ranges.
For all safety metrics, owner-submitted DB projects performed worse in the less than $15
million and the $15 to $50 million categories; DB projects performed better in the over $50 million range.
COST: Cost performance was mixed for owner-submitted projects. Contractor-submitted DB projects performed better at the lowest and highest cost ranges.
SCHEDULE: Owner-submitted DB projects performed better in all cost ranges. Contractor-submitted DB projects performed worse at the lower two cost ranges.
SAFETY: Owner-submitted DB projects performed worse at the lower two cost ranges. Contractor-submitted DB projects performed somewhat better at the lowest and highest cost ranges and worse at the middle range.

32
Contractor-submitted DB projects in the under $15 million range outperformed DBB projects in the RIR, LWCIR, and zero lost workdays, but due to the small cell sizes for DB projects in this range, these findings should be interpreted with caution. In the $15 to $50 million category, DB projects had worse performance. In the over $50 million category, DB projects had better performance in the RIR and LWCIR.
Among owners, change performance tended to be better for DB projects in all cost categories.
Similarly, rework performance tended to be better for DB projects in the under $15 million and over $50 million categories.
Among contractors, change performance was better for DB projects at the under $15 million and $15 to $50 million ranges. Rework performance was better for DB projects, but these data should be interpreted with caution due to small cell sizes.
In general, practice use scores were higher for owner-submitted DB projects in all cost
categories. Practice use scores were consistently higher only for projects costing over $50 million.
For contractor-submitted projects, practice use performance in the under $15 million category was somewhat better for DB projects than it was for DBB projects. DBB projects performed better in the $15 to $50 million and over $50 million cost ranges.
CHANGES: Owner-submitted DB projects performed better at all cost ranges. Contractor-submitted DB projects performed better at the lower two cost ranges. REWORK: Owner-submitted DB projects performed better at the lowest and highest cost ranges. Contractor-submitted DB projects performed better in the field rework cost factor.
PRACTICE USE: Owner-submitted DB projects had better performance at all cost ranges. Contractor-submitted DB projects performed somewhat better at the lowest cost range, and contractor-submitted DB projects performed worse at the two highest cost ranges.
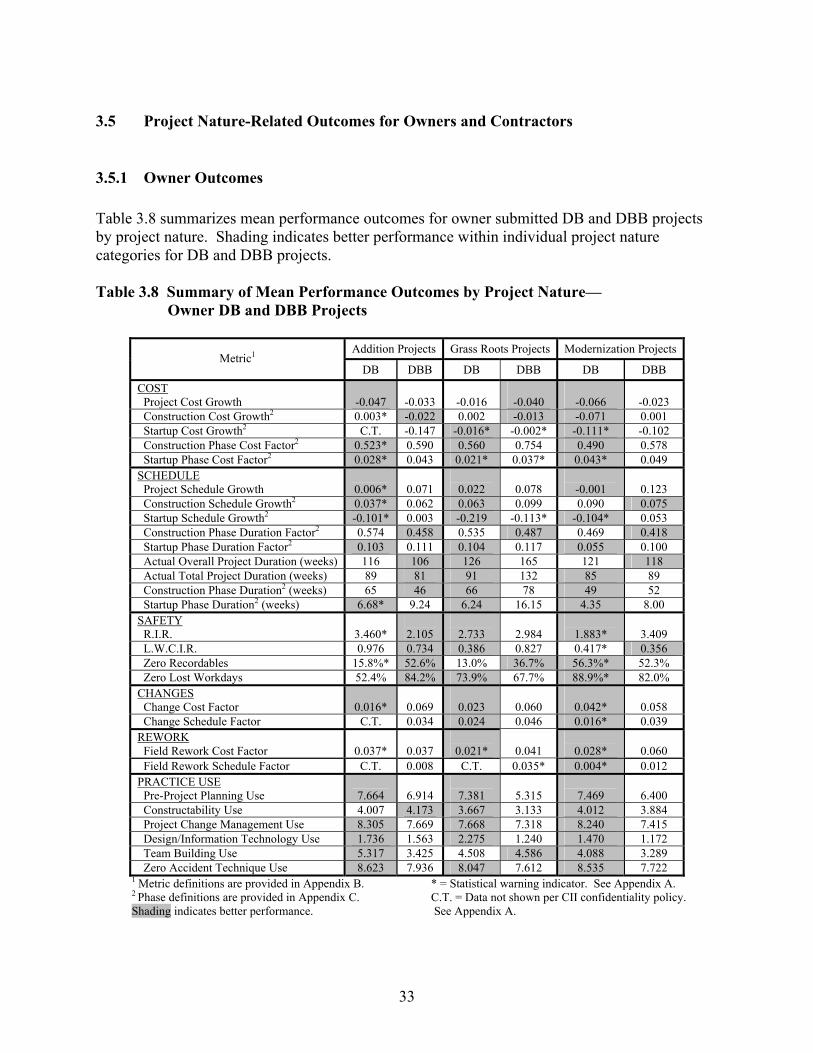
33
3.5 Project Nature-Related Outcomes for Owners and Contractors
3.5.1 Owner Outcomes Table 3.8 summarizes mean performance outcomes for owner submitted DB and DBB projects by project nature. Shading indicates better performance within individual project nature categories for DB and DBB projects. Table 3.8 Summary of Mean Performance Outcomes by Project Nature—
Owner DB and DBB Projects
Addition Projects Grass Roots Projects Modernization Projects Metric1
DB DBB DB DBB DB DBB COST Project Cost Growth
-0.047
-0.033
-0.016
-0.040
-0.066
-0.023
Construction Cost Growth2 0.003* -0.022 0.002 -0.013 -0.071 0.001 Startup Cost Growth2 C.T. -0.147 -0.016* -0.002* -0.111* -0.102 Construction Phase Cost Factor2 0.523* 0.590 0.560 0.754 0.490 0.578 Startup Phase Cost Factor2 0.028* 0.043 0.021* 0.037* 0.043* 0.049 SCHEDULE Project Schedule Growth
0.006*
0.071
0.022
0.078
-0.001
0.123
Construction Schedule Growth2 0.037* 0.062 0.063 0.099 0.090 0.075 Startup Schedule Growth2 -0.101* 0.003 -0.219 -0.113* -0.104* 0.053 Construction Phase Duration Factor2 0.574 0.458 0.535 0.487 0.469 0.418 Startup Phase Duration Factor2 0.103 0.111 0.104 0.117 0.055 0.100 Actual Overall Project Duration (weeks) 116 106 126 165 121 118 Actual Total Project Duration (weeks) 89 81 91 132 85 89 Construction Phase Duration2 (weeks) 65 46 66 78 49 52 Startup Phase Duration2 (weeks) 6.68* 9.24 6.24 16.15 4.35 8.00 SAFETY R.I.R.
3.460*
2.105
2.733
2.984
1.883*
3.409
L.W.C.I.R. 0.976 0.734 0.386 0.827 0.417* 0.356 Zero Recordables 15.8%* 52.6% 13.0% 36.7% 56.3%* 52.3% Zero Lost Workdays 52.4% 84.2% 73.9% 67.7% 88.9%* 82.0% CHANGES Change Cost Factor
0.016*
0.069
0.023
0.060
0.042*
0.058
Change Schedule Factor C.T. 0.034 0.024 0.046 0.016* 0.039 REWORK Field Rework Cost Factor
0.037*
0.037
0.021*
0.041
0.028*
0.060
Field Rework Schedule Factor C.T. 0.008 C.T. 0.035* 0.004* 0.012 PRACTICE USE Pre-Project Planning Use
7.664
6.914
7.381
5.315
7.469
6.400
Constructability Use 4.007 4.173 3.667 3.133 4.012 3.884 Project Change Management Use 8.305 7.669 7.668 7.318 8.240 7.415 Design/Information Technology Use 1.736 1.563 2.275 1.240 1.470 1.172 Team Building Use 5.317 3.425 4.508 4.586 4.088 3.289 Zero Accident Technique Use 8.623 7.936 8.047 7.612 8.535 7.722
1 Metric definitions are provided in Appendix B. * = Statistical warning indicator. See Appendix A. 2 Phase definitions are provided in Appendix C. C.T. = Data not shown per CII confidentiality policy. Shading indicates better performance. See Appendix A.

34
DB projects largely exhibited better performance in cost-related metrics. DB addition and grass roots projects tended to have better performance scores than DBB projects. DB modernization projects had better scores than DB additions or modernizations in all metrics analyzed. This is a particularly interesting finding since modernization projects normally report worse cost performance than additions or grass roots. The use of DB on these projects may have been a key to the improved performance. In all project nature categories, DB projects tended to outperform DBB projects in project schedule growth and startup schedule growth. DBB addition projects had worse performance in project schedule growth and construction schedule growth despite having had shorter absolute durations. Safety performance was mixed. DBB addition projects outperformed DB additions in all safety metrics analyzed. However, DB grass roots and modernization projects largely outperformed similarly classified DBB projects. For changes, rework, and practice use, DB projects tended to outperform DBB projects. Change and rework performance may have been influenced by the nature of the DB delivery system, in which there may have been less incentive to report changes or rework. Greater practice utilization by DB projects may have been related to project size, since DB projects tended to be larger than DBB projects (see Table 2.1).
3.5.2 Contractor Outcomes Table 3.9 summarizes performance for contractor-submitted DB and DBB projects by project nature. Shading denotes better performance within project nature categories.
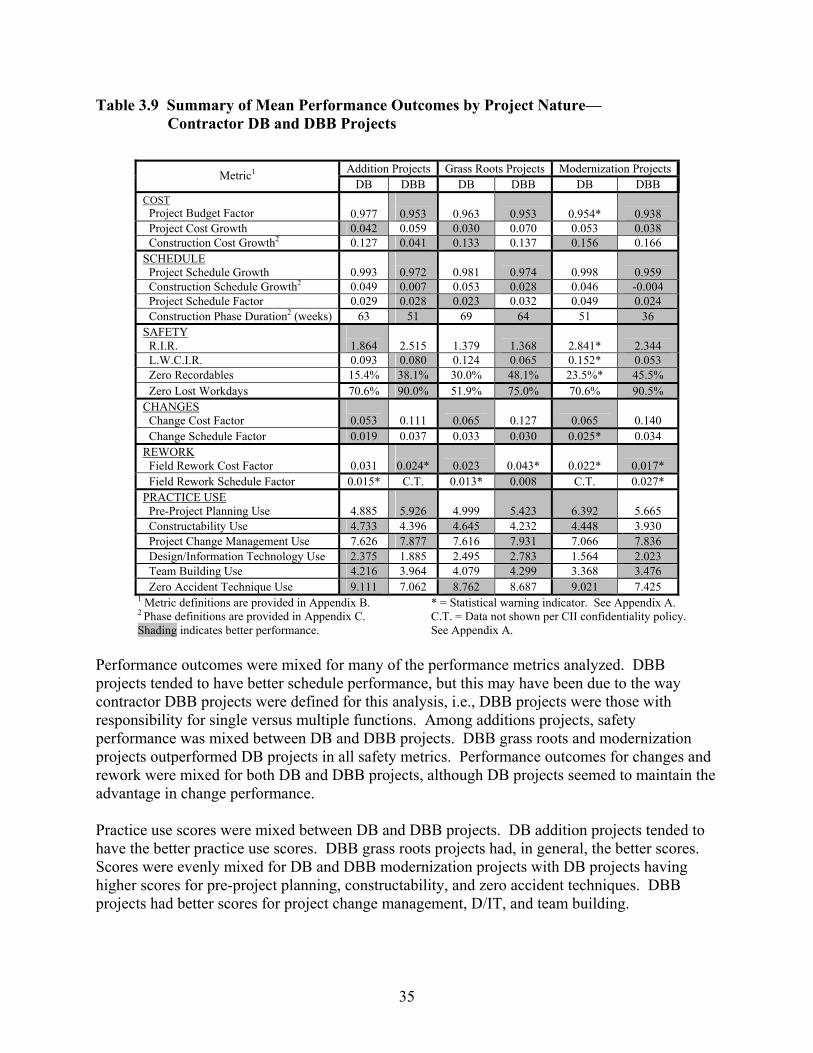
35
Table 3.9 Summary of Mean Performance Outcomes by Project Nature— Contractor DB and DBB Projects
Addition Projects Grass Roots Projects Modernization ProjectsMetric1 DB DBB DB DBB DB DBB
COST Project Budget Factor
0.977
0.953
0.963
0.953
0.954*
0.938
Project Cost Growth 0.042 0.059 0.030 0.070 0.053 0.038 Construction Cost Growth2 0.127 0.041 0.133 0.137 0.156 0.166 SCHEDULE Project Schedule Growth
0.993
0.972
0.981
0.974
0.998
0.959
Construction Schedule Growth2 0.049 0.007 0.053 0.028 0.046 -0.004 Project Schedule Factor 0.029 0.028 0.023 0.032 0.049 0.024 Construction Phase Duration2 (weeks) 63 51 69 64 51 36 SAFETY R.I.R.
1.864
2.515
1.379
1.368
2.841*
2.344
L.W.C.I.R. 0.093 0.080 0.124 0.065 0.152* 0.053 Zero Recordables 15.4% 38.1% 30.0% 48.1% 23.5%* 45.5% Zero Lost Workdays 70.6% 90.0% 51.9% 75.0% 70.6% 90.5% CHANGES Change Cost Factor
0.053
0.111
0.065
0.127
0.065
0.140
Change Schedule Factor 0.019 0.037 0.033 0.030 0.025* 0.034 REWORK Field Rework Cost Factor
0.031
0.024*
0.023
0.043*
0.022*
0.017*
Field Rework Schedule Factor 0.015* C.T. 0.013* 0.008 C.T. 0.027* PRACTICE USE Pre-Project Planning Use
4.885
5.926
4.999
5.423
6.392
5.665
Constructability Use 4.733 4.396 4.645 4.232 4.448 3.930 Project Change Management Use 7.626 7.877 7.616 7.931 7.066 7.836 Design/Information Technology Use 2.375 1.885 2.495 2.783 1.564 2.023 Team Building Use 4.216 3.964 4.079 4.299 3.368 3.476 Zero Accident Technique Use 9.111 7.062 8.762 8.687 9.021 7.425
1 Metric definitions are provided in Appendix B. * = Statistical warning indicator. See Appendix A. 2 Phase definitions are provided in Appendix C. C.T. = Data not shown per CII confidentiality policy. Shading indicates better performance. See Appendix A.
Performance outcomes were mixed for many of the performance metrics analyzed. DBB projects tended to have better schedule performance, but this may have been due to the way contractor DBB projects were defined for this analysis, i.e., DBB projects were those with responsibility for single versus multiple functions. Among additions projects, safety performance was mixed between DB and DBB projects. DBB grass roots and modernization projects outperformed DB projects in all safety metrics. Performance outcomes for changes and rework were mixed for both DB and DBB projects, although DB projects seemed to maintain the advantage in change performance. Practice use scores were mixed between DB and DBB projects. DB addition projects tended to have the better practice use scores. DBB grass roots projects had, in general, the better scores. Scores were evenly mixed for DB and DBB modernization projects with DB projects having higher scores for pre-project planning, constructability, and zero accident techniques. DBB projects had better scores for project change management, D/IT, and team building.

36
3.5.3 Section Summary
For the most part, owner-submitted DB addition and modernization projects exhibited better
performance in cost-related metrics. DBB grass roots projects exhibited better performance in all cost-related metrics.
Contractor-submitted DB and DBB projects showed mixed cost results for all project nature categories; although the project budget factor, the preferred overall contractor cost performance metric, was slightly better for DBB projects.
Owner-submitted DB projects tended to outperform DBB projects in project schedule growth,
construction schedule growth, and startup schedule growth. DB grass roots projects performed better in essentially all schedule-related metrics.
Contractor-submitted DBB projects had better schedule performance in all project nature categories.
Among owners, safety performance was mixed by project nature category. DBB addition
projects outperformed DB additions, but DB grass roots and modernization projects largely outperformed similarly classified DBB projects.
Among contractors, safety performance was mixed for DB and DBB additions projects. DBB grass roots and modernization projects outperformed DB projects in all safety metrics.
COST: Owner-submitted DB projects had better performance in additions and modernizations. Contractor-submitted DB projects had mixed results for cost-related metrics.
SCHEDULE: Owner-submitted DB projects had better performance in all project nature categories. Contractor-submitted DB projects had worse performance in all project nature categories.
SAFETY: Owner-submitted DB projects had worse performance for additions and better performance for grass roots and modernizations. Contractor-submitted DB projects had mixed results for additions and worse performance for grass roots and modernization projects.

37
For owner-submitted projects, DB projects tended to outperform DBB projects in changes.
DB projects’ rework performance was better for grass roots and modernization projects, although this finding was based on small sample sizes.
For contractor-submitted projects, change performance was better among all project nature categories, but performance outcomes were stronger for additions and modernizations than it was for grass roots. Rework performance was mixed, with DBB additions and modernizations having had better performance and DB grass roots projects having had better performance.
For owners, DB projects tended to have higher practice use scores for all project nature
categories. DB addition projects outperformed DBB projects in all practices except constructability, and DB grass roots projects outperformed DBB projects in all but team building. DB modernization projects outperformed DBB projects in all practice use metrics.
For contractors, practice use scores were mixed. DB additions had better performance in four out of the six practices, constructability, D/IT, team building, and zero accident techniques. DB grass roots projects had worse performance in pre-project planning, project change management, D/IT, and team building. Results were evenly mixed for modernization projects.
3.6 Chapter Summary Tables 3.10a and 3.10b summarize the major findings in this chapter. In each table, the project delivery system shown is the one that produced the better metric result for the respective column. The first “Overall” row shows the delivery system that performed significantly better (p< 0.05). For all other rows, the indicated delivery system is simply the one for which better performance was observed without regard to statistical significance. Dashes (--) indicate that neither delivery system outperformed the other. Data are not shown for owner-submitted public sector projects or for owner and contractor-submitted building projects due to small sample sizes, which did not permit the publication of data for these subsets. Data on public or private sector classification were not collected for contractor-submitted projects.
CHANGES: Owner-and contractor-submitted DB projects had better performance in all project nature categories. REWORK: Owner-submitted DB projects had better performance in grass roots and modernizations. Results were mixed for contractor-submitted projects.
PRACTICE USE: Owner-submitted DB projects had better performance in all project nature categories. Contractor-submitted DB projects had better performance in additions and worse performance in grass roots. Performance was mixed in modernizations.

38
The determination of which was the better performing delivery system was based on performance in key metric values and in practice utilization. For cost, the determination was based on performance in project cost growth, construction cost growth, and startup cost growth (owners) and project budget factor, project cost growth, and construction cost growth (contractors). For schedule, the determination was based on project schedule growth, construction schedule growth, and startup schedule growth (owners) and project schedule growth, construction schedule growth, and project schedule factor (contractors). For safety, it was based on the RIR and the LWCIR (both owners and contractors). Both of the metrics included under changes and rework were used to make the determination of which was the better performing delivery system (both owners and contractors). For practice use, the better performing system was determined by which had the better scores in the majority of the practices analyzed. Table 3.10a Performance Summary for Cost, Schedule, and Safety
Cost Schedule Safety Analytic Subset Owner Contractor Owner Contractor Owner Contractor Overall 1 -- -- DB DBB -- -- Overall 2 DB -- DB DBB -- -- Private Sector 2 DB N/A DB N/A -- N/A Industrial Projects 2 DB -- DB DBB DBB -- Cost Category 2
<$15 MM $15-$50 MM >$50 MM
DBB DB --
DB
DBB DB
DB DB DB
DBB DBB DB
DBB DBB DB
DB
DBB DB
Project Nature 2
Addition Grass Roots Modernization
DB
DBB DB
--
DB DBB
DB DB DB
DBB DBB DBB
DBB DB DB
--
DBB DBB
1 Significant difference, p< 0.05 -- No difference in performance 2 Observed difference N/A Not applicable
Table 3.10b Performance Summary for Change, Rework, and Practice Use
Changes Rework Practice Use Analytic Subset Owner Contractor Owner Contractor Owner Contractor Overall 1 DB DB DB -- DB -- Overall 2 DB DB DB DB DB DB Private Sector 2 DB N/A DB N/A DB N/A Industrial Projects 2 DB DB DB -- DB DB Cost Category 2
<$15 MM $15-$50 MM >$50 MM
DB DB DB
DB DB
DBB
DB --
DB
DB DB DB
DB DB DB
DB
DBB DBB
Project Nature 2
Addition Grass Roots Modernization
DB DB DB
DB DB DB
--
DB DB
DBB DB
DBB
DB DB DB
DB
DBB --
1 Significant difference, p< 0.05 -- No difference in performance 2 Observed difference N/A Not applicable

39
Based simply on observed differences for all owner-submitted projects as well as for the breakouts for private sector and industrial projects, cost performance was better for DB projects than it was for DBB projects. For all contractor-submitted projects and for contractor-submitted industrial projects, however, there were no observed differences in cost performance between DB and DBB projects. Within cost and project nature categories, there was no clear evidence that one project delivery system outperformed the other. There was much less ambiguity when analyzing schedule performance. Whether analyzing observed or statistically significant differences, owner-submitted projects using DB consistently demonstrated better schedule performance. With nearly the same degree of consistency, contractor-submitted projects using DBB achieved better schedule performance than project using DB. Neither delivery system dominated the other in regard to safety performance, except among owner-submitted industrial projects, in which DBB projects had better safety performance. Within cost and project nature categories, it was not apparent that one delivery system outperformed the other. For changes, rework, and practice use, owner-submitted DB projects clearly had the advantage over DBB projects. Contractor-submitted DB projects usually outperformed DBB projects in these metrics, as well. As was noted in the introduction, no one project delivery system is likely to provide the best performance for all projects and for all participants. Considering the high level summarization of all projects included in this study, and breakouts for industrial or private sector projects, Tables 3.10a and 3.10b clearly reflect that, particularly for owners, DB provides advantages over DBB. With less statistical significance, and with the exception of schedule performance, one can also conclude that the use of DB provides advantages for contractors as well. The advantages for contractors are most apparent for changes, rework, and practice use. When projects are examined by cost category or project nature, the benefits of the delivery system are much less clear. This is especially true for cost, safety, and practice use.

40

41
4. Relationship Between Practice Use and Performance Outcomes
In this study, six practices were analyzed to determine the relationship between practice use and performance. The practices were: pre-project planning, constructability, project change management, design/information technology (D/IT), team building, and zero accident techniques. It was generally found that projects with higher practice use scores also tended to have better performance outcomes. Some practices were more likely than others to be associated with better performance, however. Tables 4.1 and 4.2 focus on the practices that had the greatest impact, or benefit, on selected performance metrics. The benefit that accrued from use of the practice was derived by calculating the difference between low mean use of the practice (the 4th quartile mean performance score) and highest mean use of the practice (either at the 1st or 2nd quartile) For a complete listing of all performance metrics, including mean quartile scores and benefits resulting from the use of each of the practices, see Appendix E.
4.1 Caveat: Correlation Is Not Causation Before beginning the discussion on the relationship between practice use and performance, careful note should be made of the fact that the relationships discussed represent correlations and not causation. That is to say, the relationships between practice use and performance discussed in this report do not imply that use of any single practice necessarily causes a change in the performance outcome in a statistical sense. The observed changes in performance and practice use may have a common cause not explained in this analysis, or they may be underlying measures of another factor not included. This is not to deny that there is abundant anecdotal evidence showing that practice use does indeed improve performance outcomes. In fact, it may be the case that some of the relationships observed here were causal in nature. However, it was not within the scope of this study to design an experimental effort in which data were systematically collected to eliminate confounding variables and to establish a temporal relationship between the two variables of interest. Without such experimental data it cannot be concluded that a certain level of practice use causes a change in performance.
4.2 Owner DB and DBB Projects Table 4.1 identifies the practices that provided the greatest performance benefit for DB and DBB projects. For both owner DB and DBB projects, cost performance was most influenced by the use of pre-project planning and project change management. For example, of all the practices analyzed, more intense use of pre-project planning improved construction cost growth performance the most. For owner DB projects, pre-project planning improved (lowered) construction cost growth performance by 0.151, or 15.1%. For owner DBB projects, it improved performance by 0.121, or 12.1%.

42
Schedule performance was most influenced by team building practice use on DB projects for all schedule metrics shown. For DBB projects, three practices, project change management, zero accident techniques, and D/IT were responsible for the greatest reductions in project schedule growth, construction schedule growth, and startup schedule growth, respectively. Table 4.1 Correlation of Performance Outcomes—Owner DB and DBB Projects
DB Projects DBB Projects Metric1
Practice Used Benefit3 Practice Used Benefit3
COST Project Cost Growth2
Project Change Management
0.065
Pre-Project Planning
0.059
Construction Cost Growth2 Pre-Project Planning 0.151 Pre-Project Planning 0.121 Startup Cost Growth2 C.T. C.T. Project Change Management 0.163 SCHEDULE Project Schedule Growth
Team Building
0.068
Project Change Management
0.132
Construction Schedule Growth2 Team Building 0.062 Zero Accident Techniques 0.154 Startup Schedule Growth2 Team Building 0.075 Design/Information Technology 0.045 SAFETY R.I.R
Project Change Management
1.909
Zero Accident Techniques
2.263
L.W.C.I.R. Zero Accident Techniques 0.907 Pre-Project Planning 1.626 CHANGES Change Cost Factor
Design/Information Technology
0.014
Team Building
0.039
Change Schedule Factor Zero Accident Techniques 0.047 Design/Information Technology 0.021 REWORK Field Rework Cost Factor C.T. C.T. Constructability
Zero Accident Techniques 0.021
Field Rework Schedule Factor C.T. C.T. Zero Accident Techniques 0.034 1 Metric definitions are provided in Appendix B. 3 Benefit data are provided in Appendix E. 2 Phase definitions are provided in Appendix C. C.T. = Data not shown per CII confidentiality Policy. See Appendix A. DB project safety performance was most influenced by project change management and zero accident techniques for the RIR and LWCIR, respectively. Zero accident techniques and pre-project planning, respectively, had the most influence on DBB project safety performance. The practices used had greater benefits for DBB projects than for DB projects. RIR improved by 1.909 through the use of project change management for DB projects and by 2.263 through the use of zero accident techniques for DBB projects. LWCIR improved by 0.907 through the use of zero accident techniques for DB projects and by 1.626 through the use of pre-project planning for DBB projects. Use of D/IT and zero accident techniques had the most influence on change performance for DB projects. The reason that zero accident techniques would be responsible for improved change performance is unexpected; perhaps it is due to other factors not analyzed here. Team building and D/IT had the most influence for DBB projects. Note that for cost, schedule, and safety, there was also a relationship between the consistency of type of practice used and performance. When the same practices had the most impact for both DB and DBB projects, one delivery system did not tend to significantly outperform the other. When the practices with the most impact were different for DB and DBB projects, one delivery system tended to outperform the other suggesting that it may have been the practices used in addition to the delivery system that accounted for superior performance. For example, for the

43
cost metrics shown in Table 4.1 above, the practices that had the most influence on cost performance for both DB and DBB projects were project change management and pre-project planning, which is consistent with previous CII studies assessing the value of practice use. Now referring back to Table 3.10a, mean performance outcomes were not significantly different between DB and DBB projects with respect to cost performance. For the three schedule-related metrics shown in Table 4.1, project schedule growth, construction schedule growth, and startup schedule growth, there was no consistency between the two types of delivery systems with respect to the practices that had the most influence on performance. DB projects’ schedule performance was most influenced by team building; DBB projects’ schedule performance was most influenced by project change management, zero accident techniques, and D/IT. Note that in Table 3.10a, there were significant differences in schedule-related performance; specifically, DB projects significantly outperformed DBB projects in project schedule growth and startup schedule growth. There was also some consistency between the most beneficial practices used to improve safety performance for both DB and DBB projects. As might be expected, zero accident techniques figured as one of the two most beneficial practices for each type of delivery system, and there were no significant differences between mean performance outcomes for either.
4.3 Contractor DB and DBB Projects For contractor DB projects cost performance was most influenced by the use of project change management and team building. For contractor DBB projects, project change management and zero accident techniques proved the most beneficial. For each of the three performance metrics, project budget factor, project cost growth, and construction cost growth, the benefits accrued were similar (0.051 vs. 0.063, 0.104 vs. 0.121, and 0.231 vs. 0.248, respectively). Table 4.2 Correlation of Performance Outcomes—Contractor DB and DBB Projects
DB Projects DBB Projects Metric1 Practice Used Benefit3 Practice Used Benefit3
COST Project Budget Factor
Project Change Management
0.051
Project Change Management
0.063
Project Cost Growth Team Building 0.104 Project Change Management 0.121 Construction Cost Growth2 Project Change Management 0.231 Zero Accident Techniques 0.245 SCHEDULE Project Schedule Growth
Project Change Management
0.022
Zero Accident Techniques
0.030
Construction Schedule Growth2 Project Change Management 0.037 Team Building 0.042 Project Schedule Factor Project Change Management 0.075 Team Building 0.076 SAFETY R.I.R
Team Building
1.161
Project Change Management
1.040
L.W.C.I.R. Project Change Management 0.066 Project Change Management 0.066 CHANGES Change Cost Factor
Team Building
0.055
Constructability
0.059
Change Schedule Factor Project Change Management 0.028 Design/Information Technology 0.018 REWORK Field Rework Cost Factor Project Change Management 0.017
Project Change Management 0.022
Field Rework Schedule Factor C.T. C.T. Constructability 0.002 1 Metric definitions are provided in Appendix B. 3 Benefit data are provided in Appendix E. 2 Phase definitions are provided in Appendix C. C.T. = Data not shown per CII confidentiality Policy. See Appendix A.

44
The use of project change management provided the greatest schedule performance benefit for DB projects. Zero accident techniques and team building provided the greatest benefit for DBB projects. For each schedule performance metric the benefits were also similar. With respect to safety performances, team building and project change management were the most beneficial for DB projects, and project change management was the most beneficial for DBB projects. Practice use had more of an influence on RIR than for LWCIR. Practice use improved RIR performance by 1.161 (team building) and 1.040 (project change management) for DB and DBB projects, respectively. Project change management improved LWCIR by 0.066 for both. Project change management and team building were the most beneficial practices for DB change performance, and constructability and D/IT were the most beneficial for DBB projects. The use of the practices had more influence on the change cost factor than on the change schedule factor. The relationship between consistency of the practices used and performance was seen for contractor projects, as well. For two of the three cost-related metrics shown in Table 4.2, project change management was the most beneficial practice for both DB and DBB projects, and Table 3.10a shows that there were no significant differences between the two delivery systems in cost performance. The practices that most impacted schedule performance were different for DB and DBB projects. For DB projects, project change management had the most impact on project schedule growth, construction schedule growth, and the project schedule factor, while zero accident techniques and team building were the most influential practices for DBB projects. Table 3.10a shows that there were significant differences in schedule performance with DBB projects outperforming DB projects. For DB projects’ RIR and LWCIR, team building and project change management were the most influential practices; for DBB projects it was project change management. As may be expected, Table 3.10a shows no significant differences for these two safety-related performance metrics.
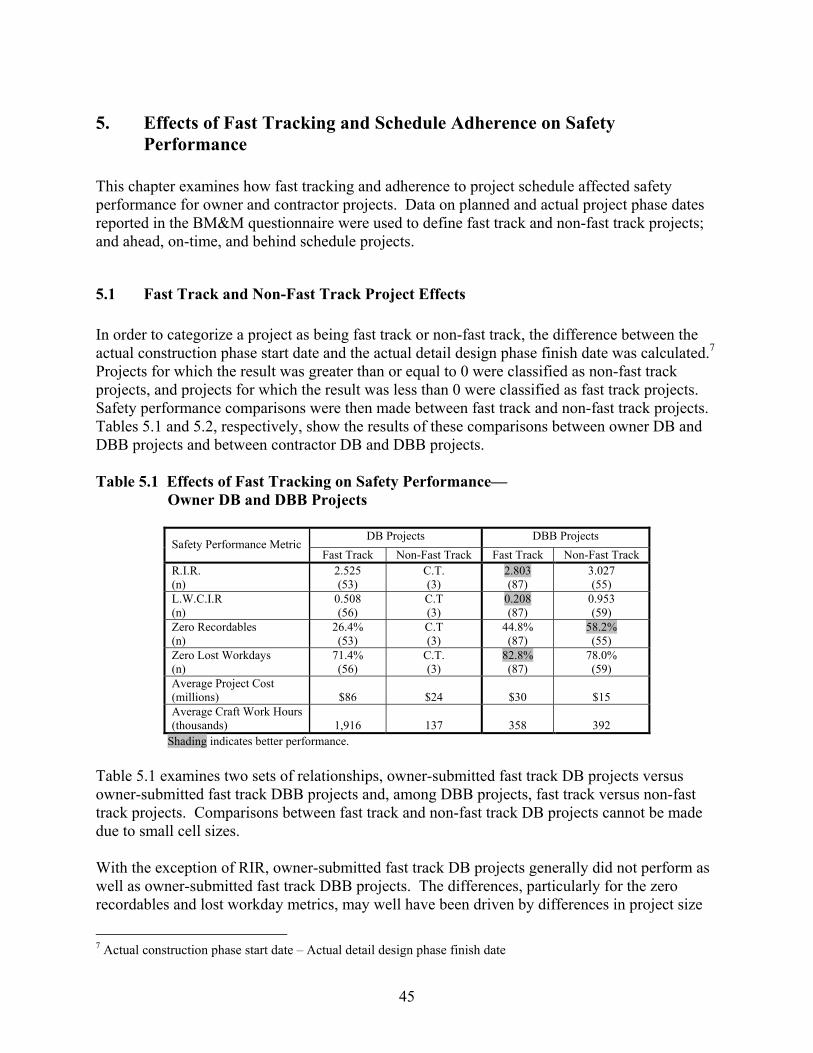
45
5. Effects of Fast Tracking and Schedule Adherence on Safety Performance
This chapter examines how fast tracking and adherence to project schedule affected safety performance for owner and contractor projects. Data on planned and actual project phase dates reported in the BM&M questionnaire were used to define fast track and non-fast track projects; and ahead, on-time, and behind schedule projects.
5.1 Fast Track and Non-Fast Track Project Effects In order to categorize a project as being fast track or non-fast track, the difference between the actual construction phase start date and the actual detail design phase finish date was calculated.7 Projects for which the result was greater than or equal to 0 were classified as non-fast track projects, and projects for which the result was less than 0 were classified as fast track projects. Safety performance comparisons were then made between fast track and non-fast track projects. Tables 5.1 and 5.2, respectively, show the results of these comparisons between owner DB and DBB projects and between contractor DB and DBB projects. Table 5.1 Effects of Fast Tracking on Safety Performance—
Owner DB and DBB Projects
DB Projects DBB Projects Safety Performance Metric
Fast Track Non-Fast Track Fast Track Non-Fast Track R.I.R. (n)
2.525 (53)
C.T. (3)
2.803 (87)
3.027 (55)
L.W.C.I.R (n)
0.508 (56)
C.T (3)
0.208 (87)
0.953 (59)
Zero Recordables (n)
26.4% (53)
C.T (3)
44.8% (87)
58.2% (55)
Zero Lost Workdays (n)
71.4% (56)
C.T. (3)
82.8% (87)
78.0% (59)
Average Project Cost (millions)
$86
$24
$30
$15
Average Craft Work Hours (thousands)
1,916
137
358
392
Shading indicates better performance. Table 5.1 examines two sets of relationships, owner-submitted fast track DB projects versus owner-submitted fast track DBB projects and, among DBB projects, fast track versus non-fast track projects. Comparisons between fast track and non-fast track DB projects cannot be made due to small cell sizes. With the exception of RIR, owner-submitted fast track DB projects generally did not perform as well as owner-submitted fast track DBB projects. The differences, particularly for the zero recordables and lost workday metrics, may well have been driven by differences in project size
7 Actual construction phase start date – Actual detail design phase finish date
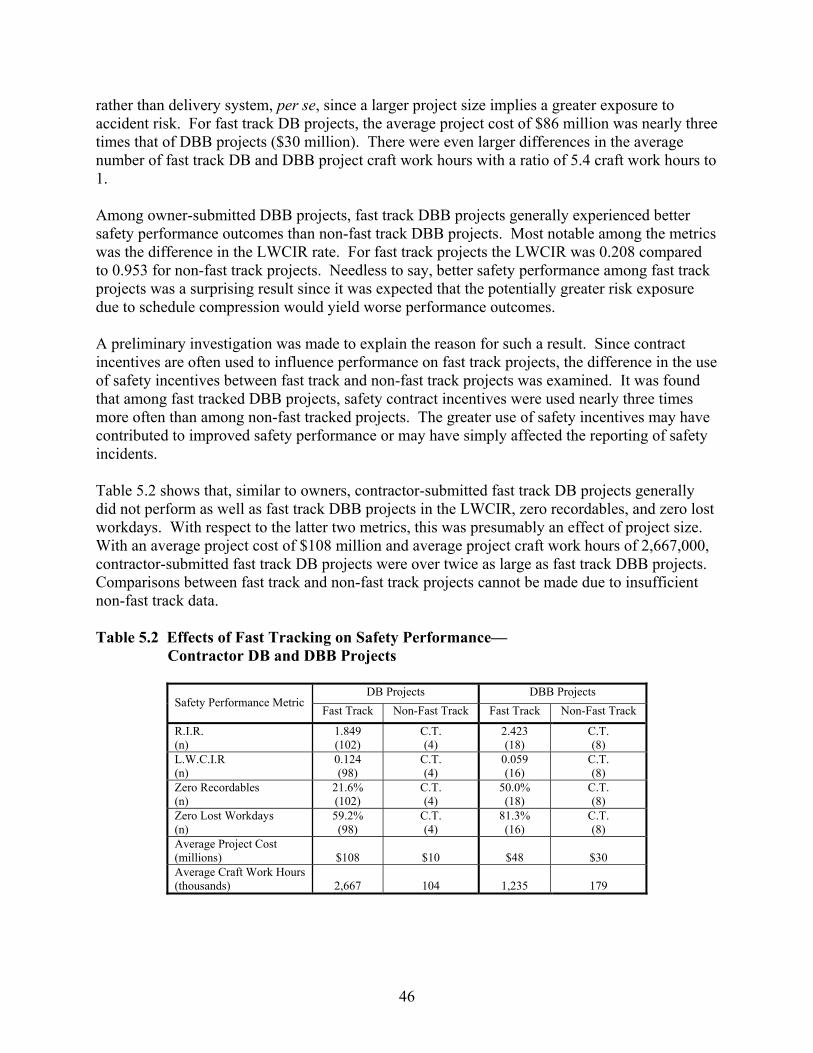
46
rather than delivery system, per se, since a larger project size implies a greater exposure to accident risk. For fast track DB projects, the average project cost of $86 million was nearly three times that of DBB projects ($30 million). There were even larger differences in the average number of fast track DB and DBB project craft work hours with a ratio of 5.4 craft work hours to 1. Among owner-submitted DBB projects, fast track DBB projects generally experienced better safety performance outcomes than non-fast track DBB projects. Most notable among the metrics was the difference in the LWCIR rate. For fast track projects the LWCIR was 0.208 compared to 0.953 for non-fast track projects. Needless to say, better safety performance among fast track projects was a surprising result since it was expected that the potentially greater risk exposure due to schedule compression would yield worse performance outcomes. A preliminary investigation was made to explain the reason for such a result. Since contract incentives are often used to influence performance on fast track projects, the difference in the use of safety incentives between fast track and non-fast track projects was examined. It was found that among fast tracked DBB projects, safety contract incentives were used nearly three times more often than among non-fast tracked projects. The greater use of safety incentives may have contributed to improved safety performance or may have simply affected the reporting of safety incidents. Table 5.2 shows that, similar to owners, contractor-submitted fast track DB projects generally did not perform as well as fast track DBB projects in the LWCIR, zero recordables, and zero lost workdays. With respect to the latter two metrics, this was presumably an effect of project size. With an average project cost of $108 million and average project craft work hours of 2,667,000, contractor-submitted fast track DB projects were over twice as large as fast track DBB projects. Comparisons between fast track and non-fast track projects cannot be made due to insufficient non-fast track data. Table 5.2 Effects of Fast Tracking on Safety Performance—
Contractor DB and DBB Projects
DB Projects DBB Projects Safety Performance Metric
Fast Track Non-Fast Track Fast Track Non-Fast Track
R.I.R. (n)
1.849 (102)
C.T. (4)
2.423 (18)
C.T. (8)
L.W.C.I.R (n)
0.124 (98)
C.T. (4)
0.059 (16)
C.T. (8)
Zero Recordables (n)
21.6% (102)
C.T. (4)
50.0% (18)
C.T. (8)
Zero Lost Workdays (n)
59.2% (98)
C.T. (4)
81.3% (16)
C.T. (8)
Average Project Cost (millions)
$108
$10
$48
$30
Average Craft Work Hours (thousands)
2,667
104
1,235
179

47
5.2 Schedule Adherence Effects Adherence to project schedule was defined by the project schedule factor, the ratio of actual project duration to planned project duration plus approved changes. (See Appendix B for the definition.) If the ratio was less than 1, the project was classified as being ahead of schedule; if it was equal to 1, the project was classified as being on time. Projects with ratios greater than 1 were classified as being behind schedule. These results are shown in Tables 5.3 and 5.4 for owner DB and DBB projects, and for contractor DB and DBB projects, respectively. Table 5.3 Effects of Schedule Adherence on Safety Performance—
Owner DB and DBB Projects
DB Projects DBB Projects Safety Performance
Ahead On Time Behind Ahead On Time Behind R.I.R. 3.498* 4.231* 1.661 1.888 4.109 3.288 L.W.C.I.R. 0.514* 1.021* 0.439 0.027 0.735 0.775 Zero Recordables 18.8%* 16.7%* 32.1% 57.9% 44.8% 43.8% Zero Lost Workdays 82.4%* 58.3%* 70.0% 94.9% 76.7% 74.7%
Average Project Cost (millions)
$78
$18
$113
$22
$26
$22
Average Craft Work Hours (thousands)
1,406
182
2,782
184
288
510
*= Statistical warning indicator. See Appendix A. Shading indicates better performance.
The results shown in Table 5.3 for DB projects are unexpected. Among DB projects, behind schedule projects had the best safety performance, and on-time projects had the worst performance. A preliminary analysis showed that safety incentives were more often used in behind schedule projects than in ahead of schedule or on-time projects, which may explain some of the difference. These results may have been affected by small cell sizes in the ahead of schedule and on-time categories, however. Among DBB projects, ahead of schedule projects had the best safety performance, as may have been expected. The results are mixed for on-time and behind schedule projects, with behind schedule projects outperforming on-time projects in the RIR. This may be partly explained by the greater use of safety incentives in behind schedule projects.

48
Table 5.4 Effects of Schedule Adherence on Safety Performance— Contractor DB and DBB Projects
DB Projects DBB Projects
Safety Performance Ahead On Time Behind Ahead On Time Behind
R.I.R. 1.334 1.525 2.049 2.198 2.339 1.698 L.W.C.I.R. 0.070 0.083 0.170 0.051 0.065 0.082 Zero Recordables 29.7% 28.6% 18.5% 36.4% 50.0% 48.4% Zero Lost Workdays 72.7% 62.5% 51.0% 87.0% 85.7% 80.0%
Average Project Cost (millions)
$95
$149
$100
$30
$21
$40
Average Craft Work Hours (thousands)
4,199
2,514
1,688
461
375
1,040
Shading indicates better performance. For contractor-submitted projects, safety performance with respect to schedule adherence among DB projects was essentially as expected: ahead of schedule projects had the best performance and behind schedule projects had the worst performance. The results are also largely as expected for DBB projects. With the exception of the RIR and zero recordables, ahead of schedule projects tended to have the best performance and behind schedule projects the worst.
49
6. Summary, Conclusions, and Recommendations DB projects were larger on the average than DBB projects. The average cost of all owner-submitted DB projects was significantly larger than that of all owner-submitted DBB projects ($80.5 million vs. $22.7 million, p=0.003). Contractor-submitted DB projects were also significantly larger on the average than contractor-submitted DBB contracts ($104.6 million vs. $24.1 million, p=0.000). Such findings have important implications for the assessment of performance between the two delivery systems.
6.1 Performance and Practice Use The use of the DB delivery system tended to yield better performance outcomes for owner-submitted projects; these projects tended to have better performance in cost, schedule, changes, rework, and practice use. The results were not as clear cut for contractor-submitted projects. Contractor-submitted DBB projects outperformed DB projects in schedule, but contractor-submitted DB projects had better performance in changes, rework, and practice use. When analyzing finer breakdowns, such as those by cost category and project nature, the results were mixed. Regarding the relationship of practice use and performance, this study confirmed the results of earlier CII studies that showed the importance of pre-project planning and project change management in improving cost performance. For both owner and contractor-submitted DB and DBB projects these two practices provided the greatest benefit in cost performance. Team building figured as an important practice for owner-submitted DB project schedule performance, and project change management was important for contractor-submitted DB projects. Furthermore, there seemed to be a relationship between practice use and performance that appeared to indicate a shared contribution of delivery system and the practices used to performance. When performance metrics were statistically different between DB and DBB projects the practices that had the most impact on DB project performance were different from the practices that had the most impact on DBB projects.
6.2 Fast Tracking and Schedule Adherence With the exception of RIR, fast track DB projects had worse safety performance than fast track DBB projects. A surprising result was that owner-submitted fast track DBB projects had better safety performance than owner-submitted non-fast track DBB projects in three of the four safety metrics analyzed. Further investigation showed that DBB fast-track projects tended to use safety contract incentives more often. The exact relationship between fast track project safety performance and safety incentives is open to question. Incentives may have had a direct impact on performance by fostering an environment in which safety awareness is heightened. The relationship may well be artifactual,

50
though, since the existence of safety incentives may have provided a disincentive to report accidents. The results for safety performance and schedule adherence were unexpected for owner-submitted DB projects because behind schedule projects had better safety performance than either on-time or ahead of schedule projects. A preliminary investigation showed that owner-submitted DB projects made greater use of safety incentives. The results for owner-submitted DBB projects were as expected, with ahead of schedule projects having better safety performance. The results for contractor-submitted DB and DBB projects were also largely as expected with ahead of schedule projects outperforming behind schedule or on-time projects.
6.3 Recommendations for Future Research This study points to the interdependence of project size, practice use, and delivery system in determining project performance. Although this study provided much insight into these relationships, how the combination of these three factors influences project performance is still open to question. Undoubtedly each contributes, but to what extent is unknown. A plausible method for addressing this would be to focus on similar comparisons holding project size, practice use, and delivery system fixed to determine the contribution that each makes to performance. This study also uncovered a surprising relationship between fast tracking, schedule adherence and safety performance. Contrary to expectations, fast tracked projects had better safety performance than non-fast tracked projects, and for owner-submitted DB projects, behind schedule projects had better safety performance than on-time or ahead of schedule projects. This study made a preliminary investigation of these results and found that safety incentives seem to have played a role. Additional analysis is warranted to better understand the relationship between safety performance and contract incentives. Lastly, this study focused on projects that used either a purely DB or a purely DBB delivery method. It would be worthwhile to study other types of delivery systems that bring team members together early in the project life cycle to determine the influence of these types of delivery systems on project performance. Cost influence curve models postulate that this early involvement is critical to good cost performance.

51
Appendix A – Statistical Notes Confidentiality When there were less than 10 projects available in a category or when less than 3 companies submitted the data, no statistical summaries are provided. This is consistent with the CII policy on confidentiality and in such cases the code “C.T.” (confidentiality test) was inserted in the tables. Statistical Warning Indicator When there are less than 20 projects included in any table cell, an asterisk (*) follows the data value. This notation indicates that the data in that table cell should be interpreted with caution due to the small number of projects represented in that cell. Removal of Statistical Outliers Prior to performing any statistical analyses, all performance outcome metrics were screened to remove statistical outliers. This step was incorporated to remove values so extreme that their inclusion would be likely to distort the statistical summaries produced. The technique used to identify statistical outliers was the same used to define outliers in most statistical texts. For all performance metrics excluding the RIR and the LWCIR, all values exceeding the 75th percentile value, +1.5 times the interquartile range, or those less than the 25th percentile value, - 1.5 times the interquartile range, were excluded. For the RIR and the LWCIR, all rates that were greater than 3 times the interquartile range were excluded. By definition, there were no outliers for the practice use metrics since all scores were scaled from 0 to 10.

52

53
Appendix B – Metric Definitions
Performance Metric Formulas and Definitions Performance Metric Category: COST
Metric: Project Cost Growth
Metric: Project Budget Factor
Metric: Phase Cost Factor
Formulas:
Actual Total Project Cost - Initial Predicted Project Cost Initial Predicted Project Cost
Formula:
Actual Total Project Cost Initial Predicted Project Cost +Approved Changes
Formula: Actual Phase Cost
Actual Total Project Cost
Metric: Phase Cost Growth
Formula:
Actual Phase Cost – Initial Predicted Phase Cost Initial Predicted Phase Cost
Definition of Terms Actual Total Project Cost:
• Industrial sector owners - Total installed cost at turnover, excluding land costs.
• Building sector owners – Total cost of design and construction to prepare the facility for occupancy.
• Contractors – Total cost of the final scope of work.
Initial Predicted Project Cost:
• Owners – Budget at the start of detail design.
• Contractors – Cost estimate used as the basis of contract award.
Actual Phase Cost:
• All costs associated with the project phase in question. • See the Project Phase Table in Appendix C for phase
definitions.
Initial Predicted Phase Cost:
• Budget at the start of detail design. • See the Project Phase Table in Appendix C for phase
definitions. Approved Changes
• Estimated cost of owner-authorized changes.

54
Performance Metric Category: SCHEDULE
Metric: Project Schedule Growth
Formula:
Actual Total Proj. Duration - Initial Predicted Proj. Duration Initial Predicted Proj. Duration
Metric: Project Schedule Factor
Formula:
Actual Total Project Duration Initial Predicted Project Duration + Approved Changes
Metric: Phase Duration Factor
Formula:
Actual Phase Duration Actual Overall Project Duration
Metric: Total Project Duration
Actual Total Project Duration (weeks)
Metric: Construction Phase Duration
Actual Construction Phase Duration (weeks)
Definition of Terms Actual Total Project Duration:
• Owners – Duration from beginning of detail design to turnover to user.
• Contractors - Total duration for the final scope of work from mobilization to completion.
Actual Overall Project Duration:
• Unlike Actual Total Duration, Actual Overall Duration also includes time consumed for the Pre-Project Planning Phase.
Actual Phase Duration:
• Actual total duration of the project phase in question. See the Project Phase Table in Appendix C for phase definitions.
Initial Predicted Project Duration:
• Owners - Duration prediction upon which the authorization to proceed with detail design is based.
• Contractors - The contractor's duration estimate at the time of contract award.
Approved Changes • Estimated duration of owner-authorized changes.

55
Performance Metric Category: SAFETY Metric: Recordable Incident Rate (RIR)
Formula:
Total Number of Recordable Cases x 200,000 Total Site Work-Hours
Metric: Lost Workday Case Incident Rate (LWCIR)
Formula:
Total Number of Lost Workday Cases x 200,000 Total Site Work-Hours
Definition of Terms • Recordable Cases: All work-related deaths and
illnesses, and those work-related injuries that result in: loss of consciousness, restriction of work or motion, transfer to another job, or require medical treatment beyond first aid.
• Lost Workday Cases: Cases that involve days away from
work or days of restricted work activity, or both.
Performance Metric Category: CHANGES Metric: Change Cost Factor
Formula: Total Cost of Changes
Actual Total Project Cost
Definition of Terms Total Cost of Changes:
• Total cost impact of project scope and project development changes. Changes in project scope are changes to the original limits of work contractually negotiated by each party, e.g., changes in the purpose for which an edifice is constructed or size of the project. Changes in project development are changes required to execute the original scope of work, e.g., unforeseen site conditions or changes required due to errors or omissions.
Actual Total Project Cost:
• Industrial Sector Owners – Total installed cost at turnover, excluding land costs.
• Building Sector Owners – Total cost of design and construction to prepare the facility for occupancy.
• Contractors – Total cost of the final scope of work.

56
Performance Metric Category: REWORK Metric: Total Field Rework Factor
Formula:
Total Direct Cost of Field Rework Actual Construction Phase Cost
Definition of Terms • Total Direct Cost of Field Rework: Total direct cost
of field rework regardless of initiating cause.
• Actual Construction Phase Cost: All costs associated with
the construction phase. See the Project Phase Table in Appendix C for construction phase definition.
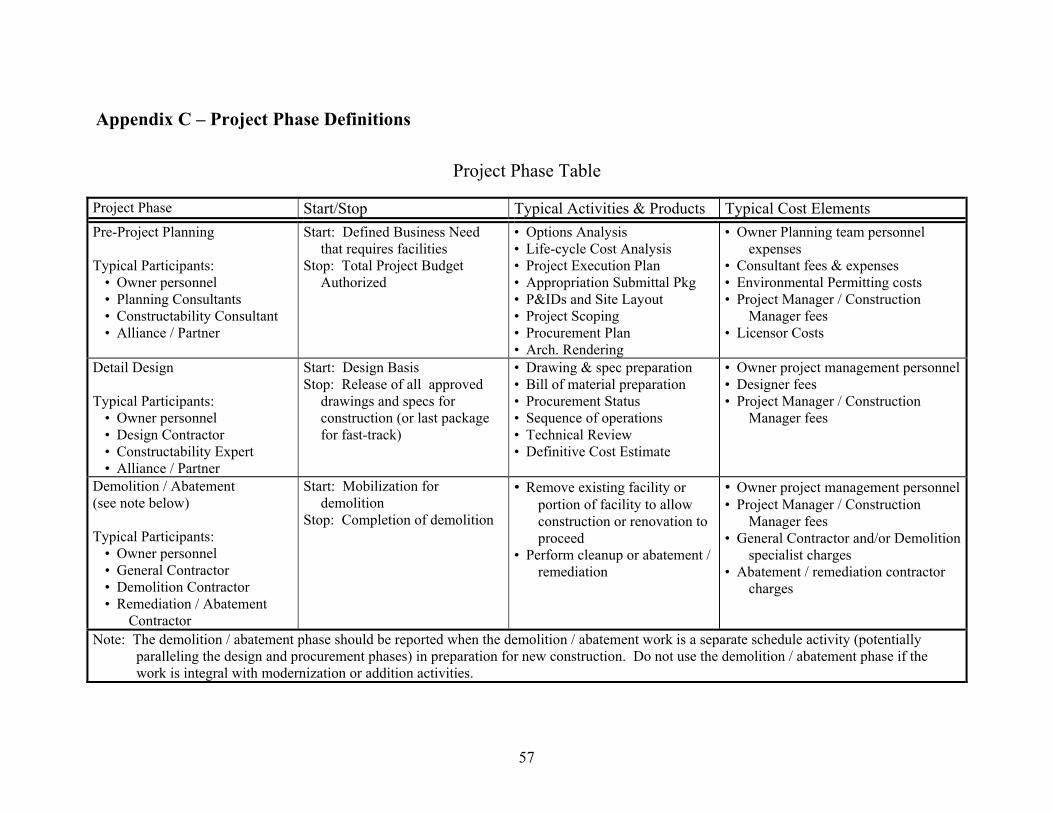
57
Appendix C – Project Phase Definitions
Project Phase Table
Project Phase Start/Stop Typical Activities & Products Typical Cost Elements Pre-Project Planning Typical Participants:
• Owner personnel • Planning Consultants • Constructability Consultant • Alliance / Partner
Start: Defined Business Need that requires facilities
Stop: Total Project Budget Authorized
• Options Analysis • Life-cycle Cost Analysis • Project Execution Plan • Appropriation Submittal Pkg • P&IDs and Site Layout • Project Scoping • Procurement Plan • Arch. Rendering
• Owner Planning team personnel expenses
• Consultant fees & expenses • Environmental Permitting costs • Project Manager / Construction
Manager fees • Licensor Costs
Detail Design Typical Participants:
• Owner personnel • Design Contractor • Constructability Expert • Alliance / Partner
Start: Design Basis Stop: Release of all approved
drawings and specs for construction (or last package for fast-track)
• Drawing & spec preparation • Bill of material preparation • Procurement Status • Sequence of operations • Technical Review • Definitive Cost Estimate
• Owner project management personnel• Designer fees • Project Manager / Construction
Manager fees
Demolition / Abatement (see note below) Typical Participants:
• Owner personnel • General Contractor • Demolition Contractor • Remediation / Abatement
Contractor
Start: Mobilization for demolition
Stop: Completion of demolition
• Remove existing facility or portion of facility to allow construction or renovation to proceed
• Perform cleanup or abatement / remediation
• Owner project management personnel• Project Manager / Construction
Manager fees • General Contractor and/or Demolition
specialist charges • Abatement / remediation contractor
charges
Note: The demolition / abatement phase should be reported when the demolition / abatement work is a separate schedule activity (potentially paralleling the design and procurement phases) in preparation for new construction. Do not use the demolition / abatement phase if the work is integral with modernization or addition activities.
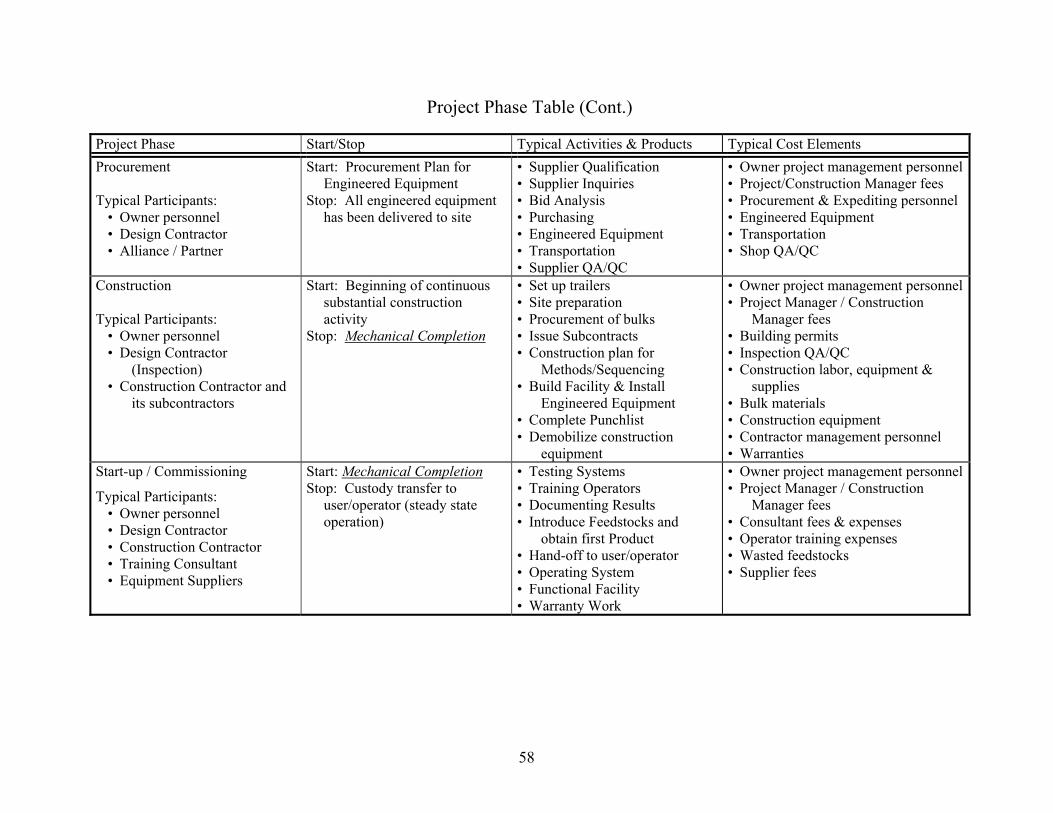
58
Project Phase Table (Cont.)
Project Phase Start/Stop Typical Activities & Products Typical Cost Elements Procurement Typical Participants:
• Owner personnel • Design Contractor • Alliance / Partner
Start: Procurement Plan for Engineered Equipment
Stop: All engineered equipment has been delivered to site
• Supplier Qualification • Supplier Inquiries • Bid Analysis • Purchasing • Engineered Equipment • Transportation • Supplier QA/QC
• Owner project management personnel• Project/Construction Manager fees • Procurement & Expediting personnel • Engineered Equipment • Transportation • Shop QA/QC
Construction Typical Participants:
• Owner personnel • Design Contractor
(Inspection) • Construction Contractor and
its subcontractors
Start: Beginning of continuous substantial construction activity
Stop: Mechanical Completion
• Set up trailers • Site preparation • Procurement of bulks • Issue Subcontracts • Construction plan for
Methods/Sequencing • Build Facility & Install
Engineered Equipment • Complete Punchlist • Demobilize construction
equipment
• Owner project management personnel• Project Manager / Construction
Manager fees • Building permits • Inspection QA/QC • Construction labor, equipment &
supplies • Bulk materials • Construction equipment • Contractor management personnel • Warranties
Start-up / Commissioning Typical Participants:
• Owner personnel • Design Contractor • Construction Contractor • Training Consultant • Equipment Suppliers
Start: Mechanical Completion Stop: Custody transfer to
user/operator (steady state operation)
• Testing Systems • Training Operators • Documenting Results • Introduce Feedstocks and
obtain first Product • Hand-off to user/operator • Operating System • Functional Facility • Warranty Work
• Owner project management personnel• Project Manager / Construction
Manager fees • Consultant fees & expenses • Operator training expenses • Wasted feedstocks • Supplier fees

59
Appendix D – Sample Sizes for Performance and Practice Use Metrics Table D.1 Sample Sizes by Project Delivery System—All Owners
1 Metric definitions are provided in Appendix B. 2 Phase definitions are provided in Appendix C.
Metric1 DB Projects DBB Projects
COST Project Cost Growth 77 216 Construction Cost Growth2 73 207 Startup Cost Growth2 37 78 Construction Phase Cost Factor2 75 227 Startup Phase Cost Factor2 43 100 SCHEDULE Project Schedule Growth 68 204 Construction Schedule Growth2 72 189 Startup Schedule Growth2 51 109 Construction Phase Duration Factor2 80 232 Startup Phase Duration Factor2 70 158 Actual Overall Project Duration (weeks) 78 223 Actual Total Project Duration (weeks) 78 222 Construction Phase Duration2 (weeks) 78 226 Startup Phase Duration2 (weeks) 63 146 SAFETY R.I.R. 58 154 L.W.C.I.R. 62 158 Zero Recordables 58 154 Zero Lost Workdays 62 158 CHANGES Change Cost Factor 56 188 Change Schedule Factor 45 129 REWORK Field Rework Cost Factor 34 110 Field Rework Schedule Factor 22 77 PRACTICE USE Pre-Project Planning Use 81 242 Constructability Use 80 230 Project Change Management Use 79 242 Design/Information Technology Use 68 213 Team Building Use 77 225 Zero Accident Technique Use 82 236
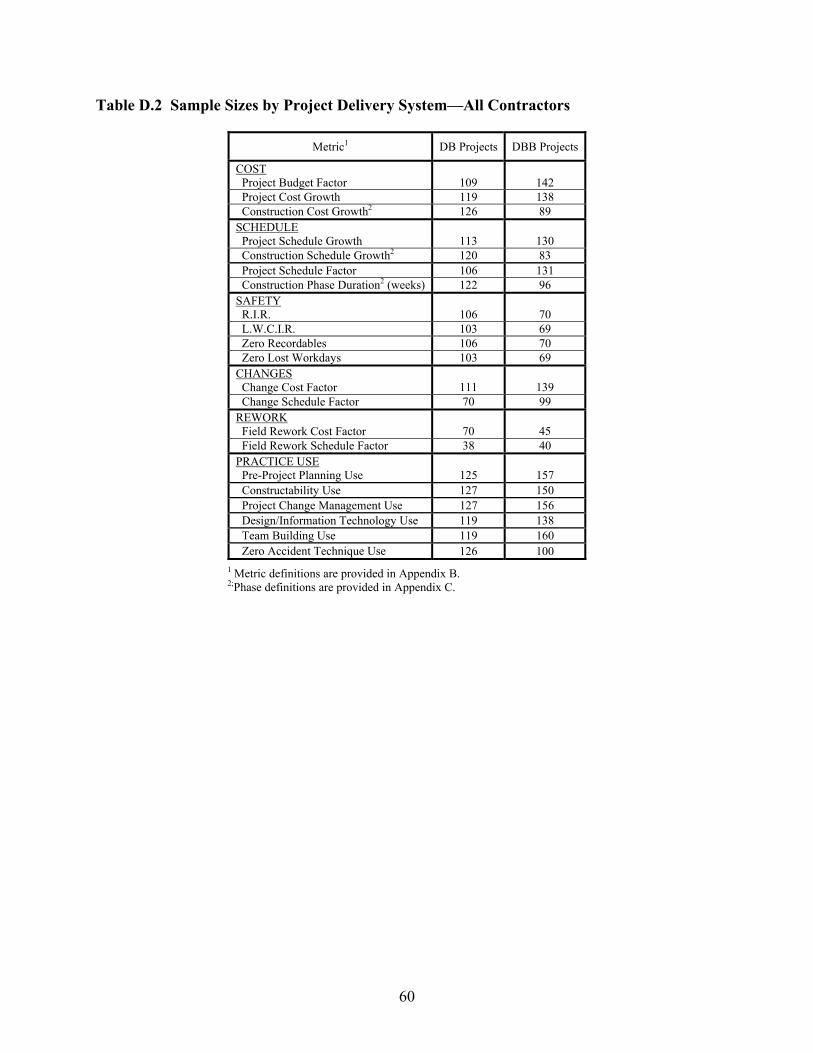
60
Table D.2 Sample Sizes by Project Delivery System—All Contractors
1 Metric definitions are provided in Appendix B. 2;Phase definitions are provided in Appendix C.
Metric1 DB Projects DBB Projects
COST Project Budget Factor 109 142 Project Cost Growth 119 138 Construction Cost Growth2 126 89 SCHEDULE Project Schedule Growth 113 130 Construction Schedule Growth2 120 83 Project Schedule Factor 106 131 Construction Phase Duration2 (weeks) 122 96 SAFETY R.I.R. 106 70 L.W.C.I.R. 103 69 Zero Recordables 106 70 Zero Lost Workdays 103 69 CHANGES Change Cost Factor 111 139 Change Schedule Factor 70 99 REWORK Field Rework Cost Factor 70 45 Field Rework Schedule Factor 38 40 PRACTICE USE Pre-Project Planning Use 125 157 Constructability Use 127 150 Project Change Management Use 127 156 Design/Information Technology Use 119 138 Team Building Use 119 160 Zero Accident Technique Use 126 100

61
Table D.3 Sample Sizes By Sector—Owner DB and DBB Projects
Public Projects Private Projects Metric1
DB DBB DB DBB COST Project Cost Growth 8 57 69 159 Construction Cost Growth2 7 59 66 148 Startup Cost Growth2 2 12 35 66 Construction Phase Cost Factor2 7 64 68 163 Startup Phase Cost Factor2 3 14 40 86 SCHEDULE Project Schedule Growth 4 57 64 147 Construction Schedule Growth2 6 53 66 136 Startup Schedule Growth2 3 17 48 92 Construction Phase Duration Factor2 9 71 71 161 Startup Phase Duration Factor2 7 31 63 127 Actual Overall Project Duration (weeks) 8 64 70 159 Actual Total Project Duration (weeks) 8 62 70 160 Construction Phase Duration2 (weeks) 7 67 71 159 Startup Phase Duration2 (weeks) 5 25 58 121 SAFETY R.I.R. 5 36 53 118 L.W.C.I.R. 6 39 56 119 Zero Recordables 5 36 53 118 Zero Lost Workdays 6 39 56 119 CHANGES Change Cost Factor 5 58 51 130 Change Schedule Factor 6 45 39 84 REWORK Field Rework Cost Factor 3 20 31 90 Field Rework Schedule Factor 2 26 20 51 PRACTICE USE Pre-Project Planning Use 8 71 73 171 Constructability Use 9 67 71 163 Project Change Management Use 9 72 70 170 Design/Information Technology Use 7 61 61 152 Team Building Use 9 66 68 159 Zero Accident Technique Use 9 66 73 170
1 Metric definitions are provided in Appendix B. 2 Phase definitions are provided in Appendix C.

62
Table D.4 Sample Sizes by Industry Group—Owner DB and DBB Projects
Building Projects Industrial Projects Metric1
DB DBB DB DBB COST Project Cost Growth 9 72 68 144 Construction Cost Growth2 7 70 66 137 Startup Cost Growth2 1 9 36 69 Construction Phase Cost Factor2 7 76 68 151 Startup Phase Cost Factor2 1 12 42 88 SCHEDULE Project Schedule Growth 7 67 61 137 Construction Schedule Growth2 7 60 65 129 Startup Schedule Growth2 3 20 48 89 Construction Phase Duration Factor2 10 83 70 149 Startup Phase Duration Factor2 6 30 64 128 Actual Overall Project Duration (weeks) 10 76 68 147 Actual Total Project Duration (weeks) 10 75 68 147 Construction Phase Duration2 (weeks) 9 78 69 148 Startup Phase Duration 2(weeks) 5 25 58 121 SAFETY R.I.R. 5 36 53 118 L.W.C.I.R. 5 39 57 119 Zero Recordables 5 36 53 118 Zero Lost Workdays 5 39 57 119 CHANGES Change Cost Factor 7 68 49 120 Change Schedule Factor 7 53 38 76 REWORK Field Rework Cost Factor 3 28 31 82 Field Rework Schedule Factor 2 30 20 47 PRACTICE USE Pre-Project Planning Use 9 84 72 158 Constructability Use 9 78 71 152 Project Change Management Use 9 85 70 157 Design/Information Technology Use 8 71 60 142 Team Building Use 9 76 68 149 Zero Accident Technique Use 10 79 72 157
1 Metric definitions are provided in Appendix B. 2 Phase definitions are provided in Appendix C.

63
Table D.5 Sample Sizes by Industry Group—Contractor DB and DBB Projects
1 Metric definitions are provided in Appendix B. 2 Phase definitions are provided in Appendix C.
Building Projects Industrial Projects Metric1
DB DBB DB DBB COST Project Budget Factor 4 12 105 130 Project Cost Growth 5 12 114 126 Construction Cost Growth2 5 13 121 76 SCHEDULE Project Schedule Growth 3 12 110 118 Construction Schedule Growth2 4 11 116 72 Project Schedule Factor 4 12 102 119 Construction Phase Duration2 (weeks) 4 13 118 83 SAFETY R.I.R. 2 9 104 61 L.W.C.I.R. 4 11 99 58 Zero Recordables 2 9 104 61 Zero Lost Workdays 4 11 98 58 CHANGES Change Cost Factor 4 12 107 127 Change Schedule Factor 4 9 66 90 REWORK Field Rework Cost Factor 2 7 68 38 Field Rework Schedule Factor 2 5 36 35 PRACTICE USE Pre-Project Planning Use 5 13 120 144 Constructability Use 5 12 122 138 Project Change Management Use 5 14 122 142 Design/Information Technology Use 5 12 114 126 Team Building Use 5 13 114 147 Zero Accident Technique Use 5 13 121 87
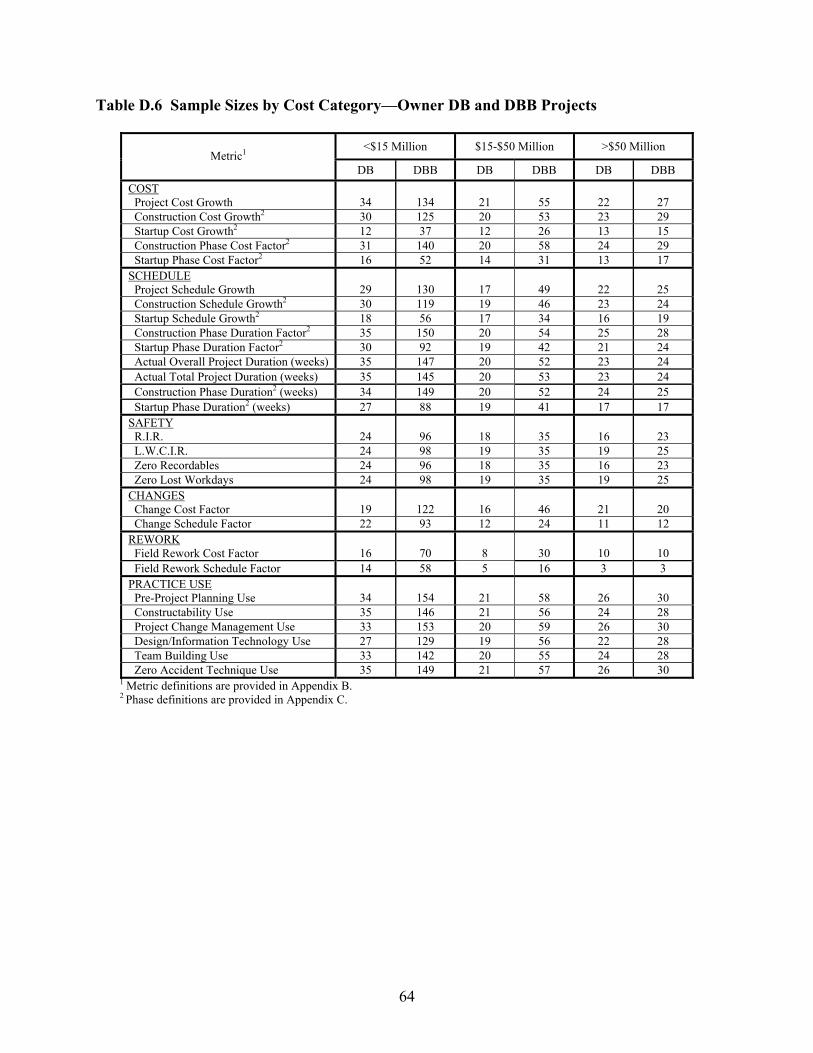
64
Table D.6 Sample Sizes by Cost Category—Owner DB and DBB Projects
<$15 Million $15-$50 Million >$50 Million Metric1
DB DBB DB DBB DB DBB COST Project Cost Growth 34 134 21 55 22 27 Construction Cost Growth2 30 125 20 53 23 29 Startup Cost Growth2 12 37 12 26 13 15 Construction Phase Cost Factor2 31 140 20 58 24 29 Startup Phase Cost Factor2 16 52 14 31 13 17 SCHEDULE Project Schedule Growth 29 130 17 49 22 25 Construction Schedule Growth2 30 119 19 46 23 24 Startup Schedule Growth2 18 56 17 34 16 19 Construction Phase Duration Factor2 35 150 20 54 25 28 Startup Phase Duration Factor2 30 92 19 42 21 24 Actual Overall Project Duration (weeks) 35 147 20 52 23 24 Actual Total Project Duration (weeks) 35 145 20 53 23 24 Construction Phase Duration2 (weeks) 34 149 20 52 24 25 Startup Phase Duration2 (weeks) 27 88 19 41 17 17 SAFETY R.I.R. 24 96 18 35 16 23 L.W.C.I.R. 24 98 19 35 19 25 Zero Recordables 24 96 18 35 16 23 Zero Lost Workdays 24 98 19 35 19 25 CHANGES Change Cost Factor 19 122 16 46 21 20 Change Schedule Factor 22 93 12 24 11 12 REWORK Field Rework Cost Factor 16 70 8 30 10 10 Field Rework Schedule Factor 14 58 5 16 3 3 PRACTICE USE Pre-Project Planning Use 34 154 21 58 26 30 Constructability Use 35 146 21 56 24 28 Project Change Management Use 33 153 20 59 26 30 Design/Information Technology Use 27 129 19 56 22 28 Team Building Use 33 142 20 55 24 28 Zero Accident Technique Use 35 149 21 57 26 30
1 Metric definitions are provided in Appendix B. 2 Phase definitions are provided in Appendix C.

65
Table D.7 Sample Sizes By Cost Category—Contractor DB and DBB Projects
1 Metric definitions are provided in Appendix B. 2 Phase definitions are provided in Appendix C.
<$15 Million $15-$50 Million >$50 Million Metric1 DB DBB DB DBB DB DBB
COST Project Budget Factor 27 93 34 36 48 13 Project Cost Growth 29 86 35 38 55 14 Construction Cost Growth2 31 49 38 27 57 13 SCHEDULE Project Schedule Growth 27 81 36 36 50 13 Construction Schedule Growth2 28 45 36 24 56 14 Project Schedule Factor 27 85 33 34 46 12 Construction Phase Duration2 (weeks) 30 55 37 28 55 13 SAFETY R.I.R. 19 38 34 22 53 10 L.W.C.I.R. 19 39 33 20 51 10 Zero Recordables 19 38 34 22 53 10 Zero Lost Workdays 19 39 33 20 51 10 CHANGES Change Cost Factor 27 88 30 39 54 12 Change Schedule Factor 21 68 20 22 29 9 REWORK Field Rework Cost Factor 13 22 23 13 34 10 Field Rework Schedule Factor 7 23 13 8 18 9 PRACTICE USE Pre-Project Planning Use 31 105 37 37 57 15 Constructability Use 31 101 38 36 58 13 Project Change Management Use 31 105 37 36 59 15 Design/Information Technology Use 30 94 35 30 54 14 Team Building Use 29 106 34 39 56 15 Zero Accident Technique Use 29 65 38 21 59 14

66
Table D.8 Sample Sizes by Project Nature—Owner DB and DBB Projects
Addition Projects Grass Roots Projects
Modernization Projects Metric1
DB DBB DB DBB DB DBB COST Project Cost Growth 20 57 30 54 27 105 Construction Cost Growth2 18 52 30 56 25 99 Startup Cost Growth2 9 21 17 15 11 42 Construction Phase Cost Factor2 19 59 31 57 25 111 Startup Phase Cost Factor2 11 31 19 17 13 52 SCHEDULE Project Schedule Growth 18 51 27 52 23 101 Construction Schedule Growth2 18 45 30 50 24 94 Startup Schedule Growth2 16 30 21 16 14 63 Construction Phase Duration Factor2 21 57 32 58 27 117 Startup Phase Duration Factor2 20 41 27 24 23 93 Actual Overall Project Duration (weeks) 20 57 32 53 26 113 Actual Total Project Duration (weeks) 20 57 32 53 26 112 Construction Phase Duration2 (weeks) 20 56 33 54 25 116 Startup Phase Duration2 (weeks) 17 41 25 20 21 85 SAFETY R.I.R. 19 38 23 30 16 86 L.W.C.I.R. 21 38 23 31 18 89 Zero Recordables 19 38 23 30 16 86 Zero Lost Workdays 21 38 23 31 18 89 CHANGES Change Cost Factor 17 48 24 49 15 91 Change Schedule Factor 8 28 20 30 17 71 REWORK Field Rework Cost Factor 11 29 11 26 12 55 Field Rework Schedule Factor 5 21 6 16 11 40 PRACTICE USE Pre-Project Planning Use 22 62 33 58 26 122 Constructability Use 22 58 32 56 26 116 Project Change Management Use 22 60 31 60 26 122 Design/Information Technology Use 21 53 27 56 20 104 Team Building Use 20 57 31 55 26 113 Zero Accident Technique Use 22 60 33 55 27 121
1 Metric definitions are provided in Appendix B. 2 Phase definitions are provided in Appendix C.

67
Table D.9 Sample Sizes by Project Nature–Contractor DB and DBB Projects
1 Metric definitions are provided in Appendix B. 2 Phase definitions are provided in Appendix C.
Addition Projects Grass Roots Projects
Modernization Projects Metric1
DB DBB DB DBB DB DBB COST Project Budget Factor 37 56 53 43 19 43 Project Cost Growth 41 55 55 42 23 41 Construction Cost Growth2 42 28 60 30 24 31 SCHEDULE Project Schedule Growth 39 51 54 40 20 39 Construction Schedule Growth2 39 26 60 32 21 25 Project Schedule Factor 33 44 52 40 21 47 Construction Phase Duration2 (weeks) 42 30 58 33 22 33 SAFETY R.I.R. 39 21 50 27 17 22 L.W.C.I.R. 34 20 52 28 17 21 Zero Recordables 39 21 50 27 17 22 Zero Lost Workdays 34 20 52 28 17 21 CHANGES Change Cost Factor 36 50 55 44 20 45 Change Schedule Factor 20 32 37 35 13 32 REWORK Field Rework Cost Factor 24 10 33 19 13 16 Field Rework Schedule Factor 12 3 18 23 8 14 PRACTICE USE Pre-Project Planning Use 42 60 60 43 23 54 Constructability Use 41 58 62 42 24 50 Project Change Management Use 42 61 61 42 24 53 Design/Information Technology Use 39 60 57 36 23 42 Team Building Use 40 61 58 46 21 53 Zero Accident Technique Use 41 38 62 31 23 31

68

69
Appendix E – Correlation Between Practice Use and Performance Outcomes Table E.1a Correlation of Pre-Project Planning Use with Performance Outcomes—
Owner DB and DBB Projects
1 Metric definitions are provided in Appendix B. 2 Phase definitions are provided in Appendix C. * = Statistical warning indicator. See Appendix A. C.T. = Data not shown per CII Confidentiality Policy. See Appendix A. Shading indicates worst and best performance within a performance category. Bold indicates performance penalty for learning curve effect.
DB Projects Low use ←→ High use
DBB Projects Low use ←→ High use
Investment stage Benefit stage Investment stage Benefit stage Metric1
4th 3rd 2nd 1st 4th 3rd 2nd 1st COST Project Cost Growth
-0.043*
-0.041*
-0.027
-0.063
-0.004
-0.031
-0.022
-0.063
Construction Cost Growth2 0.038* -0.005* -0.011* -0.113* 0.057 -0.029 0.009 -0.064 Startup Cost Growth2 C.T. C.T. -0.164 C.T. C.T. 0.032 -0.195 -0.106 Construction Phase Cost Factor2 0.559* 0.572* 0.502 0.475* 0.819 0.615 0.528 0.542 Startup Phase Cost Factor2 C.T. 0.023* 0.049* 0.019* 0.047* 0.058 0.030 0.048 SCHEDULE Project Schedule Growth
0.018*
0.021*
0.001*
0.009*
0.125
0.160
0.058
0.053
Construction Schedule Growth2 0.026* 0.066* 0.103* 0.048 0.157 0.079 0.052 0.034 Startup Schedule Growth2 -0.191* -0.192* -0.103* -0.123* -0.003* 0.058 0.010 0.006 Const. Phase Duration Factor2 0.508 0.515* 0.541* 0.523 0.516 0.460 0.369 0.433 Startup Phase Duration Factor2 0.070 0.118 0.082 0.079 0.135 0.112 0.089 0.104 Actual Overall Project Duration 136 129* 99* 120 124 149 112 117 Actual Total Project Duration 99 88* 71* 92 104 121 76 84 Construction Phase Duration2 64 66* 54* 55 68 70 39 47 Startup Phase Duration2 5.67* 6.65* 4.51* 6.00 12.98* 12.21 6.23 9.13 SAFETY R.I.R.
3.114*
C.T.
2.782*
2.780*
4.291
2.231
2.952
3.022
L.W.C.I.R. 1.074* 0.262* 0.523* 0.450* 1.802 0.362 0.271 0.176 Zero Recordables 25.0%* C.T. 35.3%* 17.6%* 35.7% 58.5% 56.1% 41.9% Zero Lost Workdays 56.3%* 70.0%* 83.3%* 70.6%* 60.7% 72.7% 92.7% 86.4% CHANGES Change Cost Factor
0.025*
0.026*
0.029*
0.025*
0.078
0.062
0.055
0.048
Change Schedule Factor 0.017* 0.005* 0.022* 0.024* 0.044 0.042 0.029 0.040 REWORK Field Rework Cost Factor
C.T.
C.T.
C.T.
0.018*
0.038*
0.064
0.057
0.043
Field Rework Schedule Factor C.T. C.T. C.T. C.T. 0.012 0.028* 0.000 0.007*

70
Table E.1b Maximum Potential Improvement in Performance through Pre-Project Planning—Owner DB and DBB Projects
1 Metric definitions are provided in Appendix B. 2 Phase definitions are provided in Appendix C. † Change in performance from 4th quartile to greatest benefit. ‡ Change in performance from the average of the 4th and 3rd quartiles to greatest benefit.
DB Projects DBB Projects
Metric1 Low use to greatest benefit†
Average investment stage to greatest benefit‡
Low use to greatest benefit†
Average investment stage to greatest benefit‡
COST Project Cost Growth
0.020
0.021
0.059
0.046
Construction Cost Growth2 0.151 0.130 0.121 0.078 Startup Cost Growth2 - - - - Construction Phase Cost Factor2 0.084 0.091 0.291 0.189 Startup Phase Cost Factor2 - - 0.017 0.023 SCHEDULE Project Schedule Growth
0.017
0.019
0.072
0.090
Construction Schedule Growth2 - - 0.123 0.084 Startup Schedule Growth2 - - - - Const. Phase Duration Factor2 - - 0.147 0.119 Startup Phase Duration Factor2 - - 0.046 0.035 Actual Overall Project Duration 37 33.5 12 24.5 Actual Total Project Duration 28 22.5 28 36.5 Construction Phase Duration2 10 11 29 30 Startup Phase Duration2 1.16 1.65 6.75 6.37 SAFETY R.I.R.
0.334
0.334
1.339
0.309
L.W.C.I.R. 0.624 0.218 1.626 0.906 Zero Recordables - - 20.4% 9% Zero Lost Workdays 27% 20.2% 32% 26% CHANGES Change Cost Factor
-
-
0.030
0.022
Change Schedule Factor - - 0.015 0.014 REWORK Field Rework Cost Factor
-
-
-
-
Field Rework Schedule Factor - - 0.012 0.020

71
Table E.2a Correlation of Constructability Use with Performance Outcomes— Owner DB and DBB Projects
1 Metric definitions are provided in Appendix B. 2 Phase definitions are provided in Appendix C. * = Statistical warning indicator. See Appendix A. C.T. = Data not shown per CII Confidentiality Policy. See Appendix A. Shading indicates worst and best performance within a performance category. Bold indicates performance penalty for learning curve effect.
DB Projects Low use ←→ High use
DBB Projects Low use ←→ High use
Investment stage Benefit stage Investment stage Benefit stage Metric1
4th 3rd 2nd 1st 4th 3rd 2nd 1st COST Project Cost Growth
-0.018*
-0.009*
-0.063
-0.059
-0.002*
-0.027*
-0.067
-0.052
Construction Cost Growth2 -0.055* -0.026* -0.023* 0.002* 0.022* 0.070* -0.107 -0.029 Startup Cost Growth2 C.T. C.T. C.T. -0.038* C.T. C.T. -0.104 -0.083 Construction Phase Cost Factor2 0.595* 0.530* 0.456* 0.543* 0.535* 0.564* 0.476 0.518 Startup Phase Cost Factor2 0.054* C.T. 0.022* 0.027* C.T. C.T. 0.022 0.023 SCHEDULE Project Schedule Growth
0.016
0.037
-0.002
-0.002
0.007*
0.080*
0.012
-0.023
Construction Schedule Growth2 0.064* 0.077* 0.058* 0.079* 0.037* 0.126* 0.085 0.048 Startup Schedule Growth2 -0.095* -0.246* -0.148* -0.134* -0.208* C.T. -0.178* -0.149* Const. Phase Duration Factor2 0.499* 0.481* 0.554 0.545 0.543* 0.536* 0.509 0.497 Startup Phase Duration Factor2 0.106* 0.069* 0.121* 0.050* 0.141* 0.039* 0.092 0.073 Actual Overall Project Duration 136* 121* 126 98 126* 124* 112 135 Actual Total Project Duration 96* 91* 90 74 94* 87* 82 94 Construction Phase Duration2 64* 57* 61* 53 68* 66* 56 58 Startup Phase Duration2 5.15* 6.97* 5.11* 5.44* 6.49* 3.40* 6.52* 5.77 SAFETY R.I.R.
3.078*
4.029*
2.420*
1.493*
4.297*
C.T.
2.707*
2.388
L.W.C.I.R. 1.091* 0.659* 0.486* 0.256* 0.449* C.T. 0.441* 0.770 Zero Recordables 25.0%* 7.1%* 36.8%* 30.8%* 25.0%* C.T. 31.3%* 22.7% Zero Lost Workdays 61.5%* 66.7%* 73.7%* 78.6%* 64.3%* C.T. 82.4%* 68.2% CHANGES Change Cost Factor
0.018*
0.026*
0.022*
0.034*
0.031*
C.T.
0.024*
0.024*
Change Schedule Factor 0.029* 0.021* 0.016* 0.013* 0.027* C.T. 0.011* 0.025* REWORK Field Rework Cost Factor
C.T.
C.T.
C.T.
0.022*
C.T.
C.T.
0.031*
0.017*
Field Rework Schedule Factor C.T. C.T. C.T. C.T. C.T. C.T. C.T. C.T.

72
Table E.2b Maximum Potential Improvement in Performance through Constructability Use—Owner DB and DBB Projects
1 Metric definitions are provided in Appendix B. 2 Phase definitions are provided in Appendix C. † Change in performance from 4th quartile to greatest benefit. ‡ Change in performance from the average of the 4th and 3rd quartiles to greatest benefit.
DB Projects DBB Projects
Metric1 Low use to greatest benefit†
Average investment stage
to greatest benefit‡
Low use to greatest benefit†
Average investment stage
to greatest benefit‡
COST Project Cost Growth
0.045
0.050
-
-
Construction Cost Growth2 - - 0.032 0.014 Startup Cost Growth2 - - 0.095 0.094 Construction Phase Cost Factor2 0.139 0.107 0.104 0.070 Startup Phase Cost Factor2 0.032 0.032 0.015 0.014 SCHEDULE Project Schedule Growth
0.018
0.029
0.051
0.019
Construction Schedule Growth2 0.006 0.013 0.077 0.056 Startup Schedule Growth2 0.053 - - - Const. Phase Duration Factor2 - - 0.124 0.082 Startup Phase Duration Factor2 0.056 0.038 - - Actual Overall Project Duration 38 30.5 22 16.5 Actual Total Project Duration 22 19.5 31 21 Construction Phase Duration2 11 7.5 26 18.5 Startup Phase Duration2 0.04 0.95 2.62 3.71 SAFETY R.I.R.
1.585
2.061
0.741
0.699
L.W.C.I.R. 0.835 0.619 0.728 0.707 Zero Recordables 11.8% 20.8% - - Zero Lost Workdays 17.1% 14.5% 13.5% 12.8% CHANGES Change Cost Factor
-
-
0.007
0.001
Change Schedule Factor 0.016 0.012 0.013 0.008 REWORK Field Rework Cost Factor
-
-
0.021
0.027
Field Rework Schedule Factor - - - -
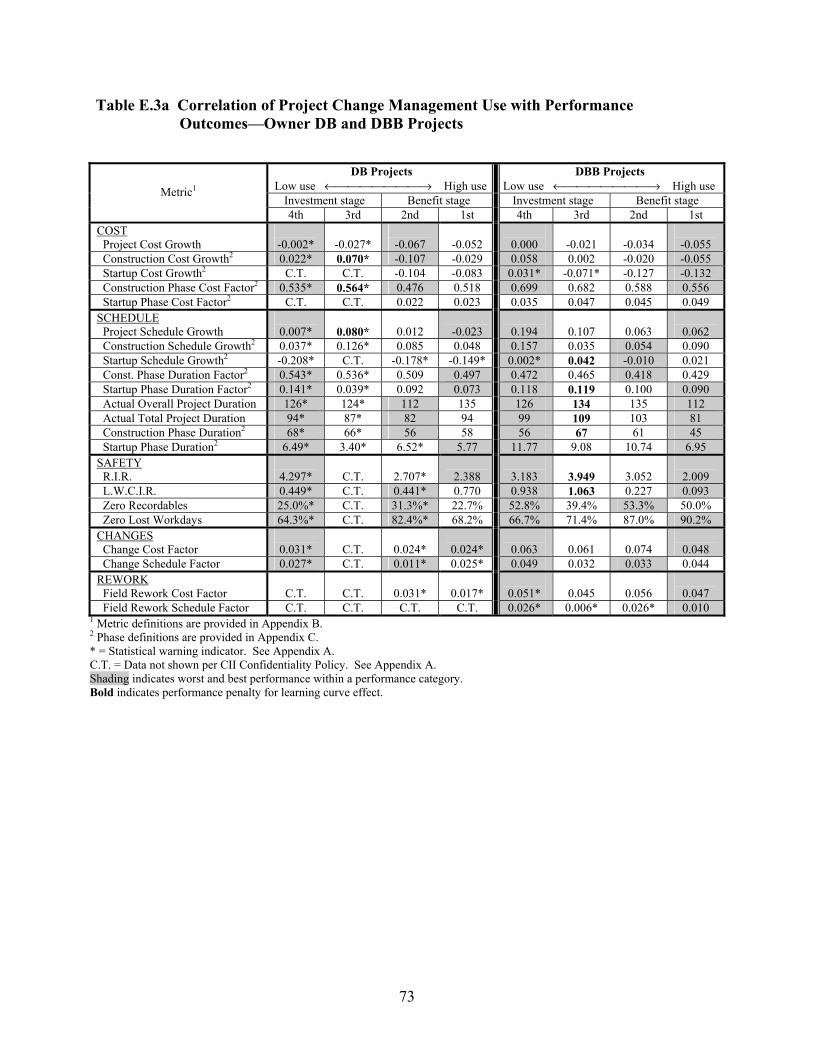
73
Table E.3a Correlation of Project Change Management Use with Performance Outcomes—Owner DB and DBB Projects
1 Metric definitions are provided in Appendix B. 2 Phase definitions are provided in Appendix C. * = Statistical warning indicator. See Appendix A. C.T. = Data not shown per CII Confidentiality Policy. See Appendix A. Shading indicates worst and best performance within a performance category. Bold indicates performance penalty for learning curve effect.
DB Projects Low use ←→ High use
DBB Projects Low use ←→ High use
Investment stage Benefit stage Investment stage Benefit stage Metric1
4th 3rd 2nd 1st 4th 3rd 2nd 1st COST Project Cost Growth
-0.002*
-0.027*
-0.067
-0.052
0.000
-0.021
-0.034
-0.055
Construction Cost Growth2 0.022* 0.070* -0.107 -0.029 0.058 0.002 -0.020 -0.055 Startup Cost Growth2 C.T. C.T. -0.104 -0.083 0.031* -0.071* -0.127 -0.132 Construction Phase Cost Factor2 0.535* 0.564* 0.476 0.518 0.699 0.682 0.588 0.556 Startup Phase Cost Factor2 C.T. C.T. 0.022 0.023 0.035 0.047 0.045 0.049 SCHEDULE Project Schedule Growth
0.007*
0.080*
0.012
-0.023
0.194
0.107
0.063
0.062
Construction Schedule Growth2 0.037* 0.126* 0.085 0.048 0.157 0.035 0.054 0.090 Startup Schedule Growth2 -0.208* C.T. -0.178* -0.149* 0.002* 0.042 -0.010 0.021 Const. Phase Duration Factor2 0.543* 0.536* 0.509 0.497 0.472 0.465 0.418 0.429 Startup Phase Duration Factor2 0.141* 0.039* 0.092 0.073 0.118 0.119 0.100 0.090 Actual Overall Project Duration 126* 124* 112 135 126 134 135 112 Actual Total Project Duration 94* 87* 82 94 99 109 103 81 Construction Phase Duration2 68* 66* 56 58 56 67 61 45 Startup Phase Duration2 6.49* 3.40* 6.52* 5.77 11.77 9.08 10.74 6.95 SAFETY R.I.R.
4.297*
C.T.
2.707*
2.388
3.183
3.949
3.052
2.009
L.W.C.I.R. 0.449* C.T. 0.441* 0.770 0.938 1.063 0.227 0.093 Zero Recordables 25.0%* C.T. 31.3%* 22.7% 52.8% 39.4% 53.3% 50.0% Zero Lost Workdays 64.3%* C.T. 82.4%* 68.2% 66.7% 71.4% 87.0% 90.2% CHANGES Change Cost Factor
0.031*
C.T.
0.024*
0.024*
0.063
0.061
0.074
0.048
Change Schedule Factor 0.027* C.T. 0.011* 0.025* 0.049 0.032 0.033 0.044 REWORK Field Rework Cost Factor
C.T.
C.T.
0.031*
0.017*
0.051*
0.045
0.056
0.047
Field Rework Schedule Factor C.T. C.T. C.T. C.T. 0.026* 0.006* 0.026* 0.010
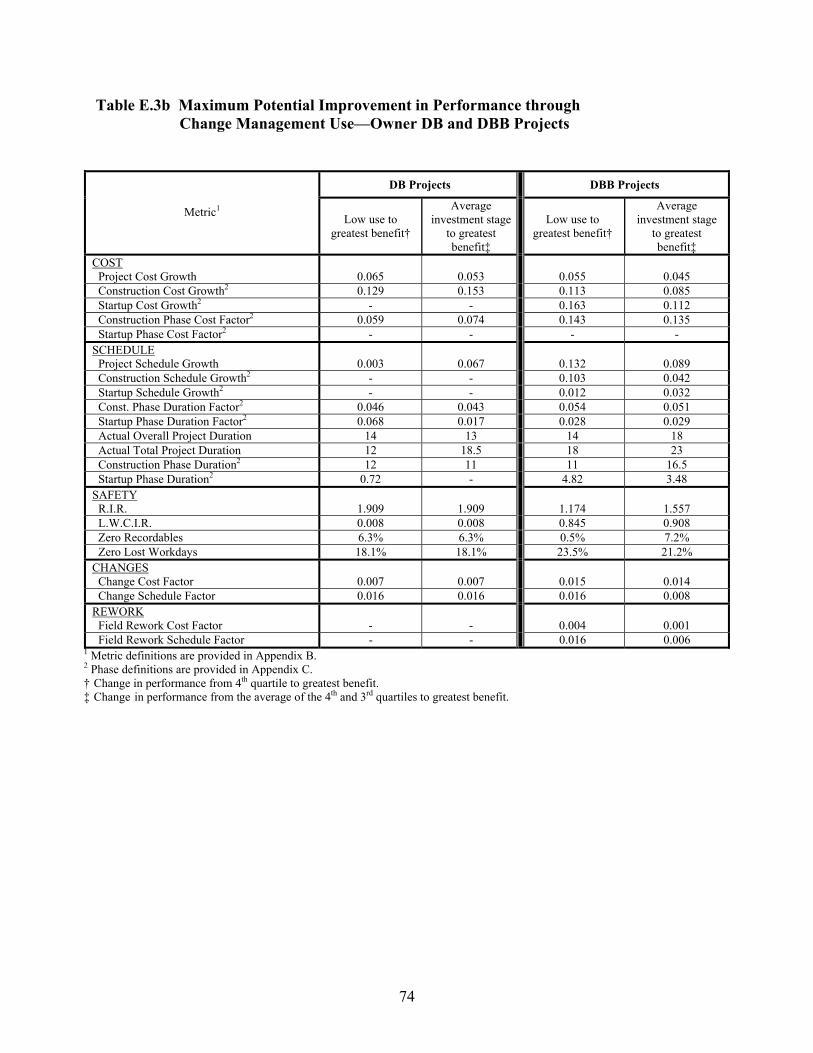
74
Table E.3b Maximum Potential Improvement in Performance through Change Management Use—Owner DB and DBB Projects
1 Metric definitions are provided in Appendix B. 2 Phase definitions are provided in Appendix C. † Change in performance from 4th quartile to greatest benefit. ‡ Change in performance from the average of the 4th and 3rd quartiles to greatest benefit.
DB Projects DBB Projects
Metric1 Low use to greatest benefit†
Average investment stage
to greatest benefit‡
Low use to greatest benefit†
Average investment stage
to greatest benefit‡
COST Project Cost Growth
0.065
0.053
0.055
0.045
Construction Cost Growth2 0.129 0.153 0.113 0.085 Startup Cost Growth2 - - 0.163 0.112 Construction Phase Cost Factor2 0.059 0.074 0.143 0.135 Startup Phase Cost Factor2 - - - - SCHEDULE Project Schedule Growth
0.003
0.067
0.132
0.089
Construction Schedule Growth2 - - 0.103 0.042 Startup Schedule Growth2 - - 0.012 0.032 Const. Phase Duration Factor2 0.046 0.043 0.054 0.051 Startup Phase Duration Factor2 0.068 0.017 0.028 0.029 Actual Overall Project Duration 14 13 14 18 Actual Total Project Duration 12 18.5 18 23 Construction Phase Duration2 12 11 11 16.5 Startup Phase Duration2 0.72 - 4.82 3.48 SAFETY R.I.R.
1.909
1.909
1.174
1.557
L.W.C.I.R. 0.008 0.008 0.845 0.908 Zero Recordables 6.3% 6.3% 0.5% 7.2% Zero Lost Workdays 18.1% 18.1% 23.5% 21.2% CHANGES Change Cost Factor
0.007
0.007
0.015
0.014
Change Schedule Factor 0.016 0.016 0.016 0.008 REWORK Field Rework Cost Factor
-
-
0.004
0.001
Field Rework Schedule Factor - - 0.016 0.006

75
Table E.4a Correlation of Design/Information Technology Use with Performance Outcomes–Owner DB and DBB Projects
1 Metric definitions are provided in Appendix B. 2 Phase definitions are provided in Appendix C. * = Statistical warning indicator. See Appendix A. C.T. = Data not shown per CII Confidentiality Policy. See Appendix A. Shading indicates worst and best performance within a performance category. Bold indicates performance penalty for learning curve effect.
DB Projects Low use ←→ High use
DBB Projects Low use ←→ High use
Investment stage Benefit stage Investment stage Benefit stage Metric1
4th 3rd 2nd 1st 4th 3rd 2nd 1st COST Project Cost Growth
-0.021*
-0.022*
-0.079*
-0.042*
-0.018
-0.004
-0.048
-0.037
Construction Cost Growth2 0.039* -0.035* -0.061* -0.058* -0.007 0.068 -0.037 -0.043 Startup Cost Growth2 C.T. C.T. -0.076* 0.048* 0.014* -0.182* -0.091 -0.088 Construction Phase Cost Factor2 0.578* 0.575* 0.505* 0.424* 0.659 0.626 0.585 0.580 Startup Phase Cost Factor2 C.T. C.T. 0.024* 0.019* 0.040 0.023* 0.063 0.047 SCHEDULE Project Schedule Growth
0.009*
0.057*
-0.028*
0.011*
0.154
0.162
0.046
0.071
Construction Schedule Growth2 -0.004* 0.148* 0.025* 0.120* 0.135 0.035 0.040 0.061 Startup Schedule Growth2 C.T. -0.181* -0.091* -0.155* 0.030 0.054* -0.015 -0.009 Const. Phase Duration Factor2 0.532* 0.510* 0.510* 0.565* 0.441 0.428 0.417 0.454 Startup Phase Duration Factor2 0.141* 0.045* 0.048* 0.101* 0.115 0.124 0.084 0.100 Actual Overall Project Duration 126* 125* 116* 129* 153 140 126 104 Actual Total Project Duration 90* 91* 79* 95* 122 107 95 78 Construction Phase Duration2 63* 56* 51* 74* 71 58 55 48 Startup Phase Duration2 6.42* 3.33* 5.04* 8.44* 12.92 11.10 6.33 7.57 SAFETY R.I.R.
2.766*
1.653*
3.353*
3.111*
4.082
3.011
3.231
1.969
L.W.C.I.R. 0.385* 1.305* 0.588* 0.341* 0.326 1.257 0.385 0.436 Zero Recordables 9.1%* 45.5%* 26.7%* 15.4%* 55.0% 50.0% 44.1% 45.7% Zero Lost Workdays 84.6%* 72.7%* 66.7%* 60.0%* 75.0% 76.7% 85.3% 83.3% CHANGES Change Cost Factor
0.031*
0.035*
0.017*
0.025*
0.058
0.072
0.071
0.057
Change Schedule Factor C.T. C.T. C.T. C.T. 0.053 0.034* 0.044 0.032 REWORK Field Rework Cost Factor
C.T.
0.040*
C.T.
C.T.
0.054*
0.043
0.043
0.053
Field Rework Schedule Factor C.T. C.T. C.T. C.T. C.T. 0.018* 0.015* 0.022

76
Table E.4b Maximum Potential Improvement in Performance through Design/Information Technology Use—Owner DB and DBB Projects
1 Metric definitions are provided in Appendix B. 2 Phase definitions are provided in Appendix C. † Change in performance from 4th quartile to greatest benefit. ‡ Change in performance from the average of the 4th and 3rd quartiles to greatest benefit.
DB Projects DBB Projects
Metric1 Low use to greatest benefit†
Average investment stage
to greatest benefit‡
Low use to greatest benefit†
Average investment stage
to greatest benefit‡
COST Project Cost Growth
0.058
0.058
0.030
0.037
Construction Cost Growth2 0.100 0.063 0.036 0.074 Startup Cost Growth2 - - 0.105 0.007 Construction Phase Cost Factor2 0.154 0.153 0.079 0.063 Startup Phase Cost Factor2 - - - - SCHEDULE Project Schedule Growth
0.037
0.061
0.108
0.112
Construction Schedule Growth2 - - 0.095 0.045 Startup Schedule Growth2 - - 0.045 0.057 Const. Phase Duration Factor2 0.022 0.011 0.024 0.018 Startup Phase Duration Factor2 0.093 0.045 0.031 0.036 Actual Overall Project Duration 10 9.5 49 42.5 Actual Total Project Duration 11 11.5 44 36.5 Construction Phase Duration2 12 8.5 23 16.5 Startup Phase Duration2 1.38 - 6.59 5.68 SAFETY R.I.R.
-
-
2.113
L.W.C.I.R. 0.044 0.504 - - Zero Recordables 17.6% 0.6% - - Zero Lost Workdays - - 10.3% 9.5% CHANGES Change Cost Factor
0.014
0.016
0.001
0.008
Change Schedule Factor - - 0.021 0.012 REWORK Field Rework Cost Factor
-
-
0.011
0.006
Field Rework Schedule Factor - - - -

77
Table E.5a Correlation of Team Building Use with Performance Outcomes— Owner DB and DBB Projects
1 Metric definitions are provided in Appendix B. 2 Phase definitions are provided in Appendix C. * = Statistical warning indicator. See Appendix A. C.T. = Data not shown per CII Confidentiality Policy. See Appendix A. Shading indicates worst and best performance within a performance category. Bold indicates performance penalty for learning curve effect.
DB Projects Low use ←→ High use
DBB Projects Low use ←→ High use
Investment stage Benefit stage Investment stage Benefit stage Metric1
4th 3rd 2nd 1st 4th 3rd 2nd 1st COST Project Cost Growth
-0.016*
-0.043*
-0.053*
-0.061*
-0.030
-0.017
-0.044
-0.011
Construction Cost Growth2 -0.029* -0.031* -0.053* -0.024* 0.019 -0.007 -0.031 0.002 Startup Cost Growth2 C.T. -0.130* C.T. -0.118* -0.109 C.T. 0.029 -0.172 Construction Phase Cost Factor2 0.601* 0.546* 0.517* 0.489* 0.633 0.613 0.610 0.612 Startup Phase Cost Factor2 C.T. 0.041* C.T. 0.023* 0.029 0.066* 0.066 0.037 SCHEDULE Project Schedule Growth
0.026*
0.007*
0.057*
-0.042*
0.120
0.164
0.063
0.038
Construction Schedule Growth2 0.093* 0.059* 0.095* 0.031* 0.069 0.049 0.052 0.105 Startup Schedule Growth2 -0.174* -0.082* C.T. -0.249* -0.013 0.024* 0.004 0.036 Const. Phase Duration Factor2 0.485* 0.568* 0.525* 0.488 0.443 0.484 0.426 0.437 Startup Phase Duration Factor2 0.048* 0.085* 0.092* 0.097 0.092 0.125 0.098 0.124 Actual Overall Project Duration 100* 137* 124* 126* 116 116 122 153 Actual Total Project Duration 71* 95* 95* 90* 89 92 92 119 Construction Phase Duration2 44* 72* 60* 62* 53 46 54 72 Startup Phase Duration2 3.76* 9.26* 4.02* 5.18* 6.72 9.88 8.69 12.84 SAFETY R.I.R.
4.002*
1.830*
2.279*
3.101*
2.523
2.564
2.016
5.321
L.W.C.I.R. 0.304* 0.617* 1.002* 0.607* 0.602 0.128 0.505 0.762 Zero Recordables 21.4%* 20.2%* 36.4%* 33.3%* 59.6% 59.1% 50.0% 21.9% Zero Lost Workdays 85.7%* 68.8%* 53.8%* 68.8%* 84.3% 81.8% 86.0% 62.9% CHANGES Change Cost Factor
0.028*
0.028*
0.025*
0.024*
0.084
0.065
0.056
0.045
Change Schedule Factor 0.032* 0.012* 0.019* C.T. 0.046 0.049 0.033 0.034 REWORK Field Rework Cost Factor
C.T.
C.T.
C.T.
C.T.
0.050
0.051*
0.055
0.035
Field Rework Schedule Factor C.T. C.T. C.T. C.T. 0.023 0.016* 0.019* 0.014

78
Table E.5b Maximum Potential Improvement in Performance through Team Building Use—Owner DB and DBB Projects
1 Metric definitions are provided in Appendix B. 2 Phase definitions are provided in Appendix C. † Change in performance from 4th quartile to greatest benefit. ‡ Change in performance from the average of the 4th and 3rd quartiles to greatest benefit.
DB Projects DBB Projects
Metric1 Low use to greatest benefit†
Average investment stage
to greatest benefit‡
Low use to greatest benefit†
Average investment stage
to greatest benefit‡
COST Project Cost Growth
0.045
0.032
0.014
0.021
Construction Cost Growth2 0.024 0.023 0.050 0.037 Startup Cost Growth2 - - 0.063 0.063 Construction Phase Cost Factor2 0.112 0.085 0.023 0.013 Startup Phase Cost Factor2 - - - - SCHEDULE Project Schedule Growth
0.068
0.059
0.082
0.104
Construction Schedule Growth2 0.062 0.045 0.017 0.007 Startup Schedule Growth2 0.075 0.121 - - Const. Phase Duration Factor2 - - 0.017 0.038 Startup Phase Duration Factor2 - - - - Actual Overall Project Duration - - - - Actual Total Project Duration - - - - Construction Phase Duration2 - - - - Startup Phase Duration2 - - - - SAFETY R.I.R.
1.723
0.637
0.507
0.528
L.W.C.I.R. - - 0.097 - Zero Recordables 15% 15.6% - - Zero Lost Workdays - - 1.7% 3.0% CHANGES Change Cost Factor
0.004
0.004
0.039
0.030
Change Schedule Factor 0.013 0.003 0.013 0.015 REWORK Field Rework Cost Factor
-
-
0.015
0.016
Field Rework Schedule Factor - - 0.009 0.006

79
Table E.6a Correlation of Zero Accident Techniques with Performance Outcomes — Owner DB and DBB Projects
1 Metric definitions are provided in Appendix B. 2 Phase definitions are provided in Appendix C. * = Statistical warning indicator. See Appendix A. C.T. = Data not shown per CII Confidentiality Policy. See Appendix A. Shading indicates worst and best performance within a performance category. Bold indicates performance penalty for learning curve effect.
DB Projects Low use ←→ High use
DBB Projects Low use ←→ High use
Investment stage Benefit stage Investment stage Benefit stage Metric1
4th 3rd 2nd 1st 4th 3rd 2nd 1st COST Project Cost Growth
-0.009*
-0.040
-0.045*
-0.068
-0.023
-0.033
-0.025
-0.043
Construction Cost Growth2 -0.019* -0.007 -0.036* -0.028* 0.006 -0.004 -0.018 -0.017 Startup Cost Growth2 C.T. -0.033* -0.175* C.T. 0.110* -0.153 -0.104 -0.163* Construction Phase Cost Factor2 0.554* 0.552 0.478* 0.523 0.782 0.642 0.558 0.516 Startup Phase Cost Factor2 C.T. 0.020* 0.014* 0.025* 0.025* 0.056 0.044 0.047 SCHEDULE Project Schedule Growth
0.003*
0.000*
0.010*
0.027*
0.158
0.092
0.065
0.083
Construction Schedule Growth2 0.070* 0.028* 0.055* 0.105 0.186 0.086 0.046 0.032 Startup Schedule Growth2 -0.163* -0.174* -0.110* -0.148* -0.017* 0.000 0.035 0.052 Const. Phase Duration Factor2 0.523 0.502 0.508* 0.555 0.477 0.446 0.424 0.432 Startup Phase Duration Factor2 0.152* 0.056* 0.089* 0.061 0.134 0.124 0.083 0.098 Actual Overall Project Duration 122 146* 128* 96 150 120 122 113 Actual Total Project Duration 90 100* 91* 74 123 96 87 80 Construction Phase Duration2 63 64* 62* 53 72 59 51 44 Startup Phase Duration2 6.60* 5.18* 8.09* 3.83* 12.99 10.34 7.85 8.70 SAFETY R.I.R.
2.121*
3.211*
3.837*
2.024*
4.478
2.874
3.048
2.215
L.W.C.I.R. 1.260* 0.553* 0.353* 0.353* 1.364 0.544 0.405 0.129 Zero Recordables 33.3%* 14.3%* 30.8%* 26.3%* 53.6% 47.2% 52.3% 44.4% Zero Lost Workdays 76.9%* 62.5%* 64.3%* 78.9%* 70.0% 71.1% 88.6% 84.4% CHANGES Change Cost Factor
0.034*
0.021*
0.024*
0.026*
0.057
0.062
0.062
0.063
Change Schedule Factor 0.049* 0.022* 0.005* 0.002* 0.040 0.037 0.042 0.036 REWORK Field Rework Cost Factor
C.T.
C.T.
C.T.
0.028*
0.066
0.048*
0.049
0.045
Field Rework Schedule Factor C.T. C.T. C.T. C.T. 0.041* 0.011* 0.009 0.007*
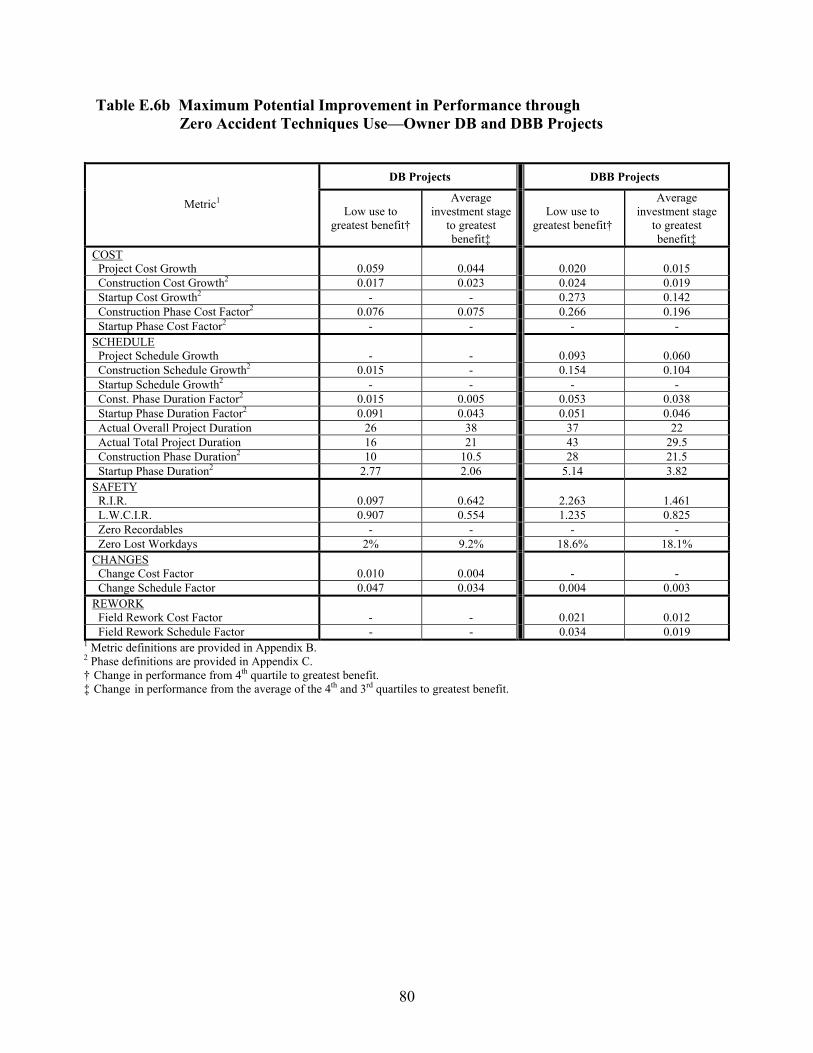
80
Table E.6b Maximum Potential Improvement in Performance through Zero Accident Techniques Use—Owner DB and DBB Projects
1 Metric definitions are provided in Appendix B. 2 Phase definitions are provided in Appendix C. † Change in performance from 4th quartile to greatest benefit. ‡ Change in performance from the average of the 4th and 3rd quartiles to greatest benefit.
DB Projects DBB Projects
Metric1 Low use to greatest benefit†
Average investment stage
to greatest benefit‡
Low use to greatest benefit†
Average investment stage
to greatest benefit‡
COST Project Cost Growth
0.059
0.044
0.020
0.015
Construction Cost Growth2 0.017 0.023 0.024 0.019 Startup Cost Growth2 - - 0.273 0.142 Construction Phase Cost Factor2 0.076 0.075 0.266 0.196 Startup Phase Cost Factor2 - - - - SCHEDULE Project Schedule Growth
-
-
0.093
0.060
Construction Schedule Growth2 0.015 - 0.154 0.104 Startup Schedule Growth2 - - - - Const. Phase Duration Factor2 0.015 0.005 0.053 0.038 Startup Phase Duration Factor2 0.091 0.043 0.051 0.046 Actual Overall Project Duration 26 38 37 22 Actual Total Project Duration 16 21 43 29.5 Construction Phase Duration2 10 10.5 28 21.5 Startup Phase Duration2 2.77 2.06 5.14 3.82 SAFETY R.I.R.
0.097
0.642
2.263
1.461
L.W.C.I.R. 0.907 0.554 1.235 0.825 Zero Recordables - - - - Zero Lost Workdays 2% 9.2% 18.6% 18.1% CHANGES Change Cost Factor
0.010
0.004
-
-
Change Schedule Factor 0.047 0.034 0.004 0.003 REWORK Field Rework Cost Factor
-
-
0.021
0.012
Field Rework Schedule Factor - - 0.034 0.019
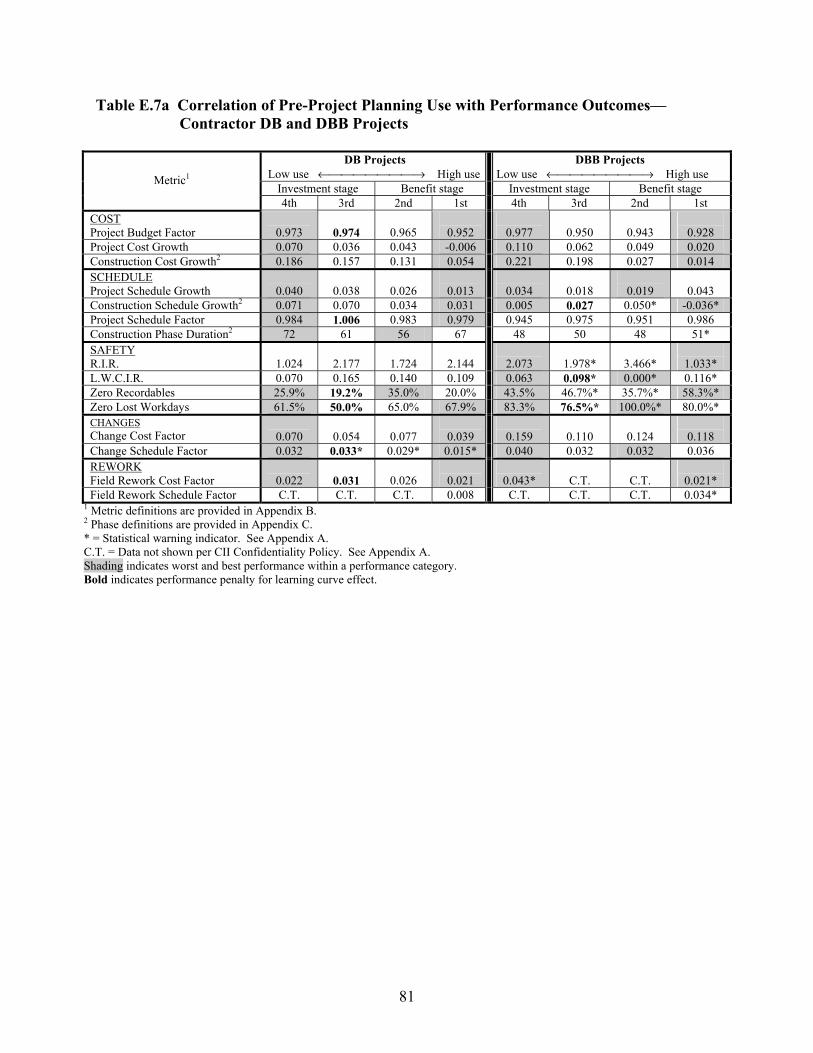
81
Table E.7a Correlation of Pre-Project Planning Use with Performance Outcomes—Contractor DB and DBB Projects
DB Projects
Low use ←→ High useDBB Projects
Low use ←→ High use Investment stage Benefit stage Investment stage Benefit stage
Metric1
4th 3rd 2nd 1st 4th 3rd 2nd 1st COST Project Budget Factor
0.973
0.974
0.965
0.952
0.977
0.950
0.943
0.928
Project Cost Growth 0.070 0.036 0.043 -0.006 0.110 0.062 0.049 0.020 Construction Cost Growth2 0.186 0.157 0.131 0.054 0.221 0.198 0.027 0.014 SCHEDULE Project Schedule Growth
0.040
0.038
0.026
0.013
0.034
0.018
0.019
0.043
Construction Schedule Growth2 0.071 0.070 0.034 0.031 0.005 0.027 0.050* -0.036* Project Schedule Factor 0.984 1.006 0.983 0.979 0.945 0.975 0.951 0.986 Construction Phase Duration2 72 61 56 67 48 50 48 51* SAFETY R.I.R.
1.024
2.177
1.724
2.144
2.073
1.978*
3.466*
1.033*
L.W.C.I.R. 0.070 0.165 0.140 0.109 0.063 0.098* 0.000* 0.116* Zero Recordables 25.9% 19.2% 35.0% 20.0% 43.5% 46.7%* 35.7%* 58.3%* Zero Lost Workdays 61.5% 50.0% 65.0% 67.9% 83.3% 76.5%* 100.0%* 80.0%* CHANGES Change Cost Factor
0.070
0.054
0.077
0.039
0.159
0.110
0.124
0.118
Change Schedule Factor 0.032 0.033* 0.029* 0.015* 0.040 0.032 0.032 0.036 REWORK Field Rework Cost Factor
0.022
0.031
0.026
0.021
0.043*
C.T.
C.T.
0.021*
Field Rework Schedule Factor C.T. C.T. C.T. 0.008 C.T. C.T. C.T. 0.034* 1 Metric definitions are provided in Appendix B. 2 Phase definitions are provided in Appendix C. * = Statistical warning indicator. See Appendix A. C.T. = Data not shown per CII Confidentiality Policy. See Appendix A. Shading indicates worst and best performance within a performance category. Bold indicates performance penalty for learning curve effect.

82
Table E.7b Maximum Potential Improvement in Performance through Pre-Project Planning Use—Contractor DB and DBB Projects
DB Projects DBB Projects
Metric1 Low use to greatest benefit†
Average investment stage
to greatest benefit‡
Low use to greatest benefit†
Average investment stage
to greatest benefit‡
COST Project Budget Factor
0.021
0.022
0.049
0.036
Project Cost Growth 0.076 0.059 0.090 0.066 Construction Cost Growth2 0.132 0.118 0.207 0.196 SCHEDULE Project Schedule Growth
0.027
0.026
0.015
0.007
Construction Schedule Growth2 0.040 0.040 0.041 0.052 Project Schedule Factor 0.005 0.016 - - Construction Phase Duration2 16 10.5 - - SAFETY R.I.R.
-
-
1.040
0.993
L.W.C.I.R. - - 0.063 0.081 Zero Recordables 9.1% 12.5% 14.8% 13.2% Zero Lost Workdays 6.4% 12.2% 16.7% 20.1% CHANGES Change Cost Factor
0.031
0.023
0.041
0.017
Change Schedule Factor 0.017 0.018 0.008 0.004 REWORK Field Rework Cost Factor
0.001
0.006
0.022
0.022
Field Rework Schedule Factor - - - - 1 Metric definitions are provided in Appendix B. 2 Phase definitions are provided in Appendix C. † = Change in performance from 4th quartile to greatest benefit. ‡ = Change in performance from the average of the 4th and 3rd quartiles to greatest benefit.
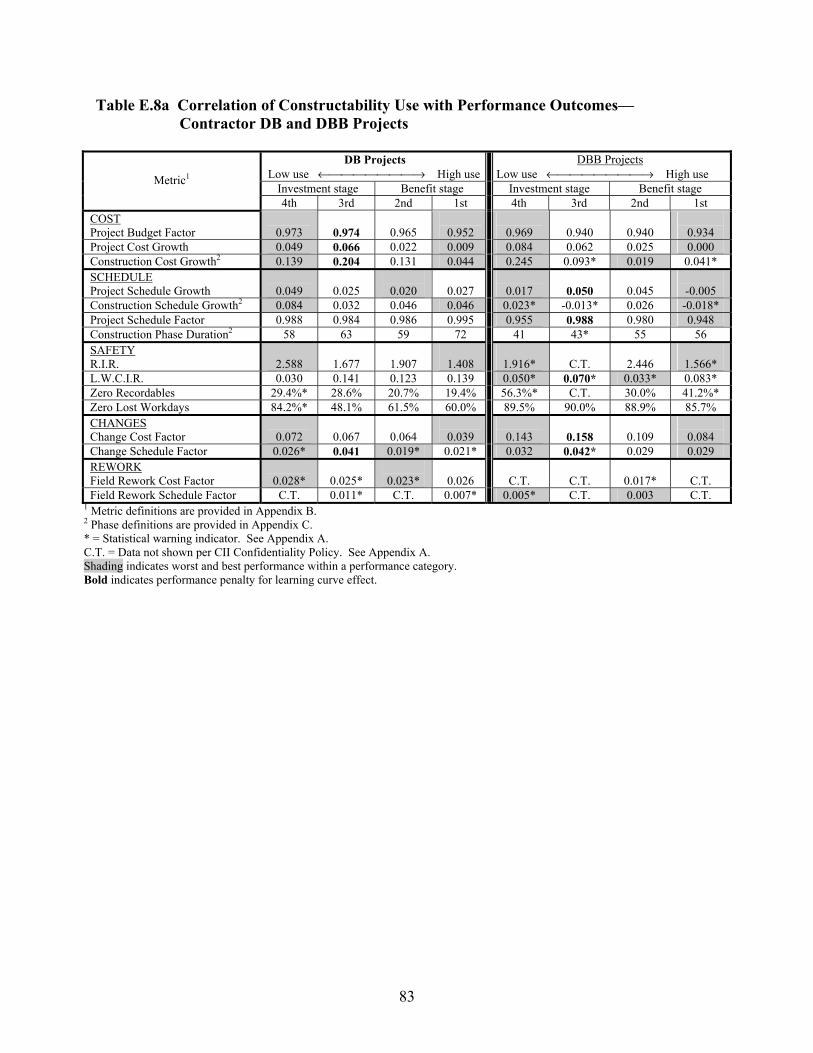
83
Table E.8a Correlation of Constructability Use with Performance Outcomes— Contractor DB and DBB Projects
DB Projects
Low use ←→ High useDBB Projects
Low use ←→ High use Investment stage Benefit stage Investment stage Benefit stage
Metric1
4th 3rd 2nd 1st 4th 3rd 2nd 1st COST Project Budget Factor
0.973
0.974
0.965
0.952
0.969
0.940
0.940
0.934
Project Cost Growth 0.049 0.066 0.022 0.009 0.084 0.062 0.025 0.000 Construction Cost Growth2 0.139 0.204 0.131 0.044 0.245 0.093* 0.019 0.041* SCHEDULE Project Schedule Growth
0.049
0.025
0.020
0.027
0.017
0.050
0.045
-0.005
Construction Schedule Growth2 0.084 0.032 0.046 0.046 0.023* -0.013* 0.026 -0.018* Project Schedule Factor 0.988 0.984 0.986 0.995 0.955 0.988 0.980 0.948 Construction Phase Duration2 58 63 59 72 41 43* 55 56 SAFETY R.I.R.
2.588
1.677
1.907
1.408
1.916*
C.T.
2.446
1.566*
L.W.C.I.R. 0.030 0.141 0.123 0.139 0.050* 0.070* 0.033* 0.083* Zero Recordables 29.4%* 28.6% 20.7% 19.4% 56.3%* C.T. 30.0% 41.2%* Zero Lost Workdays 84.2%* 48.1% 61.5% 60.0% 89.5% 90.0% 88.9% 85.7% CHANGES Change Cost Factor
0.072
0.067
0.064
0.039
0.143
0.158
0.109
0.084
Change Schedule Factor 0.026* 0.041 0.019* 0.021* 0.032 0.042* 0.029 0.029 REWORK Field Rework Cost Factor
0.028*
0.025*
0.023*
0.026
C.T.
C.T.
0.017*
C.T.
Field Rework Schedule Factor C.T. 0.011* C.T. 0.007* 0.005* C.T. 0.003 C.T. 1 Metric definitions are provided in Appendix B. 2 Phase definitions are provided in Appendix C. * = Statistical warning indicator. See Appendix A. C.T. = Data not shown per CII Confidentiality Policy. See Appendix A. Shading indicates worst and best performance within a performance category. Bold indicates performance penalty for learning curve effect.
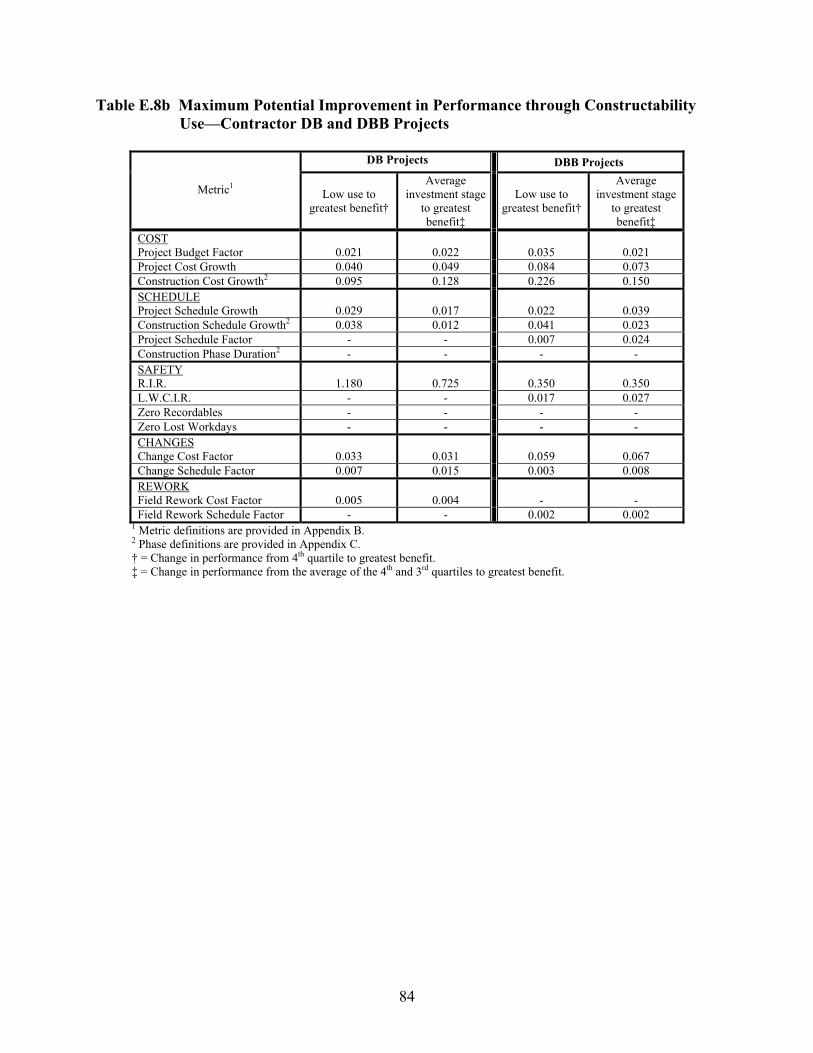
84
Table E.8b Maximum Potential Improvement in Performance through Constructability Use—Contractor DB and DBB Projects
DB Projects DBB Projects
Metric1 Low use to greatest benefit†
Average investment stage
to greatest benefit‡
Low use to greatest benefit†
Average investment stage
to greatest benefit‡
COST Project Budget Factor
0.021
0.022
0.035
0.021
Project Cost Growth 0.040 0.049 0.084 0.073 Construction Cost Growth2 0.095 0.128 0.226 0.150 SCHEDULE Project Schedule Growth
0.029
0.017
0.022
0.039
Construction Schedule Growth2 0.038 0.012 0.041 0.023 Project Schedule Factor - - 0.007 0.024 Construction Phase Duration2 - - - - SAFETY R.I.R.
1.180
0.725
0.350
0.350
L.W.C.I.R. - - 0.017 0.027 Zero Recordables - - - - Zero Lost Workdays - - - - CHANGES Change Cost Factor
0.033
0.031
0.059
0.067
Change Schedule Factor 0.007 0.015 0.003 0.008 REWORK Field Rework Cost Factor
0.005
0.004
-
-
Field Rework Schedule Factor - - 0.002 0.002 1 Metric definitions are provided in Appendix B. 2 Phase definitions are provided in Appendix C. † = Change in performance from 4th quartile to greatest benefit. ‡ = Change in performance from the average of the 4th and 3rd quartiles to greatest benefit.
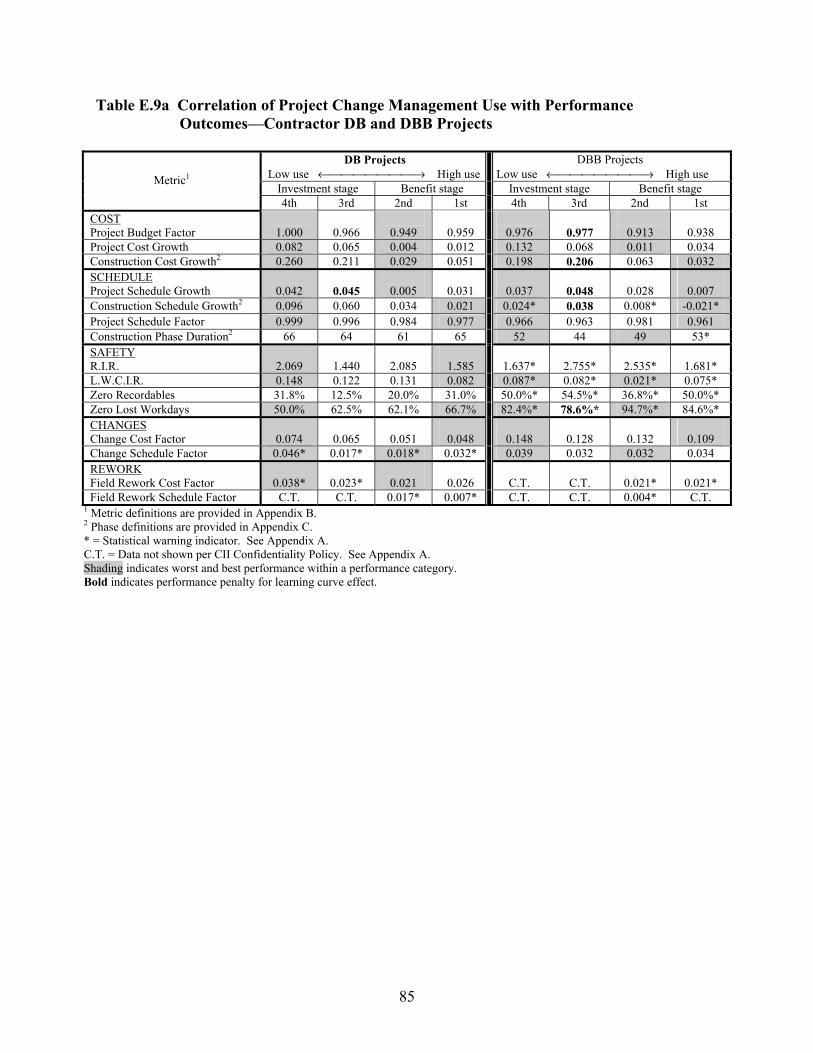
85
Table E.9a Correlation of Project Change Management Use with Performance Outcomes—Contractor DB and DBB Projects
DB Projects
Low use ←→ High useDBB Projects
Low use ←→ High use Investment stage Benefit stage Investment stage Benefit stage
Metric1
4th 3rd 2nd 1st 4th 3rd 2nd 1st COST Project Budget Factor
1.000
0.966
0.949
0.959
0.976
0.977
0.913
0.938
Project Cost Growth 0.082 0.065 0.004 0.012 0.132 0.068 0.011 0.034 Construction Cost Growth2 0.260 0.211 0.029 0.051 0.198 0.206 0.063 0.032 SCHEDULE Project Schedule Growth
0.042
0.045
0.005
0.031
0.037
0.048
0.028
0.007
Construction Schedule Growth2 0.096 0.060 0.034 0.021 0.024* 0.038 0.008* -0.021* Project Schedule Factor 0.999 0.996 0.984 0.977 0.966 0.963 0.981 0.961 Construction Phase Duration2 66 64 61 65 52 44 49 53* SAFETY R.I.R.
2.069
1.440
2.085
1.585
1.637*
2.755*
2.535*
1.681*
L.W.C.I.R. 0.148 0.122 0.131 0.082 0.087* 0.082* 0.021* 0.075* Zero Recordables 31.8% 12.5% 20.0% 31.0% 50.0%* 54.5%* 36.8%* 50.0%* Zero Lost Workdays 50.0% 62.5% 62.1% 66.7% 82.4%* 78.6%* 94.7%* 84.6%* CHANGES Change Cost Factor
0.074
0.065
0.051
0.048
0.148
0.128
0.132
0.109
Change Schedule Factor 0.046* 0.017* 0.018* 0.032* 0.039 0.032 0.032 0.034 REWORK Field Rework Cost Factor
0.038*
0.023*
0.021
0.026
C.T.
C.T.
0.021*
0.021*
Field Rework Schedule Factor C.T. C.T. 0.017* 0.007* C.T. C.T. 0.004* C.T. 1 Metric definitions are provided in Appendix B. 2 Phase definitions are provided in Appendix C. * = Statistical warning indicator. See Appendix A. C.T. = Data not shown per CII Confidentiality Policy. See Appendix A. Shading indicates worst and best performance within a performance category. Bold indicates performance penalty for learning curve effect.
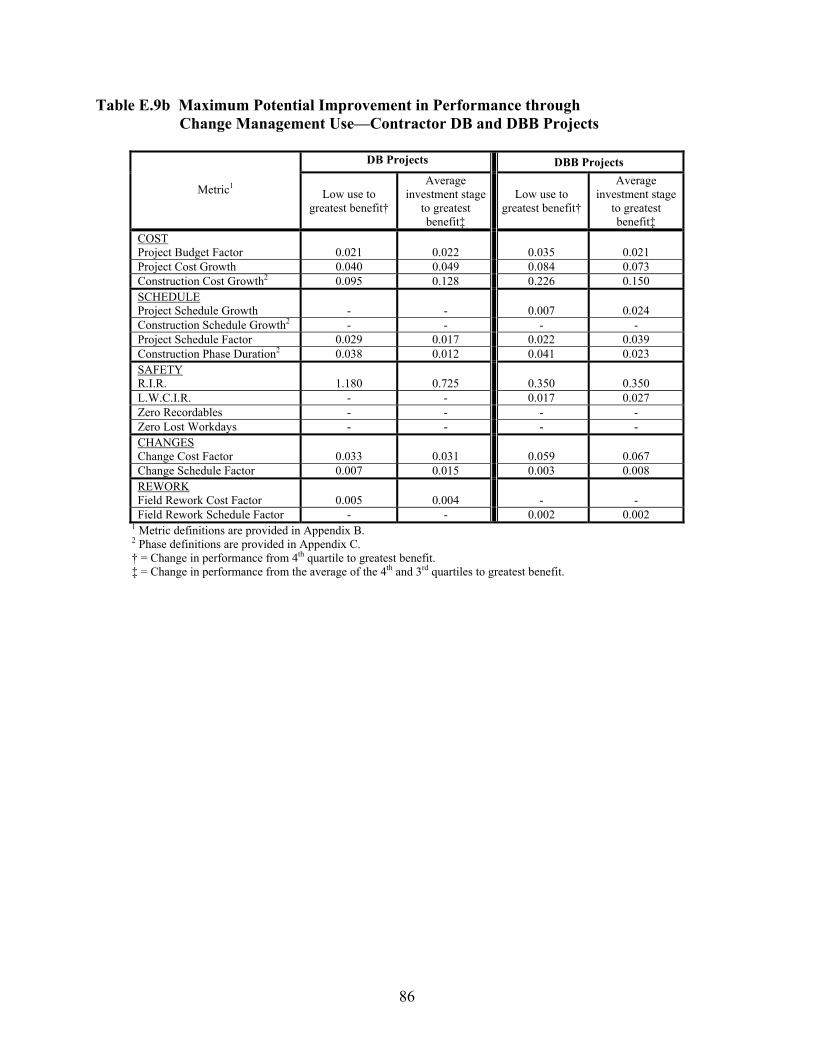
86
Table E.9b Maximum Potential Improvement in Performance through Change Management Use—Contractor DB and DBB Projects
DB Projects DBB Projects
Metric1 Low use to greatest benefit†
Average investment stage
to greatest benefit‡
Low use to greatest benefit†
Average investment stage
to greatest benefit‡
COST Project Budget Factor
0.021
0.022
0.035
0.021
Project Cost Growth 0.040 0.049 0.084 0.073 Construction Cost Growth2 0.095 0.128 0.226 0.150 SCHEDULE Project Schedule Growth
-
-
0.007
0.024
Construction Schedule Growth2 - - - - Project Schedule Factor 0.029 0.017 0.022 0.039 Construction Phase Duration2 0.038 0.012 0.041 0.023 SAFETY R.I.R.
1.180
0.725
0.350
0.350
L.W.C.I.R. - - 0.017 0.027 Zero Recordables - - - - Zero Lost Workdays - - - - CHANGES Change Cost Factor
0.033
0.031
0.059
0.067
Change Schedule Factor 0.007 0.015 0.003 0.008 REWORK Field Rework Cost Factor
0.005
0.004
-
-
Field Rework Schedule Factor - - 0.002 0.002 1 Metric definitions are provided in Appendix B. 2 Phase definitions are provided in Appendix C. † = Change in performance from 4th quartile to greatest benefit. ‡ = Change in performance from the average of the 4th and 3rd quartiles to greatest benefit.

87
Table E.10a Correlation of Design/Information Technology Use with Performance Outcomes—Contractor DB and DBB Projects
DB Projects
Low use ←→ High useDBB Projects
Low use ←→ High use Investment stage Benefit stage Investment stage Benefit stage
Metric1
4th 3rd 2nd 1st 4th 3rd 2nd 1st COST Project Budget Factor
0.969
0.963
0.972
0.969
0.952
1.002
0.920
0.934
Project Cost Growth 0.029 0.045 0.054 0.027 0.085 0.165 0.018 0.003 Construction Cost Growth2 0.137 0.159 0.158 0.090 0.103 0.204* 0.175* 0.023 SCHEDULE Project Schedule Growth
0.048
0.024
0.034
0.013
0.044
0.028
0.035
0.012
Construction Schedule Growth2 0.070 0.006 0.087 0.037 0.031 0.027* 0.027* -0.017* Project Schedule Factor 0.993 0.971 0.999 0.988 0.971 0.952 0.963 0.984 Construction Phase Duration2 69 61 54 70 48 36* 57* 59 SAFETY R.I.R.
1.622
1.946
2.617
1.332
2.145*
1.577*
C.T.
2.581*
L.W.C.I.R. 0.054 0.114 0.246 0.102 0.085* 0.000* C.T. 0.115* Zero Recordables 38.1% 28.0% 8.0% 20.7% 47.4%* 69.2%* C.T. 27.8%* Zero Lost Workdays 65.2% 64.0% 47.6% 60.7% 84.2%* 100.0%* C.T. 80.0%* CHANGES Change Cost Factor
0.052
0.084
0.060
0.038
0.136
0.175
0.115
0.095
Change Schedule Factor 0.026* 0.041* 0.024 0.031* 0.029 0.057* 0.043* 0.011 REWORK Field Rework Cost Factor
0.031*
C.T.
0.023
0.023
C.T.
C.T.
C.T.
0.030*
Field Rework Schedule Factor C.T. C.T. 0.014* 0.007* C.T. C.T. C.T. 0.034* 1 Metric definitions are provided in Appendix B. 2 Phase definitions are provided in Appendix C. * = Statistical warning indicator. See Appendix A. C.T. = Data not shown per CII Confidentiality Policy. See Appendix A. Shading indicates worst and best performance within a performance category. Bold indicates performance penalty for learning curve effect.

88
Table E.10b Maximum Potential Improvement in Performance through Design/Information Technology Use—Contractor DB and DBB Projects
DB Projects DBB Projects
Metric1 Low use to greatest benefit†
Average investment stage
to greatest benefit‡
Low use to greatest benefit†
Average investment stage
to greatest benefit‡
COST Project Budget Factor
-
-
0.032
0.057
Project Cost Growth 0.002 0.010 0.082 0.122 Construction Cost Growth2 0.047 0.058 0.080 0.131 SCHEDULE Project Schedule Growth
0.035
0.023
0.032
0.024
Construction Schedule Growth2 0.033 0.001 0.048 0.046 Project Schedule Factor 0.005 - 0.008 - Construction Phase Duration2 15 11 - - SAFETY R.I.R.
0.290
0.452
-
-
L.W.C.I.R. - - - - Zero Recordables - - - - Zero Lost Workdays - - - - CHANGES Change Cost Factor
0.014
0.030
0.041
0.061
Change Schedule Factor 0.002 0.010 0.018 0.032 REWORK Field Rework Cost Factor
0.008
0.008
-
-
Field Rework Schedule Factor - - - - 1 Metric definitions are provided in Appendix B. 2 Phase definitions are provided in Appendix C. † = Change in performance from 4th quartile to greatest benefit. ‡ = Change in performance from the average of the 4th and 3rd quartiles to greatest benefit.

89
Table E.11a Correlation of Team Building Use with Performance Outcomes— Contractor DB and DBB Projects
DB Projects
Low use ←→ High useDBB Projects
Low use ←→ High use Investment stage Benefit stage Investment stage Benefit stage
Metric1
4th 3rd 2nd 1st 4th 3rd 2nd 1st COST Project Budget Factor
0.985
0.949*
0.985
0.949
0.973
0.953
0.937
0.928
Project Cost Growth 0.093 0.022* 0.045 -0.011 0.100 0.099 0.040 0.004 Construction Cost Growth2 0.187 0.093* 0.135 0.083 0.184 0.252* 0.118 0.008 SCHEDULE Project Schedule Growth
0.044
0.029*
0.023
0.008
0.036
0.067
0.032
-0.006
Construction Schedule Growth2 0.087 -0.012* 0.042 0.029 0.050 -0.011* 0.035 -0.026 Project Schedule Factor 0.975 0.982* 0.995 0.992 0.964 0.980 0.958 0.969 Construction Phase Duration2 50 66* 70 74 38 46* 50 65 SAFETY R.I.R.
2.507
1.654*
1.540
1.326
1.922
C.T.
1.738
2.688
L.W.C.I.R. 0.076 0.159* 0.104 0.144 0.053 C.T. 0.053* 0.093 Zero Recordables 29.6% 29.4%* 17.9% 20.0% 61.9% C.T. 40.0% 28.6% Zero Lost Workdays 80.8% 50.0%* 58.6% 53.6% 90.5% C.T. 84.2%* 85.0% CHANGES Change Cost Factor
0.092
0.059*
0.037
0.038
0.148
0.154
0.117
0.091
Change Schedule Factor 0.037 0.022* 0.017* 0.026* 0.029 0.048 0.043 0.016 REWORK Field Rework Cost Factor
0.022
0.022*
0.034*
0.025
C.T.
C.T.
0.035*
0.022*
Field Rework Schedule Factor C.T. C.T. C.T. 0.002* C.T. C.T. C.T. 0.037* 1 Metric definitions are provided in Appendix B. 2 Phase definitions are provided in Appendix C. * = Statistical warning indicator. See Appendix A. C.T. = Data not shown per CII Confidentiality Policy. See Appendix A. Shading indicates worst and best performance within a performance category. Bold indicates performance penalty for learning curve effect.

90
Table E.11b Maximum Potential Improvement in Performance through Team Building Use—Contractor DB and DBB Projects
DB Projects DBB Projects
Metric1 Low use to greatest benefit†
Average investment stage
to greatest benefit‡
Low use to greatest benefit†
Average investment stage
to greatest benefit‡
COST Project Budget Factor 0.036 0.018 0.045 0.035
Project Cost Growth 0.104 0.069 0.096 0.096 Construction Cost Growth2 0.104 0.057 0.176 0.210 SCHEDULE Project Schedule Factor - - 0.006 0.014
Construction Phase Duration2 - - - - Project Schedule Growth 0.036 0.029 0.042 0.058 Construction Schedule Growth2 0.058 0.009 0.076 0.046 SAFETY R.I.R. 1.181 0.755 0.184 0.184
L.W.C.I.R. - - - - Zero Recordables - - - - Zero Lost Workdays - - - - CHANGES Change Cost Factor 0.055 0.038 0.057 0.060
Change Schedule Factor 0.020 0.013 0.013 0.023 REWORK Field Rework Cost Factor - - - --
Field Rework Schedule Factor - - - - 1 Metric definitions are provided in Appendix B. 2 Phase definitions are provided in Appendix C. † = Change in performance from 4th quartile to greatest benefit. ‡ = Change in performance from the average of the 4th and 3rd quartiles to greatest benefit.

91
Table E.12a Correlation of Zero Accident Techniques Use with Performance Outcomes—Contractor DB and DBB Projects
DB Projects
Low use ←→ High useDBB Projects
Low use ←→ High use Investment stage Benefit stage Investment stage Benefit stage
Metric1
4th 3rd 2nd 1st 4th 3rd 2nd 1st COST Project Budget Factor
0.979
0.969
0.960
0.955
0.949
0.918*
0.942
0.925
Project Cost Growth 0.052 0.038 0.047 0.025 0.061 0.074* 0.022 -0.017 Construction Cost Growth2 0.240 0.121 0.076 0.097 0.185* 0.169 0.107 -0.063* SCHEDULE Project Schedule Growth
0.028
0.026
0.047
0.016
0.029
0.001*
-0.003
0.020
Construction Schedule Growth2 0.035 0.058 0.070 0.034 0.015* 0.020* -0.001 -0.017* Project Schedule Factor 0.974 0.979 1.003 0.989 0.964 0.994* 0.934 0.989 Construction Phase Duration2 71 60 62 64 34* 44 55 58 SAFETY R.I.R.
0.700
2.168
3.097
1.369
1.565*
2.392*
2.550
1.403*
L.W.C.I.R. 0.093 0.103 0.205 0.095 0.000* 0.003* 0.109 0.129* Zero Recordables 41.7% 34.6% 0.0% 17.6% 81.8%* 35.35* 43.5% 29.4%* Zero Lost Workdays 43.5% 69.2% 52.4% 71.9% 100.0%* 89.5%* 77.3% 75.0%* CHANGES Change Cost Factor
0.060
0.068
0.067
0.058
0.117
0.165*
0.099
0.097
Change Schedule Factor 0.036* 0.029* 0.022 0.027* 0.028* 0.024* 0.029* 0.013* REWORK Field Rework Cost Factor
C.T.
0.021*
0.022*
0.030
C.T.
C.T.
C.T.
0.019*
Field Rework Schedule Factor C.T. C.T. 0.011* 0.016* C.T. 0.006* C.T. 0.025* 1 Metric definitions are provided in Appendix B. 2 Phase definitions are provided in Appendix C. * = Statistical warning indicator. See Appendix A. C.T. = Data not shown per CII Confidentiality Policy. See Appendix A. Shading indicates worst and best performance within a performance category. Bold indicates performance penalty for learning curve effect.

92
Table E.12b Maximum Potential Improvement in Performance through Zero Accident Techniques Use—Contractor DB and DBB Projects
DB Projects DBB Projects
Metric1 Low use to greatest benefit†
Average investment stage
to greatest benefit‡
Low use to greatest benefit†
Average investment stage
to greatest benefit‡
COST Project Budget Factor
0.024
0.019
0.024
0.009
Project Cost Growth 0.027 0.020 0.078 0.085 Construction Cost Growth2 0.164 0.105 0.248 0.240 SCHEDULE Project Schedule Factor
0.012
0.011
0.032
0.018
Construction Phase Duration2 0.001 0.013 0.032 0.035 Project Schedule Growth - - 0.030 0.045 Construction Schedule Growth2 9 5.5 - - SAFETY R.I.R.
-
-
0.162
0.576
L.W.C.I.R. - - - - Zero Recordables - - - - Zero Lost Workdays 28.4% 15.6% - - CHANGES Change Cost Factor
0.002
0.006
0.020
0.044
Change Schedule Factor 0.014 0.011 0.015 0.013 REWORK Field Rework Cost Factor
-
-
-
-
Field Rework Schedule Factor - - - - 1 Metric definitions are provided in Appendix B. 2 Phase definitions are provided in Appendix C. † = Change in performance from 4th quartile to greatest benefit. ‡ = Change in performance from the average of the 4th and 3rd quartiles to greatest benefit.

93
References Construction Industry Institute, “Owner’s Tool for Project Delivery and Contract Strategy Selection,” Implementation Resource 165-2, Austin, Texas, September 2001. Gould FE and Joyce NE, Construction Project Management, Pearson Education, Inc., Upper Saddle River, New Jersey, 2002. Sanvido VE and Konchar MD, “Project Delivery Systems: CM at Risk, Design-Build, and Design-Bid-Build,” Research Report 133-11, Construction Industry Institute, Austin, Texas, April 1998. Clinger-Cohen Amendment, Public Law 104-106, 40 USC, Chapter 25, 1996.