measuring the business value of recommender systems · rates (e.g., at spotify) • news domain...
TRANSCRIPT

Measuring the Business Value of Recommender Systems
Dietmar Jannach, University of [email protected]

Recommender Systems

Recommender Systems
• A central part of our daily user experience– They help us locate potentially interesting things– They serve as filters in times of information overload– They have an impact user behavior and business
• One of the most successful applications of AI

Recommendations everywhere

Recommendations everywhere

Recommendations everywhere

A field with a tradition
• 1970s: Early roots in IR and what was called “Selective Dissemination of Information”
• 1990s: A field develops, “content‐based” approaches, Collaborative Filtering
• 2000s and beyond: The Netflix Prize and its implications
• Today and the future:– Deep learning everywhere– But are we focusing on
the most important problems?

The recommendation problem
• A very general definition:– “Find a good/optimal selection of items to place in
the recommendation list(s) of users”
• The corresponding questions:– What determines a good/optimal selection?
• Help users find something new?• Show the user alternatives to a certain item?• The diversity of the recommendations?
– Good or optimal for whom?• The consumer, the platform or retailer, the manufacturer, all of them?
Jannach, D. and Adomavicius, G.: "Recommendations with a Purpose". In: Proceedings of the 10th ACM Conference on Recommender Systems (RecSys 2016). Boston, Massachusetts, USA, 2016, pp. 7‐10

An academic problem abstraction
• Recommendation as a matrix completion task
• Goal: – Learn/Optimize a prediction function from the data
• “Offline” quality assessment of algorithms– Prediction error on the test data
Item1 Item2 Item3 Item4 Item5
Alice 5 ? 4 4 ?
User1 3 1 ? 3 3
User2 ? 3 ? ? 5
User3 3 ? 1 5 4
User4 ? 5 5 ? 1

Contrasts
• No “value” perspective in academic abstraction• Simplifying assumption
– Being able to predict the relevance is enough
• Implicit focus on consumer value

In this short talk
• We review how organizations measure the business value of recommenders– Based on a literature review
• Main questions– What measures are used?– What are the reported effects?

Typical quotes about value
• “35% of Amazon.com’s revenue is generated by its recommendation engine.”
• “Netflix says 80 percent of watched content is based on algorithmic recommendations”
• Questions:– How is the (additionally?) generated revenue exactly
measured?– Netflix: What does this mean for the business?

What is measured?
Considering both the impact and value perspective

Click‐Through Rates
• Measures how many clicks are garnered by recommendations– Popular in the news recommendation domain– Google News: 38% more clicks compared to
popularity‐based recommendations– Forbes: 37% improvement through better algorithm
compared to time‐decayed popularity based method– swissinfo.ch: Similar improvements when
considering only short‐term navigation behavior– YouTube: Almost 200% improvement through co‐
visitation method (compared to popular recommendations)

Adoption and Conversion Rates• CTR usually not the ultimate measure
– Cannot know if users actually liked/purchased what they clicked on (also: click baits)
• Therefore– Various, domain‐specific adoption measures
common
• YouTube, Netflix: “Long CTR”/ “Take rate”– only count click if certain amount of vide was
watched

Adoption and Conversion Rates• Alternatives when items cannot be viewed/read:• eBay: “purchase‐through‐rate”, “bid‐through‐
rate”• Other:
– LinkedIn: Contact with employer made– Paper recommendation: “link‐through”, “cite‐
through” – E‐Commerce marketplace: “click‐outs” – Online dating: “open communications”, “positive
contacts per user”

Sales and Revenue
• CTR and adoption measures are good indicators of relevant recommendations
• However: – Often unclear how this translates into business value– Users might have bought an item anyway– Substantial increases might be not relevant for
business when starting from a very low basis
• In addition: – Problem of measuring effects with flat‐rate
subscription models (e.g., Netflix).

Sales and Revenue
• Only a few studies, some with limitations• Video‐on‐demand study: 15% sales increase after
introduction (no A/B test, could be novelty effect)• DVD retailer study:
– 35% lift in sales when using purchased‐based recommendation method compared to “no recommendations”
– Almost no effects when recommendations were based on view statistics
– Choice of algorithm matters a lot

Sales and Revenue
• e‐grocery studies:– 1.8 % direct increase in sales in one study– 0.3 % direct effects in another study– However:
• Up to 26% indirect effects, e.g., where customers were pointed to other categories in the store
• “Inspirational” effect also observed in music recommendation in our own work
• eBay: – 6 % increase for similar item recommendations
through largely improved algorithm– (500 % increase in other study for specific area ..)

Sales and Revenue
• Book store study:– 28 % increase with recommender
compared with “no recommender”; could be seasonal effects
– Drop of 17 % after removing the recommender
• Mobile games (own study)– 3.6 % more purchases through
best recommender– More possible

Effects on Sales Distributions• Goal is maybe not to sell more but different
items• Influence sales behavior of customers
– stimulate cross‐sales– sell off on‐stock items– promote items with higher margin– long‐tail recommendations
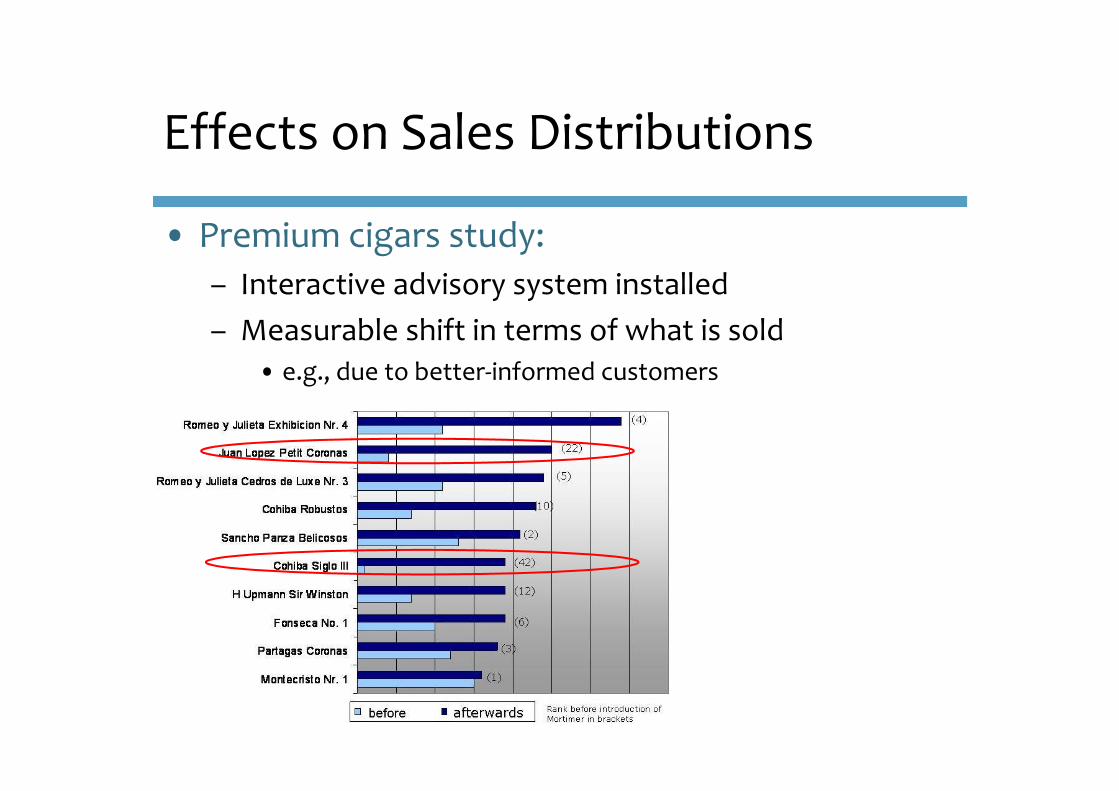
Effects on Sales Distributions
• Premium cigars study: – Interactive advisory system installed– Measurable shift in terms of what is sold
• e.g., due to better‐informed customers

Effects on Sales Distributions• Netflix:
– Measure the “effective catalog size”, i.e., how many items are actually (frequently) views
– Recommenders lead users away from blockbusters
• Online retailer study:– Comparison of different algorithms on sales diversity– Outcomes
• Recommenders tend to decrease the overall diversity• Might increase diversity at individual level though

User Behavior and Engagement• Assumption:
– Higher engagement leads to higher re‐subscription rates (e.g., at Spotify)
• News domain studies:– 2.5 times longer sessions, more sessions when there
is a recommender
• Music domain study: – Up to 50% more user activity
• LinkedIn:– More clicks on job profiles after recommender
introduced

Discussion
• Direct measurements:– Business value can almost be directly measured– Limitations
• High revenue might be easy to achieve (promote discounted products), but not the business goal
• Field tests often last only for a few weeks; field tests sometimes only with new customers (e.g., at Netflix)
• Long‐term indirect effects might be missed.

Discussion
• Indirect measurements:– CTR considered harmful
• Recommendations as click‐baits, but long term dissatisfaction possible
• CTR optimization not in line with optimization for customer relevance
• CTRs and improvements for already popular items easy to achieve
– Adoption and conversion• Mobile game study: Clicks and certain types of conversions were not indicative for business value
– Engagement• Difficult to assess when churn rates are already low

Value of Algorithmic Improvements
• Studies so far show– Introducing a recommender or implementing a more
sophisticated algorithm often translate to large increases of the measures
• Holy Grail in applied machine learning– Find “best” model– Often tiny increases in abstract accuracy measures
• However– Academic research mostly compares algorithms of
the same family

Value of Algorithmic Improvements
• Furthermore– Success of a recommender can depend on many
factors, e.g., user trust, transparency, user interface– swissinfo.ch study:
• 30‐40 % CTR increase with an adaptive algorithm• But: 100 % CTR increase after changing the screen position of the recommendation widget

Value of Offline Experiments

Value of Offline Experiments
• Academic research dominated by – simulation experiments using historical datasets and
abstract performance measures– Easy to do, in principle reproducible, standardized
• However– Not clear if improvements using offline experiments
translate into more effective recommenders

Value of Offline Experiments
• Netflix: “we do not find [offline experiments] to be as highly predictive of A/B test outcomes as we would like”
• Academic studies contrasting offline performance and user perception:– Correspondence almost never established– Higher accuracy does not lead to higher user
satisfaction or quality perception of recommenders• Highly complex models can, e.g., lead to unfamiliar recommendations

Implications and Summary
• Demonstrated business value of recommenders in many domains
• Size of impact however depends on many factors like baselines, domain specifics etc.
• Measuring impact is generally not trivial– Choice of the evaluation measure matters a lot– CTR can be misleading
Implications for academia
• Focus more on recommender systems than solely on algorithms
• Investigate multi‐stakeholder situations– E.g.: hotel recommendation on platform
• hotel owner, platform, customer as stakeholders with potentially conflicting interests
• Offline experiments should measure multiple aspects (e.g., diversity) and consider domain‐specific impacts
• Use broader methodological repertoire– user studies, surveys, simulations

Thank you
• Questions / Discussion