measuring technology achievement of nations and...
TRANSCRIPT

1
Measuring Technology Achievement of Nations and the Capacity to Participate in the Network Age1
M. Desai, S. Fukuda-Parr, C. Johansson, and F. Sagasti2
“development in the network age without the internet is like industrialization without
electricity’. (Castells, 2000)
Disparities among countries in their capacity to create and use technology for
development has persisted for a long time and are now huge. It is likely to become an
increasingly significant factor in determining patterns of global development and poverty
in the 21st century. The last decade’s technological transformations and the emergence of
the global marketplace have raised the stakes for all countries to be technologically
connected – to be able to create, adapt and use global technological innovations. All
countries face the challenges of participating and competing in the technology-based
global marketplace and ensuring that technology is harnessed as a tool for human
development. Yet the nature of those challenges is very different across countries,
because countries vary hugely in their technological capacity and needs. This paper
presents a measurement approach to assessing the technological achievements of a
country as an aid to policy makers in identifying policy priorities. It develops a
Technology Achievement Index (TAI), a composite measure of technological progress
that ranks countries on a comparative global scale.
A new paradigm of technology and development
As we enter the network age, some 2 billion people still do not have access to electricity,
the basic technology of the industrial age. Global technological innovation is highly
concentrated in the high-income OECD countries. These countries, with 14% of world
1 This index was developed for the Human Development Report 2001, Making New Technologies Work for
Human Development published by OUP for UNDP.

2
population, accounted for 86% of the 836,000 patent applications filed globally in 1998,
and 85% of 437,000 scientific articles published worldwide (World Bank 2001 and
WIPO 2000). Of all royalties and license fees earned world wide in 1999, 54% went to
the US and 12% to Japan (World Bank 2001). Despite rapid expansion of the internet in
developing countries, the digital divide is still huge; internet users made up over half of
the US population and nearly a third of the rest of OECD countries, but still 3% or less in
Latin America and East Asia, and 1% or less in South Asia, Sub-Saharan Africa and the
Arab States. (Nua 2001) Even old technologies that have been in existence for over a
century have stalled – in Sub-saharan Africa, per capita electricity consumption has not
risen for the last decade and since 1970, tractor use rate declined from 1.8 per 1000
hectares cultivated to 1.5. (FAO 2000). Telephones are similarly out of reach for much
of the developing world – contrast the lines per capita: 594 per 1000 people in the high-
income OECD countries, and 69 in developing countries on average (ITU 2001).
Wireless phones have spread rapidly in poor countries but even more rapidly in the rich
countries – widening the communications gap.
These gaps in technological advance can further widen developmental divides in the 21st
century of rapid technological transformations that are driving the historic shift from the
industrial to the network age in which the rewards and penalties of global technological
advances are increasing. (Lee 2000) The breakthroughs in biotechnology and ICT are
extending the frontiers of advances in medicine, food production, communications, and
2 The paper reflects the personal views of the authors and do not constitute policies of UNDP and other institutions
to which they belong.

3
many other activities that make possible huge gains in human development. The
technology sector is also the fastest growing sector of the global economy. (Lall 2000).
The challenge of rethinking development policies go beyond considering these
incremental changes, but to a historic shift from the industrial to the network age. Recent
breakthroughs in information communications technologies and biotechnologies have led
to transformations - technological advances are more rapid (e.g. doubling of computing
power every 18 months), more fundamental (e.g. breakthroughs in genetic engineering),
and more dramatically shifting costs (e.g. decline in cost of transmitting trillion bits of
information from US$150,000 to just 12 cents over the last 3 decades). The
developments in biotechnology and information telecommunications technology codify,
store, process and communicate information and knowledge. These advances have
structural and not just incremental impacts because they are pervasive inputs into almost
all human activities and so have have pervasive impacts throughout the society. These
transformations are intertwined with economic globalization leading to a historic shift,
from the industrial to the network age. Production, research, and many other activities
are restructured into ‘networks’ of individuals and organizations specialized into niches
of expertise, with the costs of communications driven down to zero and geographical
boundaries falling.
The network age is changing the way – by whom and where – technological innovation is
created and diffused. Global research and development activities are increasingly
4
privatized and globally networked. Corporations have resources and the ownership
(patents) to finance R & D and take products to market. They take cutting edge
innovations and carry them across the globe through direct foreign investments and
licenses. Entrepreneurs with start-up companies take to market higher risk technological
innovations, financed by venture capital. (Lall 2001) Global markets and global rules of
intellectual property shape incentives and diffusion.
A new map of technology creation and diffusion is emerging. Centres of cutting edge
global technology innovation are the ‘hubs’ that spin in the synergy of four inputs needed
for technology development: knowledge, market opportunities, finance and incentives.
Top scientists from around the world congregate in these hubs. So do foreign direct
investment, technology stocks and venture capital. All in a global network, working
collaboratively, migrating from one global laboratory or incubator to the next – the hubs
and their actors circumnavigate the globe.
Developing technological capacity
Not all countries need to be on the cutting age of global technological advance. But
every country needs the capacity to understand and adapt global technologies for local
needs. It is often mistakenly assumed that technology transfer and diffusion are relatively
easy, that developing countries can simply import and apply knowledge from outside by
obtaining equipment, seeds and pills. But for firms or farms to use a new technology—to
identify its potential benefits, to learn it, adapt it and use it—requires new skills and the
ability to learn and develop new skills with ease (Lall, 2000). For example, a study from
5
Thailand shows that four years of education triples the chance that a farmer will use
fertiliser effectively. (Lipton et at, 2001). Furthermore, with today’s rapidity of
technological advance, the skill and knowledge required is the adaptability to mastering
new technology continuously.
Beyond the capacity to use of adopting new techniques, developing countries also need
capacity to invent and adapt new technologies. Global markets will not develop cures for
malaria, cheap wireless computers, or pest resistant cassava – products with huge gains
for the well being of poor people but not much profit potential. Poor countries need to
foster their own creativity to use both local and global knowledge and science to find
technological solutions to their development problems. Centres of excellence in the
‘South’ can do much to produce technology tools for tackling poverty.
There is a long history of efforts to develop science and technology in developing
countries. In the network age of global markets and technology networks, nurturing
technological creativity and access to global technologies requires flexible, competitive,
dynamic economic environments, institutions in private and public sectors, and a
minimum of physical infrastructure. Three kinds of capacity are particularly critical in
this new environment. First, technological change dramatically raises the premium every
country should place on investing in the education and training of its people. And in the
network age, primary education will not suffice – the advanced science and engineering
skills developed in secondary and tertiary schools, as well as vocational and on-the-job
training are increasingly important. Second, the capacity to develop policies that

6
manage technology such as intellectual property rights and risks of socioeconomic,
environmental and health consequences. Third, the capacity to be connected to and
participate in the global technology development networks.
A number of developing countries – or parts of them – are well connected to global
networks. Concentrated in North America, Western Europe and Japan, global hubs of
innovation are emerging in developing countries such as Bangalore (India), El Ghazala
(Tunisia), Sao Paolo (Brazil), and Gauteng (South Africa). Among the 46 top global
hubs ranked by the Wired magazine ranking, 9 are in Asia, 2 in South America, 2 in
Africa (Hillner 2000) Developing countries are competitive in global markets for
technology intensive products. Korea, Singapore, China, Mexico, Malaysia are among
the top 15 exporters of high tech products and outpace Ireland, Canada, Sweden and other
long industrialized countries. Private sector investments in research based technology
sectors are increasing (Chako). Migration creates diaspora, which in turn creates
business networks. Take the strong link between Silicon Valley and Bangalore, built on
the Indian diaspora. A global labour market is in the making in skill-intensive
professions, and the diasporas strengthen the social ties in economic networks as they
invest at home, but also facilitate contacts for market access. (Kapur 2001)
And most significantly, public and private sector efforts are producing breakthroughs in
adaptations that meet the needs of human development, from the public initiative to
develop a low cost computer in Brazil to India’s simputer, a $300 computer that is
wireless and runs on batteries, to malaria treatment in Vietnam that combined traditional
7
herbal knowledge with modern science. (Simputer Trust 2000; Kirkman 2001, WHO
2000).
Assessing national capacity - Technology Achievement Index (TAI)
Concept and features
In reviewing its technology technology policies, a useful starting point is a realistic
assessment of its current situation in technological progress and in monitoring its
progress. This paper proposes a composite index of technological achievement (TAI) –
reflecting the level of technological progress and capacity of a country to participate in
the network age. A composite index helps a country situate itself relative to others,
especially those farther ahead. Many elements make up a country’s technological
achievement, but an overall assessment is more easily made based on a single composite
measure than on dozens of different measures. Like other composite indices in Human
Development Reports such as the Human Development Index, the TAI is intended to be
used as a starting point to make an overall assessment, to be followed by examining
different indicators in greater detail.
The index aims to capture technological achievements of a country in four dimensions:
• creating new technology;
• diffusing the adoption of new technologies;
• diffusion of long existing technologies that are still basic inputs to the industrial
and the network age;
• building a human skill base for technological creation and adoption.
The index focuses on outcomes and achievements rather than on effort or inputs such as
numbers of scientists, R & D expenditures, or policy environments. This is because the
causal relationship between these inputs and outcomes are not well known. For example,
does a larger number of scientists lead to more output in technological advance? Do
countries that spend more on R & D achieve more?

8
These approaches differ from some other indexes of technological advance that have
been developed. The Technology Index published in the Harvard Competitiveness
Reports focuses on the enabling policy environment for technological innovation and
diffusion.3 The Index of Technological Progress developed by Rodriguez and Wilson
focuses only on information telecommunications technologies.4
The TAI is not a measure of which country is leading in global technology development,
but focuses on how well the country as a whole is participating in creating and using
technology. Take the United States—a global technology powerhouse—and Finland. The
United States has far more inventions and Internet hosts in total than does Finland, but it
does not rank as highly in the index because in Finland the Internet is more widely
diffused and more is being done to develop a technological skill base throughout the
population.
Two particular concerns influenced the design of this index:
first to be as relevant for the broad range of the world’s countries, especially developing
countries with low levels of technological advance, and to be able to discriminate among
these countries. Large proportions of people in these countries still do not have access to
‘older’ technologies such as telephone, electricity, agricultural mechanisation, motorized
transport. It was important to include a broad range of ‘new’ and ‘old’ technologies;
3 Warner3 developed an Economic Creativity Index, of which one component is the Technology index,
itself using either the Innovation Index or the Technology Transfer Index. The index is built in the context of competitiveness ranking countries by the ‘economic creativity index’. The conceptual framework is stated as “nations can link themselves to the global technology engine by being centres of innovation themselves, or by facilitating technology transfer and rapid diffusion of innovation. ‘ But the index is focussed on the enabling environment than on the outcome, and on the environment that prevails in the country that make for technological vitality. There is a great deal of value judgement in the choice of indicators used – for example IPR is seen as an indicator of innovation. There is no indicator to show that aggressive use of compulsory licensing or parallel imports or generic drugs as an indicator of proactive policy to diffuse technology. It covers 61 countries. The innovation index is highly correlated with patents. Full documentation needs to be reviewed. The coverage is mostly OECD countries plus the transition economies and a handful of developing countries. It does not distinguish adequately among developing countries.
4 Rodriguez and Wilson4 developed an ‘Index of Technological Progress’. It focuses on ICT because it is the leading technology and combines televisions, fax machines, personal computers, Internet hosts and mobile phones. Consumption of technologically advanced commodities is not necessarily a good measure for ‘technological advance’ of a country. Thus, for example, high income/low population countries like Kuwait and Qatar rank higher than Korea, Russia.

9
second, to be directly policy relevant to the challenges of the wide range of countries.
Components of the index
The TAI focuses on four dimensions of technological capacity that are important for
reaping the benefits of the network age. The indicators selected relate to important
technology policy objectives for all countries, regardless of their level of development:
• Creation of technology. Not all countries need to be at the leading edge of global
technological development, but the capacity to innovate is relevant for all countries
and constitutes the highest level of technological capacity. The global economy gives
big rewards to the leaders and owners of technological innovation. All countries need
to have capacity to innovate because the ability to innovate in the use of technology
cannot be fully developed without the capacity to create— especially to adapt
products and processes to local conditions. Innovation occurs throughout society, in
formal and informal settings, though the current trend is towards increasing
commercialisation and formalization of the process of innovation. In the absence of
perfect indicators and data series the TAI uses two indicators to capture the level of
innovation in a society. The first is the number of patents granted per capita, to reflect
the current level of invention activities. The second is receipts of royalty and license
fees from abroad per capita, to reflect the stock of successful innovations of the past
that are still useful and hence have market value.
• Diffusion of recent innovations. All countries must adopt innovations to benefit from
the opportunities of the network age. This is measured by diffusion of the Internet—
indispensable to participation—and by exports of high- and medium-technology
products as a share of all exports.
Higher-technology goods present important opportunities to developing countries.
Many high-technology sectors are among the most dynamic in the global economy.
Upgrading the technology content of the manufacturing sector diversifies the
economy and creates opportunities in new markets.
The Internet is far more than a tool for rich countries. By dramatically increasing the
access to information while decreasing the cost, the Internet has vast potential to aid
political participation, increase people’s incomes, and in improving healthcare.

10
• Diffusion of old innovations. Participation in the network age requires diffusion of
many old innovations. Although leapfrogging is sometimes possible, technological
advance is a cumulative process, and widespread diffusion of older innovations is
necessary for adoption of later innovations. Two indicators used here—telephones
and electricity—are especially important because they are needed to use newer
technologies and are also pervasive inputs to a multitude of human activities. Both
indicators are expressed as logarithms and capped at the average OECD level,
however, because they are important at the earlier stages of technological advance but
not at the most advanced stages. Thus while it is important for India to focus on
diffusing electricity and telephones so that all its people can participate in the
technological revolution, Japan and Sweden have passed that stage. Expressing the
measure in logarithms ensures that as the level increases, it contributes less to the
index.
• Human skills. A critical mass of skills is indispensable to technological dynamism.
Both creators and users of new technology need skills. Today’s technology requires
adaptability—skills to master the constant flow of new innovations. The foundations
of such ability are basic education to develop cognitive skills and skills in science and
mathematics. Cognitive skills are hard to define and measure. There have been some
limited attempts of cross-country comparisons of skills, such as the International
Adult Literacy Survey (IALS) and the Trends in Mathematics and Science Study
(TIMSS). They are, however, very limited in their coverage, particularly when it
comes to developing countries. Instead, mean years of schooling is used as a proxy.
This measure gives a good indication of the overall level of basic educational skills in
the population, notwithstanding the fact that education quality varies from country to
country. The second indicator used to gauge human skills is the enrolment in tertiary
education in science, mathematics and engineering. This measure gives an idea of the
current effort in developing advanced skills in science and mathematics. Every
country needs this skill base to be able to adapt and innovate new technologies.
Though it would be desirable to include indicators of vocational training, these data
are not available.
11
Weighting and aggregation
The methodology used to calculate the TAI is similar to the human development index: a
simple average of the dimension of the index, which in turn are calculated based on the
selected indicators. The TAI has eight indicators, two in each of the four dimensions:
• Technology creation, measured by the number of patents granted to residents per
capita and by receipts of royalties and license fees from abroad per capita.
• Diffusion of recent innovations, measured by the number of Internet hosts per capita
and the share of high- and medium-technology exports in total goods exports.
• Diffusion of old innovations, measured by telephones (mainline and cellular) per
capita and electricity consumption per capita.
• Human skills, measured by mean years of schooling in the population aged 15 and
above and the gross tertiary science enrolment ratio.
Two of the indicators, telephones per capita and electricity per capita, are also expressed
as logarithms and capped at OECD average levels, as discussed above. Just as in the HDI,
the value of the different indicators are normalised to a scale from 0 to 1 using goalposts,
such that an indicator value that is equal to the upper goalpost will be normalised to 1 and
a value equal to the lower goalpost will be normalised to 0, according to the following
formula:
valueminimumobserved - valuemaximum observed valueminimum observed - valueactual index Indicator =
However, in the HDI these goalposts are set to reflect a desirable standard. For example,
the upper goalpost for life expectancy is set to 85 years – a society with this life
expectancy can be said to have succeeded in providing a long and healthy life for its
citizens. In contrast, there are no such desirable levels for the indicators in the TAI: they
have in common the property that higher levels are better, but it is impossible to set a
“desirable” level of patenting activity or of high- and medium- technology exports. For
this reason the goalposts used in calculating the index are simply the observed minima
and maxima of the indicators: for each indicator, the best-performing country is assigned
a value of 1 and the worst a value of 0 for the index calculation. The obvious drawback of

12
this approach is that it complicates trend analysis: when values change over time,
goalposts also change, making the indices of two different time points incomparable.
However, the TAI was not designed to measure change over time.
A second important issue is that of weighting of different indicators and dimensions. In
the TAI, the four dimensions each contain two indicators. The index for each dimension
is calculated as the simple average of the indicator indices in that dimension. The TAI, in
turn, is the simple average of these four dimension indices. The indicators in each
dimension are given equal weight, and the dimensions are given equal (one-fourth)
weight in the final index. This means that diffusion of technology is, effectively, given
more weight - two of the four dimensions deal with this. (For an example on how the
index is calculated, appendix 1: Calculating the Technology Achievement Index.)
TAI values and rankings
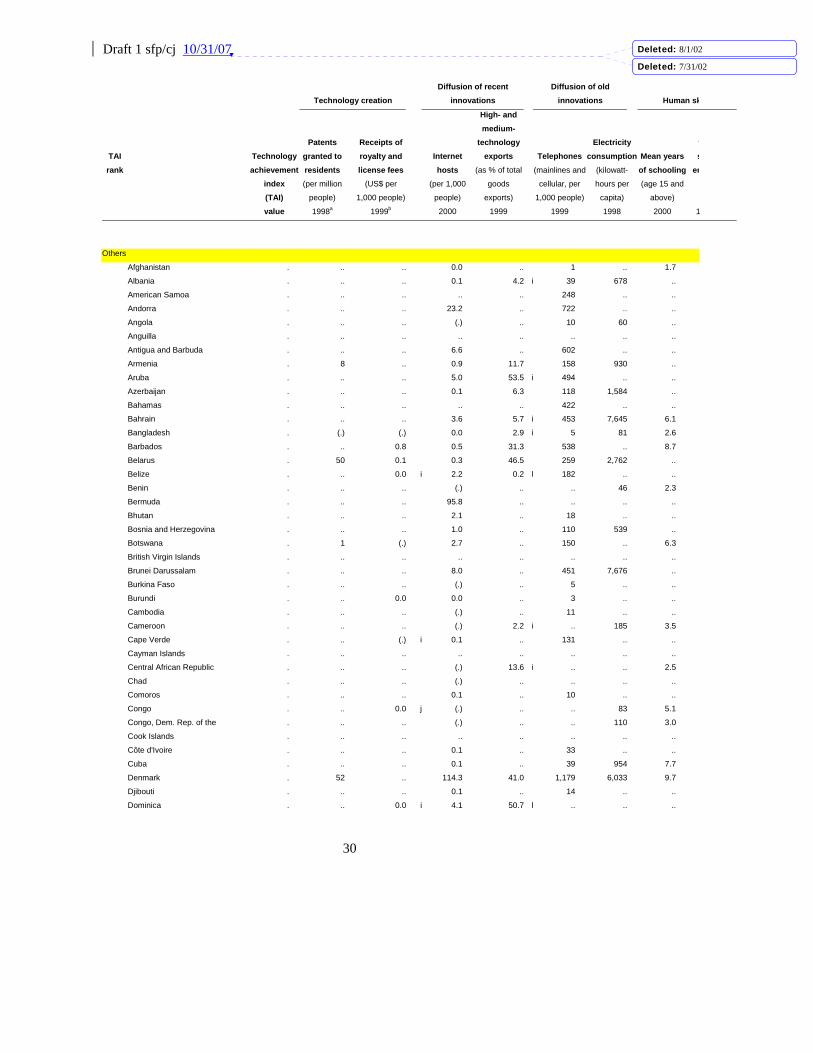
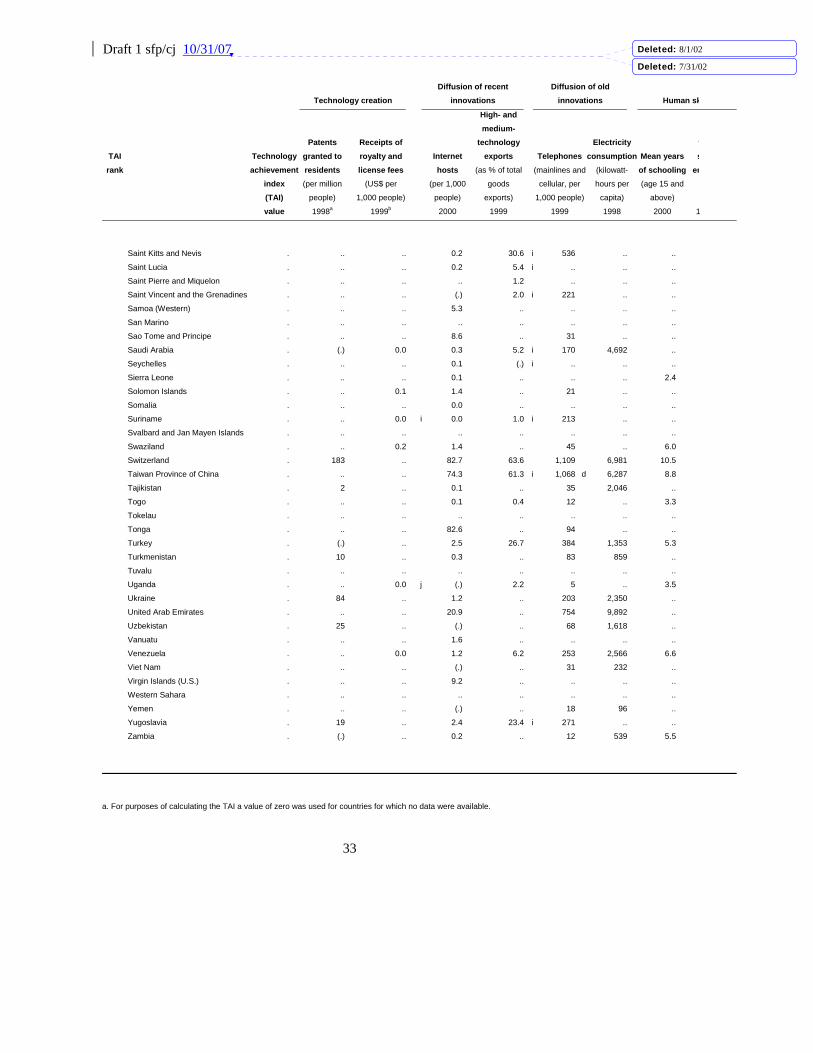
TAI estimates have been prepared for 72 countries for which data are available and of
acceptable quality and are shown in Table 1. For others, data were missing or
unsatisfactory for one or more indicators, so the TAI could not be estimated. For a
number of countries in the developing world, data on patents and royalties are missing.
Because a lack of data generally indicates that little formal innovation is occurring, a
value of zero for the missing indicator was used in these cases.
Global patterns
The results show three trends: a map of great disparities among countries, diversity and
dynamism in technological progress among developing countries and a map of
technology hubs superimposed on countries at different levels of development. The map
of great disparities shows four group of countries (see map 2.1), with TAI values ranging
from 0.744 for Finland to 0.066 for Mozambique. These countries can be considered
leaders, potential leaders, dynamic adopters or marginalized:
13
• Leaders (TAI above 0.5)—topped by Finland, the United States, Sweden and Japan,
this group is at the cutting edge of technological innovation. Technological
innovation is self-sustaining, and these countries have high achievements in
technology creation, diffusion and skills. Coming fifth is the Republic of Korea, and
eighth is Singapore— two countries that have advanced rapidly in technology in
recent decades. This group is set apart from the rest by its higher invention index,
with a marked gap between Israel in this group and Spain in the next.
• Potential leaders (0.35–0.49)—most of these countries have invested in high levels of
human skills and have diffused old technologies widely but innovate little. Each tends
to rank low in one or two dimensions, such as diffusion of recent innovations or of
old inventions. Most countries in this group have skill levels comparable to those in
the top group.
• Dynamic adopters (0.20–0.34)—these countries are dynamic in the use of new
technology. Most are developing countries with significantly higher human skills than
the fourth group. Included are Brazil, China, India, Indonesia, South Africa and
Tunisia, among others. Many of these countries have important high-technology
industries and technology hubs, but the diffusion of old inventions is slow and
incomplete.
• Marginalized (below 0.20)—technology diffusion and skill building have a long way
to go in these countries. Large parts of the population have not benefited from the
diffusion of old technology. These rankings do not shadow income rankings and
show considerable dynamism in several countries with rising technological
achievement— for example, Korea ranks above the United Kingdom, Canada and
other established industrial economies. Ireland ranks above Austria and France. Large
developing countries—Brazil, China, India—do less well than one might expect
because this is not a ranking of “technological might” of a country. Finally,
technology hubs have a limited effect on the index because of disparities within
countries. If the TAI were estimated only for the hubs, such countries would
undoubtedly rank as leaders or potential leaders.

14
These rankings do not shadow income rankings and show considerable dynamism in
countries with rising technological achievements – for example, Korea ranks above the
United Kingdom, Canada and other well established industrial countries. Ireland ranks
above France.
Policy priorities for countries
A look at a country’s TAI ranking and composition can reveal areas of strengths and
weaknesses. This can be illustrated by cases of Brazil, Mexico and India.
BRAZIL - Brazil is one of the most dynamic countries in Latin America, having two
world class technology hubs in Sao Paolo and Rio de Janeiro, being in the forefront of
policy initiatives in global fora in areas such as the management of intellectual property.
Yet the country ranks relatively poorly in the TAI at 43rd place, behind a number of
other developing countries such as Malaysia, Mexico, Argentina, Costa Rica, Chile,
Uruguay, Thailand, South Africa. Why?
First, the diffusion of old inventions – telephones and electricity – has been slow. Brazil
lags far behind such countries as Malaysia, Argentina, and Chile. The likelihood is that
these basic technologies that have been around for a century still have not reached rural
communities and poorer families. And these two technologies are fundamental building
blocks to being fully linked to the new technologies driving progress in the 21st century.
Second, Brazil lags behind in training people with skills. For example, enrolment of
Brazilian students in science and mathematics in post secondary education is only 3.2%
of the age group, far less than 13.2% in Chile, or 7.3 % in Uruguay. Developing countries
that have made the most rapid progress in technological achievements – Korea and
Singapore – have invested heavily in education. Gross enrolment rates are over 20%.
Mean years of schooling in Brazil is 4.9 years compared with 6.8 years in Malaysia, 8.8
years in Argentina and 7.2 years in Mexico and 6.1 years in South Africa. The
proportion of students in universities and other tertiary level institutions enrolled in

15
science and mathematics is only 3.2% of the age group in contrast to over 10% in
Argentina, Chile, and the OECD average.
Technological advance is more rapid and more fundamental than it has been ever before
in any historical era. Workers have to adapt to new technologies all the time, and that
means that basic education is a necessity. Does Brazil’s education system need to be
rethought to meeting the challenges of the network age?
Third, Brazil is doing better than Argentina and Chile in entering the high tech export
markets. But is this leading to linkages to dynamic development of the rest of the
economy? Are the employers providing training for workers? Experience of leading
countries that have successfully used technology for sustained economic growth and for
equitable development show high levels of commitment to diffusion of technology
widely through the population, and to the development of human skills. Diverse
countries such as Finland, Korea, Singapore all adopted very proactive policies for
increasing quantity and quality of education in science and mathematics scoring not only
high in enrolment levels but also in international performance tests, and provided many
incentives for businesses to train their workers. They have also introduced invested
heavily in the diffusion of technology.
While Brazil is leading the way in participating in the network age with its world-class
hubs and pioneering policies for making new technologies work for human development,
it still has a long way to go in spreading technological progress throughout the country, to
all its people.
MEXICO - In contrast to Brazil, Mexico does well in the index, ranking number 32 out
of 72 countries, higher than any other developing country except for the four Asian
Tigers and cubs – Korea, Singapore, Hong Kong and Malaysia, and outranks Argentina,
Costa Rica, Chile, Uruguay and Brazil.

16
While Mexico’s high score is due first and foremost to its success in one measure - 66%
of her export earnings come from high and medium tech products. This is one of the
highest levels in the world. The only other countries that have over 60% of export
earnings from high and medium technology products are the US, Japan, Korea, UK and
Germany, Hungary and Malaysia. This clearly shows Mexico’s extraordinary success in
using new technologies. It shows that the country has responded very positively to the
niche opportunities that are being created in the global market. High tech sector has been
the most rapidly growing sector of the global economy in the last decade.
Yet other indicators show that Mexico has a long way to go in developing its
technological capacity, and in translating that for the purposes of sustainable
development for all its citizens.
First, the diffusion of old inventions – telephones and electricity – has been slow.
Mexico lags far behind such countries as Malaysia, Argentina, and Chile. The likelihood
is that these basic technologies that have been around for a century still have not reached
rural communities and poorer families. And these two technologies are fundamental
building blocks to being fully linked to the new technologies driving progress in the 21st
century. How bad is the technological divide within Mexico?
Second, the development of human skills is another fundamental building block of
technological capacity. Here again, Mexico can do much more, especially in science and
maths training. Mexico has made significant progress in improving overall education,
achieving 7.2 years of schooling, a level comparable to Chile, Uruguay, Italy and
Malaysia. Yet the proportion of students in universities and other tertiary level
institutions enrolled in science and mathematics is only 5% of the age group in contrast to
over 10% in Argentina, Chile, and the OECD average. In an age of rapid technological
advance, workers have to adapt to new technologies all the time, and that means that
basic education is a necessity. Is Mexico’s education system adequate to meeting the
challenges of the network age?

17
Third, much of the exports are from foreign direct investment. Is this leading to linkages
to dynamic development of the rest of the economy in Mexico? Are the employers
providing training for workers? Is Mexico able to climb up the skill ladder and move into
more skill intensive segments of the high and medium tech industries?
Mexico’s high rank in the Technology Achievement Index (TAI) reflects the country’s
technological success in using advanced technology and the ability to compete
successfully in the technology based global marketplace. But there is a long way to go
in diffusing technology – reaching poor people and empowering them to lift themselves
out of poverty. Experience of leading countries that have successfully used technology
for sustained economic growth and for equitable development show high levels of
commitment to diffusion of technology widely through the population, and to the
development of human skills. Diverse countries such as Finland, Korea, Singapore all
adopted very proactive policies for increasing quantity and quality of education in science
and mathematics scoring not only high in enrolment levels but also in international
performance tests, and provided many incentives for businesses to train their workers.
They have also introduced invested heavily in the diffusion of technology.
The Technology Achievement Index for Mexico is a starting point for debates on national
technology policies – not for technology but for the use of technology in development
that is dynamic and equitable.
INDIA – India has achieved showcase success in exploiting the opportunities of the
network age. The ICT industry exports rose from $150 million to nearly $4 billion in
1999. Bangalore is a world - class hub, and other centres of technological innovation are
emerging and developing. Yet the country only 63 of 72 countries, at the bottom of the
group of ‘dynamic adopters’. Why?
First, while the country has considerable capacity in state of the art technological
innovation in new technologies, the TAI shows that these technological advances are not
widespread. The country still only has 28 telephones per 1000 people, compared, for

18
example with 238 in Brazil, or 192 in Mexico. Mean years of schooling is only 5.1,
whereas countries in the ‘potential leaders’ category have achieved more typically 8 or 9
years. It is also well known that rural electrification has a long way to go. The diffusion
of technology has not been widespread, and the world class capacity to innovate has not
been translated into patents or royalties and licence earnings to any significant level.
Second, India is a large country with a very large population. This has tended to dilute
the strengths of the country in worldclass innovations.
Towards further developments
While this index provides interesting information for policy makers, further work is
needed to develop a more complete measure of technological achievements. To do so
requires overcoming the limitations of both concept and data.
In concept, this index measure only technological achievements, not those that are
relevant for human development. Technological achievements measured could be used as
much for destructive purposes as for human well being. The index does not indicate how
well these achievements have been translated into human development. The index is also
incomplete. A nation’s technological achievements are larger and more complex than
what this or any other index can capture. It is impossible to reflect the full range of
technologies—from agriculture to medicine to manufacturing. Many aspects of
technology creation, diffusion and human skills are hard to quantify. And even if they
could be quantified, a lack of reliable data makes it impossible to fully reflect them. For
example, important technological innovations occur in the informal sector and in
indigenous knowledge systems. But these are not recorded and cannot be quantified.
Thus the TAI is constructed using indicators, not direct measures, of a country’s
achievements in four dimensions. It provides a rough summary—not a comprehensive
measure—of a society’s technological achievements.
The index is also incomplete in country coverage - limited in coverage to 72 out of the
nearly 200 countries of the world. While this is broader than that achieved by some of

19
the indexes, it is still far from idea, and is due to lack of data in international series. The
data used to construct the TAI are from international series that are the most widely used
in analyses of technology trends, and so are considered the most reliable of available sets,
as shown below. The range of appropriate indicators is limited to those with reasonable
coverage. Limitations in data series must be taken into account in interpreting TAI values
and rankings. Some countries will have undervalued innovations because patent records
and royalty payments are the only systematically collected data on technological
innovation and leave out valuable but non-commercialized innovations such as those
occurring in the informal sector and in indigenous knowledge systems. Moreover,
national systems and traditions differ in scope and criteria. High numbers of patents may
reflect liberal intellectual property systems. Diffusion of new technologies may be
understated in many developing countries. Internet access is measured by Internet hosts
because these data are more reliable and have better coverage than Internet user data at
the country level. (For detailed description of data sources, see appendix ss)
As technology policies gain prominence in development strategies, it is likely that
progress would be made in overcoming both the data and conceptual limitations.

20
APPENDIX 1 CALCULATING THE TECHNOLOGY ACHIEVEMENT INDEX
This illustration of the calculation of the TAI uses data for New Zealand for various years in 1997–2000.
1. Calculating the technology creation index
Patents and receipts of royalties and license fees are used to approximate the level of
technology creation. Indices for the two indicators are calculated according to the general
formula.
Patent index = (103 – 0) / (994 – 0) = 0.104
Royalty and license fee index = (13.0 – 0.0) / (272.6 – 0.0) = 0.048
The technology creation index is the simple average of these two indices:
Technology creation index = (0.103 + 0.048) / 2 = 0.076
2. Calculating the diffusion of recent innovations index
Using Internet hosts and the share of high- and medium-technology exports in total goods
exports, the same formula is applied to calculate the diffusion of recent innovations
index.
Internet host index = (146.7 – 0.0) / (232.4 – 0.0) = 0.631
High- and medium-technology export index = (15.4 – 0.0) / (80.8 – 0.0) = 0.191
Diffusion of recent innovations index = (0.631 + 0.190) / 2 = 0.411

21
3. Calculating the diffusion of old innovations index
The two indicators used to represent the diffusion of old innovations are telephones
(mainline and cellular) and electricity consumption per capita. For these, the indices are
calculated using the logarithm of the value, and the upper goalpost is the OECD average.
For a detailed discussion see box 2.12 in chapter 2.
Telephony index = (log 720 – log 1) / (log 901 – log 1) = 0.967
For electricity consumption New Zealand’s value is capped at 6,914, since it exceeds the
goalpost.
Electricity index = (log 6,969 – log 22) / (log 6,969 – log 22) = 1.000
Diffusion of old innovations index = (0.966 + 1.000) / 2 = 0.984
4. Calculating the human skills index
The human skills index is calculated according to the general formula, using mean years
of schooling and the gross tertiary science enrolment ratio.
Mean years of schooling index = (11.7 – 0.8) / (12.0 – 0.8) = 0.973
Gross tertiary science enrolment index = (13.1 – 0.1) / (27.3 – 0.1) = 0.474
Human skills index = (0.990 + 0.477) / 2 = 0.725
5. Calculating the technology achievement index
A simple average of the four dimension indices gives us the technology achievement
index.
TAI = (0.076 + 0.411 + 0.984 + 0.725) / 4 = 0.549

22

Draft 1 sfp/cj 10/31/07
23
Appendix 2. Statistics on technology
Technology creation
The capacity for technology creation is a complex and dynamic system that cannot be
fully captured by any particular indicator. And on a global scale, there is very little
quantitative data on technology creation. For these reasons, it is impossible to give an
accurate picture of technology creation capacity using only statistical evidence.
Nonetheless, the data give a good indication of how technology creation capacity is
distributed.
Patents
Patents are an often-used measure of innovation. Patents are clearly a very important
indicator of innovative activity, as has been shown in numerous studies.
What complicates the use of patent data is that patent regulations vary widely from
country to country. Some countries allow patents on e.g. plant varieties or business
methods, others do not. Also, many developing countries have weak national patent
offices, and so residents of these countries might choose to apply for patents in other
countries directly. Business practices in some countries produce large number of patent
applications that are not directly related to innovations. Also, industry structure has an
impact: different industry sectors patent to varying degrees.
There are two main patent indicators used to measure innovation: first time patent
applications filed by residents, and patents granted to residents. For the TAI, patents
granted was chosen, in order not to count applications that were not awarded patents.
However, the time between application and grant is about three years, introducing an
extra time lag in the index.
Receipts of royalties and license fees
Royalties and license fees are, effectively, payments for the use of the intellectual
property. As such, this data gives valuable information on the stock of innovations –
which countries are and have been successful in building capacity for technology
creation. But like all other indicators, these data are not perfect. Widely available data
includes only payments received from abroad – not domestic payments. This penalizes
large countries, who are less internationally oriented. The second problem is that the data
Deleted: 8/1/02
Deleted: 7/31/02

Draft 1 sfp/cj 10/31/07
24
include payments not only for the use of innovations, but also other kinds of intellectual
property, such as publishing rights.
Publications of scientific articles
The production of scientific articles is an established measure of scientific activity. There
are however serious problems with this measure. Some of the most important:
• The selection of publications where articles are counted. Existing measures, such as
ISI, suffer from a heavy Anglo-Saxon bias.
• Scientific articles are only one output of science. It does not directly measure such
things as the quality of higher education or technical skills.
• The output of articles depends very much on the structure of R&D. In some
disciplines, such as medicine, researchers publish many more articles per year than in
others.
These reasons make this indicator unsuitable for the TAI.
Research and development expenditures (as % of GNP)
A country’s expenditure on research and development, usually as a percentage of GNP, is
a widely used measure of a country’s efforts in technology creation. It is not an indicator
of achievement.
Diffusion of technology
Manufacturing
Using technology in manufacturing is on important aspect of technology diffusion. There
are two different approaches to measuring technology content in manufacturing: sectoral
and product-based. The sectoral approach tries to classify different industries according
to their technology intensity. Recent work by OECD in this field highlights some major
problems with this approach. On the conceptual level, it is not clear if technology
intensity means using technology or producing technology. Beyond this conceptual
problem, there are several practical problems. The most serious one is of cross-country
comparability. Any particular industry (e.g. textiles) could be low-technology in one
country but high-technology in another. Especially when comparing developing countries
with developed, this is highly problematic.
Deleted: 8/1/02
Deleted: 7/31/02

Draft 1 sfp/cj 10/31/07
25
The product-based escapes these problems by measuring technology intensity of
products, not sectors. Products in the same category by definition have the same
technology content.
Because of the constraints of available data, exports were used as a proxy for
manufacturing – the structure of exports is closely related to the structure of
manufacturing for most countries.
There are different classification methods for exports by technology content. The OECD
has proposed one, based on product categories in the export classification system known
as Standard Industry and Trade Classification (SITC) revision 3. This is a very detailed
classification system. However, the OECD proposal only studies high-technology
exports. Many poor countries have very little or no high-technology exports. To
distinguish between these it is important to also study take medium-technology exports.
For this reason, a classification by Lall (2000) was used in the TAI. This classification is
based on SITC revision 2, which is less detailed but enables trend analysis. The
classification distuingishes between high-, medium- and low technology exports, as well
as resource-based manufactures and primary products.
Internet / computing
There is a number of ways of measuring Internet diffusion. Of primary interest is how
many people have the possibility to use the Internet should they have the need. However,
as in many other cases the availability of data for developing countries is a major
constraint. For many developing countries, Internet user surveys are of very poor quality
or non-existent. User data are very often estimates with no basis in observations.
Measuring Internet hosts instead of users is an attempt to escape these problems. A host
is, in essence, a computer connected to the Internet. This is straightforward to count.
While the number of Internet-connected computers does not directly tell us how many
users there are, it gives a good indication, and data are available for practically all
countries.
Electricity
Electricity is an old technology that is still not diffused to large parts of the world. It is
crucial to almost all forms of technological development. Therefore, it is of great
importance when measuring technology diffusion. The problem in measurement is that
Deleted: 8/1/02
Deleted: 7/31/02

Draft 1 sfp/cj 10/31/07
26
no data is available on the national level on how many people have access to electricity.
The closest proxy available is consumption – the more people have access to electricity,
the higher consumption. Of course, other factors, such as geography, also influence
consumption.
Telephony / Telefax
Telephones are another old technology where diffusion has stalled, and one that is
important to many other aspects of technological development. Fortunately, telephony
diffusion is also easy to measure. Data on the number of telephone subscribers, both of
landlines and cellular telephones, are widely available.
Human skills
Human skills are vital to be able to adapt to new technological realities, and are thus
included in the TAI. Two indicators are used: mean years of schooling and the gross
tertiary science enrolment ratio.
Mean years of schooling
Mean years of schooling is the average number of years of school completed in the
population of age 15 and above. While this measure does not take into account
differences in the quality of schooling, it gives an indication of the level of human skills
in the population.
To create these estimates, a combination of survey data on school attainment and time-
series data on enrolment was used. The survey data gives information on proportions of
the population that have completed primary, secondary and tertiary education. This data
is available for about 40 percent of data points. Where this data is not available, trend
data on gross enrolment, adjusted for repeaters, is used to estimate the proportions of the
population having attained primary, secondary and tertiary education.
In the second step these attainment levels are multiplied by the duration of the respective
level in different countries to produce an estimate on the average years of schooling.
These estimates are produced for two different groups, the population age 15 and above
and the population age 25 and above. For the TAI, the prior was chosen since it
corresponds more closely to the age of the workforce, particularly in developing
countries.
Deleted: 8/1/02
Deleted: 7/31/02

Draft 1 sfp/cj 10/31/07
27
Enrolment data
Mean years of schooling is an indicator that moves very slowly. To reflect present efforts
in building a technology skill base, it is useful to study enrolment data. While primary
and secondary education are important, we identified tertiary science education is vital to
have the capacity to adapt to new technologies. This indicator refers to the number of
students enrolled in technical and scientific tertiary education, as a share of the
population in the relevant age range (19-24 for most countries). The indicator used in the
TAI is the gross tertiary science enrolment ratio, which refers to the number of students
enrolled in technical and scientific tertiary education, as a share of the population in the
relevant age range (19-24 for most countries).
Deleted: 8/1/02
Deleted: 7/31/02

Draft 1 sfp/cj 10/31/07
28
Table 1 - Technology achievement index
Technology creation Diffusion of recent
innovations Diffusion of old
innovations Human sk
TAI rank
Technology achievement
index (TAI) value
Patents granted to residents(per million
people) 1998a
Receipts of royalty and license fees
(US$ per
1,000 people)
1999b
Internet hosts
(per 1,000
people)
2000
High- and medium-
technology exports
(as % of total
goods
exports)
1999
Telephones (mainlines and
cellular, per
1,000 people)
1999
Electricity consumption
(kilowatt-
hours per
capita)
1998
Mean years of schooling(age 15 and
above)
2000
ts
en
1
Leaders
1 Finland 0.744 187 125.6 200.2 50.7 1,203 d 14,129 e 10.0
2 United States 0.733 289 130.0 179.1 66.2 993 d 11,832 e 12.1
3 Sweden 0.703 271 156.6 125.8 59.7 1,247 d 13,955 e 11.4
4 Japan 0.698 994 64.6 49.0 80.8 1,007 d 7,322 e 9.5
5 Korea, Rep. of 0.666 779 9.8 4.8 66.7 938 d 4,497 10.8
6 Netherlands 0.630 189 151.2 136.0 50.9 1,042 d 5,908 9.4
7 United Kingdom 0.606 82 134.0 57.4 61.9 1,037 d 5,327 9.4
8 Singapore 0.591 8 14.6 h,i 72.3 74.9 901 6,771 7.1
9 Canada 0.589 31 38.6 108.0 48.7 881 15,071 e 11.6
10 Australia 0.587 75 18.2 125.9 16.2 862 8,717 e 10.9
11 Germany 0.583 235 36.8 41.2 64.2 874 5,681 10.2
12 Norway 0.579 103 20.2 i 193.6 19.0 1,329 d 24,607 e 11.9
13 Ireland 0.566 106 110.3 48.6 53.6 924 d 4,760 9.4
14 Belgium 0.553 72 73.9 58.9 47.6 817 7,249 e 9.3
15 New Zealand 0.548 103 13.0 146.7 15.4 720 8,215 e 11.7
16 Austria 0.544 165 14.8 84.2 50.3 987 d 6,175 8.4
17 France 0.535 205 33.6 36.4 58.9 943 d 6,287 7.9
18 Israel 0.514 74 43.6 43.2 45.0 918 d 5,475 9.6
Potential leaders
19 Spain 0.481 42 8.6 21.0 53.4 730 4,195 7.3
20 Italy 0.471 13 9.8 30.4 51.0 991 d 4,431 7.2
21 Czech Republic 0.465 28 4.2 25.0 51.7 560 4,748 9.5
22 Hungary 0.464 26 6.2 21.6 63.5 533 2,888 9.1
23 Slovenia 0.458 105 4.0 20.3 49.5 687 5,096 7.1
24 Hong Kong, China (SAR) 0.455 6 .. 33.6 33.6 1,212 d 5,244 9.4
25 Slovakia 0.447 24 2.7 10.2 48.7 478 3,899 9.3
26 Greece 0.437 (.) 0.0 j 16.4 17.9 839 3,739 8.7
27 Portugal 0.419 6 2.7 17.7 40.7 892 3,396 5.9
28 Bulgaria 0.411 23 .. 3.7 30.0 i 397 3,166 9.5
29 Poland 0.407 30 0.6 11.4 36.2 365 2,458 9.8
30 Malaysia 0.396 .. 0.0 2.4 67.4 340 2,554 6.8
31 Croatia 0.391 9 .. 6.7 41.7 431 2,463 6.3
32 Mexico 0.389 1 0.4 9.2 66.3 192 1,513 7.2
33 Cyprus 0.386 .. .. 16.9 23.0 735 3,468 9.2
Deleted: 8/1/02
Deleted: 7/31/02

Draft 1 sfp/cj 10/31/07
29
Technology creation Diffusion of recent
innovations Diffusion of old
innovations Human sk
TAI rank
Technology achievement
index (TAI) value
Patents granted to residents(per million
people) 1998a
Receipts of royalty and license fees
(US$ per
1,000 people)
1999b
Internet hosts
(per 1,000
people)
2000
High- and medium-
technology exports
(as % of total
goods
exports)
1999
Telephones (mainlines and
cellular, per
1,000 people)
1999
Electricity consumption
(kilowatt-
hours per
capita)
1998
Mean years of schooling(age 15 and
above)
2000
ts
en
1
34 Argentina 0.381 8 0.5 8.7 19.0 322 1,891 8.8
35 Romania 0.371 71 0.2 2.7 25.3 227 1,626 9.5
36 Costa Rica 0.358 .. 0.3 4.1 52.6 239 1,450 6.1
37 Chile 0.357 .. 6.6 6.2 6.1 358 2,082 7.6
Dynamic adopters
38 Uruguay 0.343 2 0.0 j 19.6 13.3 366 1,788 7.6
39 South Africa 0.340 .. 1.7 8.4 30.2 k 270 3,832 6.1
40 Thailand 0.337 1 0.3 1.6 48.9 124 1,345 6.5
41 Trinidad and Tobago 0.328 .. 0.0 i 7.7 14.2 246 3,478 7.8
42 Panama 0.321 .. 0.0 1.9 5.1 251 1,211 8.6
43 Brazil 0.311 2 0.8 7.2 32.9 238 1,793 4.9
44 Philippines 0.300 (.) 0.1 0.4 32.8 77 451 8.2
45 China 0.299 1 0.1 0.1 39.0 120 746 6.4
46 Bolivia 0.277 .. 0.2 0.3 26.0 113 409 5.6
47 Colombia 0.274 1 0.2 1.9 13.7 236 866 5.3
48 Peru 0.271 .. 0.2 0.7 2.9 107 642 7.6
49 Jamaica 0.261 .. 2.4 0.4 1.5 i 255 2,252 5.3
50 Iran, Islamic Rep. of 0.260 1 0.0 i (.) 2.0 133 1,343 5.3
51 Tunisia 0.255 .. 1.1 (.) 19.7 96 824 5.0
52 Paraguay 0.254 .. 35.3 0.5 2.0 137 756 6.2
53 Ecuador 0.253 .. .. 0.3 3.2 122 625 6.4
54 El Salvador 0.253 .. 0.2 0.3 19.2 138 559 5.2
55 Dominican Republic 0.244 .. .. 1.7 5.7 i 148 627 4.9
56 Syrian Arab Republic 0.240 .. .. 0.0 1.2 102 838 5.8
57 Egypt 0.236 (.) 0.7 0.1 8.8 77 861 5.5
58 Algeria 0.221 .. .. (.) 1.0 54 563 5.4
59 Zimbabwe 0.220 (.) .. 0.5 12.0 36 896 5.4
60 Indonesia 0.211 .. .. 0.2 17.9 40 320 5.0
61 Honduras 0.208 .. 0.0 (.) 8.2 57 446 4.8
62 Sri Lanka 0.203 .. .. 0.2 5.2 49 244 6.9
63 India 0.201 1 (.) 0.1 16.6 i 28 384 5.1
Marginalized
64 Nicaragua 0.185 .. .. 0.4 3.6 39 281 4.6
65 Pakistan 0.167 .. (.) j 0.1 7.9 24 337 3.9
66 Senegal 0.158 .. 0.0 j 0.2 28.5 27 111 2.6
67 Ghana 0.139 (.) .. (.) 4.1 12 289 3.9
68 Kenya 0.129 (.) (.) 0.2 7.2 11 129 4.2
69 Nepal 0.081 .. 0.0 0.1 1.9 i 12 47 2.4
70 Tanzania, U. Rep. of 0.080 .. (.) (.) 6.7 6 54 2.7
71 Sudan 0.071 .. 0.0 0.0 0.4 i 9 47 2.1
72 Mozambique 0.066 .. .. (.) 12.2 i 5 54 1.1
Deleted: 8/1/02
Deleted: 7/31/02
Draft 1 sfp/cj 10/31/07
30
Technology creation Diffusion of recent
innovations Diffusion of old
innovations Human sk
TAI rank
Technology achievement
index (TAI) value
Patents granted to residents(per million
people) 1998a
Receipts of royalty and license fees
(US$ per
1,000 people)
1999b
Internet hosts
(per 1,000
people)
2000
High- and medium-
technology exports
(as % of total
goods
exports)
1999
Telephones (mainlines and
cellular, per
1,000 people)
1999
Electricity consumption
(kilowatt-
hours per
capita)
1998
Mean years of schooling(age 15 and
above)
2000
ts
en
1
Others
Afghanistan . .. .. 0.0 .. 1 .. 1.7
Albania . .. .. 0.1 4.2 i 39 678 ..
American Samoa . .. .. .. .. 248 .. ..
Andorra . .. .. 23.2 .. 722 .. ..
Angola . .. .. (.) .. 10 60 ..
Anguilla . .. .. .. .. .. .. ..
Antigua and Barbuda . .. .. 6.6 .. 602 .. ..
Armenia . 8 .. 0.9 11.7 158 930 ..
Aruba . .. .. 5.0 53.5 i 494 .. ..
Azerbaijan . .. .. 0.1 6.3 118 1,584 ..
Bahamas . .. .. .. .. 422 .. ..
Bahrain . .. .. 3.6 5.7 i 453 7,645 6.1
Bangladesh . (.) (.) 0.0 2.9 i 5 81 2.6
Barbados . .. 0.8 0.5 31.3 538 .. 8.7
Belarus . 50 0.1 0.3 46.5 259 2,762 ..
Belize . .. 0.0 i 2.2 0.2 l 182 .. ..
Benin . .. .. (.) .. .. 46 2.3
Bermuda . .. .. 95.8 .. .. .. ..
Bhutan . .. .. 2.1 .. 18 .. ..
Bosnia and Herzegovina . .. .. 1.0 .. 110 539 ..
Botswana . 1 (.) 2.7 .. 150 .. 6.3
British Virgin Islands . .. .. .. .. .. .. ..
Brunei Darussalam . .. .. 8.0 .. 451 7,676 ..
Burkina Faso . .. .. (.) .. 5 .. ..
Burundi . .. 0.0 0.0 .. 3 .. ..
Cambodia . .. .. (.) .. 11 .. ..
Cameroon . .. .. (.) 2.2 i .. 185 3.5
Cape Verde . .. (.) i 0.1 .. 131 .. ..
Cayman Islands . .. .. .. .. .. .. ..
Central African Republic . .. .. (.) 13.6 i .. .. 2.5
Chad . .. .. (.) .. .. .. ..
Comoros . .. .. 0.1 .. 10 .. ..
Congo . .. 0.0 j (.) .. .. 83 5.1
Congo, Dem. Rep. of the . .. .. (.) .. .. 110 3.0
Cook Islands . .. .. .. .. .. .. ..
Côte d'Ivoire . .. .. 0.1 .. 33 .. ..
Cuba . .. .. 0.1 .. 39 954 7.7
Denmark . 52 .. 114.3 41.0 1,179 6,033 9.7
Djibouti . .. .. 0.1 .. 14 .. ..
Dominica . .. 0.0 i 4.1 50.7 l .. .. ..
Deleted: 8/1/02
Deleted: 7/31/02

Draft 1 sfp/cj 10/31/07
31
Technology creation Diffusion of recent
innovations Diffusion of old
innovations Human sk
TAI rank
Technology achievement
index (TAI) value
Patents granted to residents(per million
people) 1998a
Receipts of royalty and license fees
(US$ per
1,000 people)
1999b
Internet hosts
(per 1,000
people)
2000
High- and medium-
technology exports
(as % of total
goods
exports)
1999
Telephones (mainlines and
cellular, per
1,000 people)
1999
Electricity consumption
(kilowatt-
hours per
capita)
1998
Mean years of schooling(age 15 and
above)
2000
ts
en
1
East Timor . .. .. .. .. .. .. ..
Equatorial Guinea . .. .. 0.0 .. .. .. ..
Eritrea . .. .. (.) .. 7 .. ..
Estonia . 1 1.2 43.1 31.9 624 3,531 ..
Ethiopia . .. .. (.) .. 3 22 ..
Faeroe Islands . .. .. 52.5 3.9 798 .. ..
Falkland Islands (Malvinas) . .. .. .. .. .. .. ..
Fiji . .. .. 0.9 .. 130 .. 8.3
French Guiana . .. .. 1.4 .. 386 .. ..
French Polynesia . .. .. 9.3 .. 321 .. ..
Gabon . .. .. (.) 0.9 i 39 749 ..
Gambia . 1 .. (.) .. 27 .. 2.3
Georgia . 67 .. 0.4 .. 142 1,257 ..
Gibraltar . .. .. .. .. 935 d .. ..
Greenland . .. .. 70.8 0.6 698 .. ..
Grenada . .. .. 0.1 1.7 l 337 .. ..
Guadeloupe . .. .. 2.3 .. 643 .. ..
Guam . .. .. 1.5 .. .. .. ..
Guatemala . (.) .. 0.5 16.0 86 322 3.5
Guinea . .. .. (.) .. 9 .. ..
Guinea-Bissau . .. .. (.) .. .. .. 0.8
Guyana . .. .. 0.1 .. 78 .. 6.3
Haiti . .. .. 0.0 3.2 i 12 33 2.8
Holy See . .. .. .. .. .. .. ..
Iceland . 15 .. 232.4 9.8 1,297 20,150 8.8
Îles Turques et Caïques . .. .. .. .. .. .. ..
Îles Wallis et Futuna . .. .. .. .. .. .. ..
Iraq . .. .. 0.0 .. 30 1,359 4.0
Isle of Man . .. .. .. .. .. .. ..
Jordan . .. .. 0.2 .. 105 1,205 6.9
Kazakhstan . 55 .. 0.6 15.0 111 2,399 ..
Kiribati . .. .. 1.0 .. 45 .. ..
Korea, Dem. Rep. . .. .. .. .. 46 .. ..
Kuwait . .. .. 4.4 6.8 398 13,800 6.2
Kyrgyzstan . 14 .. 1.1 10.9 77 1,431 ..
Lao People's Dem. Rep. . .. .. 0.0 .. 8 .. ..
Latvia . 71 4.3 13.4 12.4 412 1,879 ..
Lebanon . .. .. 2.3 .. .. 1,820 ..
Lesotho . .. 6.5 0.1 .. .. .. 4.2
Liberia . .. .. (.) .. .. .. 2.5
Libyan Arab Jamahiriya . .. .. (.) 1.8 i .. 3,677 ..
Deleted: 8/1/02
Deleted: 7/31/02

Draft 1 sfp/cj 10/31/07
32
Technology creation Diffusion of recent
innovations Diffusion of old
innovations Human sk
TAI rank
Technology achievement
index (TAI) value
Patents granted to residents(per million
people) 1998a
Receipts of royalty and license fees
(US$ per
1,000 people)
1999b
Internet hosts
(per 1,000
people)
2000
High- and medium-
technology exports
(as % of total
goods
exports)
1999
Telephones (mainlines and
cellular, per
1,000 people)
1999
Electricity consumption
(kilowatt-
hours per
capita)
1998
Mean years of schooling(age 15 and
above)
2000
ts
en
1
Liechtenstein . .. .. .. .. 902 d .. ..
Lithuania . 27 (.) 7.5 29.2 401 1,909 ..
Luxembourg . 202 272.6 49.5 34.0 1,211 12,400 ..
Macau . .. .. 0.7 3.7 610 .. ..
Macedonia, TFYR . 19 1.1 1.9 23.8 i 258 .. ..
Madagascar . .. (.) i 0.1 3.0 .. .. ..
Malawi . .. .. 0.0 .. 6 .. 3.2
Maldives . .. 0.0 j 1.7 .. 90 .. ..
Mali . .. .. (.) .. .. .. 0.9
Malta . 18 0.0 19.5 72.0 609 3,719 ..
Marshall Islands . .. .. 0.1 .. .. .. ..
Martinique . .. .. 1.6 .. 698 .. ..
Mauritania . .. 0.0 i (.) .. 6 .. ..
Mauritius . .. 0.0 5.2 4.3 312 .. 6.0
Micronesia, Fed. Sts. . .. .. 6.2 .. .. .. ..
Moldova, Rep. of . 42 (.) 0.7 6.2 131 689 ..
Monaco . 641 .. .. .. .. .. ..
Mongolia . 56 0.4 0.1 3.2 i 53 .. ..
Montserrat . .. .. .. .. .. .. ..
Morocco . 3 0.2 0.1 12.4 i 66 443 ..
Myanmar . .. (.) 0.0 .. 6 64 2.8
Namibia . .. 3.5 i 3.7 .. 82 .. ..
Nauru . .. .. .. .. .. .. ..
Netherlands Antilles . .. .. 0.9 .. .. 4,118 ..
New Caledonia . .. .. 2.3 .. 362 .. ..
Niger . .. .. (.) .. .. .. 1.0
Nigeria . .. .. (.) 0.4 .. 85 ..
Niue . .. .. .. .. .. .. ..
Norfolk Island . .. .. .. .. .. .. ..
Northern Mariana Islands . .. .. 0.5 .. 526 .. ..
Occupied Palestinian Territory . .. .. .. .. .. .. ..
Oman . .. .. 1.4 13.2 139 2,828 ..
Palau . .. .. .. .. .. .. ..
Papua New Guinea . .. .. 0.1 .. 14 .. 2.9
Pitcairn . .. .. .. .. .. .. ..
Puerto Rico . .. .. 0.6 .. 542 .. ..
Qatar . .. .. .. .. 406 13,912 ..
Reunion . .. .. (.) .. .. .. ..
Russian Federation . 131 0.3 3.5 16.0 220 3,937 ..
Rwanda . .. 0.0 0.1 .. 3 .. 2.6
Saint Helena . .. .. .. .. .. .. ..
Deleted: 8/1/02
Deleted: 7/31/02
Draft 1 sfp/cj 10/31/07
33
Technology creation Diffusion of recent
innovations Diffusion of old
innovations Human sk
TAI rank
Technology achievement
index (TAI) value
Patents granted to residents(per million
people) 1998a
Receipts of royalty and license fees
(US$ per
1,000 people)
1999b
Internet hosts
(per 1,000
people)
2000
High- and medium-
technology exports
(as % of total
goods
exports)
1999
Telephones (mainlines and
cellular, per
1,000 people)
1999
Electricity consumption
(kilowatt-
hours per
capita)
1998
Mean years of schooling(age 15 and
above)
2000
ts
en
1
Saint Kitts and Nevis . .. .. 0.2 30.6 i 536 .. ..
Saint Lucia . .. .. 0.2 5.4 i .. .. ..
Saint Pierre and Miquelon . .. .. .. 1.2 .. .. ..
Saint Vincent and the Grenadines . .. .. (.) 2.0 i 221 .. ..
Samoa (Western) . .. .. 5.3 .. .. .. ..
San Marino . .. .. .. .. .. .. ..
Sao Tome and Principe . .. .. 8.6 .. 31 .. ..
Saudi Arabia . (.) 0.0 0.3 5.2 i 170 4,692 ..
Seychelles . .. .. 0.1 (.) i .. .. ..
Sierra Leone . .. .. 0.1 .. .. .. 2.4
Solomon Islands . .. 0.1 1.4 .. 21 .. ..
Somalia . .. .. 0.0 .. .. .. ..
Suriname . .. 0.0 i 0.0 1.0 i 213 .. ..
Svalbard and Jan Mayen Islands . .. .. .. .. .. .. ..
Swaziland . .. 0.2 1.4 .. 45 .. 6.0
Switzerland . 183 .. 82.7 63.6 1,109 6,981 10.5
Taiwan Province of China . .. .. 74.3 61.3 i 1,068 d 6,287 8.8
Tajikistan . 2 .. 0.1 .. 35 2,046 ..
Togo . .. .. 0.1 0.4 12 .. 3.3
Tokelau . .. .. .. .. .. .. ..
Tonga . .. .. 82.6 .. 94 .. ..
Turkey . (.) .. 2.5 26.7 384 1,353 5.3
Turkmenistan . 10 .. 0.3 .. 83 859 ..
Tuvalu . .. .. .. .. .. .. ..
Uganda . .. 0.0 j (.) 2.2 5 .. 3.5
Ukraine . 84 .. 1.2 .. 203 2,350 ..
United Arab Emirates . .. .. 20.9 .. 754 9,892 ..
Uzbekistan . 25 .. (.) .. 68 1,618 ..
Vanuatu . .. .. 1.6 .. .. .. ..
Venezuela . .. 0.0 1.2 6.2 253 2,566 6.6
Viet Nam . .. .. (.) .. 31 232 ..
Virgin Islands (U.S.) . .. .. 9.2 .. .. .. ..
Western Sahara . .. .. .. .. .. .. ..
Yemen . .. .. (.) .. 18 96 ..
Yugoslavia . 19 .. 2.4 23.4 i 271 .. ..
Zambia . (.) .. 0.2 .. 12 539 5.5
a. For purposes of calculating the TAI a value of zero was used for countries for which no data were available.
Deleted: 8/1/02
Deleted: 7/31/02
Draft 1 sfp/cj 10/31/07
34
Technology creation Diffusion of recent
innovations Diffusion of old
innovations Human sk
TAI rank
Technology achievement
index (TAI) value
Patents granted to residents(per million
people) 1998a
Receipts of royalty and license fees
(US$ per
1,000 people)
1999b
Internet hosts
(per 1,000
people)
2000
High- and medium-
technology exports
(as % of total
goods
exports)
1999
Telephones (mainlines and
cellular, per
1,000 people)
1999
Electricity consumption
(kilowatt-
hours per
capita)
1998
Mean years of schooling(age 15 and
above)
2000
ts
en
1
b. For purposes of calculating the TAI a value of zero was used for non-OECD countries for which no data were available.
c. Data refer to the most recent year available during the period specified.
d. For purposes of calculating the TAI the weighted average value for OECD countries (901) was used.
e. For purposes of calculating the TAI the weighted average value for OECD countries (6,969) was used.
f. Data refer to the most recent year available during the period 1989-94.
g. Data are based on preliminary UNESCO estimates of the tertiary gross enrolment ratio.
h. Data from national sources.
i. Data refer to 1998.
j. Data refer to 1997.
k. Data refer to the South African Customs Union, which comprises Botswana, Lesotho, Namibia, South Africa and Swaziland.
l. Data refer to medium-technology exports only.
Source:
Column 1: calculated on the basis of data in columns 2-9; see technical note 2 for details
Column 2: WIPO 2001a
Column 3: unless otherwise noted, World Bank 2001h
Column 4: ITU 2001a
Column 5: calculated on the basis of data on exports from Lall 2001 and UN 2001a
Column 6: ITU 2001b
Column 7: World Bank 2001h
Column 8: Barro and Lee 2000
Column 9: calculated on the basis of data on gross tertiary enrolment ratios and tertiary science enrolment from UNESCO 1998, 1999 and 2001a.
Deleted: 8/1/02
Deleted: 7/31/02
Draft 1 sfp/cj 10/31/07
35
References
Barré, Rémi. 2001. “Sense and nonsense of S&T productivity indicators”
World Economic Forum. 1999. The Global Competitiveness Report 1999. New York:
Oxford University Press.
Castells, 2000, ‘Information, Technology and Global Capitalism’, in Hutton and Giddens,
eds. On the Edge, essays on a Runaway World, London, Jonathan Cape
Fleischer, Manfred. 1999. “Innovation, Patenting, and Performance.” Economie
Appliquée 52 (2):95-119.
WIPO (World Intellectual Property Organization). 2000. Industrial Property Statistics.
Publication A. Geneva.
Hatzichronoglou, Thomas. 1997. “Revision of the High-Technology Sector and Product
Classification.” STI Working Paper 1997/2. OECD Directorate for Science, Technology
and Industry, Paris.
IMD (International Institute for Management Development). The world competitiveness
yearbook 2000. Lausanne: IMD International.
Lall, 2000 xxx (background paper for HDR2001_
Lall, Sanjaya. 2000. “The Technological Structure and Performance of Developing
Country Manufactured Exports, 1985-98.” Oxford Development Studies 28 (3):337-69.
UNESCO (United Nations Educational, Scientific and Cultural Organization. 1998.
World Science Report 1998. Paris.
Lee, Jong-Wha, 2001, “Education for Technology Readiness: Prospects for Developing
countries”, Journal of Human Development, vol 2 number 1, January 2001
Deleted: 8/1/02
Deleted: 7/31/02

Draft 1 sfp/cj 10/31/07
36
Lipton. Blackman and .Sinha, xxxxx background paper for HDR2001
Rodriguez and Wilson, Are Poor Countries Losing the Information Revolution? University of Maryland at College Park, May 2000, INFODEV working paper, World Bank. Francisco Sagasti, The Knowledge Explosion: 50 years of emerging divide. HDR
Background Paper, October 2000
Warner, Andrew, ‘Economic Creativity’ in World Competitiveness Report, 2000,
Harvard University
Wired Magazine, July 2000
World Economic Forum. 2000. The Global Competitiveness Report 2000. New York:
Oxford University Press.
Deleted: 8/1/02
Deleted: 7/31/02