measuring stream temperature using data loggers ... · pdf filemeasuring stream temperature...
TRANSCRIPT
Aquatic Research and Development Section Ontario Ministry of Natural Resources
Aquatic Research Series 2010-03
Measuring Stream Temperatures Using Data Loggers Laboratory and Field Techniques
Nicholas E Jones and Laurie Allin
1
Cette publication hautement speacutecialiseacutee Measuring Stream Temperature Using Data Loggers Laboratory and Field Techniques nrsquoest disponible qursquoen anglais en vertu du Regraveglement 41197 qui en exempte lrsquoapplication de la
Loi sur les services en franccedilais Pour obtenir de lrsquoaide en franccedilais veuillez communiqueravec le ministegravere des Richesses naturelles au TomJohnstonontarioca
Version 30 March 2010
1 Aquatic Research and Development Section Ontario Ministry of Natural Resources Trent University DNA Building 2140 East Bank Drive Peterborough ON K9J 7B8
2 Aquatic Research and Development Section Ontario Ministry of Natural Resources RR4 41 Hatchery Lane Picton ON K0K 2T0
copy 2010 Queenrsquos Printer for Ontario Printed in Ontario Canada
MNR 52639 ISBN 978-1-4435-2795-8 (PDF)
This publication was produced by
Aquatic Research and Development Section Ontario Ministry of Natural Resources 2140 East Bank Drive Peterborough Ontario K9J 8M5
Online link to report can be found at Ontariocaaquaticresearch
Citation Jones NE and L Allin 2010 Measuring Stream Temperature Using Data Loggers Laboratory and Field Techniques Ontario Ministry of Natural Resources Aquatic Research and Development Section OMNR-Trent University Peterborough Ontario 28 pp
Please send comments and suggestions on the manual to the River and Stream Ecology Lab Aquatic Research and Development Section nicholasjonesontarioca
Aquatic Research amp Development Section Ontariocaaquaticresearch
SUMMARY
Stream temperature is an aspect of water quality that affects every aquatic organism and although not overly complex to measure reliable measurements require careful planning Stream temperatures vary considerably over both time and location Although there has been some success relating single point-in-time temperature measurements to the thermal class of a stream we strongly advocate additional data gathered via data loggers to provide a time series that describes a streamrsquos thermal regime eg magnitude duration and frequency predictability and flashiness The methods described in this document were developed from considerable field experience and are intended to assist others interested in measuring water temperature in flowing waters In this guide we provide advice in four areas including (1) choosing a temperature data logger (2) laboratory procedures (3) field procedures and (4) retrieving and handling time-series temperature data We also introduce ThermoStat a tool for analyzing data in a consistent format for reporting purposes This report is intended to help people conduct successful fi eld measurements to maximise the quality of their data and the information obtained
REacuteSUMEacute
La tempeacuterature de la vapeur est un aspect de la qualiteacute drsquoeau qui influe sur tous les organismes aquatiques et mecircme si sa mesure nrsquoest pas excessivement complexe elle demande quand mecircme une preacuteparation soigneuse Les tempeacuteratures de vapeur varient de faccedilon consideacuterable dans lrsquoespace et dans le temps Mecircme si nous avons pu relier une mesure de tempeacuterature agrave un moment donneacute agrave la classe thermique de la vapeur nous encourageons fortement la collecte des donneacutees suppleacutementaires agrave lrsquoaide drsquoenregistreurs de donneacutees pour obtenir une seacuterie chronologique deacutecrivant le reacutegime thermique drsquoune vapeur (c agrave d lrsquoampleur la dureacutee et la constance et le niveau de crue eacuteclair) Les meacutethodes deacutecrites dans le preacutesent document ont eacuteteacute eacutelaboreacutees en se fondant sur les vastes expeacuteriences sur le terrain et visent agrave aider drsquoautres parties inteacuteresseacutees agrave mesurer la tempeacuterature de lrsquoeau mouvante Le preacutesent guide contient des conseils dans quatre domaines soit (1) le choix de lrsquoenregistreur de donneacutees de tempeacuterature (2) les meacutethodes de laboratoire (3) les marches agrave suivre sur le terrain et (4) la reacutecupeacuteration et la manutention drsquoune seacuterie chronologique de donneacutees de tempeacuterature Nous preacutesentons eacutegalement lrsquooutil ThermoStat utiliseacute pour analyser avec coheacuterence les donneacutees aux fins drsquoeacutetablissement de rapports Ce rapport vise agrave aider les personnes agrave effectuer de bonnes mesures sur le terrain pour accroicirctre autant que possible la qualiteacute de leurs donneacutees et de lrsquoinformation obtenue
Ministry of Natural Resources
3
Table of Contents
Introduction 5
Choosing a Temperature Data Logger 7
Size of loggers 8
Accuracy and precision 9
Type of data logger housing and durability 9
Choosing a Sampling Interval 11
Laboratory Procedures 12
Calibrating your data logger 12
Launching Procedures 12
Field Procedures 13
Placing the Logger in the Stream 14
Protecting your Data Logger in the Field 17
Documenting Logger Location and Site information 18
Safety 19
Data Retrieval and Handling 21
Exporting Data from Boxcar and Hoboware for ThermoStat 22
Acknowledgments 23
Appendix 25
Equipment List 25
Field Forms 26
Site Identification Summary 26 Stream Water Temperature Data Logger 27
4
Introduction Thermal regime is of central importance in sustaining the ecological integrity of aquatic
ecosystems and limits the distribution and abundance of riverine species Water
temperature can vary at small-scales (eg groundwater seeps) to large-scales (eg
stream reaches) Similarly water temperature can vary within hourly to annual time
scales Temperature influences the overall water quality rates of nutrient turnover
metabolic activity growth rates timing of migration and spawning events and
distribution of stream organisms Species-specific thermal preferences and tolerances
are the critical biological elements that define thermal habitat Water temperature has
been described as the lsquoabiotic master factorrsquo for fishes (Brett 1971 Poff et al1997)
More recently the ldquonatural thermal regimerdquo and its components magnitude frequency
duration timing and rate of change have been acknowledged as fundamental variables
that must be incorporated in environmental flow standards (sensu Poff et al 1997 Chu
et al 2009 Olden and Naiman 2009)
Stream water temperatures are influenced by the source of stream water (eg ground
water surface runoff lake and wetland storage) solar radiation (including shading) air
temperature land use practices climate precipitation and geologic setting (Stevens et
al 1975) Temperature largely determines the formation persistence and break-up of
river ice which are important aspects of the physical character of streams and fish
habitat Super-cooled water supports the formation of ice crystals in the water column
that accumulate as frazil ice in turbulent water this can be deposited on the riverbed to
form anchor ice Anchor ice can grow to such an extent that it occludes the channel It
can build up in shallow areas forming ice dams that cause back-water effects As
anchor ice thickens it can become buoyant and float away often taking with it parts of
the substratum Frazil ice can have direct deleterious effects on fish by damaging the
delicate tissues of gills even plugging the gills and suffocating the fish (Brown et al
1994) Frazil can also accumulate beneath the ice sheet of slower reaches of the river
forming hanging dams which can fill most of the volume of pools and eliminate living
space for fish (Cunjak and Caissie 1994)
5
Thermal alteration is the anthropogenic alteration of the natural thermal regime eg
increase or decrease of water temperature In general at a local scale increases in
stream temperature arise from damming of water loss of riparian vegetation widening
of river channels input of water from storm water ponds and inputs of effluent water
used as a coolant by nuclear and coal-fired generating stations and industrial
manufacturers At the watershed scale water temperatures in river systems may be
altered by land-use within the watershed such as urban development agriculture or
forest management Stream temperature regimes are difficult to quantify but available
evidence suggests that stream temperature regimes in many parts of North America are
now different from those that existed a century earlier Alteration of these regimes in
turn may contribute to a decline of fishes eg salmonids To best conserve and restore
river ecosystems managers should restore the rivers temperature regime as closely as
possible to its natural pattern of variability
In 2004 the Ontario Ministry of Natural Resources River and Stream Ecology Lab
embarked on a long-term study on the regional and temporal variation in the thermal
habitat of Great Lakes streams During our six years of fieldwork we deployed over 400
temperature data loggers across the Great Lakes Basin In addition we received over
1000 files of temperature data from various agencies across Ontario Many of the
agencies we contacted wanted to know more about assessing stream temperature and
thermal regime characteristics using data loggers while others wanted some method to
store their temperature data for quick and orderly access We learned a great deal
during our first year of sampling and data handling and thought this should be shared
amongst others looking to deploy temperature loggers to understand the thermal
characteristics of their streams In addition to our on experiences we reviewed other
protocols and reports in the primary and gray literature eg Dunham et al 2001 2005
Lewis et al 2000 Zaroban 1999
The purpose of this report is to provide guidance on the choice of logger logger
deployment and retrieval and data storage for people collecting stream temperature
data This report is intended to help people reduce the observational variability as
6
opposed to natural variability of temperature data and to avoid differences in sampling
and analysis technique While we do not specifically endorse the Onset Computer
Corporation series of temperature data loggers most of our experience has been with
these loggers and most people collecting stream temperature data in Ontario use Onset
products
Rationale for Measuring Stream Water Temperature Before heading out into the field or buying your loggers you should understand the
rationale for the proposed data collection Ask yourself the following questions
bull what data are to be collected time places
bull duration of data collection and
Examples of why we measure temperature include monitoring
bull pre- and post-treatment water temperature regimes
bull temperatures for fish related concerns (eg cold cool and warmwater guilds)
bull temperatures in relation to point source influences (eg warm or cold water discharges)
bull temperature patterns to validate or parameterize water temperature models (eg
Bartholow 2000)
bull temperatures to model responses of aquatic biota (eg Eaton et al 1995)
Choosing a Temperature Data Logger This is the first important step in measuring stream water temperature Similar to trends
in the personal computer industry the sophistication of temperature data loggers has
increased during the past decade in mainly two directions smaller and greater memory
capacity There are many different types of data loggers on the market with a countless
array of options Be sure your logger meets your needs Think about the nature or type
of stream system you plan to monitor or study Consider the following options and
features when purchasing a logger longevity (memory capacity and battery life) size
accuracy precision durability waterproofness battery type and reliability We strongly
advise that you discuss your needs with local distributors of stream data loggers and
with people who use loggers regularly
7
recording length (months)
(
Longevity memory capacity and battery life
Memory capacity is important if temperatures are to be recorded for long periods (eg gt
1 year) or short sampling intervals (eg lt15 min) Most data loggers today have a
minimum of 21k of memory that allows 21580 measurements More measurements are
not necessarily better because data handling may become cumbersome It may be
useful to create a table illustrating the number of observations generated given an
interval and recording length (Table 1) or how many days the logger can be used base
on various sampling intervals (Table 2) For example 12 months recording with an
interval of 30 minutes will collect 17280 measurements
Table 1 The number of observations generated using varying time intervals (minutes)
Sampling interval (minutes) and number of observations Months 120 60 30 20 15 10
12 4320 8640 17280 25920 34560 43200
8 2880 5760 11520 17280 23040 28800
6 2160 4320 8640 12960 17280 21600
4 1440 2880 5760 8640 11520 14400
2 720 1440 2880 4320 5760 7200
Table 2 The number of days that can be recorded using varying time intervals (minutes) for a logger capable of 42000 measurements
Sampling interval (minutes) and number of observations
10 15 20 30 60 120
No of Days 180 270 361 541 1084 2168
Size of loggers
Most temperature data loggers these days are small (eg 10 cm) although some may
require larger submersible cases Generally the size of the logger is not an issue
however the smaller models may be more difficult to find in the field which might be
beneficial if vandalism or theft is a problem at the sampling locations
8
Accuracy and precision
Most data loggers when properly functioning are very accurate and capable of
relatively precise plusmn1 to 02degC However this accuracy may vary slightly with temperature
eg 0deg to 50degC Most manufacturers provide detailed information on the accuracy and
precision of their instruments We found that loggers were accurate as described by
manufactures specifications eg accuracy plusmn 02degC at 0deg to 20degC Bit resolution refers
to the smallest change that can be detected by the logger and is provided by most
manufactures For example some models with 8 bit resolution are sensitive to 016degC
whereas higher bit models (12-bit) are capable of more precise measurements eg
002degC
Type of data logger housing and durability
Some data loggers are not submersible and must be deployed within sealed waterproof
housings If you decide to use loggers that are made waterproof by using submersible
cases then you must consider two challenges Data loggers within waterproof housings
are not in direct contact with the water and are actually recording air temperatures
within the sealed housing Heat transfer between the air within the housing and the
surrounding water is not immediate but air temperatures within the housing should
track surrounding water temperatures (Figure 1) In laboratory tests where loggers were
subjected to extreme temperature differences there is a short time lag (~30 mins)
required for the air within the housing to equilibrate with the surrounding water
temperature whereas for a waterproof logger (no housing) time lag is shorter (20 mins)
(Figure 2) The rate of change for the temperature is proportional to the temperature
difference Thus temperatures recorded from data loggers within housings may not
accurately track water temperatures on very short (eg 10 min) time scales
9
TTeemm
ppereraatt
ururee
3030 2525 2020
1515
1010 55
00
3030
2525
2020
1515
1010
55
00
NN oo casecase(a(a) N) Noortrthh CC rreeeekk C aC asseedd
(b) Shibagua R iver(b) S h ibagua R iver
Sept 7Sept 7
Au
Aug 31g 31
Au
Aug 24g 24
Au
Aug 17g 17
Au
Aug 10g 10
Aug 3
Aug 3
D aD attee
Figure 1 Comparison of two types of loggers HoboTemp Pro and Hobo in submersible case in two different streams (a) a small
stream North Creek and (b) Shibagua River North Creek is a small headwater steam on the southern border of the Shield and has
heavy riparian cover Shibagua River is larger off the Shield and due to its size the riparian vegetation has relatively little influence
10
(a(a)) Hobo Temp Pro 1
Hobo Temp Pro 2
Cased 1
Cased 2
Hobo Temp Pro 1
Hobo Temp Pro 2
Cased 1
Cased 2
0
5
10
15
20
25
Tem
pera
ture
0
5
10
15
20
25 Hobo Temp Pro 1
Hobo Temp Pro 2
Cased 1
Cased 2
Hobo Temp Pro 1
Hobo Temp Pro 2
Cased 1
Cased 2
0
5
10
15
20
25
Tem
pera
ture
0
5
10
15
20
25
(b(b)) 303030303030
252525252525
202020202020
151515151515
101010101010
555555
0000 0000 5555 10101010 15151515 20202020 25252525 30303030 35353535 40404040 50505050
MMiinutesnutes
Figure 2 Comparison of two types of loggers HoboTemp Pro and Hobo in submersible case under two temperature change
scenarios (a) from room temperature down to zero oC by placing the loggers in ice water and (b) taking the loggers out of the ice
water to 30 oC tap water
Loggers placed in clear or translucent cases may act as heat collectors and give
artificially high temperature values due to solar radiation warming inside the case (ie
greenhouse effect White non-translucent cases are recommended to avoid solar
radiation warming White cases however advertise their location and rarely remain
white for long due to algae growth
Choosing a Sampling Interval
We suggest a sampling interval of 30 minutes although shorter intervals (eg 15 mins)
may be used in small flashy streams or in relation to impact assessment (eg
hydropower urbanization) All this said we strongly advice that a minimum of 30
11
minutes be used This time interval is also the preferred interval for analyses in
ThermoStat
Laboratory Procedures Pre-deployment is the second important step in measuring stream water temperature
Too often we see loggers that were incorrectly programmed and launched resulting in
corrupted data and poor choice of sampling interval In one case we obtained data
recorded every 05 seconds
Calibrating your data logger
Regardless of the type of data logger used it is good practice to make sure it is
functioning properly Calibration is a relatively simple process and well worth the time
given the consequences of inaccurate or no data A procedure for calibrating data
loggers is the ldquoice bucketrdquo method (see httpwwwonsetcompcom) The procedure
involves the following steps
1 Deploy the data loggers at a short sampling interval (eg 1 minute)
2 Submerge data loggers in an insulated ice bath (eg a cooler with lots of ice and
water)
3 After at an hour remove the data loggers and download the data If the data
loggers are calibrated correctly the temperature readings should level-out at 0degC
4 Check calibration both before and after data loggers are deployed and retrieved
It is also advisable to use a NIST thermometer to test the accuracy of data
loggers at temperatures other than 0degC
Launching Procedures
There are two ways of launching your data logger Most popular is to program the
logger for a delayed start A delayed start is recommended if the loggers will be
deployed at a later date or when you want your loggers synchronized so comparisons
among loggers (sites) can be made Alternatively you can set the logger to start
immediately The latter method is rarely used today however older logger models
12
typically do not have the delayed start option We highly recommend synchronizing
loggers such that measurements are made at the same time eg 1230 1300 1330
hrs This synchronization makes statistical comparisons more valid Regardless of the
method used be sure to record the day and time the logger was deployed so you can
trim data at a later date See Appendix I for suggested site identification and logger
field sheets You might experience problems with your data if (i) the battery runs out (ii)
the logger malfunctions (iii) your loggers date and time was improperly set (iv) you set
your logger to wrap around the current data or (v) you did not physically place your
logger in a good location Be aware of using daylight savings time (DST) or Greenwich
Mean Time (GMT)
Before the logger is deployed attach an identification tag (ie property of hellip tidbit
please leave in water contact number) to the logger with a cable tie In the event that
the logger is found by a member of the public this tag may deter them from vandalism
We have had people find our loggers and return them to us because of this tag
The optic window on some loggers can become overgrown with algae These algae can
be difficult to clean off in order to optically read the data For some loggers a protective
boot can be purchased to protect the optical window You should carry a tooth brush to
clean off the optic window If the window on the tidbit V2 logger is dirty the shuttle will
not be able to recognize the logger and will record a fail Record on your field sheet the
type of logger serial number and logger number If needed replace faulty loggers with
fresh loggers In the lab try cleaning and downloading problem loggers again If this
still fails to work return the logger to seller where they should be able download via
other methods
Field Procedures Field work is the third important step in measuring stream water temperature Before
placing your logger in the stream you need to determine if the site will be frequented by
various users eg fishing recreation etc Ask yourself if the logger will be readily visible
to visitors Are people going to tamper with it if they find it Is this private or crown
13
land Is access going to be a problem in the future Are beavers going to be a
problem Will it be too dangerous or risky to access the stream (ie very steep loose
rocks) Look for fishing line and lures beer cans bottles garbage and fire pits In the
stream look for any flow obstructions try to avoid springs or seeps make sure there is
mixing within the site and the water depth is sufficient even during low flow periods of
summer or winter In Ontario the best time to deploy and retrieve loggers is during the
low flow period of summer (July- September) You do not want to place your loggers too
deep that you cannot retrieve them the next year
Placing the Logger in the Stream
It is well worth spending time on logger placement so that it is not lost We have
successfully used three techniques for placing the logger in a stream or river The
water depth and clarity will determine which technique to use (Table 3)
Table 3 Choosing an installation method depends on river or segment characteristics
Type Turbid Bedrock dominated Dynamic alluvial Soft organic or silty
Staked 9 9 9
Tethered 9 9 9
Free-weight 9 9
Staked Staking loggers involves using a 12-24rdquo section of solid rebar 38-34rdquo diameter
with a small hole 14rdquo diameter at one end large enough to thread a small cable tie
Make sure the hole in the rebar is sufficiently away from the end of the rebar to avoid
closure during hammering This rebar is pounded into the substrate with a sledge
hammer or cupped pipe (mini post driver) (Figure 3) The cupped pipe is a solid bar of
metal 1rdquo diameter with a short (3rdquo) section of pipe welded onto the end The rebar is
first hammered down to the water surface Below the waterline we use the mini post
driver hammering otherwise will lead to lots of splashing and misses The cupped
portion of the driver leaves 2-4rdquo of the rebar exposed Attach the logger and tag via a
cable tie to the rebar In many cases a flat rock can be placed on the exposed end of
the rebar thus concealing it from passer-by but do not impede water flow to the logger
14
15
Figure 3 A staked logger
(insert) mini post driver
sledge and stake
Free-weight If the water depth is suitable for wadingwalking then take a long cable tie
(36-48 inches) or stainless-steel cable and attach the logger to a cinder block (Figure 4)
Carry the cinder block to your site location and physically place it securely in the stream
Try to hide the cinder block by covering it with rocks but do not to impede water flow to
the logger
Figure 4 Free-weight
eg cinder block
Tethered If your water depth is greater than a metre or the stream is prone to moderate
turbidity then it is recommended that you use the tether technique (Figure 5) Other
notable factors are steep slopes flashy streams silt or clay substrates This technique
will help you retrieve the logger upon return To tether your logger
1 Attach the logger and its information tag to a half cinder block with a large cable
tie The logger should securely lie in the protective inner hole of the cider block
This requires one small tie for the logger and one large tie for the block
2 Cut a section of aircraft cable to an appropriate length needed to position the
logger
3 Attach one end of the aircraft cable (18 -38rdquo diameter) to a frac12 cinder block with
an appropriately sized swage and use crimpers to clamp the swage onto the
cable
4 At the other end of the cable attach a 12-24 inch section of solid rebar 38 to 34rdquo
diameter with a small 14rdquo diameter hole at one end large enough to thread the
cable Make sure the hole in the rebar is sufficiently away from the end of the
rebar to avoid closure during hammering
5 Throw the frac12 cinder block into the river while holding on tight to the rebar
6 Once the cinder block has settled to the bottom hammer the rebar into the
substrate with a sledge hammer or cupped pipe (mini post driver) (Figure 3) so
the top is flush with the ground Attach this end with a swage and use the
crimpers to clamp the swage onto the cable (Figure 5)
7 Make sure you place flagging tape in a tree close to the rebar and take a picture
so you can find it again
8 Ensure the rebar and cable is flush to the bottom to avoid detection and
tampering Placing a rock on top of the rebar helps keep it in place and hidden
In shallow areas you might want to place rocks along the tether line to hide it
from view
Make sure your tether line is long enough (double what you think is necessary) If you
are unsure of the water depth because of the turbidity use your pike pole to search for
16
adequate water depth We have had instances of tethered loggers drying up because
we did not use enough line to get out to deeper water
Figure 5 Tethered half
cinder block
Protecting your Data Logger in the Field
Try to protect your logger from human vandalism flash flooding eroding banks ice
jams drying out freezing and animal disturbances The best locations are on private
land Private land and their owners deter access and help protect loggers from vandals
Avoid high-use areas such as parks If you must place a logger in a high use area
camouflage your cinder block with rocks or paint Aging cinder blocks take on the
colour of stream rocks over time We have routinely used bridge crossings as stream
access points with few problems Permanent structures such as bridge abutments and
large boulders offer a great deal of protection against high flow events are
recognizable and make good reference points Try to use natural in stream rocks
permanent log jams or boulders to secure your cinder block in the stream The slower
17
side of current breaks are also ideal locations for logger placement We have had great
success with the free-weight and tethered methods Try to avoid placing full cinder
blocks at the lip end of culverts there are many beavers out there
Ensure that water depth is sufficient so that the logger will not dry-out in summer or
freeze during the winter If possible visually check loggers in the lowest flow periods in
the summer and winter We check our loggers in the low flow period to ensure that
there is sufficient water ie no less than 03 m Record the date time and any
adjustments you made to the logger
Documenting Logger Location and Site information
If your site will be hard for someone else to find draw a map of its exact location and
attach it to your site identification form or field sheet Remember you may not be the
person going back to the site to retrieve the loggers In addition to a site sketch to help
locate the logger we also strongly recommend recording the location of the logger in
the river with a GPS Todayrsquos GPS can even direct your travel route on roads to reach
your logger A digital camera should be used to take a picture of the location of the
logger and surrounding reference structures eg large trees bridges Include the
person placing the logger in the picture at the exact location of the logger The person
in the picture should point to the location of the submerged logger Lastly tie pieces of
flagging tape on tree branches directly perpendicular to the stream logger location
These precautionary measures may seem cumbersome but it is much better than losing
a logger or spending an hour searching in the rain on a cold day in October Finding
loggers in the field after one or two years can be challenging Using the techniques
describe above will help you find the logger and retrieve your data
On your data logger field sheet record the date (YYYYMMDD) the time (24 hour
clock) the deployment number sampling interval of the logger wetted stream width in
meters depth of logger in meters the degree of shading upstream based on riparian
vegetation height and stream width (high medium or low) habitat type (pool or riffle)
18
pre-calibration factor (if the logger was calibrated) location in stream crew and any
other comments An example field sheet is attached in the Appendix
Although it is highly recommended that the site identification form be completely filled
at a minimum the stream name UTM coordinates and datum (eg NAD 83) should be
recorded Site identification is crucial for ensuring that future users of the data know
where the data was collected An example of our site identification field sheet is
attached in the Appendix If you have loggers in the waterproof casings you should
lubricate the o-ring and place a business card and desiccant pack inside
Safety
It is highly recommended that you work in pairs one person on shore and the other
person in the stream If you are working on fast moving large rivers or streams with
high algaemosses which makes your footing very slippery you might want to wear a life
jacket (summer months) or a floater jacket (fall winter and spring) It is also a good
idea to have a walking stick and polarized sunglasses to help see and feel the bottom
area of the stream You should also carry a pair of gloves and wear them when
deploying and recovering loggers to avoid zebra mussel cuts sharp rock cuts cold
hands and other objects in the stream ie broken glass and wire fences In some
situations the person on shore should have a throw line handy A hazard assessment
safe operating procedures and appropriate training should be conducted prior to
implementation of work
Invasive Species Transfer
Note that invasive species transfer (eg Didymosphenia geminate) is a risk factor in this
work particularly if you are visiting a number of streams over a large geographic area
We encourage field staff to use waders that reduce transfer (no felt soles) wash their
waders between streams and dry waders at the end of each day Do not move used
cinder blocks among stream sites
Spatial Thermal Variation and Sample Site Selection
19
Typically resource staff want to collect temperature data representative of the stream
This is easier said then done Stream temperature will exhibit variation in time and
space (longitudinally vertically and laterally) the degree to which depends on a number
of factors To obtain representative data consider how site and segment (1-103 m)
characteristics might influence your understanding of water temperature in a stream
The following will strongly affect water temperature
1) groundwater inflows surface and subsurface
2) side channels confluence of tributaries
3) landuse ie geology forest covertype soils riparian vegetation
4) beaver ponds and other impoundments natural and man-made
5) wetlands water withdrawals effluent and sewage treatment plant discharge and
6) channel morphology (particularly conditions that create isolated pools)
Abrupt changes in any of these factors may lead to sudden changes in water
temperature Always place loggers in well mixed areas but not in riffles prone to low
water flows or in deep pools prone to hyporheic flows (transient groundwater) Deep
run and flat (glide) habitats are preferred locations While the thalweg is certainly mixed
well and representative of a large volume of thermal habitat sheer stresses are typically
highest there too
Retrieving your Data Logger
Use the notes and pictures made during deployment to find the logger Look for the
flagging tape that was placed perpendicular to the logger on the stream bank
Depending on deployment technique carry a pole with a hook on it so you can drag the
logger and cinder block up to shallower water This pole will help you retrieve your
logger in turbid andor deeply set loggers it will also help you wade safely If rebar was
used look for the rock that was used to conceal the logger A metal detector can be
used to find loggers (stake and tether) if other methods fail If the logger is not found
then expand your search downstream of the most probable spot
20
After retrieving your data make sure you record the date (YYYYMMDD) time (24 hour
clock) post-calibration factor if desired approximate wetted stream width in metres
depth of logger in metres signs of tampering signs of logger drying out crew and any
other comments Follow the manufacturerrsquos directions for downloading data Check the
battery level and replace dead or damaged loggers See appendix II for the data logger
form
Data Retrieval and Handling This is the fourth important step in measuring stream water temperature We have seen
a high degree of variability in data formats and data corruption related to incorrectly
retrieving the data We strongly recommend saving the raw data files for storage and
future access Follow manufacturerrsquos instructions if you want to work with Microsoft
Excel Note we urge you to examine your date time data for errors in Excel
We have created software for analyzing stream temperature data called ThermoStat
This latest version of ThermoStat incorporates many of the great tools used in STATE
(Stream Temperature Analysis and Tool Exchange) and ThermoStat V1 and more in a
desktop stand-alone platform Go to httppeopletrentucanicholasjonestoolshtm for
more information Functionalities include
bull Automatically accept multiple data formats
bull Contain user defined settings for report output (eg Excel and Access friendly
files)
bull Automatically analyze their data in a consistent format for reporting purposes
bull Error checking
bull Thermographic explorer module
bull Daily monthly seasonal and annual temperature statistics (mean min max
range SD)
bull Days within optimal range and days above upper lethal for 40+ common species
in the Great Lakes
21
bull User defined settings for unforeseen thermal criteria and species
bull Thermal guild statistics warmwater coolwater and coldwater
bull Graphing temperature duration curves and area under the curve
bull Extremes dates of thermal max and minimum temperature
bull Warming and cooling rates
The software is free We ask that you send an email to nicholasjones(AT)ontarioca to
request the password Your involvement will help guide decisions on further
development and investment Your privacy will be respected and you will not be added
to someone elses mailing list Check this website regularly for updates Please do not
redistribute this software If you know of someone else that may find this software useful
please direct them to this website to obtain their own copy directly
We encourage you to review the ThermoStat Manual Installation instructions are
provided in the manual ThermoStat is programmed using Matlab and compiled as a
standalone package However it is necessary to have the Matlab runtime environment
on your system which is bundled in the Zip file
Exporting Data from Boxcar and Hoboware for ThermoStat
Export your data using the software supplied by your logger manufacturer (eg
Hoboware) as a Text File The data must be properly formatted for future use (eg
ThermoStat see manual)
Storage and Archiving of Data Field Sheets Database and Data
Once temperature and site identification data have been checked for errors back-up all
data and digital photos The raw field sheets and a copy of the data on disc should be
placed in an archive file box and stored in a heated location to avoid mildew and mould
problems These are the originals and should never be handed-out
22
Hopefully you have a greater appreciation for obtaining quality time series data from
your temperature data loggers and will be better prepared for future temperature work
Learn from our mistakes and the advice of others
Acknowledgments We would like to thank all the people that have offered field advice and reviewed this
document
Literature Cited Bartholow JM 2000 The Stream Segment and Stream Network Temperature Models
A Self-Study Course Version 20 US Geological Survey Open File Report 99-112 276pp (httpwwwmescusgsgovtrainingif312html)
Brett J R 1971 Energetic responses of salmon to temperature A study of some thermal relations in the physiology and freshwater ecology of sockeye salmon (Oncorhynchus nerka) American Zoology 11 99ndash113
Brown R S Stanislawski S S and Mackay W C 1994 Effects of frazil ice on fish In Prowse T D (Ed) Proceedings of the Workshop in Environmental Aspects of River Ice pp 261plusmn278 NHRI Symposium Series No 12 National Hydrology Research Institute Saskatoon Canada
Chu C NE Jones AR Piggott JM Buttle 2009 A simple method to classify the thermal characteristics of streams from daily maximum air and water temperatures revisited North American Journal of Fisheries Management
Chu C NE Jones and L Allin 2009 Linking thermal regime classification to climate and landscape variables in Ontario River Research and Applications
Cunjak R A and Caissie D 1994 Frazil ice accumulation in a large salmon pool in the Mirimichi River New Brunswick ecological implications for overwintering fish In Prowse T D (Ed) Proceedings of the Workshop in Environmental Aspects of River Ice pp 279plusmn295 NHRI Symposium Series No 12 National Hydrology Research Institute Saskatoon Canada
Dunham J Rieman B Chandler G 2001 Development of field-based models of suitable thermal regimes for interior Columbia basin salmonids USDA Forest Service Rocky Mountain Research Station Forestry Sciences Laboratory Boise ID
Dunham J G Chandler B Rieman D Martin 2005 Measuring stream temperature with digital data loggers a users guide Gen Tech Rep RMRS-GTR-150WWW Fort Collins CO US Department of Agriculture Forest Service Rocky Mountain Research Station 15 p
23
Eaton J G J H McCormick B E Goodno D G OBrien H G Stefany M Hondzo and R M Scheller1995 A field information-based system for estimating fish temperature tolerances Fisheries 20(4)10-18
Lewis TE DW Lamphear DR McCanne AS Webb JP Krieter and WD Conroy 2000 Regional Assessment of Stream Temperatures Across Northern California and Their Relationship to Various Landscape-Level and Site-Specific Attributes Forest Science Project Humbolt State University Foundation Arcata CA 420pp
Olden JD and RJ Naiman 2009 Incorporating thermal regimes into environmental flows assessments modifying dam operations to restore freshwater ecosystem integrity Freshwater Biology doi101111j1365-2427200902179x
Poff N L J D Allan M B Bain J R Karr K L Prestegaard B D Richter R E Sparks and J C Stromberg 1997 The Natural Flow Regime - A paradigm for river conservation and restoration BioScience 47 769-784
Stevens HH Jr J F Ficke and GF Smoot 1975 Water temperature ndash influential factors field measurement and data presentation Techniques of water-resources investigations of the United States Geological Survey Book 1 Chapter D1 U S Department of the Interior U S Government Printing Office Washington DC 65p
Zaroban DW 1999 Protocol for placement and retrieval of temperature data loggers in Idaho streams Water quality monitoring protocols report 10 Idaho Department of Environmental Quality Boise ID
24
Appendix Equipment List
life jackets polarized sunglasses first aid kit walking stick waders cell phone hook pole (pike) toolkit maps business cards gloves
GPS unit and extra batteries Clipboard and field sheets pencils calibrated loggers laptop computer inverter for lap top camera and batteries
sledge hammer flagging tape cable cutters letters to landowners metal detector cinder blocks tags air craft cable 18 ndash 14 inch swages and crimper 1 or 2 foot length rebar 12 inch diameter cable ties (small medium and large)
25
Field Forms
Site Identification Summary
Stream Information Stream Name Stream Code Site Code
Site Location UTM Coordinates
Decimal degrees
Geodetic Datum (
Grid Easting
Latitude
Check map legend or GPS set-up)
Northing
Longitude
NAD27 or NAD83
Site Description Township
Lot
Concession
District
Site Description eg walk down path behind education centre Walk to first bridge Logger is beside
bridge under cedar tree
Comments Crew Recorder
Comments
26
__________________________________________________________________________________________
__________________________________________________________________________________________
________________
Stream Water Temperature Data Logger
Deployment of Logger
Date (YYYYMMDD) ____________ Time ____________ Deployment ____________
Sampling Interval ____________ Lock ____________ Elevation(m) ____________
Wetted Width (m) ______________ Depth of Logger (m) ________________
Degree of shading upstream of site based on riparian vegetation height and stream width (circle) High Med Low
Habitat Type (circle) Run Pool Riffle Pre-calibration Factor _______
Deployment type Staked Tethered Free-weight
Location in Stream__________________________________________________________________________
Crew members and Comments_________________________________________________________________
Recovery of Logger
Date (YYYYMMDD) ________________ Time ____________ Post-calibration Factor ________________
Approximate wetted Width (m) ___________________ Depth of Logger (m) ________________
Signs of Tampering Yes No _______________________________________________________________
Signs of Logger Drying out Yes No __________________________________________________
Crew ____________________________________________________________________________________
Comments_________________________________________________________________________________
File Information
Owner of Data ____________________________ Access Rights (circle) Yes No _________________
Filename ________________________________ Quality Controlled (circle) Yes No ______________
Date of Data Download (YYMMDD) Time of Data Download ________________
Please provide a map if it would be difficult for another person to find the data logger Picture and
27
MNR 52639 ISBN 978-1-4435-2795-8 (PDF)
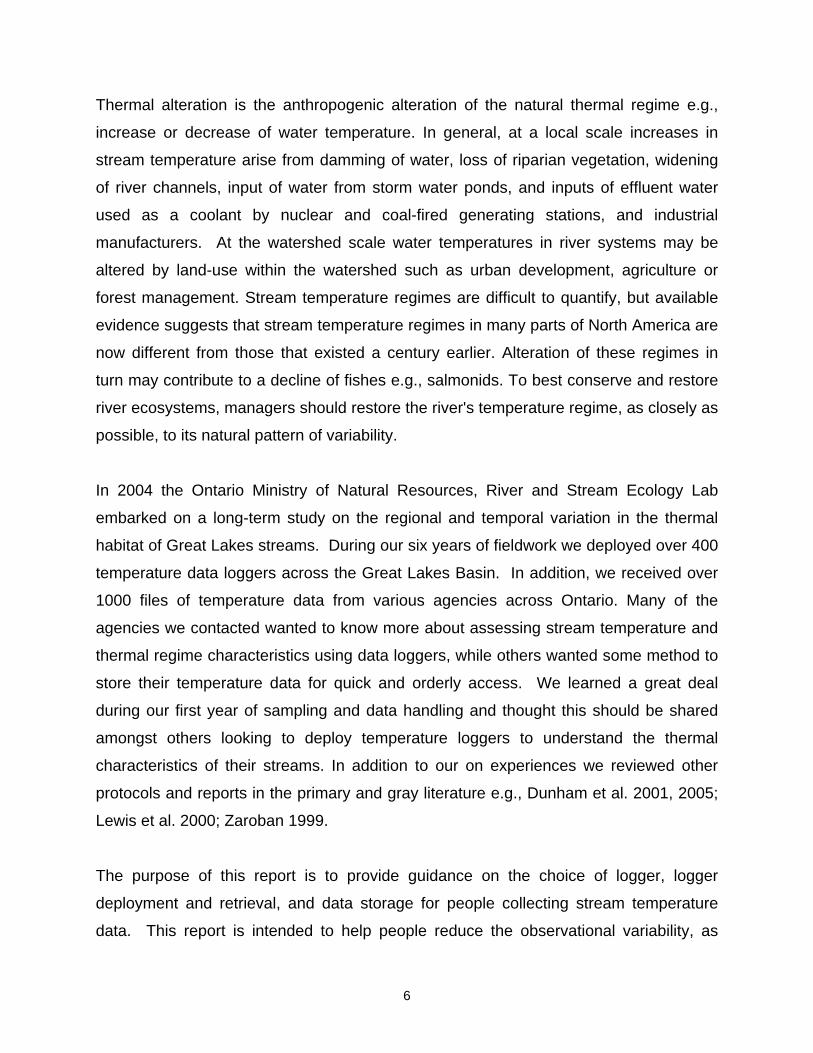
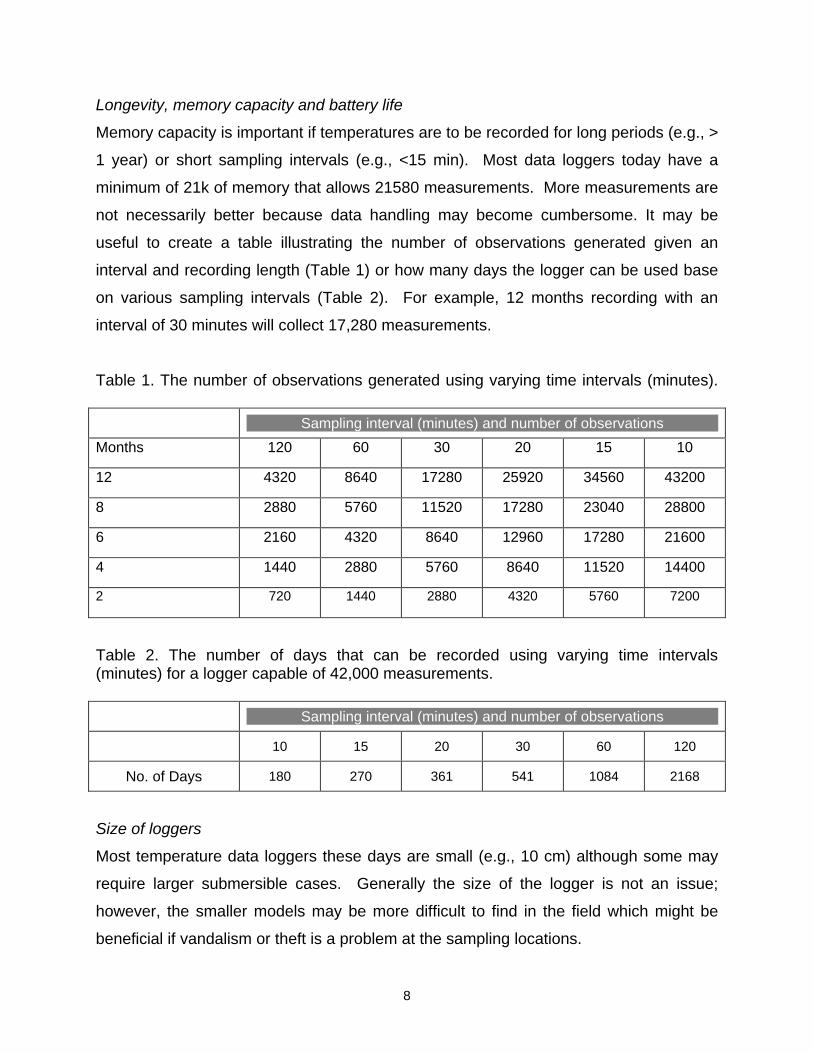
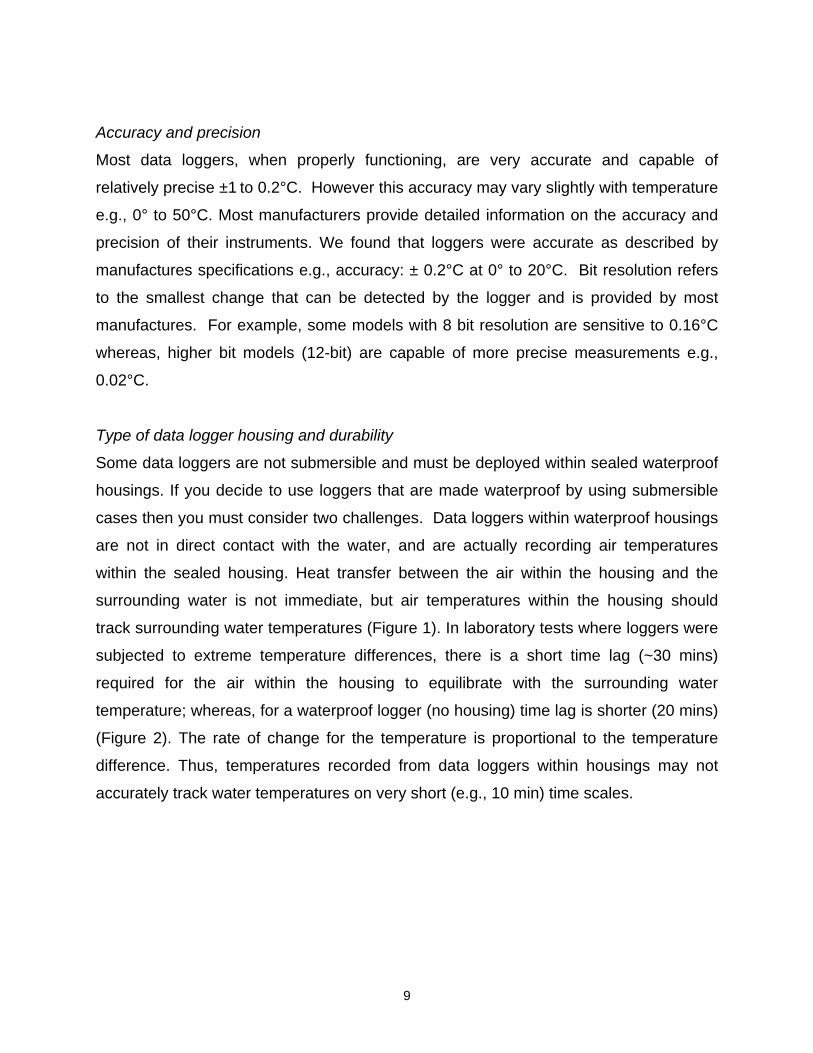
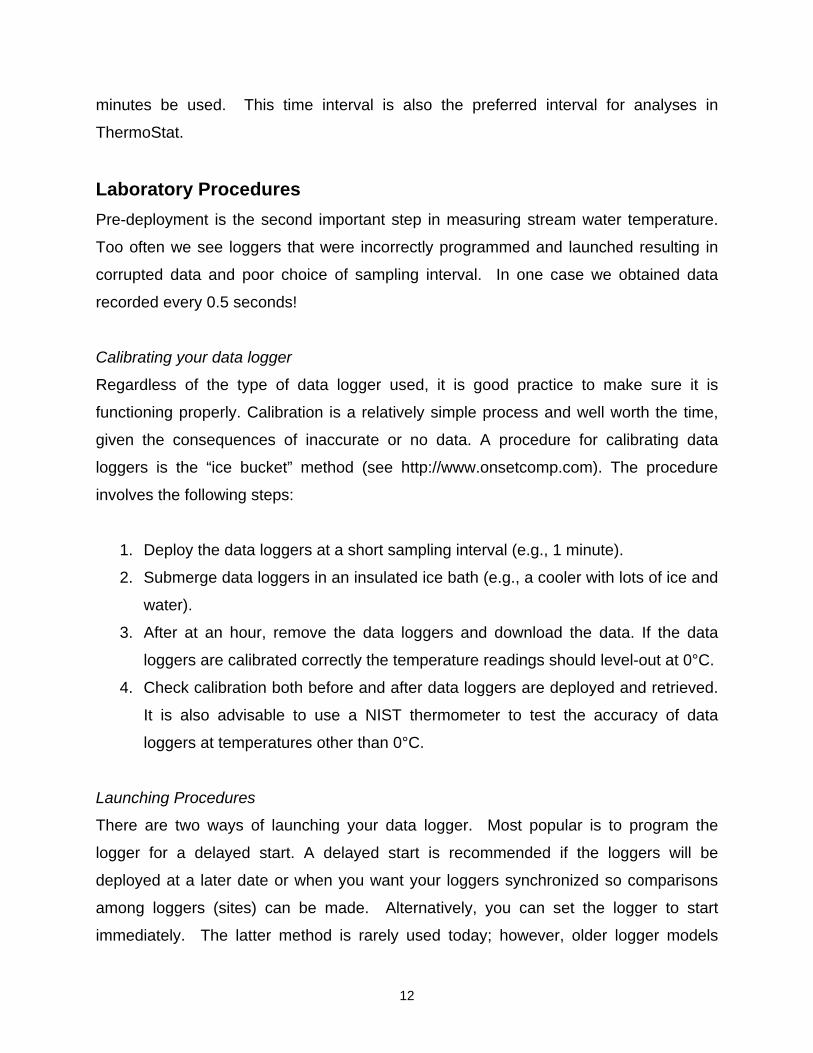
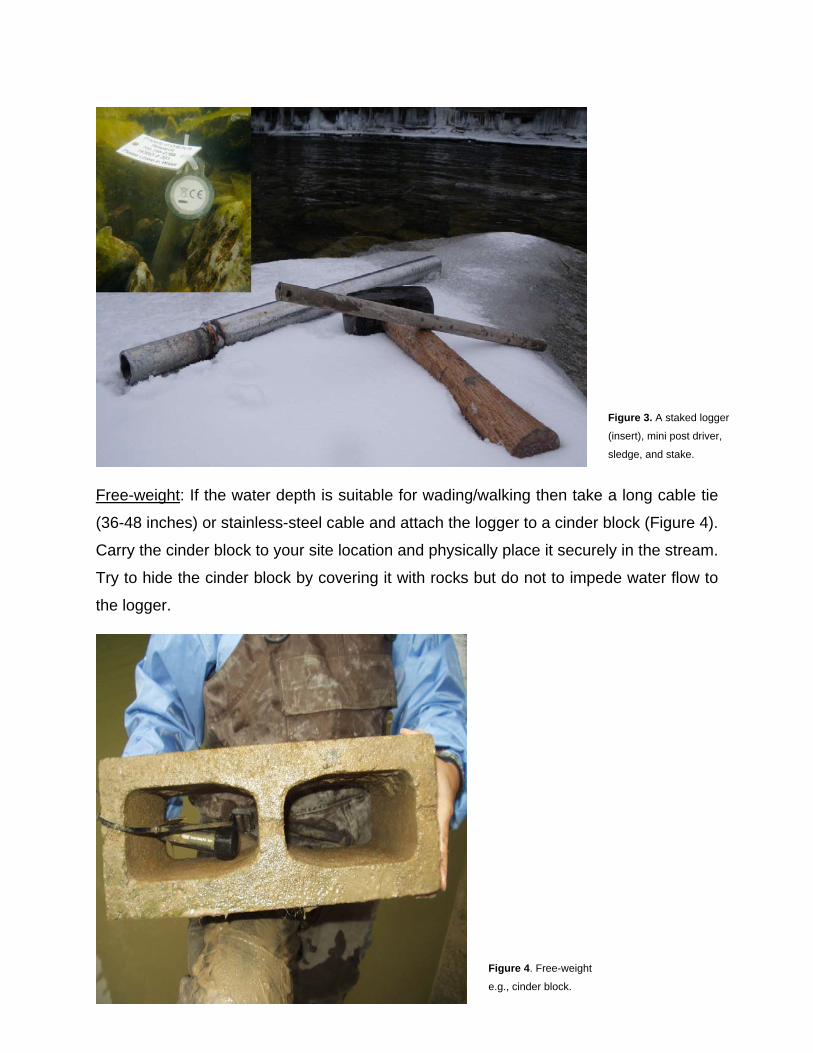
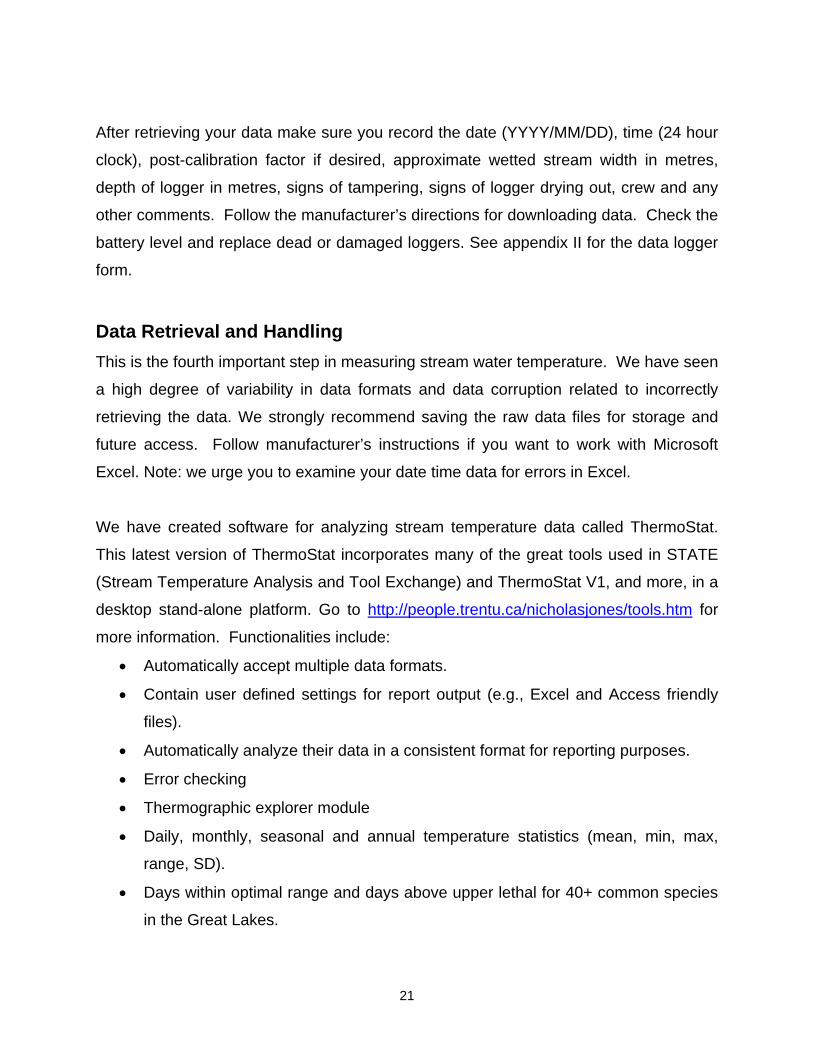
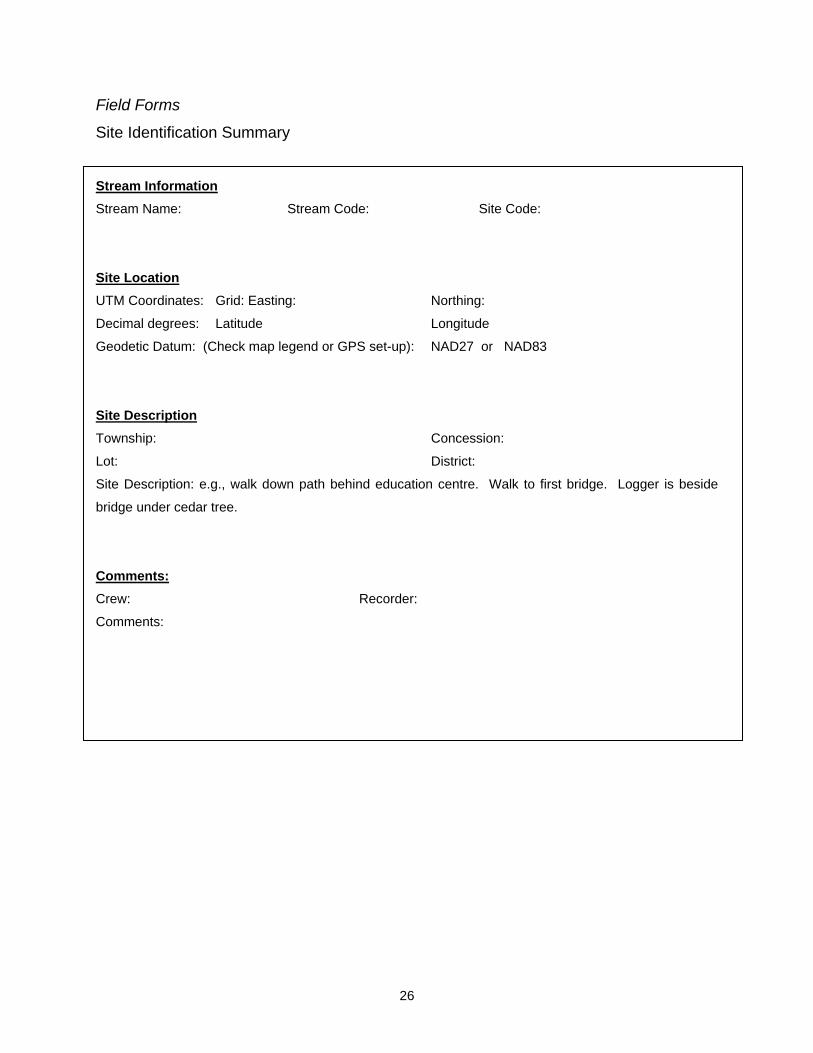

__________________________________________________________________________________________
__________________________________________________________________________________________
________________
Stream Water Temperature Data Logger
Deployment of Logger
Date (YYYYMMDD) ____________ Time ____________ Deployment ____________
Sampling Interval ____________ Lock ____________ Elevation(m) ____________
Wetted Width (m) ______________ Depth of Logger (m) ________________
Degree of shading upstream of site based on riparian vegetation height and stream width (circle) High Med Low
Habitat Type (circle) Run Pool Riffle Pre-calibration Factor _______
Deployment type Staked Tethered Free-weight
Location in Stream__________________________________________________________________________
Crew members and Comments_________________________________________________________________
Recovery of Logger
Date (YYYYMMDD) ________________ Time ____________ Post-calibration Factor ________________
Approximate wetted Width (m) ___________________ Depth of Logger (m) ________________
Signs of Tampering Yes No _______________________________________________________________
Signs of Logger Drying out Yes No __________________________________________________
Crew ____________________________________________________________________________________
Comments_________________________________________________________________________________
File Information
Owner of Data ____________________________ Access Rights (circle) Yes No _________________
Filename ________________________________ Quality Controlled (circle) Yes No ______________
Date of Data Download (YYMMDD) Time of Data Download ________________
Please provide a map if it would be difficult for another person to find the data logger Picture and
27
MNR 52639 ISBN 978-1-4435-2795-8 (PDF)

MNR 52639 ISBN 978-1-4435-2795-8 (PDF)