measuring health-related quality of life ron d. hays, ph.d. ucla department of medicine rand health...
TRANSCRIPT
Measuring Health-Related Quality of Life
Ron D. Hays, Ph.D.
UCLA Department of Medicine
RAND Health Program
UCLA Fielding School of Public Health 41-268 November 26, 2014, 8-9:50am (M218)

U.S. Health Care Issues
• Access to care – ~ 50 million people without health insurance
• Costs of care– Expenditures ~ $ 2.7 Trillion
• Effectiveness (quality) of care
3
How Do We Know If Care Is Effective?
• Effective care maximizes probability of
desired health outcomes– Health outcome measures indicate whether
care is effective
Cost ↓
Effectiveness ↑
4
Health Outcomes Measures
• Traditional clinical endpoints– Survival
– Clinical/biological indicators
• Vital signs (e.g., blood pressure)• Rheumatoid factor• Hematocrit
• Patient-Reported Outcomes
5
Patient-Reported Measures (PRMs)
• Mediators– Health behaviors (adherence)
• Health Care Process– Reports about care (e.g., communication)
• Outcomes (PROs)– Patient satisfaction with care– Health-Related Quality of Life (HRQOL)
6
7
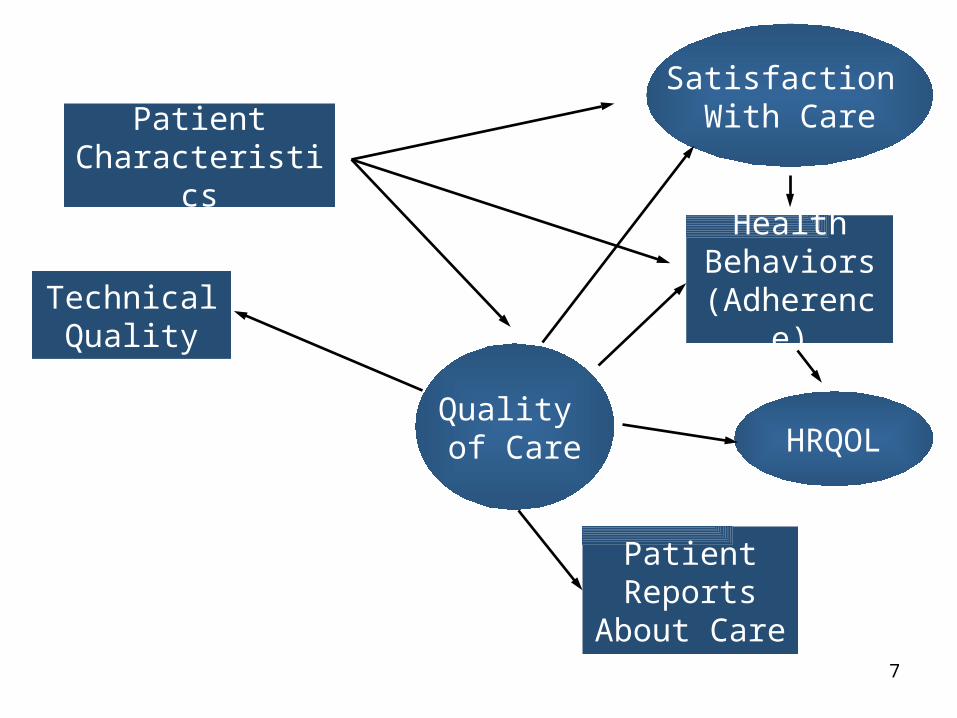
HRQOL
HealthBehaviors
(Adherence)Technical Quality
Satisfaction With Care
Quality of Care
Patient Reports
About Care
Patient Characteristics
8
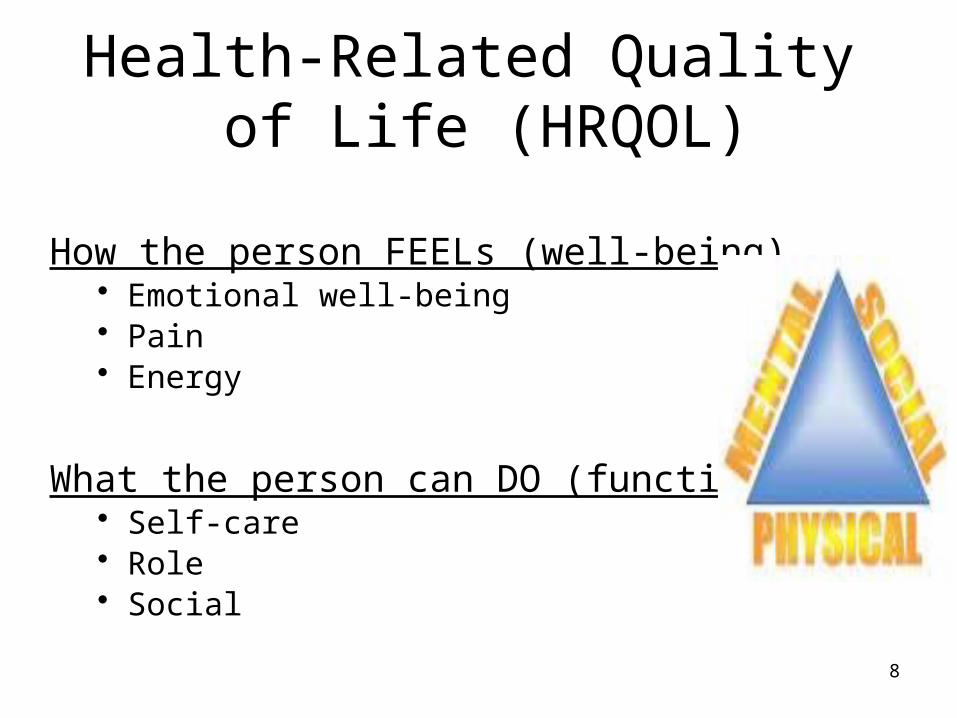
Health-Related Quality of Life (HRQOL)
How the person FEELs (well-being)• Emotional well-being• Pain• Energy
What the person can DO (functioning)• Self-care • Role • Social
9
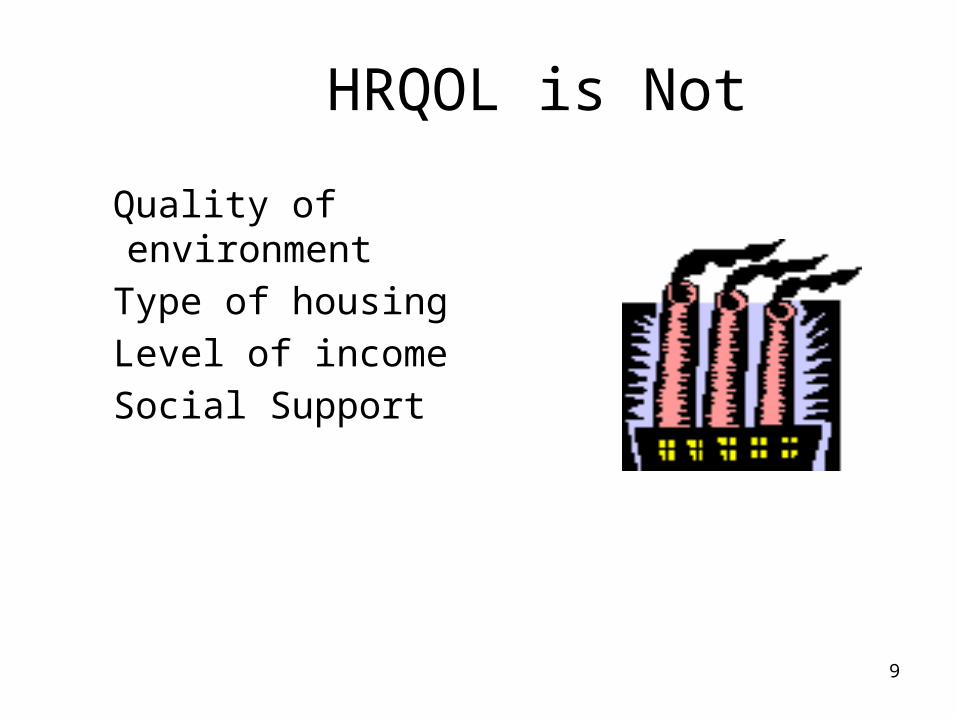
HRQOL is Not
Quality of environment
Type of housing
Level of income
Social Support
10
Targeted HRQOL Measures
• Designed to be relevant to particular group.
• Sensitive to small, clinically-important change.
• More familiar and actionable for clinicians.
• Enhance respondent cooperation.
11
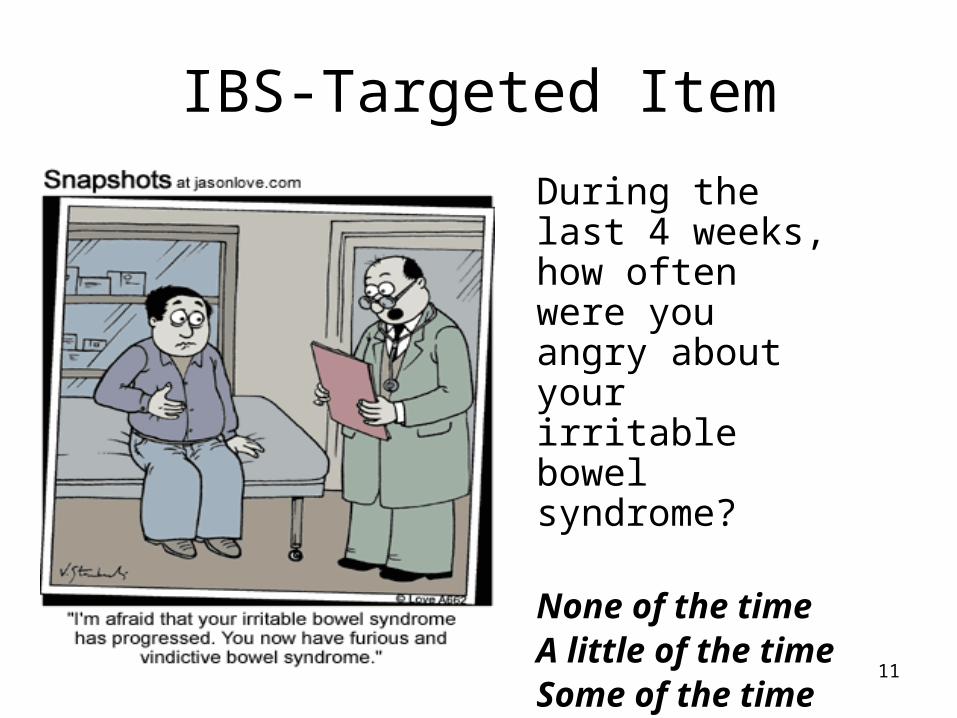
IBS-Targeted Item
During the last 4 weeks, how often were you angry about your irritable bowel syndrome?
None of the timeA little of the timeSome of the timeMost of the timeAll of the time
12
In general, how would you rate your health?
Excellent
Very Good
Good
Fair
Poor
13
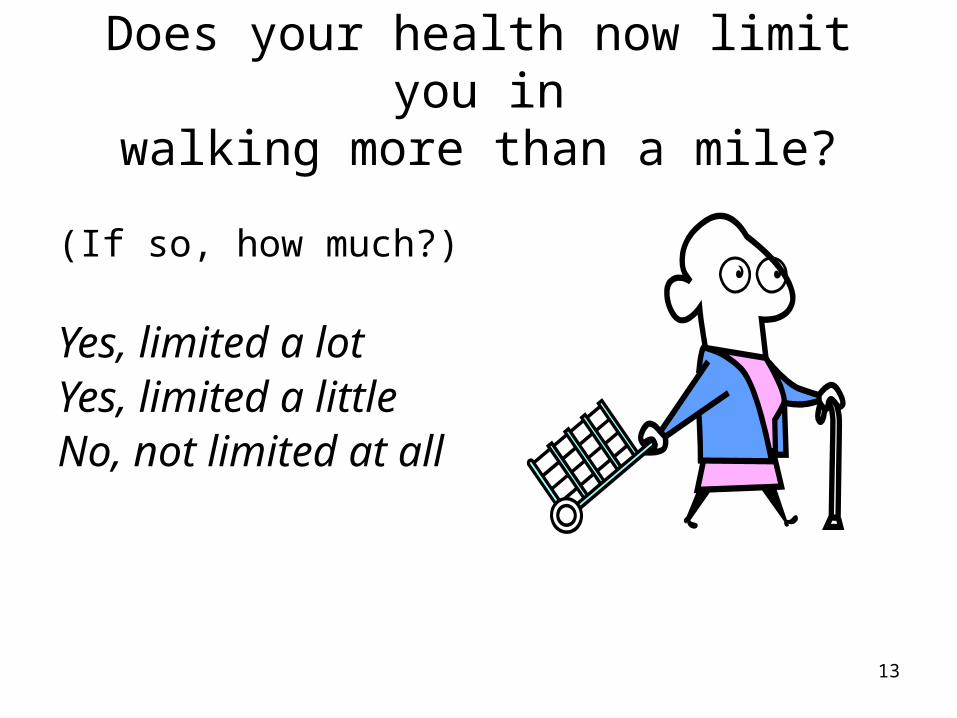
Does your health now limit you inwalking more than a mile?
(If so, how much?)
Yes, limited a lotYes, limited a littleNo, not limited at all
14
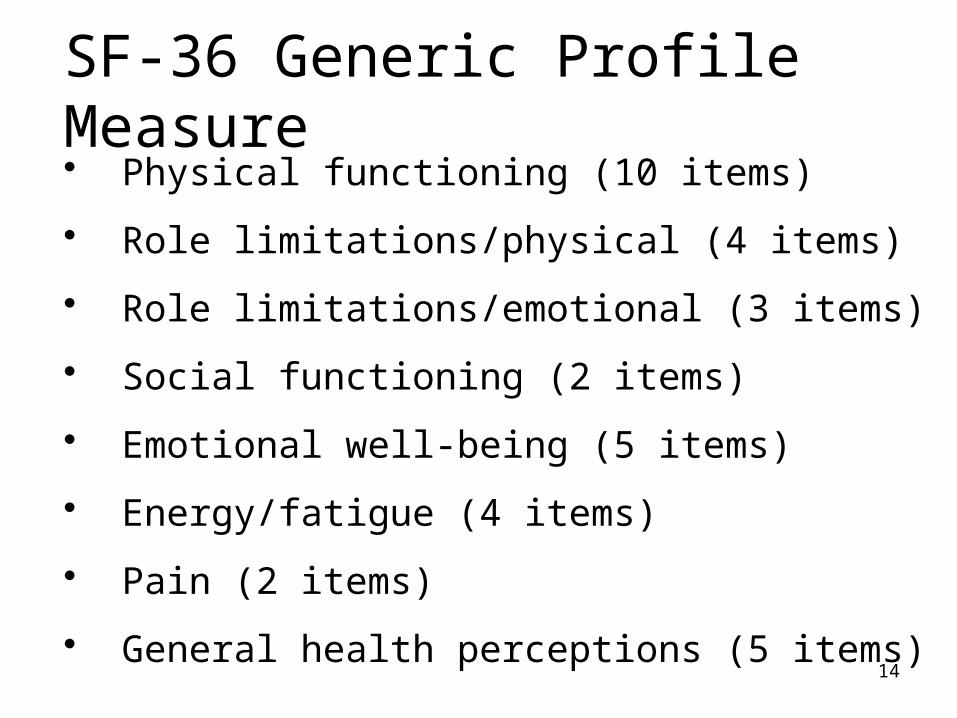
SF-36 Generic Profile Measure • Physical functioning (10 items)
• Role limitations/physical (4 items)
• Role limitations/emotional (3 items)
• Social functioning (2 items)
• Emotional well-being (5 items)
• Energy/fatigue (4 items)
• Pain (2 items)
• General health perceptions (5 items)
15
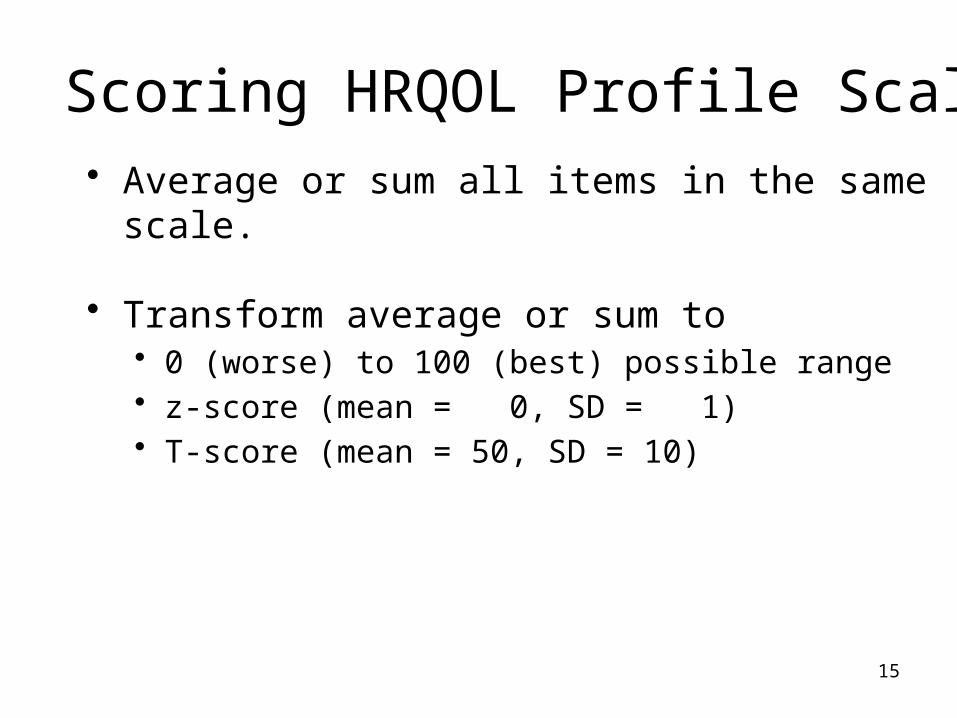
Scoring HRQOL Profile Scales• Average or sum all items in the same scale.
• Transform average or sum to• 0 (worse) to 100 (best) possible range• z-score (mean = 0, SD = 1)• T-score (mean = 50, SD = 10)
16
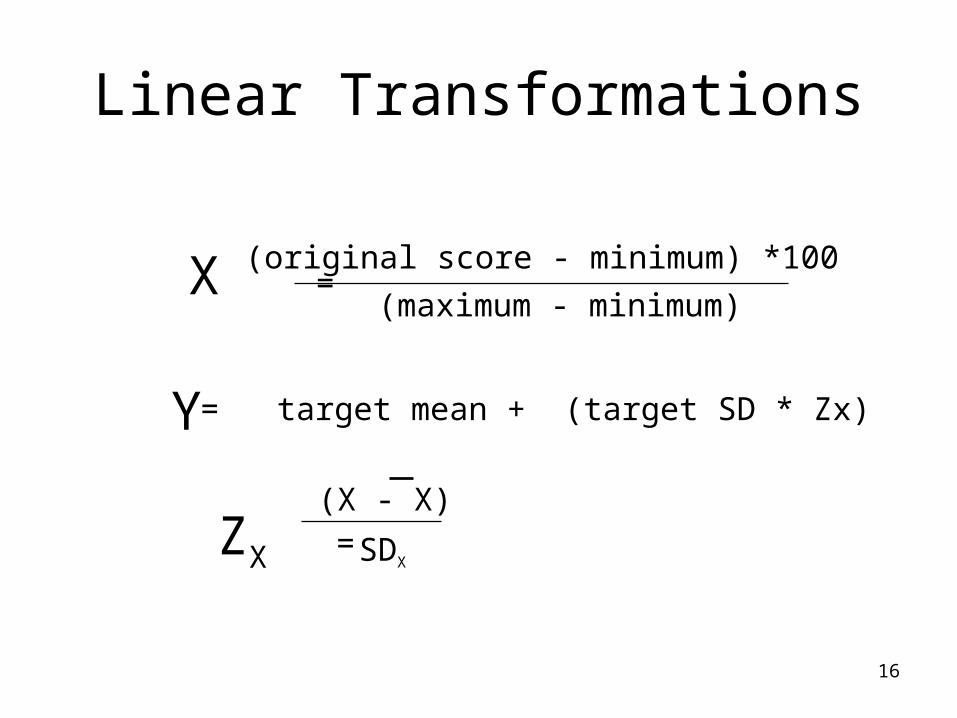
X =(original score - minimum) *100
(maximum - minimum)
Y = target mean + (target SD * Zx)
ZX = SDX
(X - X)
Linear Transformations
17
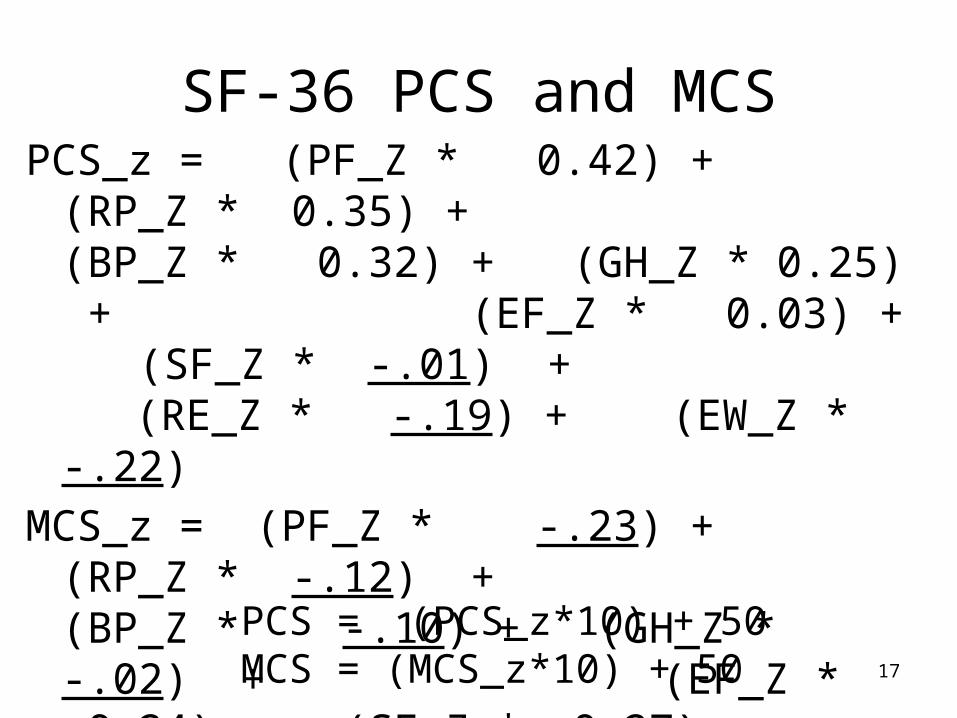
SF-36 PCS and MCSPCS_z = (PF_Z * 0.42) + (RP_Z * 0.35) +
(BP_Z * 0.32) + (GH_Z * 0.25) + (EF_Z * 0.03) + (SF_Z * -.01) + (RE_Z * -.19) + (EW_Z * -.22)
MCS_z = (PF_Z * -.23) + (RP_Z * -.12) + (BP_Z * -.10) + (GH_Z * -.02) + (EF_Z * 0.24) + (SF_Z * 0.27) + (RE_Z * 0.43) + (EW_Z * 0.49)PCS = (PCS_z*10) + 50
MCS = (MCS_z*10) + 50
18
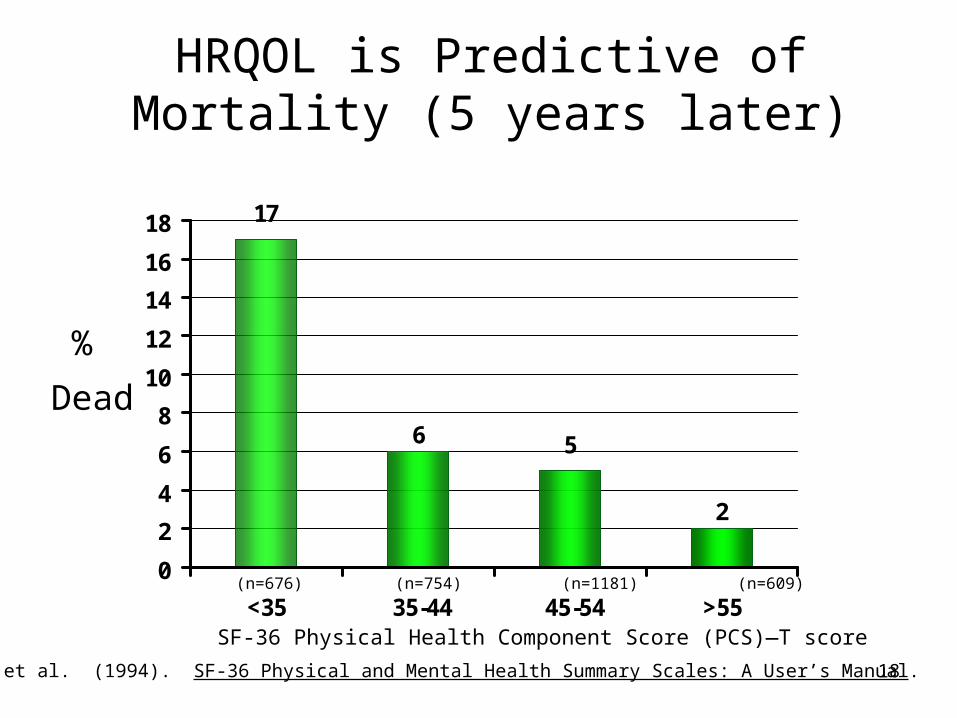
6
2
17
5
0
2
4
6
8
10
12
14
16
18
<35 35-44 45-54 >55
%
Dead
(n=676) (n=754) (n=1181) (n=609)
SF-36 Physical Health Component Score (PCS)—T score
Ware et al. (1994). SF-36 Physical and Mental Health Summary Scales: A User’s Manual.
HRQOL is Predictive ofMortality (5 years later)
19
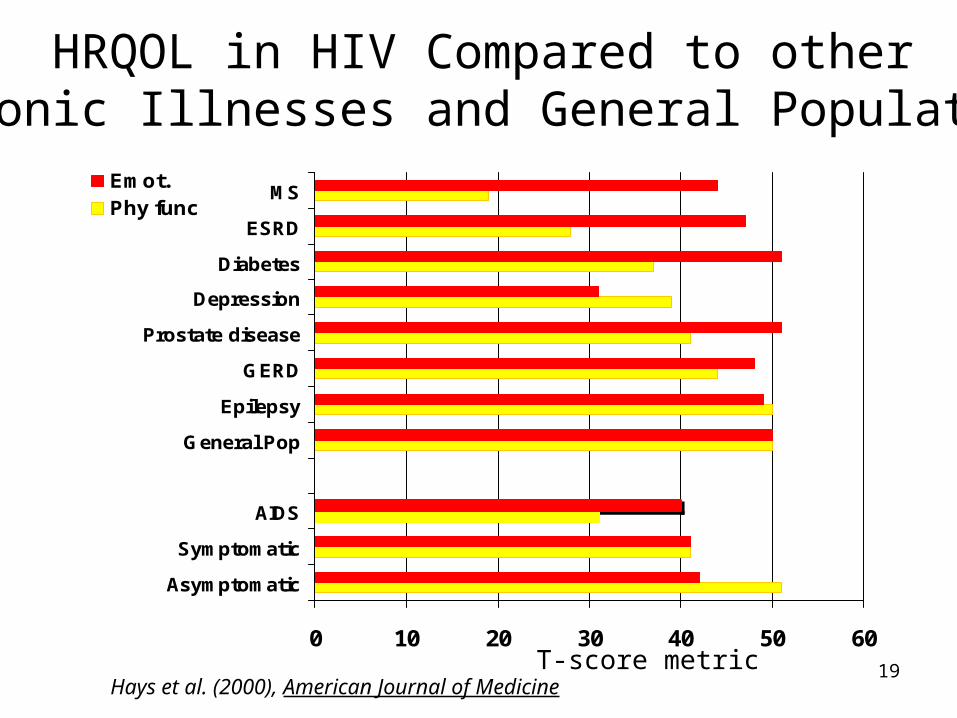
HRQOL in HIV Compared to otherChronic Illnesses and General Population
0 10 20 30 40 50 60
Asymptomatic
Symptomatic
AIDS
General Pop
Epilepsy
GERD
Prostate disease
Depression
Diabetes
ESRD
MSEmot.Phy func
Hays et al. (2000), American Journal of MedicineT-score metric
20
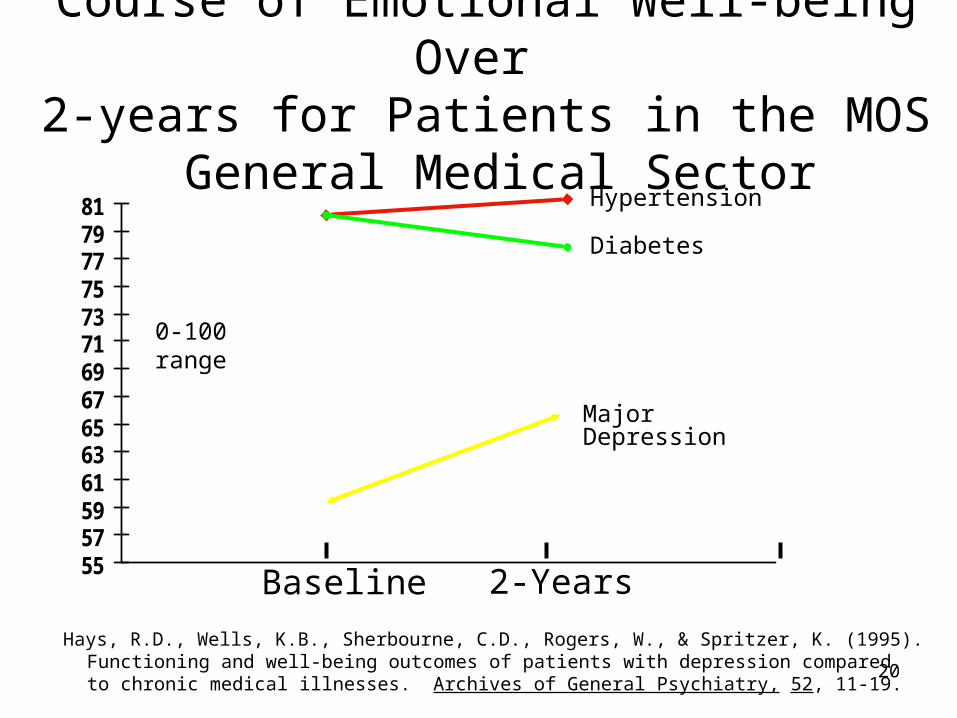
Hays, R.D., Wells, K.B., Sherbourne, C.D., Rogers, W., & Spritzer, K. (1995).Functioning and well-being outcomes of patients with depression comparedto chronic medical illnesses. Archives of General Psychiatry, 52, 11-19.
Course of Emotional Well-being Over
2-years for Patients in the MOS General Medical Sector
5557596163656769717375777981
Baseline 2-Years
Major Depression
Diabetes
Hypertension
0-100 range
21
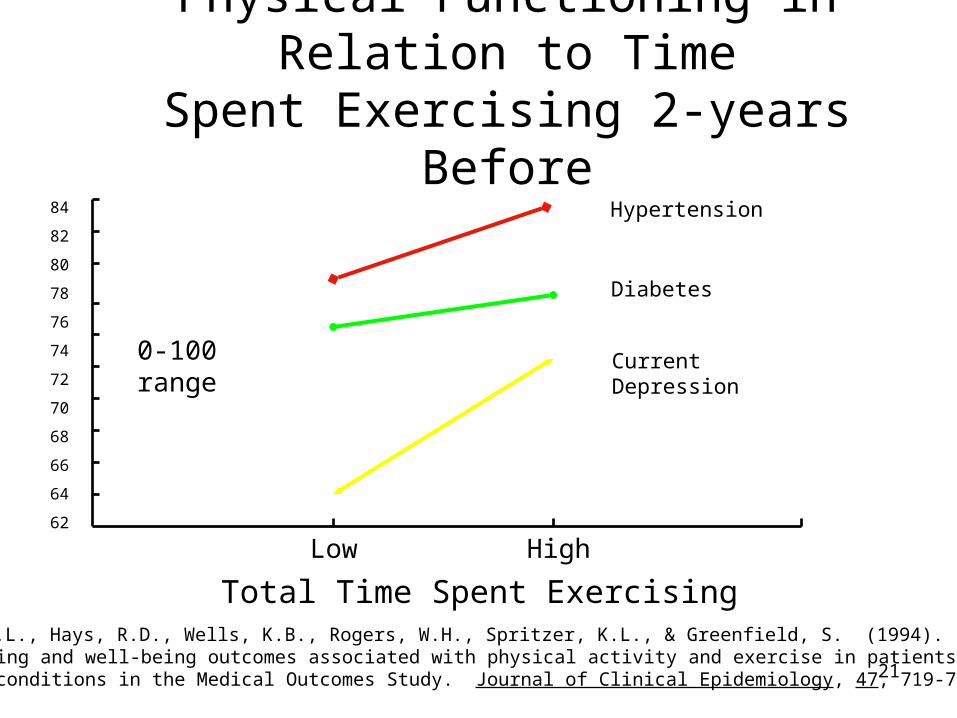
Hypertension
Diabetes
Current Depression
Stewart, A.L., Hays, R.D., Wells, K.B., Rogers, W.H., Spritzer, K.L., & Greenfield, S. (1994). Long-termfunctioning and well-being outcomes associated with physical activity and exercise in patients withchronic conditions in the Medical Outcomes Study. Journal of Clinical Epidemiology, 47, 719-730.
Physical Functioning in Relation to Time
Spent Exercising 2-years Before
Low High
Total Time Spent Exercising
84
82
80
78
76
74
72
70
68
66
64
62
0-100 range
22
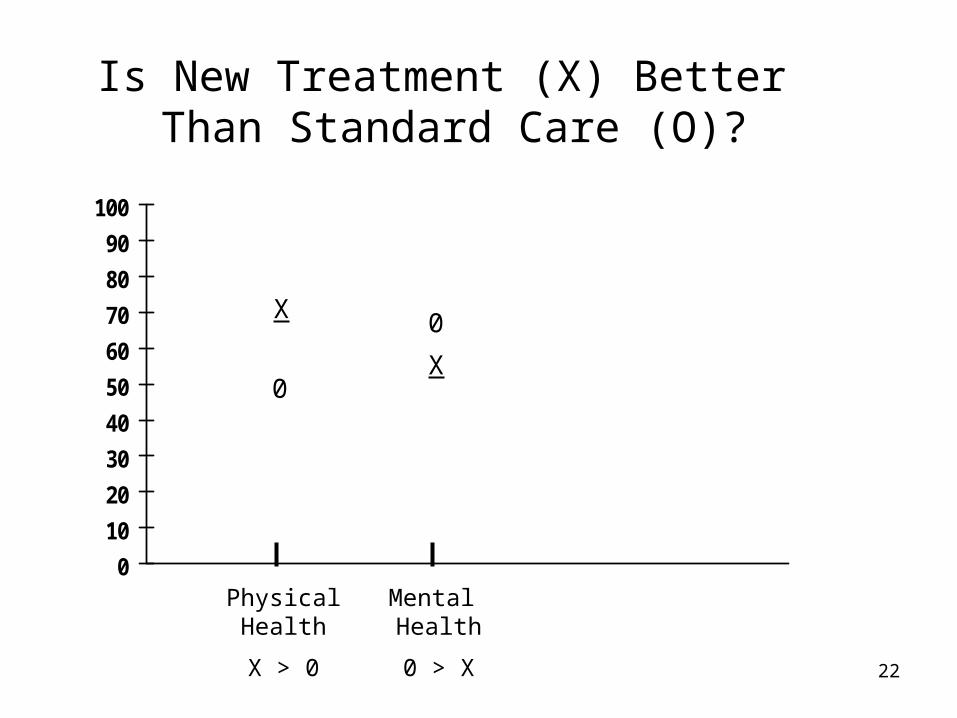
Is New Treatment (X) Better Than Standard Care (O)?
0
10
20
30
40
50
60
70
80
90
100
X
0X
0
PhysicalHealth
X > 0
Mental Health
0 > X
23
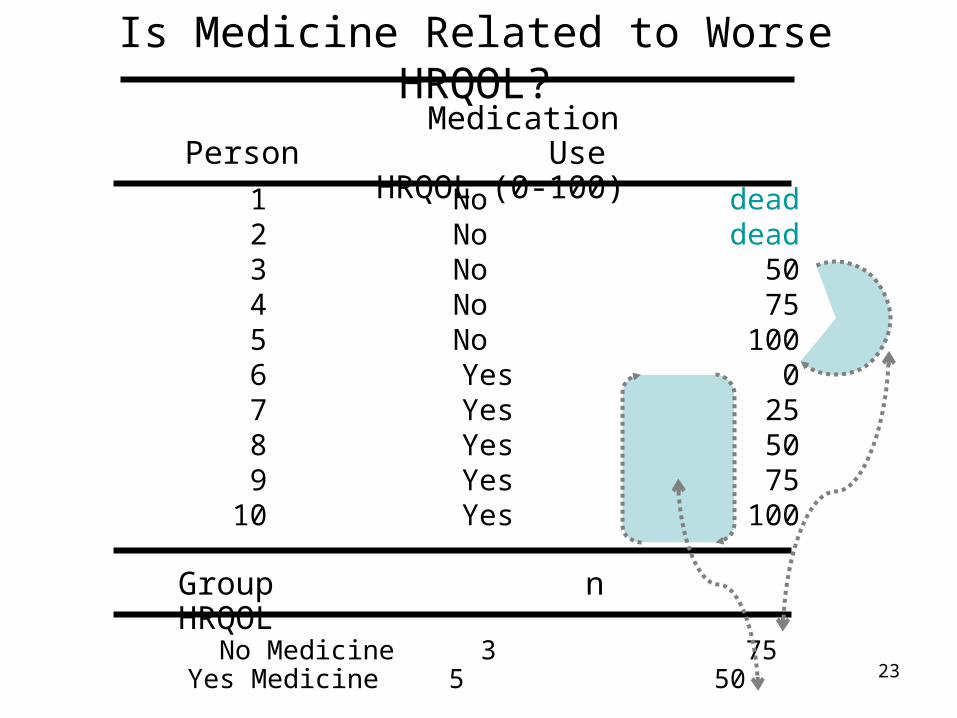
Is Medicine Related to Worse HRQOL?
1 No dead2 No dead
3 No 50 4 No 75 5 No 100 6 Yes 0 7 Yes 25 8 Yes 50 9 Yes 75 10 Yes 100
MedicationPerson Use HRQOL (0-100)
No Medicine 3 75Yes Medicine 5 50
Group n HRQOL
24
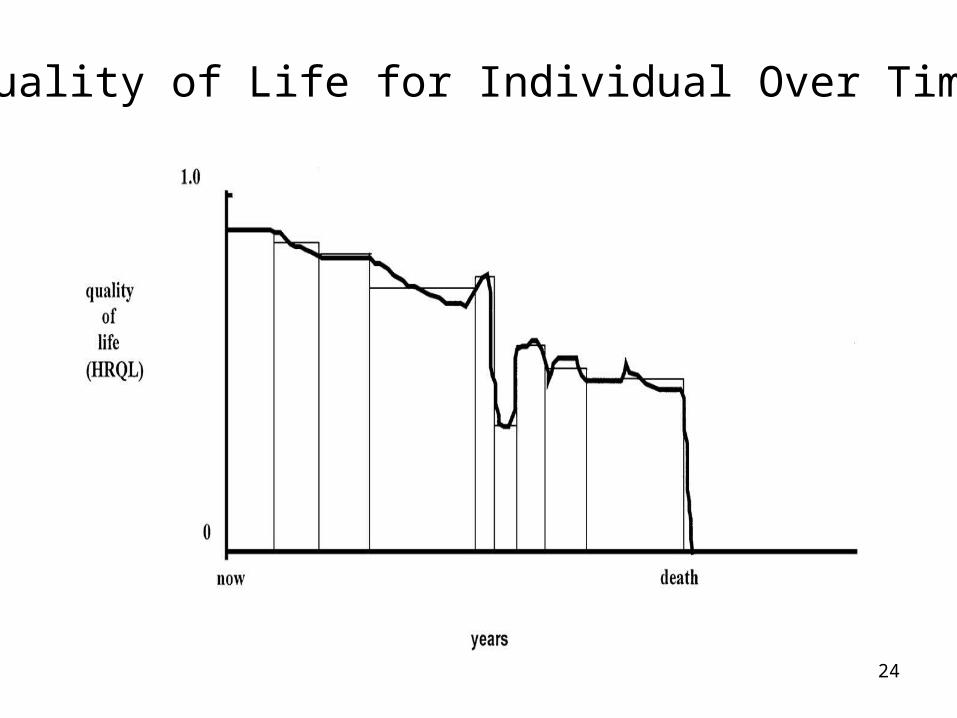
Quality of Life for Individual Over Time
25
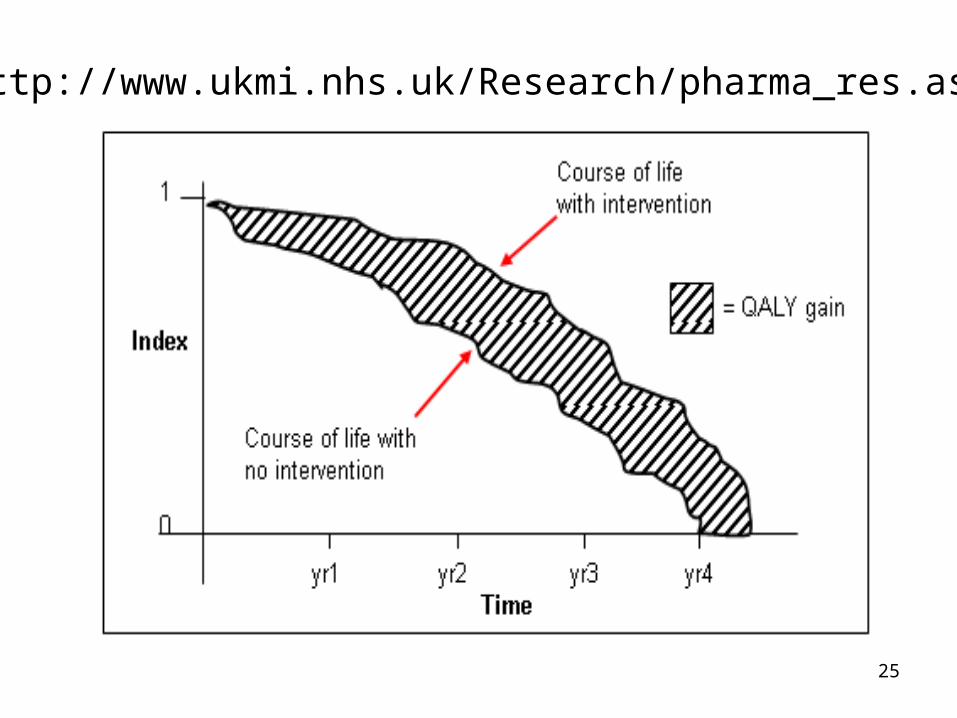
http://www.ukmi.nhs.uk/Research/pharma_res.asp
26
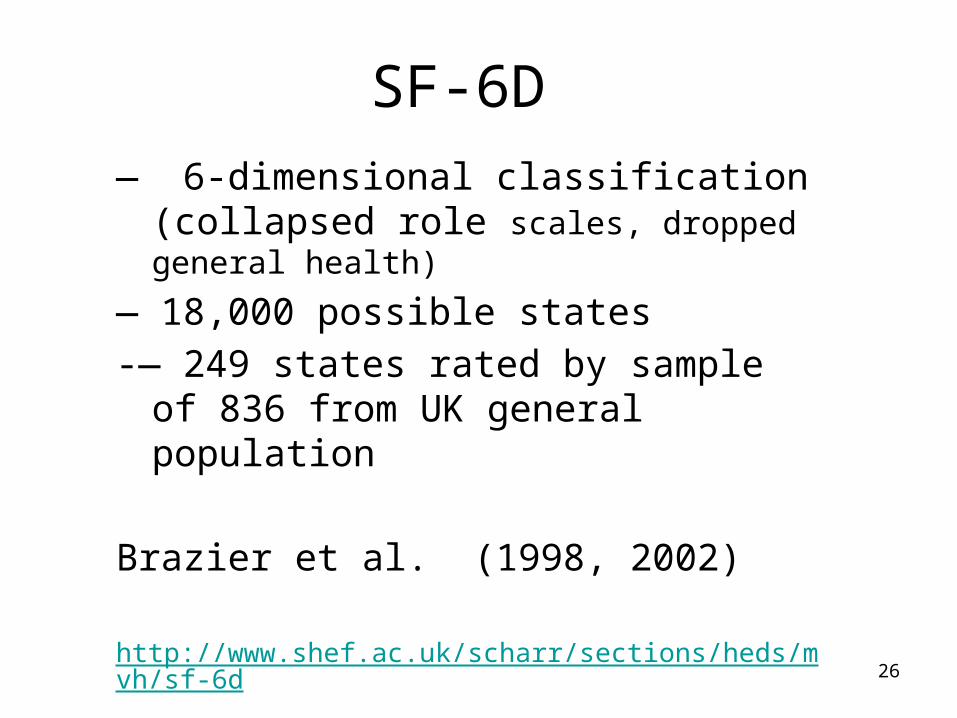
SF-6D — 6-dimensional classification
(collapsed role scales, dropped general health)
— 18,000 possible states-— 249 states rated by sample of 836
from UK general population
Brazier et al. (1998, 2002)
http://www.shef.ac.uk/scharr/sections/heds/mvh/sf-6d
27
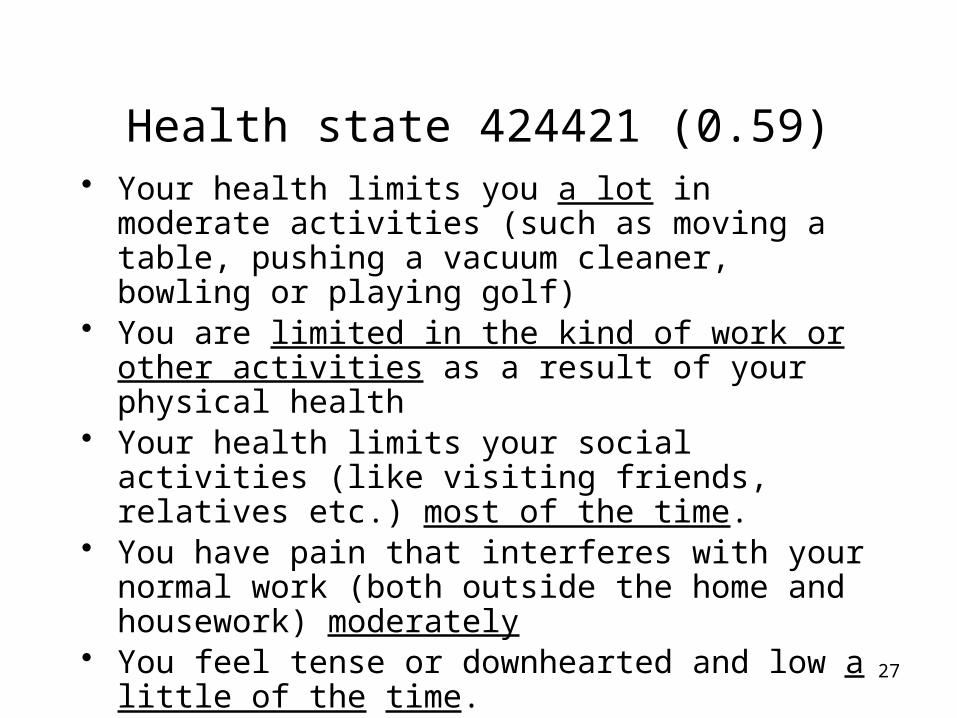
Health state 424421 (0.59)• Your health limits you a lot in moderate
activities (such as moving a table, pushing a vacuum cleaner, bowling or playing golf)
• You are limited in the kind of work or other activities as a result of your physical health
• Your health limits your social activities (like visiting friends, relatives etc.) most of the time.
• You have pain that interferes with your normal work (both outside the home and housework) moderately
• You feel tense or downhearted and low a little of the time.
• You have a lot of energy all of the time
28
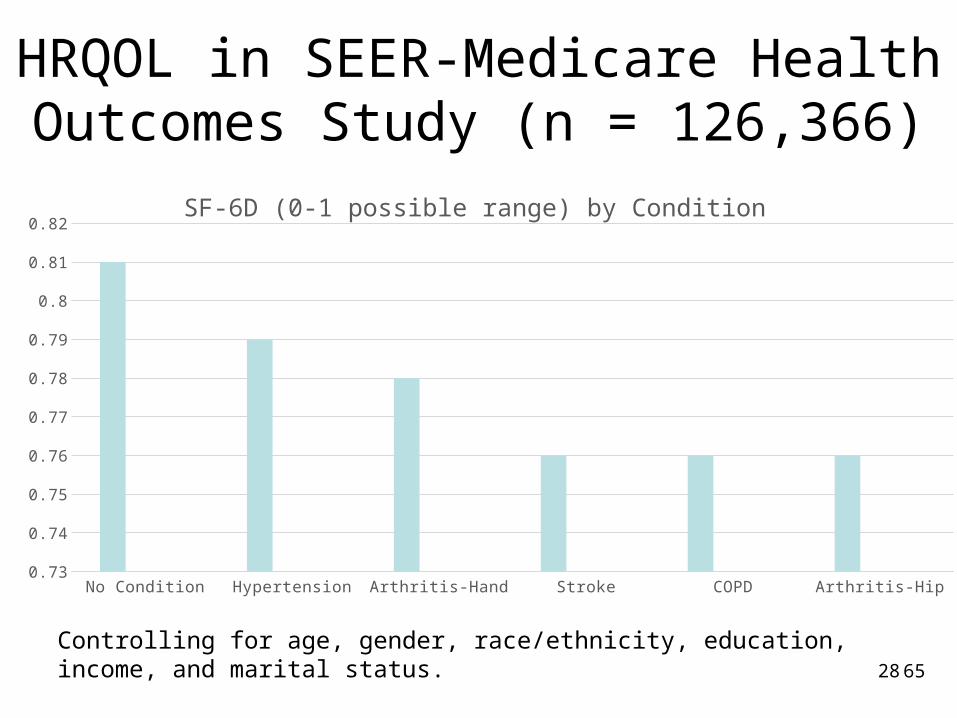
HRQOL in SEER-Medicare Health Outcomes Study (n = 126,366)
No Condition Hypertension Arthritis-Hand Stroke COPD Arthritis-Hip0.73
0.74
0.75
0.76
0.77
0.78
0.79
0.8
0.81
0.82SF-6D (0-1 possible range) by Condition
65
Controlling for age, gender, race/ethnicity, education, income, and marital status.
29
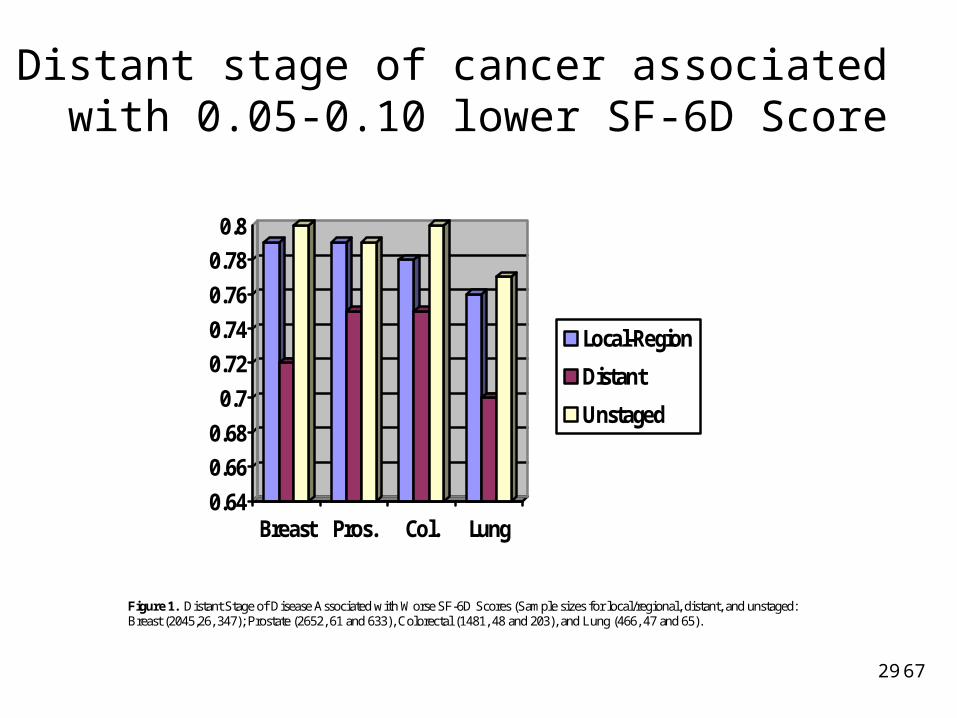
Distant stage of cancer associated with 0.05-0.10 lower SF-6D Score
0.640.660.680.7
0.720.740.760.780.8
Breast Pros. Col. Lung
Local-Region
Distant
Unstaged
Figure 1. Distant Stage of Disease Associated with Worse SF-6D Scores (Sample sizes for local/regional, distant, and unstaged: Breast (2045,26, 347); Prostate (2652, 61 and 633), Colorectal (1481, 48 and 203), and Lung (466, 47 and 65).
67
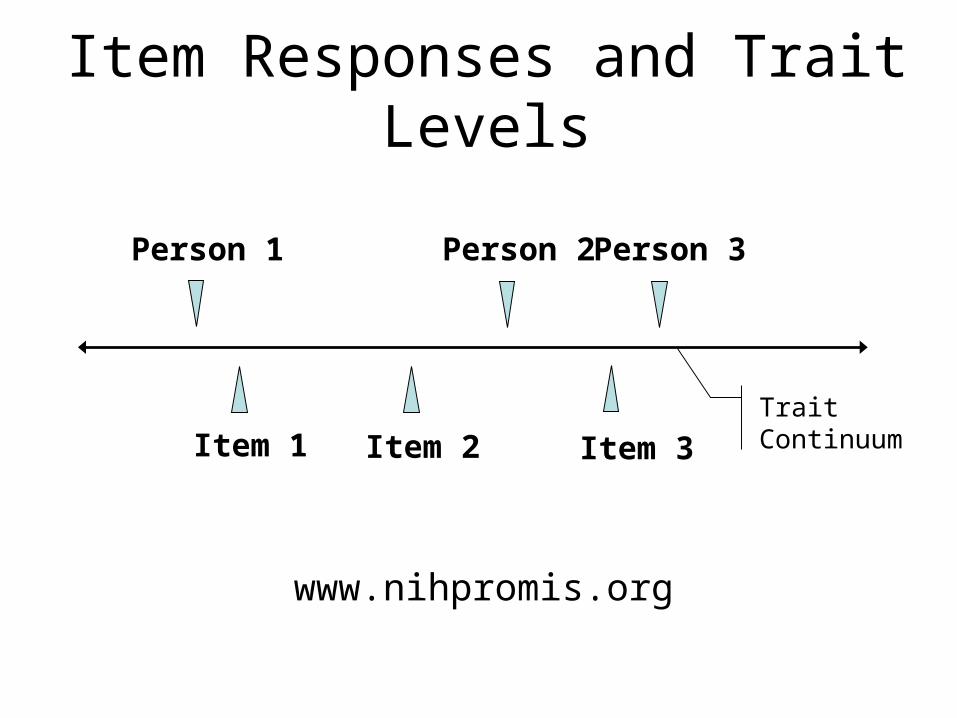
Item Responses and Trait Levels
Item 1 Item 2 Item 3
Person 1 Person 2Person 3
TraitContinuum
www.nihpromis.org

Computer Adaptive Testing (CAT)
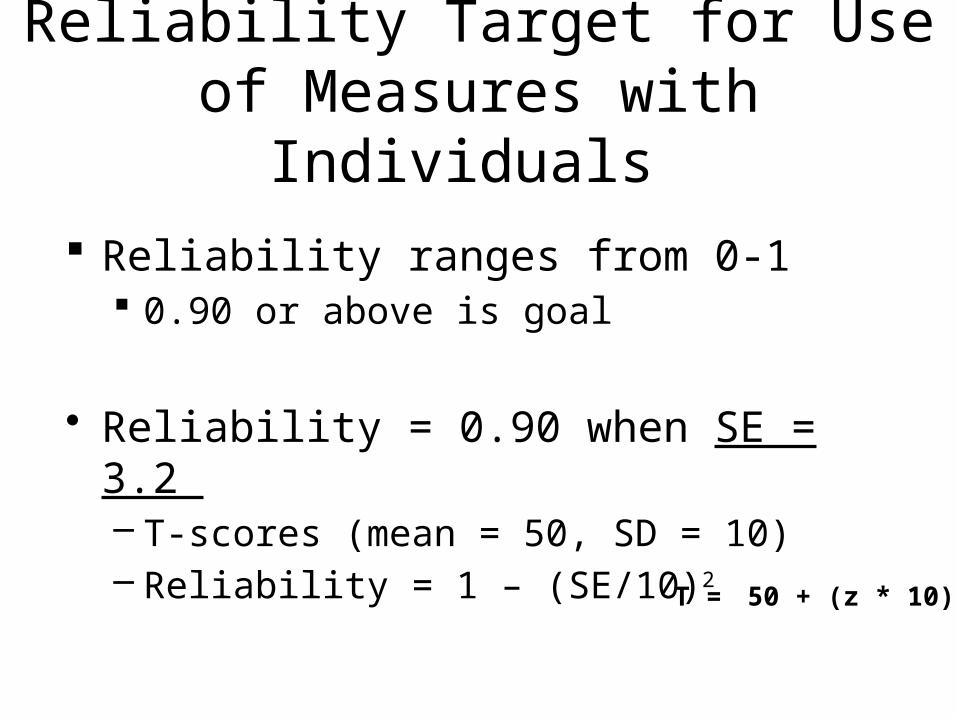
Reliability Target for Use of Measures with Individuals
Reliability ranges from 0-1 0.90 or above is goal
• Reliability = 0.90 when SE = 3.2 – T-scores (mean = 50, SD = 10)– Reliability = 1 – (SE/10)2
T = 50 + (z * 10)
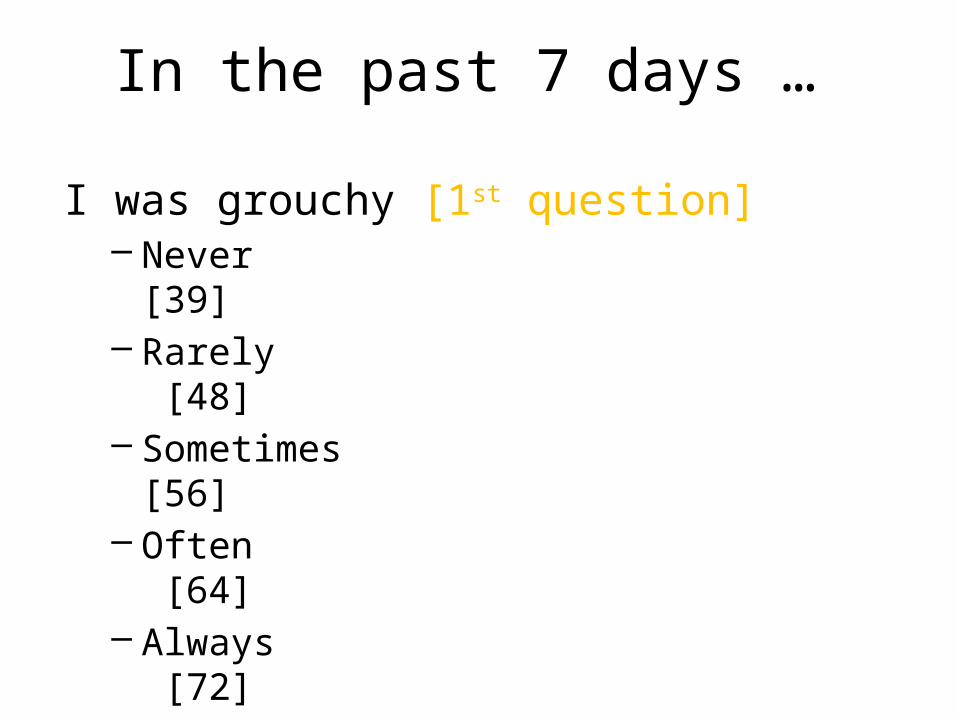
In the past 7 days …
I was grouchy [1st question]– Never [39]– Rarely [48]– Sometimes [56]– Often [64]– Always [72]
Estimated Anger = 56.1 SE = 5.7 (rel. = 0.68)
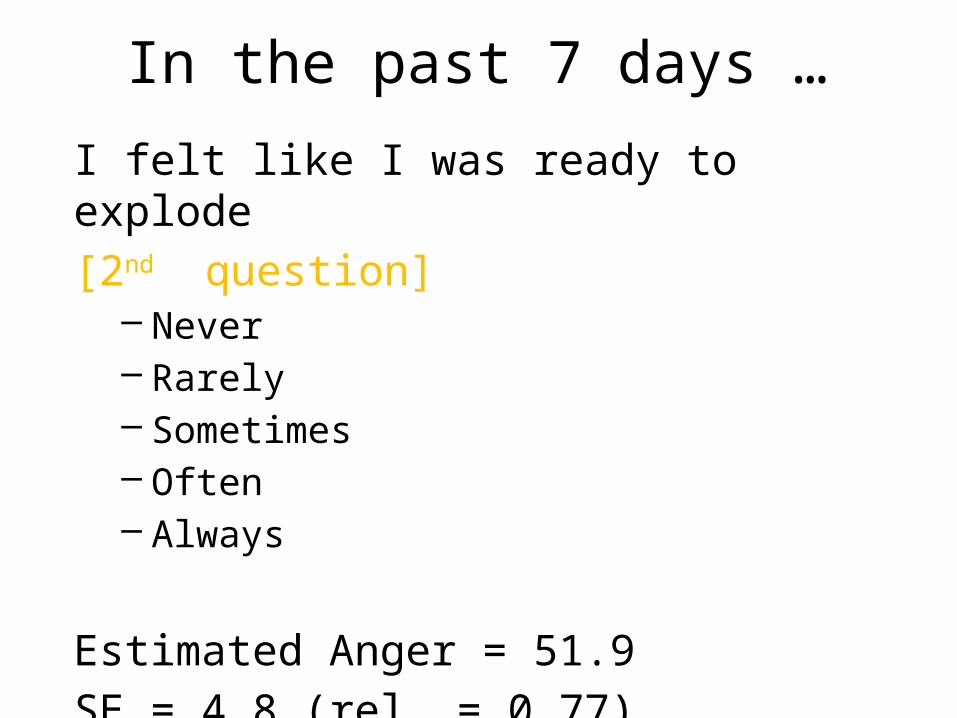
In the past 7 days …
I felt like I was ready to explode [2nd question]
– Never– Rarely– Sometimes– Often– Always
Estimated Anger = 51.9 SE = 4.8 (rel. = 0.77)
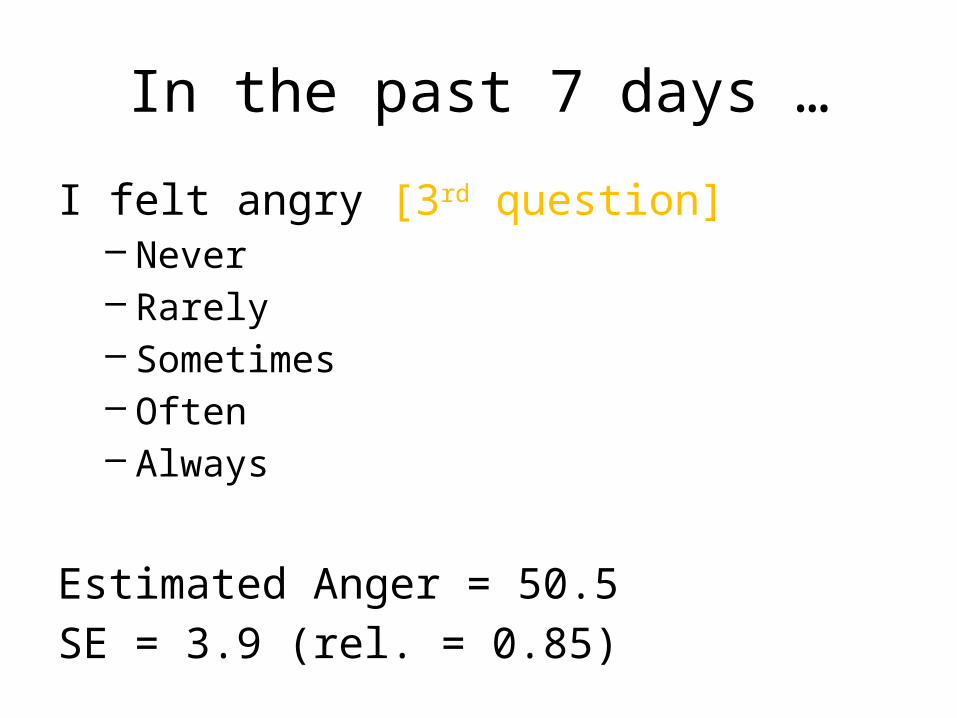
In the past 7 days …
I felt angry [3rd question]– Never– Rarely– Sometimes– Often– Always
Estimated Anger = 50.5 SE = 3.9 (rel. = 0.85)
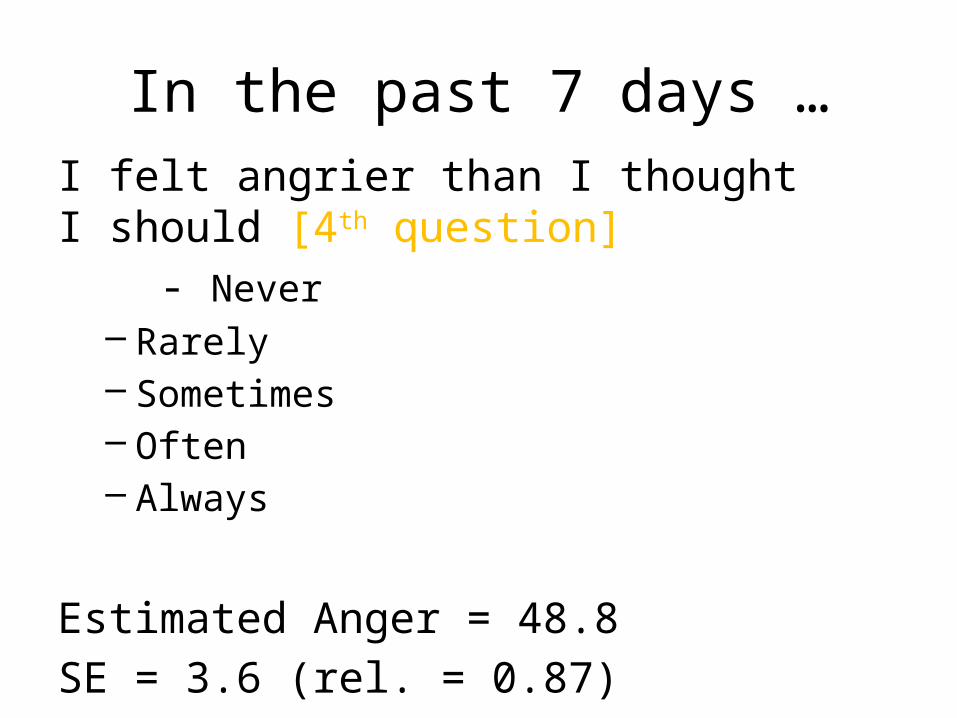
In the past 7 days …I felt angrier than I thought I should [4th question] - Never
– Rarely– Sometimes– Often– Always
Estimated Anger = 48.8 SE = 3.6 (rel. = 0.87)
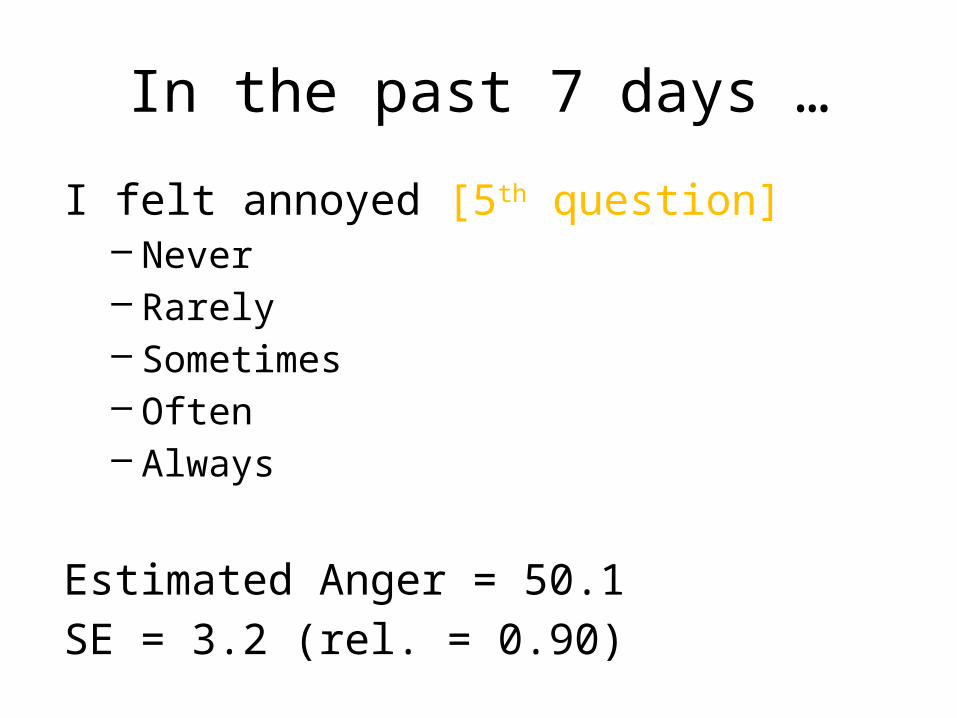
In the past 7 days …
I felt annoyed [5th question]– Never– Rarely– Sometimes– Often– Always
Estimated Anger = 50.1 SE = 3.2 (rel. = 0.90)

In the past 7 days …
I made myself angry about something just by thinking about it. [6th question]
– Never– Rarely– Sometimes– Often– Always
Estimated Anger = 50.2 SE = 2.8 (rel = 0.92)
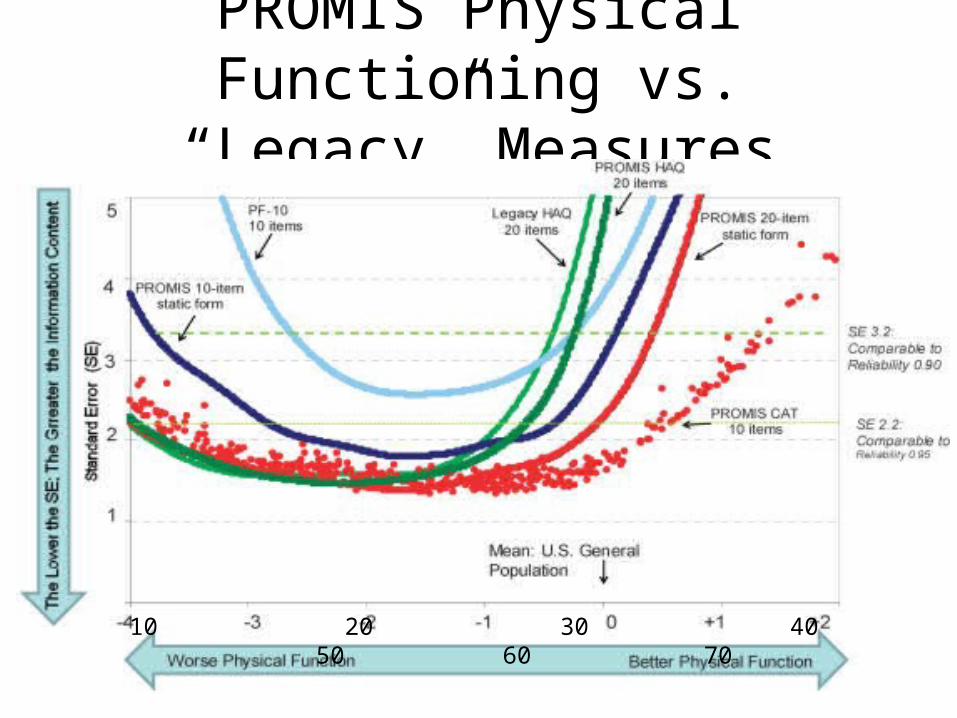
PROMIS Physical Functioning vs. “Legacy” Measures
10 20 30 40 50 60 70
40
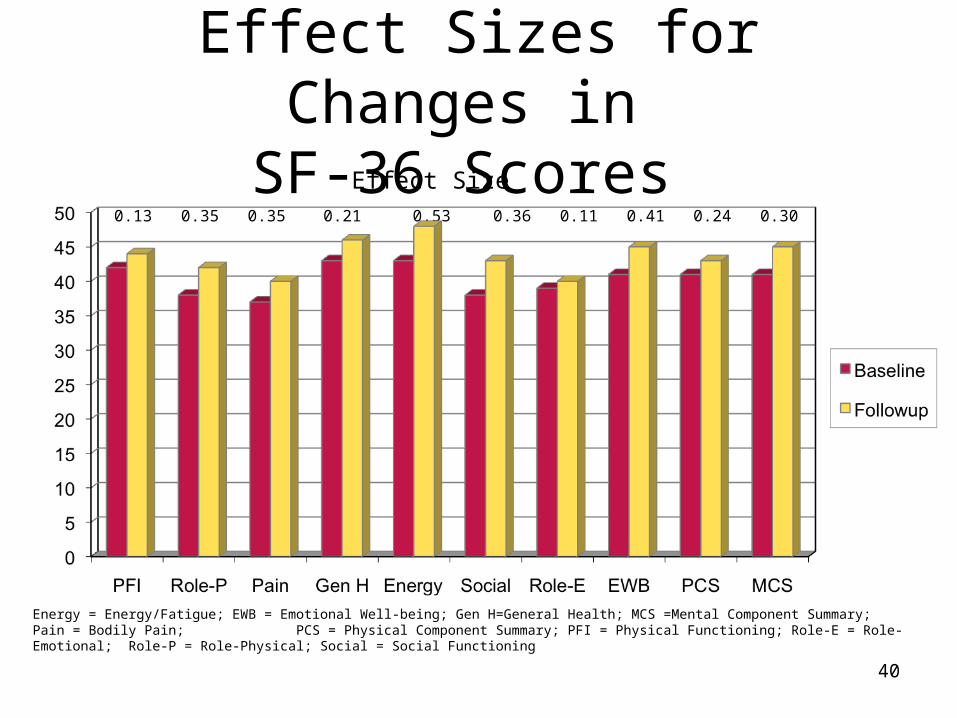
Effect Sizes for Changes in
SF-36 Scores 0.13 0.35 0.35 0.21 0.53 0.36 0.11 0.41 0.24 0.30
Effect Size
Energy = Energy/Fatigue; EWB = Emotional Well-being; Gen H=General Health; MCS =Mental Component Summary; Pain = Bodily Pain; PCS = Physical Component Summary; PFI = Physical Functioning; Role-E = Role-Emotional; Role-P = Role-Physical; Social = Social Functioning
41
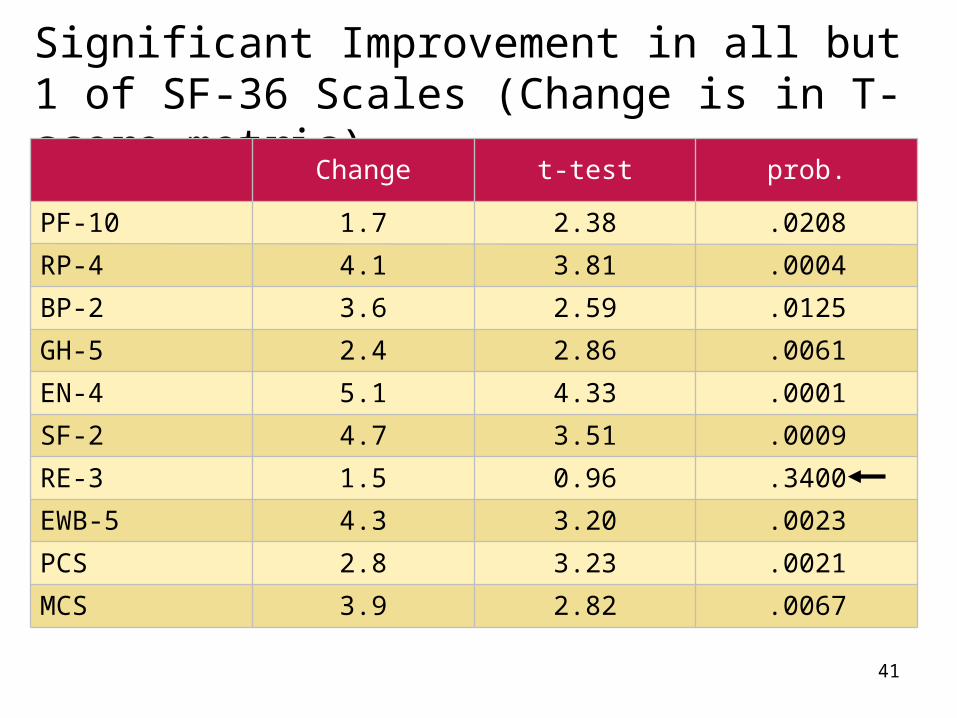
Significant Improvement in all but 1 of SF-36 Scales (Change is in T-score metric)
Change t-test prob.
PF-10 1.7 2.38 .0208
RP-4 4.1 3.81 .0004
BP-2 3.6 2.59 .0125
GH-5 2.4 2.86 .0061
EN-4 5.1 4.33 .0001
SF-2 4.7 3.51 .0009
RE-3 1.5 0.96 .3400
EWB-5 4.3 3.20 .0023
PCS 2.8 3.23 .0021
MCS 3.9 2.82 .0067
42
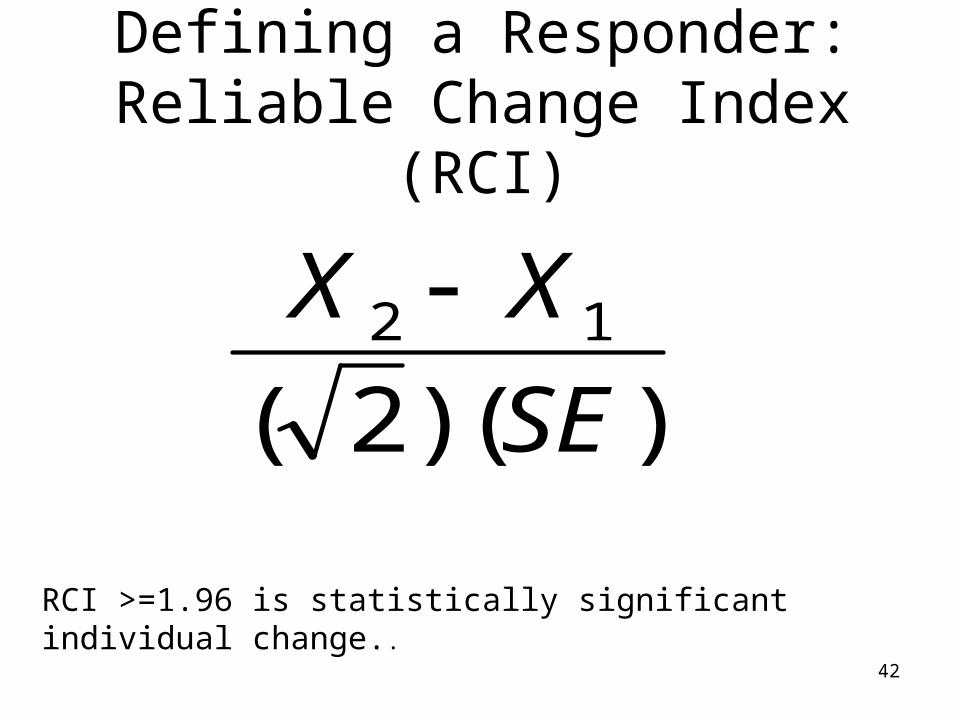
Defining a Responder: Reliable Change Index
(RCI)
)( )2(12
SE
XX
RCI >=1.96 is statistically significant individual change..
43
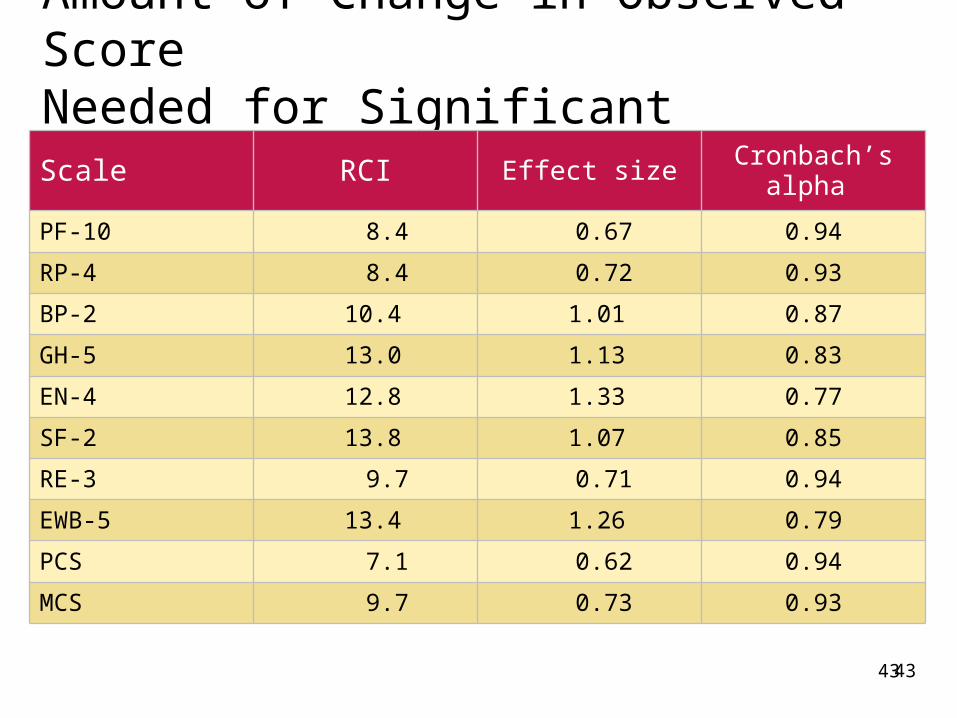
Amount of Change in Observed Score Needed for Significant Individual ChangeScale RCI Effect size Cronbach’s alpha
PF-10 8.4 0.67 0.94
RP-4 8.4 0.72 0.93
BP-2 10.4 1.01 0.87
GH-5 13.0 1.13 0.83
EN-4 12.8 1.33 0.77
SF-2 13.8 1.07 0.85
RE-3 9.7 0.71 0.94
EWB-5 13.4 1.26 0.79
PCS 7.1 0.62 0.94
MCS 9.7 0.73 0.93
43
44
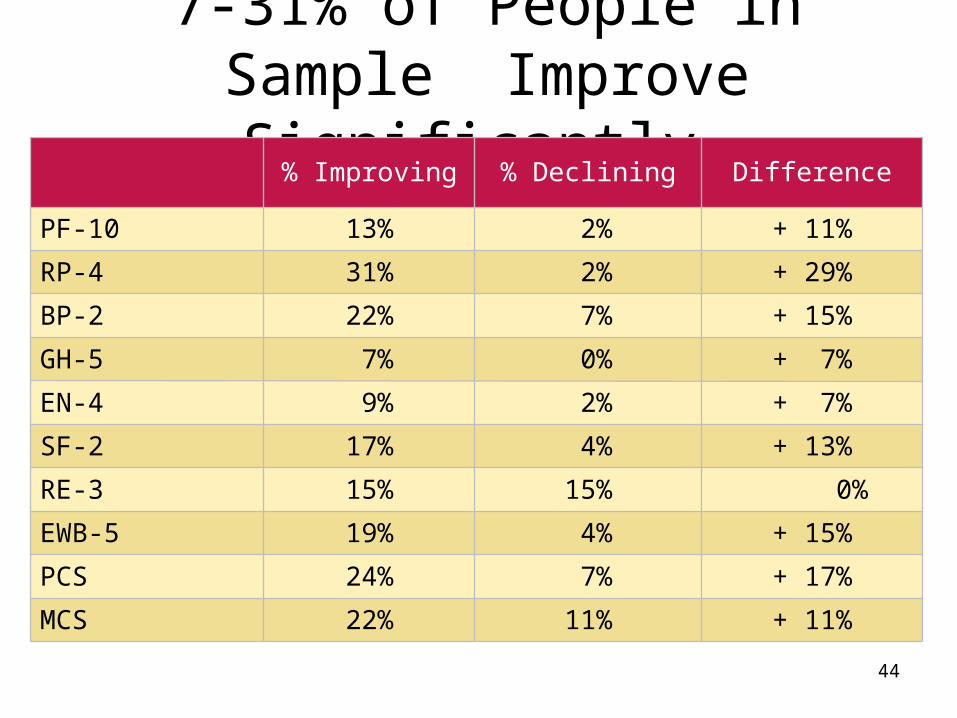
7-31% of People in Sample Improve Significantly
% Improving % Declining Difference
PF-10 13% 2% + 11%
RP-4 31% 2% + 29%
BP-2 22% 7% + 15%
GH-5 7% 0% + 7%
EN-4 9% 2% + 7%
SF-2 17% 4% + 13%
RE-3 15% 15% 0%
EWB-5 19% 4% + 15%
PCS 24% 7% + 17%
MCS 22% 11% + 11%

45
Questions?
Contact Information:[email protected] (310-794-2294)
Powerpoint file available for downloading at: http://gim.med.ucla.edu/FacultyPages/Hays/