measuring basic needs satisfaction: evaluating previous...
TRANSCRIPT

Contemporary Educational Psychology 35 (2010) 280–296
Contents lists available at ScienceDirect
Contemporary Educational Psychology
journal homepage: www.elsevier .com/locate /cedpsych
Measuring basic needs satisfaction: Evaluating previous researchand conducting new psychometric evaluations of the Basic NeedsSatisfaction in General Scale
Mary M. Johnston *, Sara J. FinneyCenter for Assessment and Research Studies, MSC 6806, Department of Graduate Psychology, James Madison University, Harrisonburg, VA 22807, United States
a r t i c l e i n f o a b s t r a c t
Article history:Available online 10 April 2010
Keywords:Basic needs satisfactionSelf-Determination TheoryConstruct validity
0361-476X/$ - see front matter � 2010 Elsevier Inc. Adoi:10.1016/j.cedpsych.2010.04.003
* Corresponding author.E-mail address: [email protected] (M.M
1 Although SDT currently postulates the existence orelatedness are currently the only three needs that adheFor instance, several needs previously hypothesized bypsychological well-being; they are considered desiresconsequences to an individual rather than increase weland Deci (2000c) and Ryan and Brown (2003).
Self-Determination Theory specifies the existence of three basic psychological needs: autonomy, compe-tence, and relatedness. The current set of studies (a) provides a narrative review of past research on theBasic Needs Satisfaction in General Scale, (b) examines its dimensionality which has been assumed butnot empirically studied, and (c) gathers external validity evidence. Confirmatory factor analysis was usedto test the existence of a one- and a three-factor solution; neither model fit the data. After patterns ofmisfit were examined across three independent samples, a reduced, 16-item three-factor model with anegative-worded method effect was championed. External validity evidence, collected by examiningthe differential relationships between the three needs and measures of well-being and worry, supportedthe distinctiveness of the three needs. Although the results are promising, future research is needed toexamine the generalizability of the psychometric properties of the modified scale.
� 2010 Elsevier Inc. All rights reserved.
1. Introduction
During the past century the theory that humans have basicneeds has been developed and expanded by several different theo-rists. For example, some researchers have theorized needs are in-nate in humans (e.g., Deci & Ryan, 2000; Hull, 1943), whereasother researchers have theorized needs are learned over time(e.g., McClelland, 1965; Murray, 1938). Furthermore, researchershave differed in regards to what constitutes a need. Some research-ers have proposed needs are psychological in nature (e.g., domi-nance; Murray, 1938), whereas other researchers have proposedneeds are physiological in nature (e.g., food; Hull, 1943). In con-trast, some theorists have proposed needs are a combination ofthe both (e.g., Maslow, 1970). Self-Determination Theory (SDT) de-fines needs as innate, psychological, and essential for well-being(Deci & Ryan, 2000).
ll rights reserved.
. Johnston).f three basic psychological needs, ire to the criterion of needs as definother theories (e.g., achievement a(Baard, Deci, & Ryan, 2004; Ryan
l-being (Ryan & Brown, 2003). For m
1.1. Basic needs according to Self-Determination Theory
SDT postulates the existence of three basic needs: autonomy,competence, and relatedness.1 Autonomy refers to the need to feelthat one’s behavior and resulting outcomes are self-determined, orself-caused, as opposed to being influenced or controlled by out-side forces (deCharms, 1968; Deci & Ryan, 1985, 2000). Compe-tence refers to the need to feel effective and capable ofperforming tasks at varying levels of difficulty (Harter, 1978; Ryan& Deci, 2002; White, 1959). Relatedness refers to the need to feelconnected to, supported by, or cared for by other people (Baumei-ster & Leary, 1995; Ryan & Deci, 2002). SDT stipulates all threeneeds must be fulfilled for psychological well-being to occur (Deci& Ryan, 2000). That is, if only one or two of the three needs arefulfilled psychological health will suffer (Deci & Ryan, 2000; Ryan,1995).
t is important to note there may exist more. However, autonomy, competence, anded by SDT (i.e., required for psychological well-being and growth; Ryan & Deci, 2000c).nd self-esteem) are not considered needs by SDT because they do not directly impact& Deci, 2000c). Furthermore, these desires are often detrimental or entail negativeore information regarding this discussion, please refer to Deci and Ryan (2000), Ryan

2 The BNSG-S, BNSW-S, and IMI were retrieved from the website, http:/www.psych.rochester.edu/SDT/questionnaires.php, which is maintained by E. Decand R. Ryan from the University of Rochester. It should be noted that the website issubject to change.
M.M. Johnston, S.J. Finney / Contemporary Educational Psychology 35 (2010) 280–296 281
In addition to being important for psychological well-being,according to the sub-theories of SDT, Cognitive Evaluation Theory(CET) and Organismic Integration Theory (OIT), needs satisfactionis also crucial for psychological growth (Deci & Ryan, 2000; Ryan& Deci, 2000a, 2002). According to CET, the fulfillment of basicneeds (autonomy and competence in particular) has a direct, posi-tive influence on intrinsic motivation (i.e., performing an activityfor inherent interests and pleasure; Deci & Ryan, 1985; Ryan &Deci, 2000a, 2002). That is, feelings of being controlled by externalforces or being ineffective regarding the task at hand will under-mine levels of intrinsic motivation and will result in being con-trolled by external criteria, such as a pay check or a superior’sapproval (Deci & Ryan, 1985, 2000; Ryan & Deci, 2000a). Moreover,according to OIT, psychological growth (becoming more autono-mous in behaviors performed), aids in the creation of a ‘‘unifiedsense of self”, or a person who successfully interacts with the socialenvironment and others (Ryan & Deci, 2002, p. 5). Specifically,growth occurs with the integration and internalization of ideasor behaviors formerly motivated by extrinsic forces, or the accep-tance and valuing of behaviors initially performed for external rea-sons (Ryan, 1995; Ryan & Deci, 2002). However, according to OIT,this will only occur when the needs of autonomy, competence,and relatedness are met (Ryan & Deci, 2000b, 2002).
Satisfaction of the basic needs for autonomy, competence, andrelatedness has been positively related to well-being (e.g., Reis,Sheldon, Gable, Roscoe, & Ryan, 2000; Sheldon & Niemiec, 2006),satisfaction with life (e.g., Meyer, Enstrom, Harstveit, Bowles, &Beevers, 2007), aspirations (e.g., Niemiec, Ryan, & Deci, 2009),and self-esteem (e.g., Thøgersen-Ntoumani & Ntoumanis, 2007)and has been negatively related to depression (e.g., Wei, Philip,Shaffer, Young, & Zakalik, 2005), and anxiety (e.g., Deci et al., 2001).
1.2. The current state of measurement of basic needs satisfaction
Clearly, there has been an extensive amount of research exam-ining needs fulfillment (Deci & Ryan, 2000). However, less atten-tion has been paid to how needs satisfaction is being measured.The satisfaction of needs has been measured using various meth-ods (e.g., self-report measures and diary studies) and in varioussettings. The satisfaction of basic needs has been primarily mea-sured in context-specific settings such as work (e.g., Deci et al.,2001) and relationships (e.g., La Guardia, Ryan, Couchman, & Deci,2000). Recently a measure was created to assess basic needs satis-faction in general as opposed to a specific context: the Basic NeedsSatisfaction in General Scale (BNSG-S2; Gagné, 2003).
The BNSG-S has been used in several studies to assess generalneeds satisfaction (Conroy & Coatsworth, 2007a, 2007b; Gagné,2003; Kashdan, Julian, Merritt, & Uswatte, 2006; Kashdan, Mishra,Breen, & Froh, 2009; Meyer et al., 2007; Neff, 2003; Niemiec et al.,2009; Thøgersen-Ntoumani & Ntoumanis, 2007; Vansteenkiste,Lens, Soenens, & Luyckx, 2006; Wei et al., 2005). Given its use,one may assume the BNSG-S has been extensively studied. Inter-estingly, there has not been any rigorous study of the psychometricproperties of the scale. That is, there are no known factor analyticstudies of the BNSG-S (E. Deci, personal communication, July 1,2008; M. Vansteenkiste, personal communication, July 3, 2008).Unfortunately, this makes it difficult to make valid inferences fromthe scale as it is unknown what the BNSG-S is truly assessing. Thus,studies examining the psychometric properties of this measure areneeded.
1.3. Following a strong program of construct validation to evaluate theBNSG-S
In order to evaluate the BNSG-S, the framework for validity ex-plained by Benson (1998) will be used to organize existing infor-
mation about the scale. Benson (1998) outlined three stagesrequired to establish a strong program of construct validity: sub-stantive, structural, and external (see also Benson & Hagtvet,1996). The first stage (substantive) refers to the process of definingthe theoretical and empirical domains of the construct of interest.Specifically, the theoretical domain is representative of all informa-tion known about the construct; it is the ‘‘scientific theory sur-rounding the construct” (Benson, 1998, p. 12). The empiricaldomain is representative of all observed variables that are usedto represent the construct. Thus, the theoretical domain shouldbe broadly defined, whereas the empirical domain is more specificin nature but a function of the theoretical domain. The secondstage (structural) involves examining the interrelationships be-tween the observed variables (e.g., the items). Correlations, inter-nal consistency, and factor analysis are often assessed at thisstep. The third stage (external) involves examining if the constructis related to external constructs in theoretically expected ways.This is considered the most essential stage because it providesinformation regarding the nomological network of the construct.Using Benson’s strong program of construct validation as a frame-work, the BNSG-S is evaluated below.
1.3.1. Substantive stageThe BNSG-S was adapted from the Basic Needs Satisfaction at
Work Scale (BNSW-S2) to measure needs satisfaction in a generaldomain as opposed to the context-specific domain of work (Gagné,2003). The items from the BNSW-S were slightly modified to mea-sure needs satisfaction in a general context. For example, theBNSW-S item ‘‘Most days I feel a sense of accomplishment fromworking”, which was written to measure the satisfaction of theneed for competence at work, was changed to ‘‘Most days I feel asense of accomplishment from what I do” to measure the satisfac-tion of the need for competence in general (see Appendix A for theBNSG-S items). Given that the BNSG-S was simply an adaptationfrom the BNSW-S, it is important to review the theoretical andempirical domains of the BNSW-S.
The BNSW-S was created to assess the satisfaction of employ-ees’ basic needs in the workplace (Kasser, Davey, & Ryan, 1992).Specifically, the BNSW-S was constructed by merging some newitems based on ‘‘theoretical notions” (Kasser et al., 1992, p. 180)with some modified items from the perceived–competence sub-scale of the Intrinsic Motivation Inventory (IMI; Ryan, 1982).2 Atthe time of the creation of the BNSW-S, the IMI consisted of at leastfour subscales that included perceived–competence, interest–enjoy-ment, effort, and pressure–tension. An example of an item from theperceived–competence subscale is: ‘‘I think I am pretty good at thisactivity”. This and other items from the perceived–competence sub-scale of the IMI were simply reworded and modified to be specific toa work setting for the BNSW-S. Items from the other IMI subscaleswere not used to create BNSW-S items. The modified items fromthe IMI and the newly written items based on needs satisfaction the-ory appear to adequately represent the empirical domain of assess-ing the satisfaction of needs at work.
1.3.2. Structural stageUnfortunately, similar to the BNSG-S, there are no known stud-
ies that have examined the factor structure of the BNSW-S. As such,there is no empirical evidence of the dimensionality of either mea-sure and, in turn, there appears to be confusion regarding how toscore the responses to the measures. Specific to the BNSG-S, someresearchers have used a total score of general needs satisfaction
/i

3 The correlations between the individual subscale scores and external variablesviewed in Sections 1.3.3.2 and 1.3.3.3 were assessed for statistical differences by the
rst author of the current manuscript using the Meng, Rosenthal, and Rubin Z-testeng, Rosenthal, & Rubin, 1992). All of the relationships presented in this section are
gnificantly different unless otherwise noted (e.g., the correlations of similaragnitude presented in Section 1.3.3.2).
282 M.M. Johnston, S.J. Finney / Contemporary Educational Psychology 35 (2010) 280–296
(e.g., Gagné, 2003), whereas others have computed three subscalesto represent three distinct needs (e.g., Niemiec et al., 2009). Simi-larly, specific to the BNSW-S, some researchers have created a totalscore of needs satisfaction at work (e.g., Deci et al., 2001), whereasother researchers have created three subscales scores to representthe three distinct needs of autonomy, competence, and relatedness(e.g., Ghorbani & Watson, 2006). Furthermore, for both the BNSG-Sand the BNSW-S, some researchers who have created a total scoreof needs satisfaction have also created individual subscale scores torepresent the three distinct needs (e.g., Gagné, 2003). Researchershave assumed validity, versatility, and flexibility of the scale, andhave stated it can be scored either way (E. Deci, personal commu-nication, June 12, 2008). These beliefs appear to be due in part toresearchers erroneously citing others studies to support their useand scoring of the BNSG-S. For example, authors have claimedthe BNSG-S has ‘‘excellent psychometric properties” and cited Gag-né (2003) in support (Kashdan et al., 2006, p. 565). Although, Gag-né (2003) used the BNSG-S to study general needs, she did notexamine the psychometric properties of the BNSG-S. In addition,researchers have also erroneously cited studies which used theBNSW-S to provide psychometric evidence of the properties ofthe BNSG-S. For example, Neff (2003) cited two studies (i.e., Ilardi,Leone, Kasser, & Ryan, 1993; Kasser et al., 1992) as providing goodpsychometric evidence of the BNSG-S; however both studies citedused older versions of the BNSW-S, not the BNSG-S. This is prob-lematic because the BNSW-S and the BNSG-S are two differentmeasures and do not provide evidence of dimensionality for oneanother.
For the BNSG-S, the only sources of information regarding thestructural component of the validity process are in the form of reli-ability coefficients and subscale correlations, not in the form of fac-tor analytic studies, which according to Benson and Hagtvet(1996), ‘‘would provide evidence whether the observables (e.g.,the items) behave according to theory” (p. 91). Reported measuresof internal consistency associated with a total needs satisfactionscore ranged from .84 to .90 (Gagné, 2003; Meyer et al., 2007;Vansteenkiste et al., 2006; Wei et al., 2005). With respect to thethree subscales computed from the BNSG-S scores, researchers re-ported values of internal consistency ranging from .61 to .81 for theautonomy subscale, .60 to .86 for the competence subscale, and .61to .90 for the relatedness subscale (Conroy & Coatsworth, 2007a,2007b; Gagné, 2003; Kashdan et al., 2006, 2009; Meyer et al.,2007; Niemiec et al., 2009; Thøgersen-Ntoumani & Ntoumanis,2007; Vansteenkiste et al., 2006; Wei et al., 2005). It is importantto note that Cronbach’s coefficient alpha is only appropriate tointerpret when researchers are confident there is only one con-struct or phenomenon being measured; that is, the scores are uni-dimensional (McDonald, 1999). Therefore, it is confusing whenresearchers (i.e., Gagné, 2003; Meyer et al., 2007; Wei et al.,2005) report measures of internal consistency associated with a to-tal needs scale (and use a total score in the analyses) when it wasassumed by the same researchers that the scale measures threeseparate constructs (autonomy, competence, and relatedness). Thispractice may simply reflect the confusion associated with thedimensionality and scoring of the measure.
Correlations among the three subscales have been examined byresearchers and shed some limited light on the distinctiveness ofthe three needs as operationalized by the BNSG-S. Specifically, cor-relations between the subscales ranged between r = .46 and .72 forautonomy and competence, r = .33–.79 for autonomy and related-ness, and r = .27–.80 for relatedness and competence (Conroy &Coatsworth, 2007a; Gagné, 2003; Kashdan et al., 2009; Meyeret al., 2007; Thøgersen-Ntoumani & Ntoumanis, 2007; Vansteenk-iste et al., 2006; Wei et al., 2005). Given the lack of factor analyticstudies, researchers may be tempted to infer that the wide range ofsubscale correlations is evidence to suggest the BNSG-S is not
measuring one overall construct of needs satisfaction, but insteada measure of three different constructs. Furthermore, the differen-tial relationships exhibited between the subscales and externalcriteria described below could be used as additional evidence tosuggest the BNSG-S may be representing multiple constructs.
1.3.3. External stageBecause some studies have scored the BNSG-S as both a total
measure of needs satisfaction and three individual needs, whereasother studies have only scored the BNSG-S as three individualneeds, and given the individual subscales have exhibited similarand differential relationships with external variables, the followingsection examines the relationships between the BNSG-S and exter-nal variables in three parts. First, the relationships between the to-tal needs satisfaction scores and external variables are examined.Second, the relationships between the individual subscales (auton-omy, competence, and relatedness) and external variables of simi-lar strength are reviewed. Finally, the relationships between theindividual subscales and external variables of differential strengthare reviewed.3
1.3.3.1. Correlations with the total needs satisfaction score. The totalBNSG-S score has been positively related to well-being among Chi-nese college students studying abroad in Denmark (Vansteenkisteet al., 2006), happiness and self-actualization in women whoworked as models in Great Britain, happiness, self-actualization,and life satisfaction in women who did not work as models inGreat Britain (Meyer et al., 2007), pro-social behavior (i.e., volun-teering) and parental support (Gagné, 2003). In contrast, the satis-faction of needs when represented by a total needs score has beennegatively related to depression in Chinese college students study-ing abroad (Vansteenkiste et al., 2006) and anxiety, depression, andloss of confidence in women working as models in Great Britain(Meyer et al., 2007). Thus, the external relationships associatedwith a total needs satisfaction score appear to support SDT’s defi-nition of needs satisfaction (i.e., higher levels of needs satisfactionare positively related to measures of well-being and negatively re-lated to measures of ill-being).
1.3.3.2. Similar relationships between individual subscale scores andexternal variables. Relationships of similar strengths have emergedbetween the three subscales (autonomy, competence, and related-ness) and external variables that serve as proxy measures of well-being. Specifically, satisfaction of the needs for autonomy, compe-tence, and relatedness related positively and at approximately thesame magnitude to life satisfaction (r = .50, r = .59, r = .57), self-es-teem (r = .50, r = .53, r = .41) and positive affect in American collegegraduates (r = .58, r = .58, r = .46; Niemiec et al., 2009); life satisfac-tion (r = .51, r = .49, r = .31) and happiness in British women(r = .44, r = .43, r = .36; Meyer et al., 2007); and psychologicalwell-being (r = .56, r = .58, r = .60) and vitality in Chinese collegestudents (r = .51, r = .58, and r = .61, respectively; Vansteenkisteet al., 2006). In contrast, the individual subscales of autonomy,competence, and relatedness related negatively and at approxi-mately the same magnitude to depression in American college stu-dents (r = �.63, r = �.63, r = �.62; Wei et al., 2005); negative affectin male (r = �.43, r = �.55, r = �.59) and female (r = �.50, r = �.50,r = �.37) college students (Kashdan et al., 2009); negative affect(r = �.46, r = �.39, r = �.34) and anxiety (r = �.47, r = �.40,
refi(Msim

M.M. Johnston, S.J. Finney / Contemporary Educational Psychology 35 (2010) 280–296 283
r = �.35) in college graduates (Niemiec et al., 2009), and the drivefor thinness (r = �.51, r = �.46, r = �.39) and introjected regulationin British aerobics instructors (r = �.29, r = �.36, r = �.26, respec-tively; Thøgersen-Ntoumani & Ntoumanis, 2007). The correlationsof similar magnitude between the individual subscales and exter-nal variables may be incorrectly used to suggest that the three sub-scales may not be very distinct from one another. Obviously, thethree needs may have equal predictive utility in some situationsor for some external variables; thus, findings of this nature donot imply that non-differential relationships will always occur orthat theoretically the needs are not distinct.
1.3.3.3. Differential relationships between individual subscale scoresand external variables. When scored individually, the three sepa-rate subscales of the BNSG-S have exhibited differential relation-ships with external variables. For instance, the autonomysubscale exhibited a stronger relationship with well-being in Brit-ish women (r = .73) than the need for competence (r = .52),although relationships of similar strength emerged between thethree subscales and well-being in Chinese college students (Meyeret al., 2007; Vansteenkiste et al., 2006). The need for competencesubscale (r = .60) exhibited a stronger relationship with positive af-fect in female college students than the need for autonomy orrelatedness subscales (r = .44, r = .39, respectively; Kashdan et al.,2009). In addition, the need for competence subscale exhibited astronger relationship with pro-social engagement (i.e., volunteer-ing; r = .40) than the autonomy subscale (r = .19), but was not dif-ferent from the relatedness subscale (r = .26; Gagné, 2003). Theneed for relatedness subscale exhibited a stronger negative rela-tionship with depression in Chinese college students (r = �.61)than did the need for competence subscale (r = �.46; Vansteenk-iste et al., 2006). In contrast, the need for relatedness subscalewas not correlated with depression in British models althoughdepression was negatively correlated with the need for autonomyand competence subscales (Meyer et al., 2007). Furthermore, theneed for relatedness exhibited a weaker relationship with socialphysique anxiety among British aerobics instructors (r = �.36) thanthe needs for autonomy or competence (r = �.57, r = �.52, respec-tively; Thøgersen-Ntoumani & Ntoumanis, 2007).
1.3.3.4. Need for dimensionality studies prior to examining externalvalidity. Researchers who believe the BNSG-S is a unidimensionalmeasure of needs satisfaction may turn to the studies reviewedabove that exhibit theoretically-expected relationships betweenthe total score and external variables or similar relationships be-tween the three subscales and external variables as evidence ofthe unidimensional nature of the BNSG-S (e.g., Vansteenkiste
1
Satisfaction of the Need for Autonomy
4 8 20 17 14 11 3
Satisfaction othe Need forCompetence
5 10 13
Fig. 1. Three-factor m
et al., 2006). As noted above, finding non-differential relationshipsfor one external variable does not imply the needs would not func-tion differentially for a different external variable. Researchers whobelieve the BNSG-S is a measure of three distinct needs may betempted to use the studies that exhibited differential relationshipsbetween the three subscales and external variables as evidence ofthe multidimensional nature of the scale (e.g., Neff, 2003). How-ever, it is extremely important to note that the similar and differ-ent relationships exhibited between the individual subscale scoresand the external variables could be simply due to the differentialreliabilities of the autonomy, competence, and relatedness sub-scales. That is, reliability coefficients impact the magnitude of rela-tionships between the three subscales and external variables,which could result in relationships appearing more similar or moredifferent than they actually are. In addition, the differential corre-lations exhibited could be due to sampling error or interactionswith different populations and contexts being compared. Thus,the relationships exhibited between the subscale scores and exter-nal criteria should not be solely relied onto make judgmentsregarding the dimensionality of a measure.
In sum, although the external component stage is consideredthe most important stage (Benson, 1998), it should not be exam-ined until the factor structure of the scale has been studied, be-cause it is unclear how the scores should be computed. If thescale was multidimensional, the use of a total score would maskthe differential relationships exhibited between the individual sub-scale scores and external variables.
1.4. Purpose of the study
Given the importance of needs satisfaction in regards to psycho-logical well-being and growth as defined by SDT, the use of theBNSG-S to assess the satisfaction of needs in general, the confusionregarding how to score the measure, and the dearth of psychomet-ric study of the measure, the purpose of the current study was toinvestigate the construct validity of the BNSG-S by (a) examiningthe factor structure of the BNSG-S and (b) investigating the exter-nal validity of the scale by estimating theoretically-expected rela-tionships with external variables.
The first purpose involved testing the following models usingconfirmatory factor analysis (CFA): (a) a one-factor model assess-ing the unidimensionality of the BNSG-S and (b) a three-factormodel representing autonomy, competence, and relatedness (seeFig. 1). It was hypothesized a three-factor model would fit the datasignificantly and practically better than a one-factor model given(a) SDT stipulates three distinct needs and emphasizes that allthree needs must be individually met for wellness and (b) three
f
19 15
Satisfaction of the Need for Relatedness
18 16 12 21 6 2 7 9
odel of BNSG-S.

284 M.M. Johnston, S.J. Finney / Contemporary Educational Psychology 35 (2010) 280–296
distinct needs appeared to have been operationally defined whenthe BNSG-S items were created.
The second purpose focused on the relationships between needssatisfaction and theoretically-related variables: (a) psychologicalwell-being, (b) the motive to avoid failure, and (c) anxiety. Thesevariables were chosen based on congruence with SDT’s perspectiveof well-being. Given the three-factor model was hypothesized tobe championed, differential relationships were hypothesized be-tween the three needs and external measures; these hypothesesare described below.
1.4.1. Well-beingResearchers often use several different measures to represent
well-being (e.g., positive affect, negative affect, and life satisfac-tion; Diener, Emmons, Larsen, & Griffin, 1985). When measuredas a combination of life satisfaction, happiness, and self-actualiza-tion, well-being has been positively related to satisfaction of theneeds for autonomy and competence in British models, and auton-omy, competence, and relatedness in non-models (Meyer et al.,2007). For the current study, three of the six well-being dimen-sions conceptualized by Ryff (1989) were used: autonomy (AU;i.e., not being influenced by others), environmental mastery (EM;i.e., the ability to shape or create environments that are in line withpersonal needs), and positive relations with others (PR; i.e., theability to be in close relationships with others). These dimensionsof well-being were chosen because they align with SDT’s eudai-monic, as opposed to hedonic, perspective of well-being (Ryan &Deci, 2000c, 2002). That is, well-being is defined ‘‘in terms of a fullyfunctioning person” (Ryan & Deci, 2000c, p. 323), as opposed to aperson displaying individual pieces of evidence such as ‘‘a subjec-tive experience of affect positivity” (Deci & Ryan, 2000, p. 243;Ryan & Deci, 2000c, 2002).
In line with SDT, AU, EM, and PR were expected to be positivelyrelated to satisfaction of the needs for autonomy, competence, andrelatedness. In addition, AU was expected to exhibit a stronger po-sitive relationship with the satisfaction of the need for autonomythan the satisfaction of the need for competence or relatedness.This differential relationship was expected because AU and the sat-isfaction of the need for autonomy both assess feelings and atti-tudes towards autonomy, whereas the satisfaction of the needfor competence and relatedness do not. Furthermore, EM was ex-pected to exhibit a stronger positive relationship with the satisfac-tion of the need for competence than the satisfaction of the needfor autonomy or relatedness because as people’s confidence intheir ability to handle and control surrounding environments in-creases (i.e., environmental mastery increases), the extent to whichthey feel capable, or confident (i.e., satisfaction of the need forcompetence) should also increase. Also, PR was expected to exhibita stronger positive relationship with satisfaction of the need forrelatedness than the need for autonomy or competence becausePR and satisfaction of the need for relatedness both address theexperience, the need to develop, and the desire to have personalrelationships with other people, whereas the satisfaction of theneeds for autonomy and competence do not.
1.4.2. Motive to Avoid FailureThe motive to avoid failure (MAF) refers to the extent to which
people will avoid situations that induce feelings that failure is apossibility (Hagtvet & Benson, 1997). The MAF has been positivelyrelated to measures of worry, emotionalism, anxiety, test-irrele-vant thinking, and tension and has been negatively related to com-petiveness and self-determination (Elliot & McGregor, 2001;Hagtvet & Benson, 1997). For the current study, Hagtvet and Ben-son’s (1997) unidimensional conceptualization of the MAF wasused. The MAF was expected to be negatively related to the satis-faction of the needs for autonomy, competence, and relatedness. As
individuals decrease in the degree to which their needs are satis-fied, their desire to avoid failure increases. More specifically, itwas hypothesized that the MAF would exhibit a stronger negativerelationship with satisfaction of the need for competence thanwith the needs for autonomy or relatedness. That is, people whofeel competent at performing tasks should also not feel the needto avoid situations in which failure is a possibility.
1.4.3. AnxietyAnxiety refers to feelings of worry and restlessness. When mea-
sured in general and with respect to one’s physical appearance,anxiety has been negatively related to satisfaction of the needsfor autonomy, competence, and relatedness (Niemiec et al., 2009;Thøgersen-Ntoumani & Ntoumanis, 2007). For the current study,three of the six dimensions of worry as conceptualized by Osmanet al. (2001) were used to assess anxiety and worry: general anxi-ety symptoms (GAS), worrisome thinking (WST), and social ade-quacy concern (SAC). The three subscales of autonomy,competence, and relatedness were expected to be negatively re-lated to the GAS, WST, and SAC subscales. In addition, the GASand WST subscales were expected to exhibit a stronger negativerelationship with the satisfaction of the need for autonomy sub-scale than the satisfaction of the need for competence or related-ness subscales because both constructs reflect a feeling of beingcontrolled by anxiety (e.g., ‘‘I feel physically tired and exhaustedwhen worrying about things”, ‘‘No matter how hard I try, I cannotstop or control worrying about something.”). SAC was expected toexhibit a stronger negative relationship with satisfaction of theneed for relatedness than to the need for autonomy or competence.This differential relationship was expected because SAC is specificto worrying about relationships and behavior around other people(e.g., ‘‘I worry about making a fool of myself around other peo-ple.”); if people felt cared for and supported by other people (i.e.,need for relatedness was satisfied), they should not worry abouttheir social behavior.
2. Methods
2.1. Participants and procedures
Three independent samples of students were used for this set ofstudies and each is described below: freshmen sample, upperclass-men sample, and psychology sample. All three data sets werescreened for missing data, out of range responses, and multivariateoutliers.
2.1.1. Participants and procedures for freshmen and upperclassmensamples
The first two samples consisted of students enrolled at a mid-sized southeastern university who participated in one of two uni-versity-wide assessment days. All students are required to partici-pate in two university-wide assessment days on campus: once inthe fall as incoming freshmen, prior to the beginning of classes,and once in the spring after accumulating 45–70 credit hours (thismay include students who are sophomores or juniors). On assess-ment day, students were randomly assigned to testing rooms oncampus, which were monitored by trained proctors. The size ofthe testing rooms varied. On average 80 students were tested ineach room; some rooms tested over 150 students. After providinginformed consent, students received a series of tests that were de-signed to assess their cognitive (i.e., general education) and non-cognitive (i.e., motivational) skills and attitudes. Before receivingeach test, students were read a standardized script of the testinstructions. Overall, testing sessions took approximately threehours to complete. The BNSG-S was administered approximately

M.M. Johnston, S.J. Finney / Contemporary Educational Psychology 35 (2010) 280–296 285
half-way through the testing sessions in the fall of 2007 (freshmensample) and the spring of 2008 (upperclassmen sample). Theusable sample sizes (after screening the data) from the freshmenand upperclassmen samples were 2598 and 1035 students. Partic-ipants from the freshmen sample had an average age of18.43 years, 63.5% were female, and 83.1% were Caucasian. Partic-ipants from the upperclassmen sample had an average age of20.26 years, 60.1% were female, and 79.9% were Caucasian.
2.1.2. Participants and procedures for psychology sampleThe third sample consisted of students enrolled in undergradu-
ate psychology courses at a mid-sized southeastern university. Stu-dents recruited through the undergraduate psychology subjectpool received course credit for participating. A maximum of 50 par-ticipants were tested per session.
The data collection procedures were identical for all students.At the beginning of each testing session, students were read ascript that detailed the purpose of the study and were told thatparticipation in the study was voluntary. After providing informedconsent, students were passed a packet containing a series of teststo be administered. To help insure students took their time on eachtest and put forth their best effort, tests were administered one at atime, and students were not allowed to proceed to the next test un-til everyone had finished the previous one. Directions for each testand the expected amount of time for completion were read prior toeach administration. Given the BNSG-S was the primary scale ofinterest in the study, it was the first test administered in each test-ing session. Following administration of the BNSG-S, students com-pleted three external measures (only administered in thepsychology sample) which were used to investigate the externalvalidity of the BNSG-S; these measures were counterbalanced dur-ing administration to reduce potential confounds such as test fati-gue. The sample size for the psychology sample (after screening thedata) was 492 students. The participants had an average age of19.41 years, 69.2% were female, and 84.5% were Caucasian.
2.2. Measures
2.2.1. Basic Needs Satisfaction in General Scale (BNSG-S)The BNSG-S is a 21-item measure that was created to assess the
satisfaction of basic psychological needs in general (see AppendixA for items). Participants were instructed to indicate how true theyfelt each statement was of their life and respond on a scale of 1 (Notat all true) to 7 (Very true). Nine of the 21 items are negativelyworded and were reversed scored prior to analyses. Higher scoresare indicative of a higher level of satisfaction of needs.
2.2.2. Scales of Psychological Well-Being (SPWB; Ryff, 1989)The SPWB is a 54-item multidimensional measure used to as-
sess well-being in general. Of the 54 items on the scale, 28 itemsare negatively worded and were reversed scored prior to obtainingscale scores. Subscale items were summed to create subscalescores; thus, higher scores on the subscales are indicative of higherlevels of each dimension of well-being. Although there are six sub-scales, the current study focused on only three: autonomy (AU),environmental mastery (EM), and positive relations with others(PR). Participants were asked to indicate the degree to which eachitem reflected how they felt about their life and to respond accord-ingly on a scale of 1 (Strongly Disagree) to 6 (Strongly Agree). Anexample of an item from the AU subscale is ‘‘My decisions arenot usually influenced by what everyone else is doing.” An exampleof an item from the EM subscale is ‘‘I am quite good at managingthe many responsibilities of my daily life”; and an example of anitem from the PR subscale is ‘‘I often feel lonely because I havefew close friends with whom to share my concerns.” Previous re-search examining the factor structure of the SPWB has generally
supported the six-factor structure hypothesized by Ryff (1989).Cronbach’s alphas in the current study for the AU, EM, and PR sub-scales were respectively, .81, .79, and .83.
2.2.3. Motive to Avoid Failure (MAF; Hagtvet & Benson, 1997)The MAF is a unidimensional six-item self-report measure that
assesses the extent to which individuals experience negative reac-tions to, or avoid, settings in which failure is a possibility. Partici-pants were instructed to indicate the extent to which they agreedwith the items on the scale of 1 (Almost never) to 4 (Almost always).Scale scores were computed by summing all of the items withinthe scale. Higher scores are indicative of higher levels of a motiveto avoid failure. An example of an item from the scale is, ‘‘I dislikeworking in situations if I’m uncertain of how well I will do”. Previ-ous research has supported the unidimensionality of the scale(Hagtvet & Benson, 1997). Cronbach’s alpha in the current studywas .87.
2.2.4. Student Worry Questionnaire (SWQ; Osman et al., 2001)The SWQ is a multidimensional 30-item measure used to assess
student-related worry. Although the entire scale was adminis-tered, the current study focused on three of the six subscales: wor-risome thinking (WST), social adequacy concern (SAC), and generalanxiety symptoms (GAS). An example of an item from the WSTsubscale is ‘‘I worry a lot about many daily life events and situa-tions.” An example of an item from the SAC subscale is ‘‘I worryabout what other people think of me”; and an example of an itemfrom the GAS subscale is ‘‘I feel restless or irritable when I worryabout things.” Participants were asked to rate how characteristiceach item was of themselves on a scale of 1 (Almost never charac-teristic of me) to 5 (Almost always characteristic of me). Subscalescores were computed by summing item responses. Higher scoresare indicative of higher levels of that particular subscale. Resultsfrom previous research examining the factor structure of theSWQ have supported the six-factor structure (Osman et al.,2001; Swerdzewski, 2008). Cronbach’s alphas in the current studywere the following for WST, SAC, and GAS, respectively: .90, .82,and .85.
3. Results
Descriptive statistics of the BNSG-S items and item correlationsfor the freshmen and upperclassmen samples, including values ofskewness and kurtosis, are presented in Table 1. Descriptive statis-tics of the BNSG-S items and item correlations for the psychologysample are presented in Table 2. All three data sets were screenedfor multicollinearity and univariate and multivariate normality.Results of the data screening procedures revealed all three samplesviolated the assumption of multivariate normality. Specifically, thefreshmen, upperclassmen, and psychology samples exhibited Mar-dia’s standardized values of multivariate kurtosis greater than 3(108.75, 59.63, and 42.92, respectively; Bentler & Wu, 2003).
3.1. Phase one of analysis: confirmatory factor analyses
All CFAs were performed using LISREL 8.72 (Jöreskog & Sörbom,2005). PRELIS 2.72 (Jöreskog & Sörbom, 2005) was used to generatethe covariance matrices from which the models were estimated.Because the assumption of multivariate normality was violatedfor all three samples, the Satorra–Bentler (SB) scaling method(Satorra & Bentler, 1994) was used in conjunction with maximumlikelihood (ML) estimation. Specifically, the SB scaling method wasused to adjust the v2 statistic, standard errors, and fit indices forthe amount of multivariate kurtosis in the data, thus yielding less

Table 1Correlations and descriptive statistics for the BNSG-S for the freshmen and upperclassmen samples.
Item 1 2 3 4 5 6 7 8 9 10 11 12 13 14 15 16 17 18 19 20 21 Mean SD Skew Kurtosis
1 – 0.42 0.17 0.09 0.33 0.36 0.16 0.38 0.33 0.28 0.09 0.28 0.32 0.30 0.14 0.11 0.34 0.19 0.22 0.30 0.36 5.73 1.27 �0.89 0.232 0.30 – 0.14 0.13 0.33 0.52 0.34 0.31 0.57 0.33 0.03 0.48 0.37 0.49 0.15 0.32 0.41 0.36 0.26 0.23 0.51 5.93 1.12 �1.22 1.743 0.09 0.08 – 0.29 0.19 0.19 0.25 0.25 0.19 0.17 0.16 0.18 0.31 0.23 0.33 0.20 0.27 0.30 0.55 0.29 0.24 5.15 1.46 �0.71 �0.014 0.16 0.10 0.23 – 0.00 0.05 0.13 0.07 0.02 0.04 0.20 0.04 0.16 0.09 0.21 0.15 0.18 0.12 0.29 0.20 0.10 3.48 1.51 0.22 �0.495 0.16 0.27 0.12 �0.02 – 0.44 0.19 0.40 0.33 0.37 �0.02 0.38 0.43 0.42 0.16 0.16 0.34 0.24 0.27 0.22 0.40 5.41 1.16 �0.43 �0.276 0.21 0.49 0.07 0.07 0.39 – 0.32 0.40 0.50 0.33 0.05 0.45 0.34 0.47 0.13 0.26 0.44 0.37 0.26 0.20 0.58 5.91 0.98 �0.86 0.527 0.16 0.32 0.17 0.13 0.07 0.31 – 0.28 0.36 0.20 0.08 0.33 0.23 0.32 0.22 0.55 0.34 0.43 0.34 0.25 0.39 5.59 1.57 �1.08 0.398 0.27 0.26 0.19 0.08 0.27 0.27 0.27 – 0.33 0.37 0.02 0.31 0.33 0.35 0.17 0.18 0.49 0.22 0.25 0.22 0.39 5.41 1.28 �0.62 �0.139 0.25 0.47 0.10 0.04 0.25 0.39 0.28 0.29 – 0.35 0.01 0.52 0.30 0.49 0.19 0.35 0.42 0.44 0.28 0.26 0.53 6.07 1.03 �1.12 1.0210 0.20 0.30 0.10 0.05 0.28 0.26 0.14 0.32 0.32 – �0.10 0.36 0.47 0.37 0.14 0.22 0.32 0.19 0.24 0.20 0.36 5.33 1.29 �0.52 �0.1711 0.09 �0.06 0.10 0.21 �0.10 �0.09 0.06 �0.01 �0.08 �0.09 – 0.02 �0.03 �0.01 0.16 0.04 0.06 0.12 0.15 0.24 0.02 3.93 1.48 0.01 �0.5112 0.22 0.33 0.09 0.07 0.30 0.36 0.25 0.18 0.37 0.16 �0.07 – 0.42 0.58 0.23 0.40 0.40 0.47 0.32 0.28 0.55 6.25 0.99 �1.31 1.0413 0.25 0.36 0.16 0.13 0.36 0.37 0.20 0.28 0.31 0.36 �0.11 0.41 – 0.54 0.28 0.29 0.40 0.25 0.39 0.31 0.42 5.09 1.35 �0.49 �0.2014 0.25 0.41 0.11 0.10 0.31 0.39 0.25 0.26 0.45 0.28 �0.10 0.46 0.48 – 0.27 0.38 0.41 0.37 0.35 0.26 0.54 5.55 1.18 �0.65 0.0515 0.08 0.16 0.28 0.22 0.16 0.14 0.24 0.18 0.14 0.11 0.06 0.19 0.25 0.24 – 0.28 0.19 0.30 0.35 0.33 0.22 4.73 1.56 �0.48 �0.4916 0.09 0.31 0.13 0.14 0.11 0.25 0.42 0.14 0.29 0.15 0.01 0.30 0.22 0.29 0.29 – 0.25 0.41 0.34 0.26 0.34 5.18 1.77 �0.80 �0.4317 0.27 0.37 0.19 0.16 0.23 0.34 0.32 0.42 0.33 0.25 0.01 0.27 0.32 0.35 0.20 0.227 – 0.32 0.31 0.25 0.52 5.57 1.32 �1.02 0.9018 0.14 0.36 0.18 0.13 0.18 0.34 0.36 0.20 0.35 0.14 0.01 0.37 0.26 0.35 0.29 0.35 0.28 – 0.46 0.36 0.45 6.11 1.11 �1.69 3.5719 0.20 0.25 0.44 0.26 0.22 0.21 0.26 0.26 0.22 0.20 0.07 0.24 0.33 0.28 0.35 0.24 0.29 0.40 – 0.43 0.37 5.47 1.46 �0.96 0.3520 0.30 0.19 0.21 0.25 0.09 0.18 0.20 0.15 0.19 0.12 0.20 0.24 0.21 0.21 0.29 0.20 0.19 0.31 0.35 – 0.29 5.43 1.46 �0.94 0.3321 0.22 0.41 0.11 0.10 0.30 0.47 0.30 0.26 0.37 0.26 �0.09 0.38 0.35 0.41 0.17 0.25 0.38 0.35 0.27 0.22 – 5.96 0.95 �0.94 0.83
Mean 5.91 5.84 4.94 4.15 5.45 5.91 5.89 5.14 5.87 4.88 3.59 6.48 5.33 5.52 4.85 5.33 5.54 6.09 5.58 5.71 6.06SD 1.17 1.07 1.34 1.56 1.19 1.00 1.32 1.32 1.14 1.33 1.47 0.88 1.17 1.15 1.46 1.73 1.3 1.08 1.33 1.36 0.93Skew �1.09 �0.90 �0.48 �0.08 �0.65 �0.98 �1.42 �0.42 �1.21 �0.31 0.22 �2.09 �0.53 �0.77 �0.55 �0.91 �1.00 �1.68 �1.12 �1.36 �1.42Kurtosis 1.02 0.76 �0.20 �0.63 0.14 1.16 1.76 �0.41 1.62 �0.24 �0.48 4.93 0.10 0.57 �0.31 �0.22 0.84 3.64 1.01 1.65 3.53
Note: Bottom half of the correlation table and descriptive statistics is the Freshmen sample (N = 2598). Top half of the correlation table and descriptive statistics is the Upperclassmen sample (N = 1035).
Table 2Correlations and descriptive statistics for the BNSG-S for the Psychology Sample.
Item 1 2 3 4 5 6 7 8 9 10 11 12 13 14 15 16 17 18 19 20 21
1 1.002 0.13 1.003 0.06 0.09 1.004 0.18 0.17 0.35 1.005 0.06 0.14 0.24 0.10 1.006 0.12 0.44 0.09 0.10 0.19 1.007 0.17 0.35 0.18 0.23 0.10 0.28 1.008 0.23 0.22 0.17 0.20 0.14 0.21 0.32 1.009 0.13 0.50 0.04 0.06 0.09 0.31 0.28 0.19 1.0010 0.13 0.20 0.11 0.14 0.27 0.16 0.14 0.18 0.13 1.0011 0.11 0.02 0.09 0.15 0.00 �0.02 0.10 0.11 �0.01 �0.08 1.0012 0.09 0.40 0.11 0.22 0.20 0.32 0.27 0.18 0.34 0.23 �0.01 1.0013 0.23 0.29 0.29 0.28 0.29 0.18 0.23 0.29 0.24 0.45 �0.01 0.34 1.0014 0.16 0.52 0.15 0.18 0.19 0.37 0.33 0.28 0.44 0.32 �0.02 0.48 0.46 1.0015 0.22 0.26 0.37 0.32 0.25 0.13 0.38 0.22 0.16 0.23 0.16 0.27 0.38 0.34 1.0016 0.13 0.39 0.08 0.15 0.14 0.25 0.51 0.19 0.31 0.18 0.00 0.41 0.30 0.41 0.35 1.0017 0.26 0.37 0.26 0.27 0.10 0.30 0.34 0.44 0.34 0.19 0.03 0.36 0.32 0.45 0.31 0.28 1.0018 0.14 0.42 0.18 0.13 0.18 0.32 0.42 0.20 0.41 0.13 0.08 0.46 0.27 0.46 0.34 0.44 0.35 1.0019 0.15 0.20 0.60 0.40 0.29 0.16 0.23 0.21 0.12 0.14 0.10 0.23 0.38 0.23 0.43 0.19 0.27 0.31 1.0020 0.36 0.16 0.22 0.27 0.10 0.17 0.15 0.18 0.10 0.11 0.17 0.17 0.30 0.23 0.32 0.17 0.26 0.22 0.30 1.0021 0.17 0.36 0.12 0.12 0.19 0.47 0.38 0.24 0.37 0.19 0.05 0.41 0.26 0.47 0.24 0.34 0.41 0.47 0.14 0.22 1.00
Mean 6.00 5.82 5.28 3.46 5.52 6.07 5.90 5.58 6.23 5.35 3.97 6.38 5.18 5.45 5.03 5.30 5.71 6.29 5.62 5.72 6.04SD 0.96 1.05 1.33 1.51 1.01 0.82 1.29 1.05 0.94 1.31 1.42 0.83 1.18 1.13 1.42 1.77 1.25 0.88 1.40 1.35 0.83Skew �0.77 �0.82 �0.93 0.17 �0.54 �1.08 �1.42 �0.46 �1.43 �0.68 �0.02 �1.51 �0.60 �0.67 �0.67 �0.89 �1.28 �1.76 �1.27 �1.43 �1.05Kurtosis �0.04 0.50 0.51 �0.56 �0.13 2.19 1.78 �0.28 2.19 0.06 �0.59 2.79 0.52 0.32 �0.16 �0.29 1.78 4.90 1.34 1.91 2.11
Note: N = 492.
286M
.M.Johnston,S.J.Finney
/Contemporary
EducationalPsychology
35(2010)
280–296
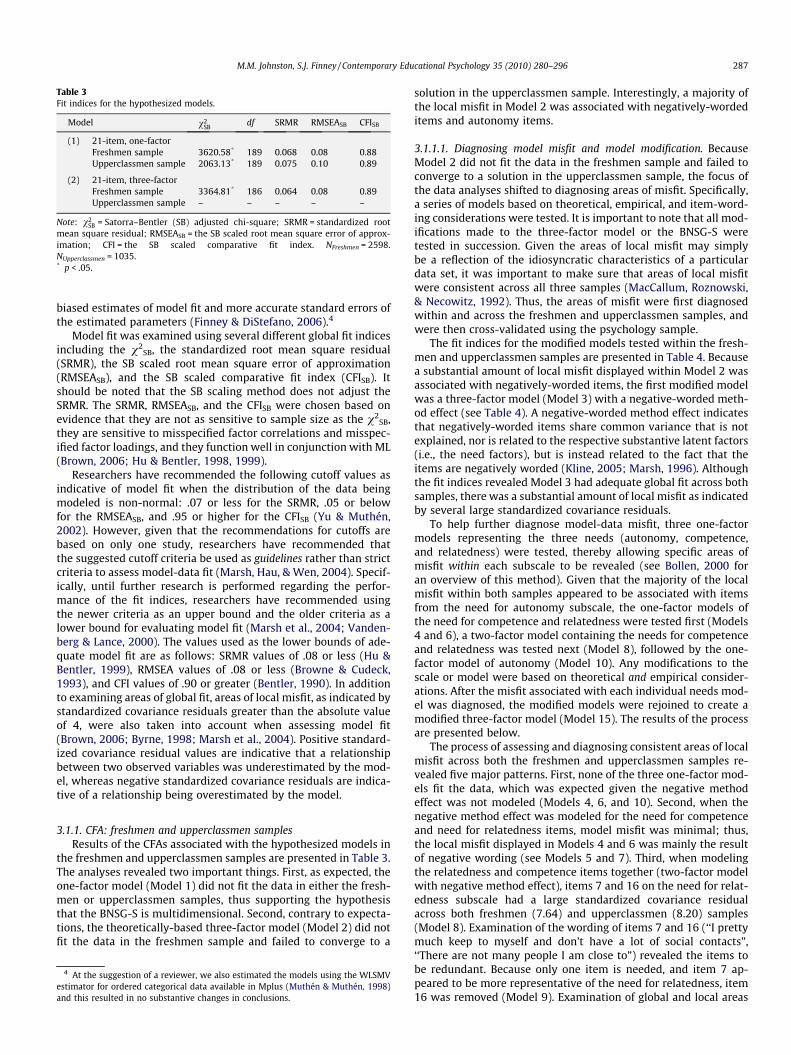
Table 3Fit indices for the hypothesized models.
Model v2SB
df SRMR RMSEASB CFISB
(1) 21-item, one-factorFreshmen sample 3620.58* 189 0.068 0.08 0.88Upperclassmen sample 2063.13* 189 0.075 0.10 0.89
(2) 21-item, three-factorFreshmen sample 3364.81* 186 0.064 0.08 0.89Upperclassmen sample – – – – –
Note: v2SB = Satorra–Bentler (SB) adjusted chi-square; SRMR = standardized root
mean square residual; RMSEASB = the SB scaled root mean square error of approx-imation; CFI = the SB scaled comparative fit index. NFreshmen = 2598.NUpperclassmen = 1035.* p < .05.
M.M. Johnston, S.J. Finney / Contemporary Educational Psychology 35 (2010) 280–296 287
biased estimates of model fit and more accurate standard errors ofthe estimated parameters (Finney & DiStefano, 2006).4
Model fit was examined using several different global fit indicesincluding the v2
SB, the standardized root mean square residual(SRMR), the SB scaled root mean square error of approximation(RMSEASB), and the SB scaled comparative fit index (CFISB). Itshould be noted that the SB scaling method does not adjust theSRMR. The SRMR, RMSEASB, and the CFISB were chosen based onevidence that they are not as sensitive to sample size as the v2
SB,they are sensitive to misspecified factor correlations and misspec-ified factor loadings, and they function well in conjunction with ML(Brown, 2006; Hu & Bentler, 1998, 1999).
Researchers have recommended the following cutoff values asindicative of model fit when the distribution of the data beingmodeled is non-normal: .07 or less for the SRMR, .05 or belowfor the RMSEASB, and .95 or higher for the CFISB (Yu & Muthén,2002). However, given that the recommendations for cutoffs arebased on only one study, researchers have recommended thatthe suggested cutoff criteria be used as guidelines rather than strictcriteria to assess model-data fit (Marsh, Hau, & Wen, 2004). Specif-ically, until further research is performed regarding the perfor-mance of the fit indices, researchers have recommended usingthe newer criteria as an upper bound and the older criteria as alower bound for evaluating model fit (Marsh et al., 2004; Vanden-berg & Lance, 2000). The values used as the lower bounds of ade-quate model fit are as follows: SRMR values of .08 or less (Hu &Bentler, 1999), RMSEA values of .08 or less (Browne & Cudeck,1993), and CFI values of .90 or greater (Bentler, 1990). In additionto examining areas of global fit, areas of local misfit, as indicated bystandardized covariance residuals greater than the absolute valueof 4, were also taken into account when assessing model fit(Brown, 2006; Byrne, 1998; Marsh et al., 2004). Positive standard-ized covariance residual values are indicative that a relationshipbetween two observed variables was underestimated by the mod-el, whereas negative standardized covariance residuals are indica-tive of a relationship being overestimated by the model.
3.1.1. CFA: freshmen and upperclassmen samplesResults of the CFAs associated with the hypothesized models in
the freshmen and upperclassmen samples are presented in Table 3.The analyses revealed two important things. First, as expected, theone-factor model (Model 1) did not fit the data in either the fresh-men or upperclassmen samples, thus supporting the hypothesisthat the BNSG-S is multidimensional. Second, contrary to expecta-tions, the theoretically-based three-factor model (Model 2) did notfit the data in the freshmen sample and failed to converge to a
4 At the suggestion of a reviewer, we also estimated the models using the WLSMVestimator for ordered categorical data available in Mplus (Muthén & Muthén, 1998and this resulted in no substantive changes in conclusions.
)
solution in the upperclassmen sample. Interestingly, a majority ofthe local misfit in Model 2 was associated with negatively-wordeditems and autonomy items.
3.1.1.1. Diagnosing model misfit and model modification. BecauseModel 2 did not fit the data in the freshmen sample and failed toconverge to a solution in the upperclassmen sample, the focus ofthe data analyses shifted to diagnosing areas of misfit. Specifically,a series of models based on theoretical, empirical, and item-word-ing considerations were tested. It is important to note that all mod-ifications made to the three-factor model or the BNSG-S weretested in succession. Given the areas of local misfit may simplybe a reflection of the idiosyncratic characteristics of a particulardata set, it was important to make sure that areas of local misfitwere consistent across all three samples (MacCallum, Roznowski,& Necowitz, 1992). Thus, the areas of misfit were first diagnosedwithin and across the freshmen and upperclassmen samples, andwere then cross-validated using the psychology sample.
The fit indices for the modified models tested within the fresh-men and upperclassmen samples are presented in Table 4. Becausea substantial amount of local misfit displayed within Model 2 wasassociated with negatively-worded items, the first modified modelwas a three-factor model (Model 3) with a negative-worded meth-od effect (see Table 4). A negative-worded method effect indicatesthat negatively-worded items share common variance that is notexplained, nor is related to the respective substantive latent factors(i.e., the need factors), but is instead related to the fact that theitems are negatively worded (Kline, 2005; Marsh, 1996). Althoughthe fit indices revealed Model 3 had adequate global fit across bothsamples, there was a substantial amount of local misfit as indicatedby several large standardized covariance residuals.
To help further diagnose model-data misfit, three one-factormodels representing the three needs (autonomy, competence,and relatedness) were tested, thereby allowing specific areas ofmisfit within each subscale to be revealed (see Bollen, 2000 foran overview of this method). Given that the majority of the localmisfit within both samples appeared to be associated with itemsfrom the need for autonomy subscale, the one-factor models ofthe need for competence and relatedness were tested first (Models4 and 6), a two-factor model containing the needs for competenceand relatedness was tested next (Model 8), followed by the one-factor model of autonomy (Model 10). Any modifications to thescale or model were based on theoretical and empirical consider-ations. After the misfit associated with each individual needs mod-el was diagnosed, the modified models were rejoined to create amodified three-factor model (Model 15). The results of the processare presented below.
The process of assessing and diagnosing consistent areas of localmisfit across both the freshmen and upperclassmen samples re-vealed five major patterns. First, none of the three one-factor mod-els fit the data, which was expected given the negative methodeffect was not modeled (Models 4, 6, and 10). Second, when thenegative method effect was modeled for the need for competenceand need for relatedness items, model misfit was minimal; thus,the local misfit displayed in Models 4 and 6 was mainly the resultof negative wording (see Models 5 and 7). Third, when modelingthe relatedness and competence items together (two-factor modelwith negative method effect), items 7 and 16 on the need for relat-edness subscale had a large standardized covariance residualacross both freshmen (7.64) and upperclassmen (8.20) samples(Model 8). Examination of the wording of items 7 and 16 (‘‘I prettymuch keep to myself and don’t have a lot of social contacts”,‘‘There are not many people I am close to”) revealed the items tobe redundant. Because only one item is needed, and item 7 ap-peared to be more representative of the need for relatedness, item16 was removed (Model 9). Examination of global and local areas

Table 4Fit indices for the modified models for the freshmen and upperclassmen samples.
Model v2SB
df SRMR RMSEASB CFISB
(3) 21-item, three-factor with method effectFreshmen sample 1571.81* 177 0.045 0.06 0.95Upperclassmen sample 853.01* 177 0.046 0.06 0.96
Competence models(4) 6-item, one-factor
Freshmen sample 423.99* 9 0.073 0.13 0.82Upperclassmen sample 245.36* 9 0.079 0.16 0.82
(5) 6-item, one-factor with method effectFreshmen sample 14.73* 6 0.014 0.02 1.00Upperclassmen sample 12.08 6 0.019 0.03 1.00
Relatedness models(6) 8-item, one-factor
Freshmen sample 274.25* 20 0.044 0.07 0.95Upperclassmen sample 228.99* 20 0.061 0.10 0.94
(7) 8-item, one-factor with method effectFreshmen sample 102.77* 17 0.024 0.04 0.98Upperclassmen sample 69.35* 17 0.028 0.05 0.99
Competence and relatedness models(8) 14-item, two-factor with method effect
Freshmen sample 618.06* 70 0.041 0.05 0.96Upperclassmen sample 356.04* 70 0.044 0.06 0.97
(9) 13-item, two-factor with method effecta
Freshmen sample 432.79* 59 0.035 0.05 0.97Upperclassmen sample 205.75* 59 0.036 0.05 0.98
Autonomy models(10) 7-item, one-factor
Freshmen sample 444.96* 14 0.071 0.11 0.81Upperclassmen sample 137.05* 14 0.063 0.09 0.89
(11) 7-item, one-factor with method effectFreshmen sample 161.38* 11 0.043 0.07 0.93Upperclassmen sample 43.90* 11 0.03 0.05 0.97
(12) 6-item, one-factor with method effectb
Freshmen sample 113.67* 6 0.043 0.08 0.93Upperclassmen sample 33.03* 6 0.031 0.07 0.97
(13) 5-item, one-factorc
Freshmen sample 105.73* 4 0.046 0.10 0.92Upperclassmen sample 29.93* 4 0.034 0.08 0.96
(14) 4-item, one-factord
Freshmen sample 28.15* 2 0.028 0.07 0.97Upperclassmen sample 13.33* 2 0.026 0.07 0.98
Rejoined modified models(15) 16-item, three-factor model with method effecte
Freshmen sample 670.23* 96 0.037 0.05 0.97Upperclassmen sample 338.01* 96 0.037 0.05 0.98
a Item 16 was removed.b Item 14 was removed.c Items 14 and 11 were removed.d Items 14, 11, and 20 were removed.e Items 16, 14, 11, 20, and 4 were removed.
* p < .05.
288 M.M. Johnston, S.J. Finney / Contemporary Educational Psychology 35 (2010) 280–296
of fit revealed a two-factor model with a negative method effectfactor (Model 9) fit the 13 relatedness and competence items ade-quately across both samples.
Fourth, the substantial amount of local misfit displayed in Model11 indicated the negative method effect did not explain all of themisfit associated with the autonomy items. As a result, a series ofmodels (Models 12–14) were estimated in order to better under-stand the interrelationships among the need for autonomy items.Theoretical and empirical issues with items 14, 1, 20, 4, and 11 wererevealed. In regards to the theoretical issues, examination of thewording of item 14 (‘‘People I interact with on a daily basis tendto take my feelings into consideration”) revealed the item was morerepresentative of the need for relatedness than the need for auton-omy. In addition, items 1 and 20 appeared to be reciprocals of one
another (i.e., one was positively worded and one was negativelyworded); they were opposite and essentially redundant with oneanother. Finally, item 4 appeared to be written too generally to beapplicable only to the need for autonomy (”I feel pressured in mylife”). That is, people may feel pressured in their life due to a failureto fulfill the need for competence or relatedness or autonomy.Importantly, all these items also had very low R2 values, indicatingthe items had little or no utility. Thus, the modifications to Models12–14 were based on all of these considerations: Model 12 reflectsthe removal of item 14; Model 13 reflects the removal of item 11;and Model 14 reflects the removal of item 20. Model 15, which re-flects the removal of item 4, also reflects the joining of Models 9 and14 with a negative method effect, thus creating a 16-item, three-factor model with a negative method effect (see Fig. 2).

5
Satisfaction of the Need for Autonomy
1 17 8 3
Satisfaction of the Need for Competence
10 19 15 13
Negative-Item Method
Effect
2
Satisfaction of the Need for Relatedness
6 7 21 18 12 9
Fig. 2. Sixteen-item, three-factor model of the BNSG-S with a negative method effect.
M.M. Johnston, S.J. Finney / Contemporary Educational Psychology 35 (2010) 280–296 289
Fifth, Model 15 adequately fit the data in a global sense; how-ever, it is important to note there were two consistent areas of lo-cal misfit across both samples (as indicated by large standardizedcovariance residuals) between items 5 and 6 (6.3, 4.59), and be-tween items 3 and 18 (�8.15, �4.09). Although these two areasof local misfit were common across both samples, there was notheoretical or practical reason why the items should be removedor the model should be modified further. Thus, Model 15 waschampioned in the freshmen and upperclassmen samples.
5 Only the standardized pattern coefficients associated with the modified 16-itemthree-factor model with a negative method effect for all three samples have beenpresented to save space. Other parameter estimates are available by request from thefirst author.
3.1.2. CFA: psychology sampleIt is important to note that although the modifications to the
original 21-item three-factor model (Model 2) were based onempirical, conceptual, practical, and theoretical considerations,the modifications were still influenced by the idiosyncratic charac-teristics that were shared by the freshmen and upperclassmensamples. That is, data were collected in a large scale low-stakestesting context. Thus, students may not have been motivated toput forth effort on the series of tests. Therefore, it was importantto examine the models using another sample of students testedin smaller more controlled settings to see if patterns of misfitreplicated.
The patterns of misfit were relatively consistent across all threesamples. That is, within the psychology sample, the theoreticalmodels did not fit the data, the need for relatedness item 16 dis-played a large standardized residual with item 7 (4.35), the needfor autonomy items 4, 11, and 20 were found to be poorly perform-ing items, and a negative method effect was present. Examinationof the global fit indices for Model 15 revealed adequate model-datafit (see Table 5). Examination of the standardized covariance resid-uals of Model 15 revealed one large standardized covariance resid-ual between items 7 and 15 (4.54). However, given this area oflocal misfit was not found in the freshmen or upperclassmen data,and given there was no theoretical reason for this misfit, Model 15
was championed. In sum, model fit and misfit was extremely con-sistent across all three samples, and the 16-item three-factor mod-el with a negative method effect reproduced the relationshipsamong the variables well.
3.1.3. Parameter estimates for Model 15Examination of the parameter estimates for Model 15 across all
three samples revealed three important points (see Table 6).5 First,all of the unstandardized pattern coefficients were statistically sig-nificant. Second, the majority of items across all three samples hadless than 50% of their variance accounted for by the respective sub-stantive factors. Only two items (13 and 17) had at least 50% of theirvariance accounted for by their respective substantive factors acrossboth the upperclassmen and psychology samples; none of the itemswithin the freshmen sample had at least 50% of their variance ac-counted for by their respective substantive factors. Thus, a majorityof the items across all three samples had large amounts of unex-plained variance (i.e., error variance), which is not desirable. In par-ticular, only 6%, 16%, and 14% of the variance in item 3 was explainedby the need for competence, and only 20%, 30%, and 13% of the var-iance in item 1 was explained by the need for autonomy in the fresh-men, upperclassmen, and psychology samples, respectively. Theselow values across the three samples indicate items 3 and 1 do nothave much utility. Third, quality negative items should reflect theirsubstantive factor more than the negative method effect. Unfortu-nately, across all three samples, only two (i.e., items 7 and 18) ofthe five negative items had higher standardized pattern coefficientswith their substantive factor (i.e., the need for relatedness) than thenegative method effect factor.

Table 5Fit indices for the psychology sample.
Model v2SB
df SRMR RMSEASB CFISB
(1) 21-item, one-factor 981.91* 189 0.081 0.09 0.85(2) 21-item, three-factor 685.67* 186 0.068 0.07 0.91(3) 21-item, three-factor
with method effect438.92* 177 0.054 0.05 0.95
Competence models(4) 6-item, one-factor 91.44* 9 0.083 0.14 0.86(5) 6-item, one-factor with
method effect20.54* 6 0.045 0.07 0.98
Relatedness models(6) 8-item, one-factor 87.15* 20 0.052 0.08 0.93(7) 8-item, one-factor with
method effect55.94* 17 0.039 0.07 0.96
Competence and relatedness model(8) 14-item, two-factor with
method effect189.38* 70 0.051 0.06 0.95
(9) 13-item, two-factor withmethod effecta
134.44* 59 0.047 0.05 0.96
Autonomy models(10) 7-item, one-factor 68.51* 14 0.059 0.09 0.89(11) 7-item, one-factor with
method effect41.10* 11 0.049 0.07 0.94
(12) 6-item, one-factor withmethod effectb
31.37* 6 0.047 0.09 0.93
(13) 5-item, one-factorc 25.55* 4 0.051 0.10 0.93(14) 4-item, one-factord 1.68 2 0.016 0.00 1.00
Rejoined modified model(15) 16-item, three-factor
with method effecte190.74* 96 0.047 0.04 0.97
Note: v2SB = Satorra–Bentler (SB) adjusted chi-square; SRMR = standardized root
mean square residual; RMSEASB = the SB scaled root mean square error of approx-imation; CFI = the SB scaled comparative fit index. N = 492.
a Item 16 was removed.b Item 14 was removed.c Items 14 and 11were removed.d Items 14, 11, and 20 were removed.e Items 16, 14, 11, 20, and 4 were removed.
* p < .05.
290 M.M. Johnston, S.J. Finney / Contemporary Educational Psychology 35 (2010) 280–296
Correlations between the factors, subscale reliabilities, and theamount of variance explained by each factor are reported for allthree samples in Table 7. The factor correlations were positive.Interestingly, the factor correlations in the psychology samplewere substantially lower (i.e., factors more distinct) than in thefreshmen or upperclassmen samples.
The reliability for the need for relatedness subscale was accept-able (above .78) across all three samples, whereas the reliabilitiesfor the need for autonomy and the need for relatedness subscaleswere low (see Table 7).6 Variance extracted represents the totalamount of variance within the items accounted for by their substan-tive factors. The variance extracted for the three needs across allthree samples was below .46, thus indicating the factors accountedfor less than 46% of the items’ variance. Given this information, it ap-pears that the subscale scores are not explained very well by theirrespective factors.
3.2. Phase two of analysis: external validity evidence
If the three factors of the need for autonomy, competence, andrelatedness are truly distinct constructs, then differential relation-ships between the three factors and theoretically related externalvariables should emerge. To address the second purpose of thestudy, a series of CFA models estimated the relationships betweenthe three needs factors and each external construct. Specifically,one general model was specified and was simply adjusted for eachindividual external construct (see Fig. 3). That is, the championed16-item, three-factor model with a negative method effect wasmodeled with a single-indicator factor representing the externalvariable. Modeling the three needs factors with the negative effectallowed for the removal of shared variance due to negative itemwording, thus providing more accurate relationships with externalvariables than would be afforded by computing three observedsubscale scores representing the satisfaction of needs (Conway,2004). Given there were seven external variables, a total of sevenmodels were estimated. Modeling the external variables as factors,as opposed to observed scores, allowed the error variance in the
6 Given two of the three factors had items that were modeled to be multidimen-sional, two different equations were used to calculate reliability. First, in order tocalculate the reliability for the need for autonomy factor, in which all items weremodeled to be unidimensional, the following equation was used:
ðP
biÞ2
ðP
biÞ2 þP
ei
ð1Þ
where bi is the unstandardized pattern coefficient and ei is the unstandardized errorvariance of the items representing the factor of the need for autonomy (McDonald,1999).
Interestingly, there does not appear to be a general consensus regarding theappropriate way to calculate the reliability of items when a method effect is modeled(e.g., Bentler, 2009; Sijtsma, 2009a; Sijtsma, 2009b). Researchers have used Eq. (2), ora variation of Eq. (2) (see Green & Yang, 2009; McDonald, 1999, Eq. (6.20)), to calcu-late the reliability:
ðP
biÞ2
ðP
biÞ2 þP
ei þ ðP
bjÞ2ð2Þ
where bi is the unstandardized pattern coefficient representing the relationship be-tween the items and the substantive factor, ei is the unstandardized error variance ofthe items, and bj is the unstandardized pattern coefficient representing the relation-ship between the negatively-worded items on that particular subscale and the neg-ative method effect factor. Specifically, Eq. (2) includes the systematic varianceassociated with the method effect in the denominator, thus acknowledging that itis part of the total variance associated with the set of items (Conway, 2004; Lucke,2005). Only the variance associated with the substantive factor is included in thenumerator. For the current study, Eq. (2), not Eq. (1), was used to calculate the reli-ability of the scores for the need for competence and the need for relatedness.
observed scores to be removed (Maruyama, 1998).7 Thus, the factorcorrelations between the three needs factors and the external factorswere estimated at the latent level without measurement error(Brown, 2006).
3.2.1. Investigating differential relationships between factorsIn order to investigate whether the three needs factors were dif-
ferentially related to an external factor, three models were esti-mated by constraining a pair of factor correlations between twoneeds factors and the external factor to be equal. The constrainedmodels were nested within the unconstrained external model(Fig. 3). A chi-square difference test (Dv2) assessed whether thefit of the constrained model was significantly worse than the fit
7 In order to model an external variable as a single-indicator factor, a series of threeeps was completed for each external measure. First, the items on the externaleasures were summed, thus creating a composite variable for each external
ariable. It is important to note that there was sufficient evidence from previousudies (see Section 2) to indicate each external measure’s scores were unidimen-onal and the creation of a composite score was appropriate. Second, in order toodel the external variables as latent factors, which are free of measurement error,e proportion of the composite variable’s variance due to measurement error waslculated (1 – reliability estimate).This value was then multiplied by the external
ariable’s total variance and the resulting value was fixed as the unstandardized errorariance of the indicator, thereby leaving only the reliable composite variance to be
rrelated with the three needs factors. Third, in order to completely standardize thexternal factor and thus estimate factor correlations instead of factor covariances, thector variance was fixed to one and the path from the factor to the composite
ariable was freely estimated. For further information see Kline, 2005 regarding the
stmvstsimthcavvcoefav
specification of a single-indictor factor.
Table 6Standardized pattern coefficients for the championed model for the freshmen, upperclassmen, and psychology samples.
Items by modified subscale Freshmen sample Upperclassmen sample Psychology sample
SF NMF SF NMF SF NMF
Autonomy items(1) I feel like I am free to decide for myself how to live my life. 0.45 – 0.55 – 0.36 –(8) I generally feel free to express my ideas and opinions. 0.59 – 0.65 – 0.56 –(17) I feel like I can pretty much be myself in my daily situations. 0.68 – 0.72 – 0.78 –
Competence items(3) Often, I do not feel very competent. (R) 0.25 0.50 0.40 0.54 0.37 0.61(5) People I know tell me I am good at what I do. 0.54 – 0.63 – 0.42 –(10) I have been able to learn interesting new skills recently. 0.52 – 0.61 – 0.53 –(13) Most days I feel a sense of accomplishment from what I do. 0.68 – 0.71 – 0.77 –(15) In my life I do not get much of a chance to show how capable I am. (R) 0.33 0.38 0.33 0.34 0.52 0.30(19) I often do not feel very capable. (R) 0.48 0.60 0.52 0.63 0.48 0.67
Relatedness items(2) I really like the people I interact with. 0.68 – 0.71 – 0.67 –(6) I get along with people I come into contact with. 0.68 – 0.71 – 0.57 –(7) I pretty much keep to myself and don’t have a lot of social contacts. (R) 0.46 0.23 0.49 0.27 0.54 0.15(9) I consider the people I regularly interact with to be my friends. 0.63 – 0.72 – 0.60 –(12) People in my life care about me. 0.56 – 0.70 – 0.61 –(18) The people I interact with regularly do not seem to like me much. (R) 0.54 0.33 0.57 0.39 0.67 0.18(21) People are generally pretty friendly towards me. 0.65 – 0.78 – 0.67 –
Note: All unstandardized parameter estimates were statistically significant. The reported standardized coefficients can be squared to reflect the amount of variance in theitem explained by the factor. (R) = indicates items that were reversed scored. SF = substantive factor. NMF = negative method factor.NFreshmen = 2598. NUpperclassmen = 1035. NPsychology = 492.
Table 7Subscale correlations, reliabilities, and variance explained for the freshmen, upper-classmen, and psychology samples.
Freshmen sample Upperclassmensample
Psychologysample
A C R A C R A C R
Autonomy 1.00 1.00 1.00Competence 0.77 1.00 0.82 1.00 0.60 1.00Relatedness 0.76 0.78 1.00 0.81 0.75 1.00 0.70 0.57 1.00
Reliability 0.60 0.55 0.78 0.68 0.62 0.82 0.62 0.60 0.80Variance
extracted0.34 0.24 0.37 0.42 0.30 0.45 0.35 0.28 0.47
Note: A = autonomy; C = competence; R = relatedness. The unstandardized pathcoefficients and error terms were used to calculate reliability.NFreshmen = 2598. NUpperclassmen = 1035. NPsychology = 492.
M.M. Johnston, S.J. Finney / Contemporary Educational Psychology 35 (2010) 280–296 291
of the unconstrained model, which in turn tests if the factor corre-lations were significantly different from each other. Recall that gi-ven the assumption of multivariate normality was violated, thev2
SB was estimated (Satorra & Bentler, 2001). It is important tonote that the Dv2
SB can produce implausible, negative chi-squarevalues (Satorra & Bentler, 2001, 2009). According to Satorra andBentler (2009), if an implausible value (e.g., negative chi-square)is produced by the Dv2
SB test, it is a sign that at least one of themodels being compared is misspecified or the sample size is toosmall. If this occurs, Satorra and Bentler (2009) offer a new methodof computing Dv2
SB which ensures the scaled chi-square differencestatistic will be positive. This new method was used in the currentstudy.8
Results of the Dv2SB tests as well as the factor correlations are
presented in Table 8.9 The results revealed three important points.First, all of the factor correlations were statistically significantly
8 Unfortunately, LISREL 8.72 was not able to perform the new 2009 Dv2SB test (G
Mels, personal communication, March 13, 2009; A. Satorra, personal communicationMarch 13, 2009). Thus, EQS 6.0 was used to estimate the CFAs to perform the 2009Dv2
SB tests.9 Fit indices associated with the nested v2 difference tests are available from the
first author upon request.
.,
different from zero with the exception of the factor correlationsbetween GAS and the need for relatedness and between the MAFand the need for relatedness. In addition, with the exception ofthe two non-significant factor correlations, the three needs werepositively related with the factors of well-being, and were nega-tively related to the factors of anxiety and motive to avoid failure,as expected.
Second, as predicted, when related to measures of well-being,the three needs factors were distinct and were related to well-being in theoretically expected ways. For instance, as predicted,the AU factor exhibited a significantly stronger positive correlationwith the need for autonomy factor than with the other needs fac-tors, the EM factor exhibited a significantly stronger positive corre-lation with the need for competence factor than with the otherneeds factors, and the PR factor exhibited a significantly strongerpositive relationship with the need for relatedness factor than withthe other needs factors. Third, contrary to predictions, WST, GAS,and MAF were able to discriminate the need for relatedness factorfrom the need for autonomy and competence factors, but were notable to discriminate the need for autonomy and the need for com-petence from one another. In addition, SAC was not related to theneeds factors as hypothesized; it was more highly correlated withautonomy than with relatedness. These finding and their implica-tions are discussed in detail below.
4. Discussion
Recall, the current study, which followed Benson’s (1998)strong program for construct validity, had two purposes. The firstpurpose of this study was to investigate the dimensionality of the21-item BNSG-S (Benson’s structural stage) whereas the secondpurpose of the study was to provide external validity evidencefor the championed model of the BNSG-S (Benson’s externalstage).
4.1. Structural stage: dimensionality
Because the theoretical three-factor model did not adequatelyfit the data, the focus of the first part of the study shifted to diag-

Negative-Item Method
Effect
Satisfaction of the Need for Relatedness
Satisfaction of the Need for Autonomy
Satisfaction of the Need for Competence
External Factor
Fig. 3. External validity model: Championed BNSG-S model with an external factor.
Table 8Factors correlations and differential correlations tests between the three needs factorsand external factors in the psychology sample.
Autonomy Competence Relatedness
AU 0.64*a 0.41*b 0.18*c
EM 0.63*a 0.82*b 0.52*c
PR 0.64*a 0.63*a 0.88*b
SAC �0.60*a �0.36*b �0.26*b
WST �0.37*a �0.40*a �0.20*b
GAS �0.16*a �0.25*a �0.07b
MAF �0.36*a �0.45*a �0.08b
Note: AU = autonomy. EM = environmental mastery. PR = positive relations withothers. SAC = social adequacy concern. WST = worrisome thinking. GAS = gener-alized anxiety symptoms. MAF = motive to avoid failure.N = 492.* Indicates factor correlations that were statistically significant (p < .05). Non-common superscripts indicate factor correlations that are statistically different(p < .05).
0 Researchers may be tempted to create three observed summated compositeores to represent the needs for autonomy, competence, and relatedness and useese composites in analyses (e.g., correlation, regression, ANOVA). We caution
gainst this practice due to the presence of a negative method effect. In addition toese summated scores being contaminated by measurement error, the summated
eed for competence and need for relatedness scores would be contaminated withnstruct-irrelevant variance from the negative method effect. Specifically, if the
utonomy items, which were unidimensional, were summed and correlated withxternal variables, the observed correlations would be biased downward due toeasurement error. However, the observed correlations between the summated needr relatedness scores and the external variable scores are more difficult to predict.
his is because the systematic method variance is included in the summatedlatedness scores. Thus, in addition to being biased downward due to measurement
rror, the observed correlations between the summated relatedness scores andxternal variable scores could be biased upward or downward depending on thelationship between the negative method effect and the external variable. The samellows for the need for competence.
The method factor exhibited a correlation of .25 with AU, .29 with EM, .14 withR, �.41 with WST, �.31 with SAC, �.36 with GAD, and �.40 with MAF. The impact ofcluding the method variance in the summated needs scores can be gauged by
xamining the sign of the correlation between the external variable and thedividual need, and examining the sign of the correlation between the external
ariable and the method effect. For example, EM was correlated .82 with the need formpetence and .29 with the method effect. If this method variance isn’t partitioned
om the need for competence scores, the observed correlation between need formpetence and EM would be biased upward (in addition to being biased downwardsome extent due to measurement error, as discussed above).
When examining the method effect-external variable correlations above, alongith the needs-external variable correlations (only needs for competence andlatedness) in Table 8, one can see that the relationships with summated need formpetence scores and summated need for relatedness scores would be biased
pward by not modeling the method effect. The utility of modeling the needsnstruct via SEM is it allows one to not only control for measurement error but to
lso partition construct-irrelevant variance from substantively relevant variance.
292 M.M. Johnston, S.J. Finney / Contemporary Educational Psychology 35 (2010) 280–296
nosing consistent areas of misfit within the theoretical three-factormodel across the three independent samples. Ultimately, a reduced16-item three-factor model with a negative method effect had themost support across all three samples. As previously mentioned,there were several consistent areas misfit displayed across thethree samples including: a substantial amount of local misfit asso-ciated with the negatively-worded items, large standardized resid-uals between items 7 and 16 (both need for relatedness items), theapparent misplacement of item 14 on the need for autonomy sub-scale, and the low utility of items 4, 11, and 20 (all the need forautonomy items).
The presence of a negative method effect represents trait-irrel-evant variance, that when left unaccounted for can have an effecton the reliability of a scale and the validity of inferences made fromthe measure (Conway, 2004). Thus, it is important for futureresearchers to account for the presence of common variance dueto negative item wording (i.e., model the method factor) usinganalyses such as confirmatory factor analyses and structural equa-
tion modeling, as opposed to ignoring the method effect’spresence.10
Although the modified model was championed across threeindependent samples, other psychometric properties (i.e., reliabil-ity and variance extracted) were not ideal. Specifically of concernwere (a) the low reliabilities (below 0.68) associated with the needfor autonomy and need for competence and (b) the large amounts
1
scthathncoaemfoTreeerefo
Pineinvcofrcoto
wrecoucoa

M.M. Johnston, S.J. Finney / Contemporary Educational Psychology 35 (2010) 280–296 293
of variance not accounted for by substantive factors. Specifically, alarge majority of the variance in the need for competence itemswas not explained by the need for competence factor, but by thenegative method factor. Given the substantive factors did not ac-count for much variance within the items, there may be limitedutility of the measure. However, this statement is premature; fu-ture studies are needed to further assess the functioning of themodified version of the BNSG-S (i.e., do these results replicateusing independent samples and in different populations). In sum,support for the original 21-item three-factor model of the BNSG-S was not found, nor was support for a unidimensional model ofneeds. Both findings cause concern given the measure has beenscored in the past under the assumption that one of these modelsrepresented the data (or in some cases the assumption that bothscoring methods were appropriate).
4.2. External stage: external validity
External validity evidence for the championed model was col-lected by examining differential relationships with seven externalvariables. Interestingly, only three of the seven hypotheses regard-ing the differential relationships with the needs factors were sup-ported. As expected, the three needs factors on the modified scaleexhibited differential and theoretically meaningful relationshipswith the three factors of psychological well-being (AU, EM, andPR). The pattern of differential correlations provides support forthe hypothesis that the factors on the modified scale are distinctand represent the needs for autonomy, competence, and related-ness. It is important to reiterate that the description of the relation-ships between the needs and well-being are just that,relationships, not causal statements. Other variables may be thetrue determinants of these relationships (i.e., spurious relation-ships between needs and well-being).
In contrast, when correlated with the four worry-related fac-tors (i.e., WST, SAC, GAS, and MAF), three of the four hypothesesregarding differential relationships with the three needs werenot supported. Interestingly, WST, GAS, and MAF failed to distin-guish the need for autonomy factor from the need for competencefactor. This could be due to the BNSG-S not representing the needsfor autonomy and competence well, inadequate measures of wor-ry, or, it may be that the fulfillment (or lack of fulfillment) of theneeds for autonomy and competence have a similar relationshipwith WST, GAS, and MAF, and vice versa. Although this was notexpected, it appears reasonable that changes in the levels of wor-ry-related constructs could be related to a failure to satisfy eitherthe need for autonomy, the need for competence, or both. For in-stance, if college students feel they are not in control of their ac-tions, (i.e., their need for autonomy is not satisfied), they may bemore likely to experience worrisome thoughts, generalized anxi-ety symptoms, and desire to avoid situations that enhance feel-ings of worry and anxiety (e.g., Davey, Hampton, Farrell, &Davidson, 1992), or, vice versa – students who consistently orpathologically worry may display less volition over their ownthoughts and actions (i.e., they are controlled by worry; Daveyet al., 1992). Likewise, if college students do not feel confidentin their performance (i.e., their need for competence is not satis-fied), they may be more likely to experience troublesomethoughts, physical symptoms due to worry, and the desire toavoid situations that might induce worry. This is in line with pre-vious research regarding worry and anxiety in relation to self-effi-cacy and competence (Bandura, 1977; Hagtvet & Benson, 1997;Schunk & Pajares, 2005).
The hypothesis that SAC would exhibit a stronger negativerelationship with the need for relatedness than with the needsfor autonomy or competence was not supported. Interestingly,SAC exhibited a significantly stronger negative relationship with
the need for autonomy than with the needs of relatedness or com-petence. SAC was hypothesized to be negatively related to theneed for relatedness because social adequacy reflects a feeling ofworry about relationships with other people. However, examina-tion of the items revealed SAC appeared to be more reflective ofa feeling of being controlled by worrying about other peoples’opinions, as opposed to being worried about the nature of therelationships with other people. Moreover, a further review ofthe literature revealed SAC appeared identical to social anxiety,which has been defined as the fear of being in public and interact-ing with people and the fear of being seen in public (Kashdan,2004). Thus, the results of the current study may provide evidenceto suggest people with SAC or social anxiety may be less likely toenjoy being in public situations because they are controlled bytheir feelings of worry and anxiety (i.e., the need for autonomyis not satisfied).
4.3. Future research
Although the current research provided the initial study of themeasurement of needs satisfaction, much more work is needed.First, researchers should replicate the current study to examine ifthe areas of misfit replicate across populations and contexts. Asnoted by MacCallum et al. (1992), modifications based on one sam-ple are influenced by the idiosyncratic characteristics of that spe-cific sample. Although the BNSG-S was not modified unless themisfit was consistent across all three independent samples, themodifications were ultimately based on the idiosyncratic charac-teristics of the three data sets. Moreover, the functioning of thismeasure with a non-college population is unknown and needsstudy. Related to this, the stability of the factor correlations shouldbe examined across different populations and different contexts toassess if the relationships between the three needs changes as afunction of population or context.
Second, if the low factor pattern coefficients and hence inade-quate reliability replicate in future studies, researchers shouldconsider writing new items. For instance, refining the currentitems and/or creating new additional items for the need forautonomy subscale may increase the low reliability exhibited.Creation of new items or refinement of existing items could be in-formed by qualitative studies. Think-aloud procedures, where par-ticipants express their cognitions as they process item content,could shed light on the clarity, relevance, and representativenessof items.
Third, and most importantly, unlike the practice employed pre-viously in the BNSG-S literature, the results from this study shouldnot be generalized to context-specific measures of needs satisfac-tion (e.g., BNSW-S). The factor structure and the relationships withexternal criteria may change given the change in context. Forexample, given the context-independent nature of the BNSG-S, itmay have lower factor pattern coefficients, reliability, and relation-ships with external criteria than a context-specific measure (e.g.,Bing, Whanger, Davison, & VanHook, 2004; Robie, Schmit, Ryan,& Zickar, 2000; Schmit, Ryan, Stierwalt, & Powell, 1995). This issueof specificity of measurement is not new (e.g., Cronbach, 1960;Cronbach & Gleser, 1965; Hogan & Roberts, 1996; Robie et al.,2000; Schmit et al., 1995). In fact, it is often discussed when creat-ing motivation-related measures, such as self-efficacy and goal ori-entation (e.g., Bong, 2001; Choi, 2005; DeShon & Gillespie, 2005;Elliot, 2005; Finney, Pieper, & Barron, 2004; Finney & Schraw,2003; Horvath, Scheu, & DeShon, 2004; Pajares, 1996; Pajares &Miller, 1995; Wigfield, 1997). Future research should explore sim-ilarities and differences in both dimensionality and nomologicalnet of need satisfaction measures that are operationalized at differ-ent levels of specificity.

Please read each of the following items carefully, thinkingabout how it relates to your life, and then indicate how true itis for you. Use the following scale to respond:
1 2 3 4 5 6 7Not at alltrue
Somewhattrue
Verytrue
1. I feel like I am free to decide for myself how tolive my life.
2. I really like the people I interact with.3. Often, I do not feel very competent.4. I feel pressured in my life.5. People I know tell me I am good at what I do.6. I get along with people I come into contact
with.7. I pretty much keep to myself and don’t have a
lot of social contacts.8. I generally feel free to express my ideas and
opinions.9. I consider the people I regularly interact with to
be my friends.10. I have been able to learn interesting new skills
recently.11. In my daily life, I frequently have to do what I
am told.12. People in my life care about me.13. Most days I feel a sense of accomplishment
from what I do.14. People I interact with on a daily basis tend to
take my feelings into consideration.15. In my life I do not get much of a chance to show
how capable I am.16. There are not many people that I am close to.17. I feel like I can pretty much be myself in my
daily situations.18. The people I interact with regularly do not seem
to like me much.
294 M.M. Johnston, S.J. Finney / Contemporary Educational Psychology 35 (2010) 280–296
4.4. Practical implications
Given additional study and refinement of the BNSG-S, themeasure could be used for three important reasons. First, givena quality measure of needs satisfaction, aspects of SDT can beempirically tested. For instance, the sub-theories of SDT, OIT andCET, can only be tested with reliable and valid measures of needssatisfaction. That is, we need to recognize that the empirical re-sults from the testing of these theoretical hypotheses are contin-gent on the measures used to operationalize needs satisfaction.Thus, we need to responsibly examine the domain’s existing mea-sures to evaluate their psychometric functioning and, ultimately,their usefulness.
Second, if the satisfaction of the three needs can be reliably as-sessed, then the measure could be used to identify people whosebasic needs are not being adequately satisfied. That is, the mea-sure could have practical use in uncovering people who needintervention or support to overcome their deficits in needssatisfaction.
Third, and following from above, a quality measure of needs sat-isfaction could be used to evaluate the effectiveness of programs,counseling, or support services targeted towards increasing the ful-fillment of needs. Although there are suggestions in the literatureregarding different strategies that can be used to increase needssatisfaction, these strategies must be assessed for their effective-ness, which necessitates a quality measure of needs satisfaction.For instance, a commonly recommended strategy to promoteneeds satisfaction is the adoption and attainment of intrinsic aspi-rations (i.e., goals such as community involvement, affiliation, andpersonal growth), as opposed to extrinsic aspirations (i.e., goalssuch as wealth, fame, and financial success; Kasser & Ryan, 1996;Niemiec et al., 2009). Thus, in order to determine if the adoptionand attainment of intrinsic aspirations is effective in increasingneeds satisfaction, a quality measure of needs satisfaction is re-quired. Moreover, an adequate measure of needs satisfaction canbe used to alter the course of treatment for patients who sufferfrom symptoms as a result of their needs not being satisfied. For in-stance, upon demonstrating needs satisfaction mediating role be-tween maladaptive adult attachment orientations and feelings ofshame, loneliness, and depression, Wei et al. (2005) recommendedclinicians focus on increasing patients’ satisfaction of needs ratherthan focusing solely on treating the maladaptive characteristics ofattachment orientations such as self-concealment.
19. I often do not feel very capable.20. There is not much opportunity for me to decide
for myself how to do things in my daily life.21. People are generally pretty friendly towards
me.
Scoring Guide for the BNSG-S found on measures websitea
Autonomy 1, 4(R), 8, 11(R), 14, 17, 20(R)
Competence 3(R), 5, 10, 13, 15(R), 19(R)
Relatedness 2, 6, 7(R), 9, 12, 16(R), 18(R), 21
Note: (R) indicates items that need to be reversed scored.a The BNSG-S can be retrieved from the website, http://www.psych.roches-
ter.edu/SDT/questionnaires.php, which is maintained by E. Deci and R. Ryan fromthe University of Rochester. It should be noted that the website is subject to change.
5. Conclusions
In closing, it is important to note that although there are sev-eral different conceptualizations of basic needs satisfaction, thecurrent research focused only on needs satisfaction as definedby SDT. Following Benson’s (1998) strong program of constructvalidity, validity evidence for the BNSG-S was gathered for thestructural and external stages. In regards to the structural stage,the current study provided (a) empirical evidence of the multidi-mensional nature of needs and (b) evidence of a negative methodeffect associated with the BNSG-S. In regards to the external stage,the current study makes a theoretical contribution by providingfurther evidence that the three needs factors are distinct andare, in general, related to external variables in theoretical andmeaningful ways. Although previous studies have used theBNSG-S and have reported relationships between the needs andvarious constructs, this is the first study that has examined thedimensionality of the measure and used the resulting factor struc-ture to assess relationships with theoretically-related variables. Inconclusion, this study brings us one step closer to creating a qual-ity measure of needs satisfaction.
Appendix A
A.1. Feelings I Have
References
Baard, P. P., Deci, E. L., & Ryan, R. M. (2004). Intrinsic need satisfaction: Amotivational basis of performance and well-being in two work settings. Journalof Applied Social Psychology, 34, 2045–2068.
Bandura, A. (1977). Self-efficacy: Toward a unifying theory of behavioral change.Psychological Review, 84, 191–215.

M.M. Johnston, S.J. Finney / Contemporary Educational Psychology 35 (2010) 280–296 295
Basic Needs Satisfaction at Work Scale (n.d.). Retrieved June 1, 2008, fromUniversity of Rochester, Self-Determination Theory Web site. <http://www.psych.rochester.edu/SDT/measures/needs_scl.html>.
Basic Needs Satisfaction in General Scale (n.d.). Retrieved June 1, 2008, fromUniversity of Rochester, Self-Determination Theory Web site. <http://www.psych.rochester.edu/SDT/measures/needs_scl.html>.
Baumeister, R. F., & Leary, M. R. (1995). The need to belong: Desire for interpersonalattachments as a fundamental human motivation. Psychological Bulletin, 117,497–529.
Benson, J. (1998). Developing a strong program of construct validation: A testanxiety example. Educational Measurement: Issues and Practices, 17, 10–17.
Benson, J., & Hagtvet, K. A. (1996). The interplay among design, data, analysis, andtheory in the measurement of coping. In M. Zeidner & N. S. Endler (Eds.),Handbook of coping: theory, research, applications (pp. 83–106). New York: JohnWiley & Sons, Inc.
Bentler, P. M. (1990). Comparative fit indexes in structural models. PsychologicalBulletin, 107, 238–246.
Bentler, P. M. (2009). Alpha, dimension-free, and model-based internal consistencyreliability. Psychometrika, 74, 137–143.
Bentler, P. M., & Wu, E. J. C. (2003). EQS for Windows user’s guide. Encino, CA:Multivariate Software, Inc.
Bing, M. N., Whanger, J. C., Davison, H. K., & VanHook, J. B. (2004). Incrementalvalidity of the frame-of-reference effect in personality scale scores: Areplication and extension. Journal of Applied Psychology, 89, 150–157.
Bollen, K. A. (2000). Modeling strategies: In search of the holy grail. StructuralEquation Modeling, 7, 74–81.
Bong, M. (2001). Role of self-efficacy and task-value in predicting college students’course performance and future enrollment intentions. ContemporaryEducational Psychology, 26, 553–570.
Brown, T. A. (2006). Confirmatory factor analysis for applied research. New York: TheGuildford Press.
Browne, M. W., & Cudeck, R. (1993). Alternative ways of assessing model fit.Sociological Methods and Research, 21, 230–258.
Byrne, B. M. (1998). Structural equation modeling with LISREL, PRELIS, and SIMPLIS:Basic concepts. Mahwah, NJ: Erlbaum Applications and Programming.
Choi, N. (2005). Self-efficacy and self-concept as predictors of college students’academic performance. Psychology in the Schools, 42, 197–205.
Conroy, D. E., & Coatsworth, J. D. (2007a). Assessing autonomy-supportive coachingstrategies in youth sport. Psychology of Sport and Exercise, 8, 671–684.
Conroy, D. E., & Coatsworth, J. D. (2007b). Coaching behaviors associated withchanges in fear of failure: Changes in self-talk and need satisfaction as potentialmechanisms. Journal of Personality, 75, 383–419.
Conway, J. M. (2004). Method variance and method bias in industrial andorganizational psychology. In S. G. Rogelberg (Ed.), Handbook of researchmethods in industrial and organizational psychology (pp. 344–365). Malden,MA: Blackwell Publishing.
Cronbach, L. J. (1960). Essentials of psychological testing (2nd ed.). New York, NY:Harper & Row.
Cronbach, L. J., & Gleser, G. C. (1965). Psychological tests and personnel decisions.Urbana, IL: University of Illinois Press.
Davey, G. C. L., Hampton, J., Farrell, J., & Davidson, S. (1992). Some characteristics ofworrying: Evidence for worrying and anxiety as separate constructs. Personalityand Individual Differences, 13(2), 133–147.
deCharms, R. (1968). Personal causation. New York: Plenum.Deci, E. L., & Ryan, R. M. (1985). The general causality orientations scale:
Self-determination in personality. Journal of Research in Personality, 19,109–134.
Deci, E. L., & Ryan, R. M. (2000). The ‘‘what” and ‘‘why” of goal pursuits: Human needsand the self-determination of behavior. Psychological Inquiry, 11, 227–268.
Deci, E. L., Ryan, R. M., Gagné, M., Leone, D. R., Usunov, J., & Kornazheva, B. P. (2001).Need satisfaction, motivation, and well-being in the work organizations of aformer eastern bloc country: A cross-cultural study of self-determination.Personality and Psychology Bulletin, 27, 930–942.
DeShon, R. P., & Gillespie, J. Z. (2005). A motivated action theory account of goalorientation. Journal of Applied Psychology, 90, 1096–1127.
Diener, E., Emmons, R. A., Larsen, R. J., & Griffin, S. (1985). The satisfaction with lifescale. Journal of Personality Assessment, 49, 71–75.
Elliot, A. J. (2005). A conceptual history of the achievement goal construct. In A. J.Elliot & C. S. Dweck (Eds.), Handbook of competence and motivation (pp. 52–72).New York, NY: The Guilford Press.
Elliot, A. J., & McGregor, H. A. (2001). A 2 � 2 achievement goal framework. Journalof Personality and Social Psychology, 80, 501–519.
Finney, S. J., & DiStefano, C. (2006). Dealing with nonnormal and categorical data instructural equation models. In G. R. Hancock & R. O. Mueller (Eds.), A secondcourse in structural equation modeling (pp. 269–314). Greenwich, CT:Information Age.
Finney, S. J., Pieper, S., & Barron, K. (2004). Examining the psychometric propertiesof the Achievement Goal Questionnaire in a general academic context.Educational and Psychological Measurement, 64, 365–382.
Finney, S. J., & Schraw, G. (2003). Self-efficacy beliefs in college statistics courses.Contemporary Educational Psychology, 28, 161–186.
Gagné, M. (2003). The role of autonomy support and autonomy orientation inprosocial behavior engagement. Motivation and Emotion, 27, 199–223.
Ghorbani, N., & Watson, P. J. (2006). Validity of experiential and reflective self-knowledge scales: Relationship with basic need satisfaction among Iranianfactory workers. Psychological Reports, 98, 727–733.
Green, S. B., & Yang, Y. (2009). Commentary on coefficient alpha: A cautionary tale.Psychometrika, 74, 121–135.
Hagtvet, K. A., & Benson, J. (1997). The motive to avoid failure and test anxietyresponses: Empirical support for integration of two research traditions. Anxiety,Stress, and Coping: An International Journal, 10, 35–57.
Harter, S. (1978). Effectance motivation reconsidered: Toward a developmentalmodel. Human Development, 21, 34–64.
Hogan, J., & Roberts, B. W. (1996). Issues and non-issues in the fidelity-bandwidthtrade-off. Journal of Organizational Behavior, 17, 627–637.
Horvath, M., Scheu, C. R., & DeShon, R. P. (2004). The effects of domain specificity on theconstruct and predictive validity of goal orientation. Poster presented at the Societyfor Industrial and Organizational Psychologists (SIOP) conference, Chicago.
Hu, L., & Bentler, P. M. (1998). Fit indices in covariance structure modeling:Sensitivity to underparameterized model misspecification. PsychologicalMethods, 3, 424–453.
Hu, L., & Bentler, P. M. (1999). Cutoff criteria for fit indices in covariance structureanalysis: Conventional criteria versus new alternatives. Structural EquationModeling, 6, 1–55.
Hull, C. L. (1943). Principles of behavior: An introduction to behavior theory. New York:Appleton-Century-Crofts.
Ilardi, B. C., Leone, D., Kasser, T., & Ryan, R. M. (1993). Employee and supervisorratings of motivation: Main effects and discrepancies associated with jobsatisfaction and adjustment in a factory setting. Journal of Applied SocialPsychology, 23, 1789–1805.
Intrinsic Motivation Inventory (n.d.). Retrieved June 1, 2008, from University ofRochester, Self-Determination Theory Web site. <http://www.psych.rochester.edu/SDT/measures/intrins.html>.
Jöreskog, K. G., & Sörbom, D. (2005). LISREL (version 8.72) [computer software].Lincolnwood, IL: Scientific Software.
Kashdan, T. B. (2004). The neglected relationship between social interaction anxietyand hedonic deficits: Differentiation from depressive symptoms. AnxietyDisorders, 18, 719–730.
Kashdan, T. B., Julian, T., Merritt, K., & Uswatte, G. (2006). Social anxiety andposttraumatic stress in combat veterans: Relations to well-being and characterstrengths. Behaviour Research and Therapy, 44, 561–583.
Kashdan, T. B., Mishra, A., Breen, W. E., & Froh, J. J. (2009). Gender differences ingratitude: Examining appraisals, narratives, the willingness to express emotions,and changes in psychological needs. Journal of Personality, 77, 691–730.
Kasser, T., Davey, J., & Ryan, R. M. (1992). Motivation and employee–supervisordiscrepancies in a psychiatric vocational rehabilitation setting. RehabilitationPsychology, 37, 175–188.
Kasser, T., & Ryan, R. M. (1996). Further examining the American dream: Differentialcorrelates of intrinsic and extrinsic goals. Personality and Social PsychologyBulletin, 22, 280–287.
Kline, R. B. (2005). Principles and practice of structural equation modeling (2nd ed.).New York: Guilford.
La Guardia, J. G., Ryan, R. M., Couchman, C. E., & Deci, E. L. (2000). Within-personvariation in security of attachment: A self-determination theory perspective onattachment, need fulfillment, and well-being. Journal of Personality and SocialPsychology, 79, 367–384.
Lucke, J. F. (2005). The a and x of congeneric test theory: An extension of reliabilityand internal consistency to heterogeneous tests. Applied PsychologicalMeasurement, 29, 65–81.
MacCallum, R. C., Roznowski, M., & Necowitz, L. B. (1992). Model modifications incovariance structure analysis: The problems of capitalization on chance.Psychological Bulletin, 3, 490–504.
Marsh, H. W. (1996). Positive and negative global self-esteem: A substantivelymeaningful distinction or artifact? Journal of Personality and Social Psychology,70, 810–819.
Marsh, H. W., Hau, K., & Wen, K. (2004). In search of the golden rules: Comment onhypothesis-testing approaches to setting cutoff values for fit indexes anddangers in overgeneralizing Hu and Bentler’s (1999) findings. StructuralEquation Modeling, 11, 320–341.
Maruyama, G. M. (1998). Basics of structural equation modeling. Thousand Oaks, CA:Sage.
Maslow, A. H. (1970). Motivation and personality (2nd ed.). New York: Harpers and Row.McClelland, D. C. (1965). Toward a theory of motive acquisition. American
Psychologist, 20, 321–333.McDonald, R. P. (1999). Test theory: A unified treatment. Mahwah, New Jersey:
Lawrence Erlbaum Associates.Meng, X., Rosenthal, R., & Rubin, D. (1992). Comparing correlated correlation
coefficients. Psychological Bulletin, 111, 172–175.Meyer, B., Enstrom, M. K., Harstveit, M., Bowles, D. P., & Beevers, C. G. (2007).
Happiness and despair on the catwalk: Need satisfaction, well-being, andpersonality adjustment among fashion models. The Journal of PositivePsychology, 2, 2–17.
Murray, H. A. (1938). Explorations in personality. New York: Oxford University Press.Muthén, L. K., & Muthén, B. O. (1998). Mplus user’s guide. Los Angeles: Authors.Neff, K. D. (2003). The development and validation of a scale to measure self-
compassion. Self and Identity, 2, 223–250.Niemiec, C. P., Ryan, R. M., & Deci, E. L. (2009). The path taken: Consequences of
attaining intrinsic and extrinsic aspirations in post-college life. Journal ofResearch in Personality, 43, 291–306.
Osman, A., Gutierrez, P. M., Downs, W. R., Kopper, B. A., Barrios, F. X., & Haraburda, C.M. (2001). Development and psychometric properties of the Student WorryQuestionnaire-30. Psychological Reports, 88, 277–290.

296 M.M. Johnston, S.J. Finney / Contemporary Educational Psychology 35 (2010) 280–296
Pajares, F. (1996). Self-efficacy beliefs in academic settings. Review of EducationalResearch, 66, 543–578.
Pajares, F., & Miller, D. M. (1995). Mathematics self-efficacy and mathematicsperformance. The need for specificity of assessment. Journal of CounselingPsychology, 42, 190–198.
Reis, H., Sheldon, K., Gable, S., Roscoe, J., & Ryan, R. (2000). Daily well-being: Therole of autonomy, competence, and relatedness. Personality and SocialPsychology Bulletin, 26, 419–435.
Robie, C., Schmit, M. J., Ryan, A. M., & Zickar, M. J. (2000). Effects of item contextspecificity on the measurement equivalence of a personality inventory.Organizational Research Methods, 3, 348–365.
Ryan, R. M. (1982). Control and information in the intrapersonal sphere: Anextension of cognitive evaluation theory. Journal of Personality and SocialPsychology, 43, 450–461.
Ryan, R. M. (1995). Psychological needs and the facilitation of integrative processes.Journal of Personality, 63, 397–427.
Ryan, R. M., & Brown, K. W. (2003). Why we don’t need self-esteem: Onfundamental needs, contingent love, and mindfulness. Psychological Inquiry,14, 71–76.
Ryan, R. M., & Deci, E. L. (2000a). Intrinsic and extrinsic motivations: Classicdefinitions and new directions. Contemporary Educational Psychology, 25, 54–67.
Ryan, R. M., & Deci, E. L. (2000b). Self-determination theory and the facilitation ofintrinsic motivation, social development, and well-being. American Psychologist,55, 68–78.
Ryan, R. M., & Deci, E. L. (2000c). The darker and brighter sides of human existence:Basic psychological needs as a unifying concept. Psychological Inquiry, 11,319–338.
Ryan, R. M., & Deci, E. L. (2002). Overview of self-determination theory: Anorganismic dialectical perspective. In E. L. Deci & R. M. Ryan (Eds.), Handbook ofself-determination research (pp. 3–33). Rochester, NY: University of RochesterPress.
Ryff, C. D. (1989). Happiness is everything, or is it? Explorations on the meaning ofpsychological well-being. Journal of Personality and Social Psychology, 57(6),1069–1081.
Satorra, A., & Bentler, P. M. (2009). Ensuring positiveness of the scaled differencechi-square test statistic. Psychometrika., doi:10.1007/s11336-009-9135-y.
Satorra, A., & Bentler, P. M. (1994). Corrections to test statistics and standard errorsin covariance structure analysis. In A. vonEye & C. C. Clogg (Eds.), Latentvariables analysis: Applications for developmental research. Thousand Oaks, CA:Sage.
Satorra, A., & Bentler, P. M. (2001). A scaled difference chi-square test statistic formoment structure analysis. Psychometrika, 66, 507–514.
Schmit, M. J., Ryan, A. M., Stierwalt, S. L., & Powell, A. B. (1995). Frame-of-referenceeffects on personality scale scores and criterion-related validity. Journal ofApplied Psychology, 80, 607–620.
Schunk, D. H., & Pajares, F. (2005). Competence perceptions and academicfunctioning. In A. J. Elliot & C. S. Dweck (Eds.), Handbook of competence andmotivation (pp. 85–104). New York, NY: The Guilford Press.
Sheldon, K. M., & Niemiec, C. P. (2006). It’s not just the amount that counts:Balanced need satisfaction also affects well-being. Journal of Personality andSocial Psychology, 91, 331–341.
Sijtsma, K. (2009a). Correcting fallacies in validity, reliability, and classification.International Journal of Testing, 9, 167–194.
Sijtsma, K. (2009b). Reliability beyond theory and into practice. Psychometrika, 74,169–173.
Swerdzewski, P. J. (2008). Should we worry about the way we measure worry overtime? A longitudinal analysis of student worry during the first two years ofcollege. Unpublished doctoral dissertation, James Madison University.
Thøgersen-Ntoumani, C., & Ntoumanis, N. (2007). A self-determination theoryapproach to the study of body image concerns, self-presentation and self-perceptions in a sample of aerobic instructors. Journal of Health Psychology, 12,301–315.
Vandenberg, R. J., & Lance, C. E. (2000). A review and synthesis of the measurementinvariance literature: Suggestions, practices, and recommendations, fororganizational research. Organizational Research Methods, 3, 4–70.
Vansteenkiste, M., Lens, W., Soenens, B., & Luyckx, K. (2006). Autonomy andrelatedness among Chinese sojourners and applicants: Conflictual orindependent predictors of well-being and adjustment? Motivation andEmotion, 30, 273–282.
Wei, M., Philip, A. S., Shaffer, A., Young, S. K., & Zakalik, R. A. (2005). Adultattachment, shame, depression, and loneliness: The mediation role of basicpsychological needs satisfaction. Journal of Counseling Psychology, 52, 591–601.
White, R. W. (1959). Motivation reconsidered: The concept of competence.Psychological Review, 66, 297–333.
Wigfield, A. (1997). Reading motivation: A domain specific approach to motivation.Educational Psychologist, 32, 59–68.
Yu, C., & Muthén, B. (2002). Evaluation of model fit indices for latent variablemodels with categorical and continuous outcomes. Paper presented at theAnnual meeting of the American Educational Research Association, April, NewOrleans.