measuring and tracking quality factors in free and …measuring and tracking quality factors in free...
TRANSCRIPT
Measuring and tracking quality factorsin Free and Open Source Software projects
Fabian Fagerholm
Helsinki October 9, 2007
Master’s ThesisUNIVERSITY OF HELSINKIDepartment of Computer Science

Faculty of Science Department of Computer Science
Fabian Fagerholm
Measuring and tracking quality factors in Free and Open Source Software projects
Computer Science
M. Sc. Thesis October 9, 2007 77 pages
free software, open source software, foss, software quality, software metrics
Kumpula Science Library, serial number C-
Free and Open Source Software (foss) has gained increased interest in the computersoftware industry, but assessing its quality remains a challenge. Foss developmentis frequently carried out by globally distributed development teams, and all stagesof development are publicly visible. Several product and process-level quality factorscan be measured using the public data.
This thesis presents a theoretical background for software quality and metrics andtheir application in a foss environment. Information available from foss projectsin three information spaces are presented, and a quality model suitable for use in afoss context is constructed. The model includes both process and product qualitymetrics, and takes into account the tools and working methods commonly used infoss projects.
A subset of the constructed quality model is applied to three foss projects, high-lighting both theoretical and practical concerns in implementing automatic metriccollection and analysis. The experiment shows that useful quality information canbe extracted from the vast amount of data available. In particular, projects vary intheir growth rate, complexity, modularity and team structure.
ACM Computing Classification System (CCS):Categories and subject descriptors:D.2.8 [Software Engineering]: Metrics;D.2.9 [Software Engineering]: Management—Life cycle, Programming teams, Software con-figuration management, Software process models (e.g., CMM, ISO, PSP), Software qualityassurance (SQA);H.4.2 [Information systems applications]: Types of systems—Decision support (e.g., MIS);K.6.3 [Management of computing and information systems]: Software management
General terms:
Human Factors, Management, Measurement
Tiedekunta/Osasto — Fakultet/Sektion — Faculty Laitos — Institution — Department
Tekijä — Författare — Author
Työn nimi — Arbetets titel — Title
Oppiaine — Läroämne — Subject
Työn laji — Arbetets art — Level Aika — Datum — Month and year Sivumäärä — Sidoantal — Number of pages
Tiivistelmä — Referat — Abstract
Avainsanat — Nyckelord — Keywords
Säilytyspaikka — Förvaringsställe — Where deposited
Muita tietoja — övriga uppgifter — Additional information
HELSINGIN YLIOPISTO — HELSINGFORS UNIVERSITET — UNIVERSITY OF HELSINKI

i
Contents
1 Introduction 1
2 Quality as a measurable quantity 2
2.1 The intuitive view of quality . . . . . . . . . . . . . . . . . . . . . . . 3
2.2 Translating intuition into a quality system . . . . . . . . . . . . . . . 6
2.3 Metrics as the building blocks of quality measurement . . . . . . . . . 9
2.3.1 Analysis and design metrics . . . . . . . . . . . . . . . . . . . 11
2.3.2 Code metrics . . . . . . . . . . . . . . . . . . . . . . . . . . . 12
2.3.3 Object-oriented metrics . . . . . . . . . . . . . . . . . . . . . . 13
2.3.4 Maintenance metrics . . . . . . . . . . . . . . . . . . . . . . . 16
2.3.5 General metrics problems . . . . . . . . . . . . . . . . . . . . 17
3 Quality in the context of Free and Open Source Software 19
3.1 The foss mind set: catalyst or obstacle? . . . . . . . . . . . . . . . . 20
3.1.1 How foss compares to process models . . . . . . . . . . . . . 22
3.1.2 Process maturity and success . . . . . . . . . . . . . . . . . . 24
3.1.3 Openness and reliability . . . . . . . . . . . . . . . . . . . . . 26
3.2 Previous work and case studies . . . . . . . . . . . . . . . . . . . . . 26
3.2.1 Growth, evolution and structural change . . . . . . . . . . . . 27
3.2.2 Mining public repositories . . . . . . . . . . . . . . . . . . . . 28
3.2.3 Empirical tests of statistical quality models . . . . . . . . . . . 31
3.2.4 Object-oriented metrics for foss . . . . . . . . . . . . . . . . 33
3.2.5 Foss quality assessment model . . . . . . . . . . . . . . . . . 35
4 Quality model for Free and Open Source Software projects 36
4.1 Preliminary description and project hypotheses . . . . . . . . . . . . 36

ii
4.2 Data sources . . . . . . . . . . . . . . . . . . . . . . . . . . . . . . . . 38
4.2.1 Discussion space sources . . . . . . . . . . . . . . . . . . . . . 39
4.2.2 Documentation space sources . . . . . . . . . . . . . . . . . . 39
4.2.3 Implementation space sources . . . . . . . . . . . . . . . . . . 41
4.3 Data model . . . . . . . . . . . . . . . . . . . . . . . . . . . . . . . . 42
4.4 Metric taxonomy . . . . . . . . . . . . . . . . . . . . . . . . . . . . . 43
5 Experiment: Applying quality analysis to real Free and Open SourceSoftware projects 45
5.1 Project selection . . . . . . . . . . . . . . . . . . . . . . . . . . . . . 46
5.2 Data identification, acquisition and cleaning . . . . . . . . . . . . . . 46
5.3 Description of metrics calculation . . . . . . . . . . . . . . . . . . . . 50
6 Experiment: Results 51
6.1 Linux . . . . . . . . . . . . . . . . . . . . . . . . . . . . . . . . . . . 53
6.1.1 Process quality . . . . . . . . . . . . . . . . . . . . . . . . . . 53
6.1.2 Product quality . . . . . . . . . . . . . . . . . . . . . . . . . . 54
6.2 Blender . . . . . . . . . . . . . . . . . . . . . . . . . . . . . . . . . . 58
6.2.1 Process quality . . . . . . . . . . . . . . . . . . . . . . . . . . 58
6.2.2 Product quality . . . . . . . . . . . . . . . . . . . . . . . . . . 60
6.2.3 Object-oriented features . . . . . . . . . . . . . . . . . . . . . 62
6.3 The gimp . . . . . . . . . . . . . . . . . . . . . . . . . . . . . . . . . 63
6.3.1 Process quality . . . . . . . . . . . . . . . . . . . . . . . . . . 64
6.3.2 Product quality . . . . . . . . . . . . . . . . . . . . . . . . . . 65
6.4 Summary . . . . . . . . . . . . . . . . . . . . . . . . . . . . . . . . . 67
7 Conclusions 69
References 70
List of Figures
1 Software Quality Characteristics Tree . . . . . . . . . . . . . . . . . . 7
2 Ieee software quality metrics framework . . . . . . . . . . . . . . . . 8
3 Layered organisational structure of an idealised foss project . . . . . 25
4 Fact extraction process of Columbus framework . . . . . . . . . . . . 34
5 Foss project data model . . . . . . . . . . . . . . . . . . . . . . . . . 43
6 Foss project quality model . . . . . . . . . . . . . . . . . . . . . . . 44
7 Commits per author: Linux and Linux-historical . . . . . . . . . . . . 53
8 Posts per poster and bugs per submitter: Linux . . . . . . . . . . . . 55
9 Sloc evolution: Linux and Linux-historical . . . . . . . . . . . . . . 55
10 Subsystem growth: Linux and Linux-historical . . . . . . . . . . . . . 56
11 Commit and post frequency: Linux and Linux-historical . . . . . . . 56
12 Bug frequency and arrival rate per commit rate: Linux . . . . . . . . 57
13 Sloc per nom and cyc per nom: Linux . . . . . . . . . . . . . . . . 57
14 Fan-in and fan-out per sloc: Linux . . . . . . . . . . . . . . . . . . . 58
15 Commits per author, posts per poster and bugs per submitter: Blender 59
16 Sloc evolution and subsystem growth: Blender . . . . . . . . . . . . 60
17 Commit and post frequency: Blender . . . . . . . . . . . . . . . . . . 61
18 Bug arrival rate and arrival rate per commit rate: Blender . . . . . . 61
19 Sloc per nom and cyc per nom: Blender . . . . . . . . . . . . . . . 62
20 Fan-in and fan-out per sloc: Blender . . . . . . . . . . . . . . . . . . 62
21 Information flow, dit and noc, and cbo, wmc, and fan-in: Blender . 63
22 Commits per author, posts per poster and bugs per submitter: gimp 64
23 Sloc evolution and subsystem growth: gimp . . . . . . . . . . . . . 65
24 Commit and post frequency: gimp . . . . . . . . . . . . . . . . . . . 66
25 Bug frequency and arrival rate per commit rate: gimp . . . . . . . . 66
26 Sloc per nom and cyc per nom: gimp . . . . . . . . . . . . . . . . 67
27 Fan-in and fan-out per sloc: gimp . . . . . . . . . . . . . . . . . . . 67

List of Tables
1 Knowledge requirements in software quality measurement . . . . . . . 4
2 Halstead’s software science indicators . . . . . . . . . . . . . . . . . . 13
3 Object-oriented metrics by Chidamber and Kemerer . . . . . . . . . . 16
4 Object-oriented metric hypotheses by Ferenc et al. . . . . . . . . . . 34
5 Foss information spaces and data sources . . . . . . . . . . . . . . . 40
6 Data sources for experiment . . . . . . . . . . . . . . . . . . . . . . . 47
7 Number of messages and time to import them . . . . . . . . . . . . . 47
8 Number of bugs and time to import them . . . . . . . . . . . . . . . 48
9 Number of revisions, run interval for metrics calculation, and time toimport them . . . . . . . . . . . . . . . . . . . . . . . . . . . . . . . . 49
10 Description of calculated metrics . . . . . . . . . . . . . . . . . . . . 52
11 Developer classes: Linux and Linux-historical . . . . . . . . . . . . . 54
12 Developer classes: Blender . . . . . . . . . . . . . . . . . . . . . . . . 59
13 Developer classes: gimp . . . . . . . . . . . . . . . . . . . . . . . . . 64
14 Summary and interpretation of experiment results . . . . . . . . . . . 68
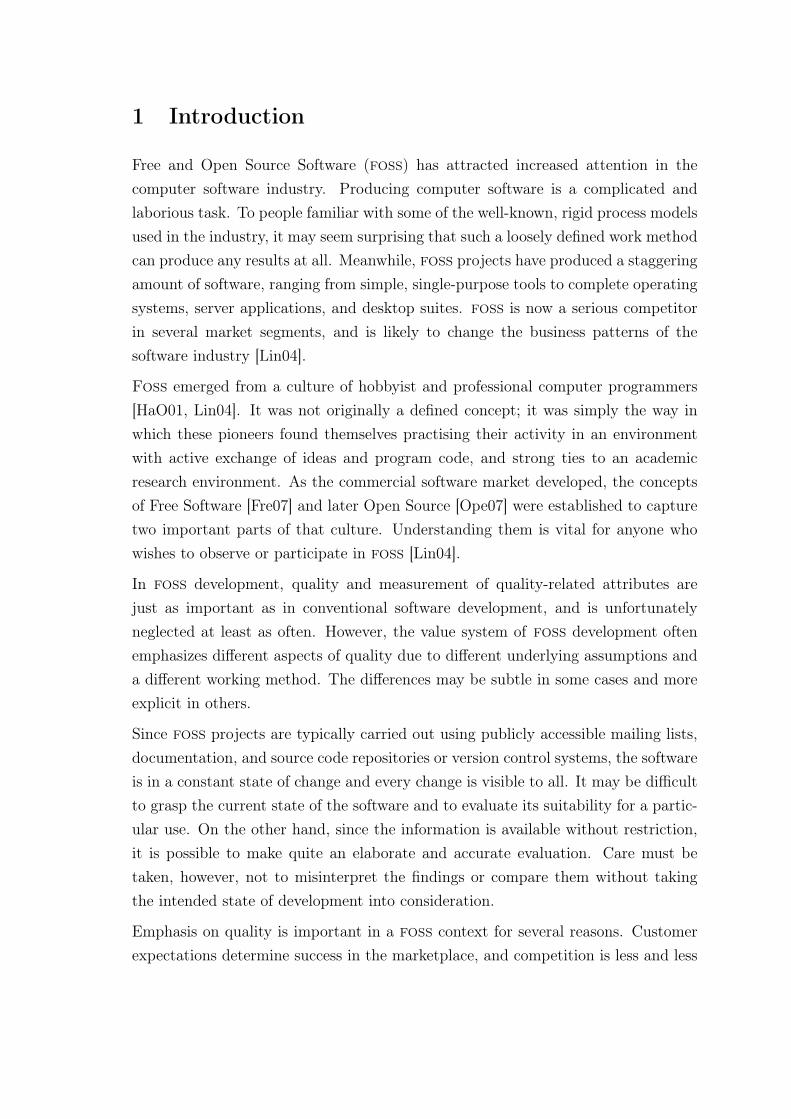
1 Introduction
Free and Open Source Software (foss) has attracted increased attention in thecomputer software industry. Producing computer software is a complicated andlaborious task. To people familiar with some of the well-known, rigid process modelsused in the industry, it may seem surprising that such a loosely defined work methodcan produce any results at all. Meanwhile, foss projects have produced a staggeringamount of software, ranging from simple, single-purpose tools to complete operatingsystems, server applications, and desktop suites. foss is now a serious competitorin several market segments, and is likely to change the business patterns of thesoftware industry [Lin04].
Foss emerged from a culture of hobbyist and professional computer programmers[HaO01, Lin04]. It was not originally a defined concept; it was simply the way inwhich these pioneers found themselves practising their activity in an environmentwith active exchange of ideas and program code, and strong ties to an academicresearch environment. As the commercial software market developed, the conceptsof Free Software [Fre07] and later Open Source [Ope07] were established to capturetwo important parts of that culture. Understanding them is vital for anyone whowishes to observe or participate in foss [Lin04].
In foss development, quality and measurement of quality-related attributes arejust as important as in conventional software development, and is unfortunatelyneglected at least as often. However, the value system of foss development oftenemphasizes different aspects of quality due to different underlying assumptions anda different working method. The differences may be subtle in some cases and moreexplicit in others.
Since foss projects are typically carried out using publicly accessible mailing lists,documentation, and source code repositories or version control systems, the softwareis in a constant state of change and every change is visible to all. It may be difficultto grasp the current state of the software and to evaluate its suitability for a partic-ular use. On the other hand, since the information is available without restriction,it is possible to make quite an elaborate and accurate evaluation. Care must betaken, however, not to misinterpret the findings or compare them without takingthe intended state of development into consideration.
Emphasis on quality is important in a foss context for several reasons. Customerexpectations determine success in the marketplace, and competition is less and less
2
restricted by copyright but instead based on competence [Lin04]. At the same time,competence among foss project participants varies greatly and as a result, qualityis not reliably managed. The ability to understand quality, to measure it, or totake appropriate steps to assure it are not among the frequently found skills in foss
projects. However, interest in the subject is slowly rising.
This thesis explores the relationship and tensions between existing systematic qualitypractices and the diverse and often ad hoc practices of the foss community. It isour belief that the foss community has a will to improve software and processquality beyond what is currently achieved, and that it will assimilate knowledge andmethods that are practically usable. Also, entities wishing or needing to observe orparticipate in foss development or use can benefit from knowledge of how to applyand interpret quality assessment in a foss environment.
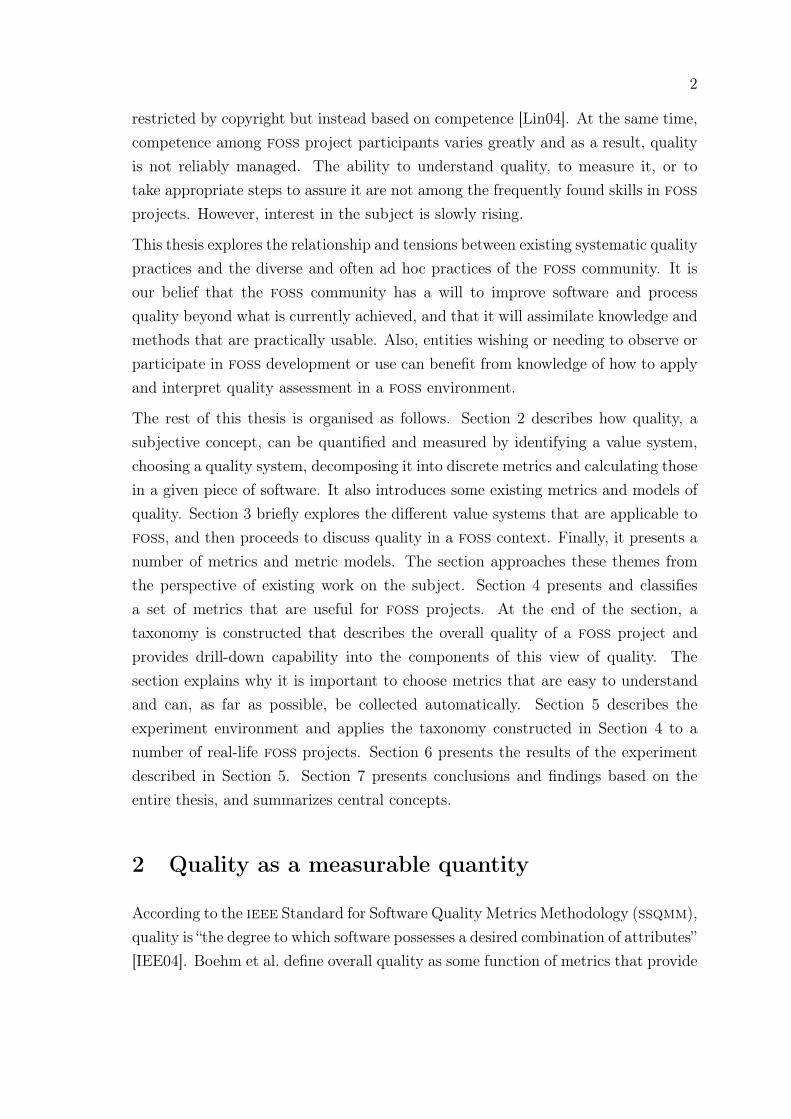
The rest of this thesis is organised as follows. Section 2 describes how quality, asubjective concept, can be quantified and measured by identifying a value system,choosing a quality system, decomposing it into discrete metrics and calculating thosein a given piece of software. It also introduces some existing metrics and models ofquality. Section 3 briefly explores the different value systems that are applicable tofoss, and then proceeds to discuss quality in a foss context. Finally, it presents anumber of metrics and metric models. The section approaches these themes fromthe perspective of existing work on the subject. Section 4 presents and classifiesa set of metrics that are useful for foss projects. At the end of the section, ataxonomy is constructed that describes the overall quality of a foss project andprovides drill-down capability into the components of this view of quality. Thesection explains why it is important to choose metrics that are easy to understandand can, as far as possible, be collected automatically. Section 5 describes theexperiment environment and applies the taxonomy constructed in Section 4 to anumber of real-life foss projects. Section 6 presents the results of the experimentdescribed in Section 5. Section 7 presents conclusions and findings based on theentire thesis, and summarizes central concepts.
2 Quality as a measurable quantity
According to the ieee Standard for Software Quality Metrics Methodology (ssqmm),quality is “the degree to which software possesses a desired combination of attributes”[IEE04]. Boehm et al. define overall quality as some function of metrics that provide
3
“a quantitative measure of the degree to which the program has the associated char-acteristic” [Boe76]. These are very high-level definitions that do not yet specify howto actually measure quality in any amount of detail. Their application is much morecomplicated than what might be inferred from these simple, one-sentence definitions.
2.1 The intuitive view of quality
Intuitively, software quality is about a computer program working “as it is supposedto”. Customer satisfaction is a key ingredient [Roy90, MäM06]. In other words,there is an element of expectancy that the program does not act in ways whichsurprises the user. For example, a particular user may feel that the program mustnot carry out its actions too slowly, it should not produce incorrect results, and itshould not crash or lock up. Another user might not care as much about the speed ofthe program, as long as its result is always very precise. However, user expectationsmay be misleading; yet another user may be accustomed to bad performance andreliability, and is not surprised at all if the program works only randomly. In thiscase, quality will in fact deviate from user expectations.
Also, the intuitive view of quality might include requirements that the program iseasy enough to use, and could also include matters of taste and habit, such as thecolour scheme used or the particular order in which certain actions are performed;local law and culture, such as the ability to retain call data in a telecommunicationssystem or to protect the privacy of a health care client; or the particular needs of asingle organisation or group of people.
The intuitive view of quality is useful, because it is a starting point from whichto approach a definition of quality. In the ieee ssqmm, the establishment of soft-ware quality requirements starts with an intuitive view of quality, from which therequirements and constraints are drawn:
Use organizational experience, required standards, regulations, or laws to cre-
ate this list. . . . Consider contractual requirements and acquisition concerns,
such as cost or schedule constraints, warranties, customer metrics require-
ments, and organisational self-interest [IEE04].
4
It should also be noted that quality at this level is fundamentally a patchwork ofconflicting needs. As Boehm et al. state:
. . . added efficiency is often purchased at the price of portability, accuracy,
understandability, and maintainability; added accuracy often conflicts with
portability via dependence on word size; conciseness can conflict with legibility.
Users generally find it difficult to quantify their preferences in such conflict
situations [Boe76].
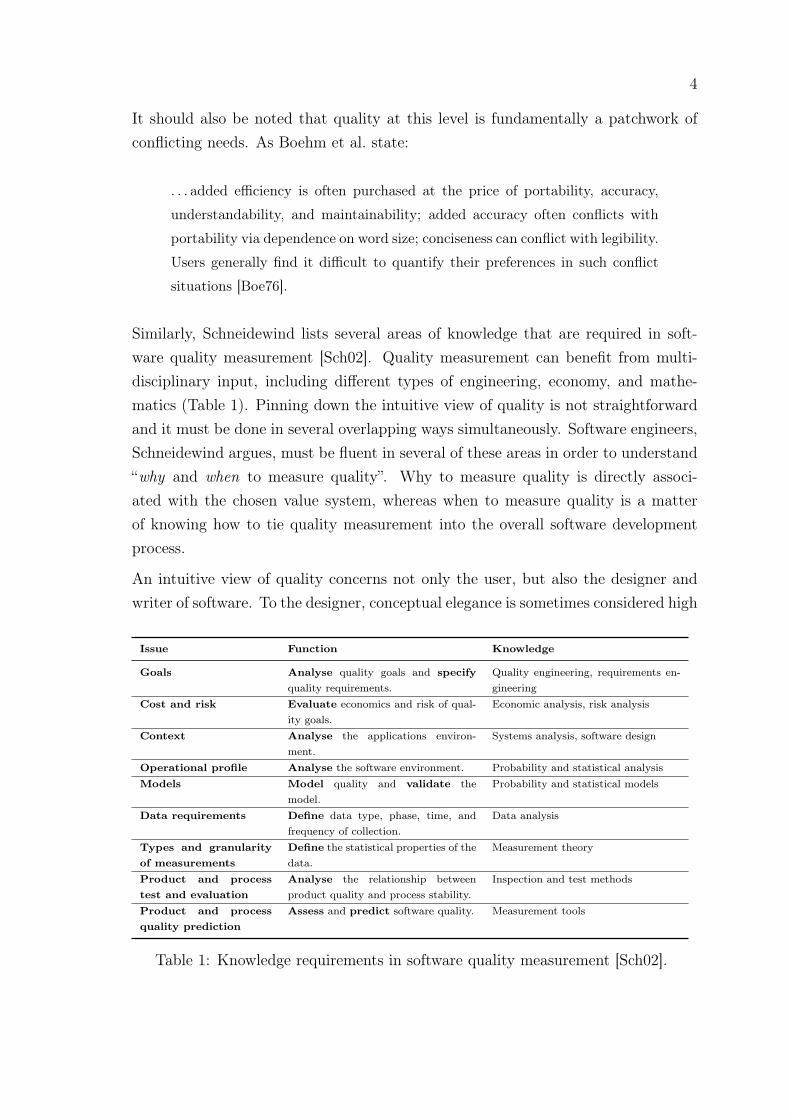
Similarly, Schneidewind lists several areas of knowledge that are required in soft-ware quality measurement [Sch02]. Quality measurement can benefit from multi-disciplinary input, including different types of engineering, economy, and mathe-matics (Table 1). Pinning down the intuitive view of quality is not straightforwardand it must be done in several overlapping ways simultaneously. Software engineers,Schneidewind argues, must be fluent in several of these areas in order to understand“why and when to measure quality”. Why to measure quality is directly associ-ated with the chosen value system, whereas when to measure quality is a matterof knowing how to tie quality measurement into the overall software developmentprocess.
An intuitive view of quality concerns not only the user, but also the designer andwriter of software. To the designer, conceptual elegance is sometimes considered high
Issue Function Knowledge
Goals Analyse quality goals and specifyquality requirements.
Quality engineering, requirements en-gineering
Cost and risk Evaluate economics and risk of qual-ity goals.
Economic analysis, risk analysis
Context Analyse the applications environ-ment.
Systems analysis, software design
Operational profile Analyse the software environment. Probability and statistical analysisModels Model quality and validate the
model.Probability and statistical models
Data requirements Define data type, phase, time, andfrequency of collection.
Data analysis
Types and granularityof measurements
Define the statistical properties of thedata.
Measurement theory
Product and processtest and evaluation
Analyse the relationship betweenproduct quality and process stability.
Inspection and test methods
Product and processquality prediction
Assess and predict software quality. Measurement tools
Table 1: Knowledge requirements in software quality measurement [Sch02].

5
quality. A well designed class hierarchy does not break or lose its logical compositionwhen introducing new classes as the program evolves. The task of programmingaccording to specifications becomes possible, and there is little need to redesignthe program. Programming tasks are easily divided among the programmers. Forexample, the program can be written one class at a time and one method at a time,relying on the designed interfaces. Even if one module is changed, the change stayslimited and does not cause a need for further change in other modules. There is norisk of incompatibility, because the design is correct and of high quality. It fits intothe overall production process and enables product quality.
To the writer of software, quality goes beyond the design and into the lowest levelsof the program. Each line of code can have an aesthetic quality. It can be easyto understand, making the code fluent to read and thus easy to modify. However,other constraints, such as efficiency requirements, might lead to code that is hardto read but performs exceptionally well. This is also an aspect of quality, as is theability to write terse, compact code – including as much functionality as possible inas few statements as possible. It is impossible to dismiss any such view of qualitywithout first establishing what is to be accomplished.
To both designers and writers of software, it seems that ease of change, or flexibility,is a key quality criterion on the intuitive level [Roy90]. It is a prerequisite for ongoingdevelopment. Unless the software can be practically changed, there is a real risk offinancial loss to users and developers. We observe that flexibility is one of the keymotivators behind the structure of many foss projects.
This intuitive view provides little or no possibility to assess whether or not a softwareproduct is of high quality, but it provides the value system from which a more formaldefinition of quality can be drawn. In other words, there exists no universal definitionof quality. Rather, each application of quality methods must take into account theparticular setting in which the software is to be used and maintained. By analysingquality goals, requirements, and context; and assessing the cost and risks of these, asoftware project can determine what the value system of the users is. Fortunately,many value systems have a lot in common, and therefore quality practitioners canreuse existing work, enabling comparison of software and development processes.
Since quality is such a multi-faceted concept, a rigorous definition is needed toremove the ambiguities and allow a group of people to work toward the same, knownquality goals [Sto90]. This view of quality must be measurable, otherwise it isimpossible to know whether or not quality has been achieved.
6
2.2 Translating intuition into a quality system
Given an intuitive view of quality, it seems obvious that choices must be made toremove ambiguity and balance conflicting needs if one is to systematically approachquality. Several methods have been proposed, some of which are completely theo-retical and others which are based on established industry practice.
Boehm et al. reported their findings in 1976. Their work has been ground-breakingin the software industry. They describe results from an earlier study that was toidentify a set of characteristics of software quality. Initially, they set out to define asingle overall quality value based on a combination of metrics:
1. Given an arbitrary program, the metric provides a quantitative measureof the degree to which the program has the associated characteristic, and
2. Overall software quality can be defined as some function of the values of
the metrics [Boe76].
However, after closer evaluation, they concluded that “there is . . . no single metricwhich can give a universally useful rating of software quality”. They proceeded todescribe one possibility for breaking down quality into a hierarchical set of charac-teristics and a set of anomaly-detecting metrics. The goal was no longer to provide asingle model in which all software could be assessed, but rather to provide a concep-tual framework in which each software project could find guidance in establishingtheir own software quality practice.
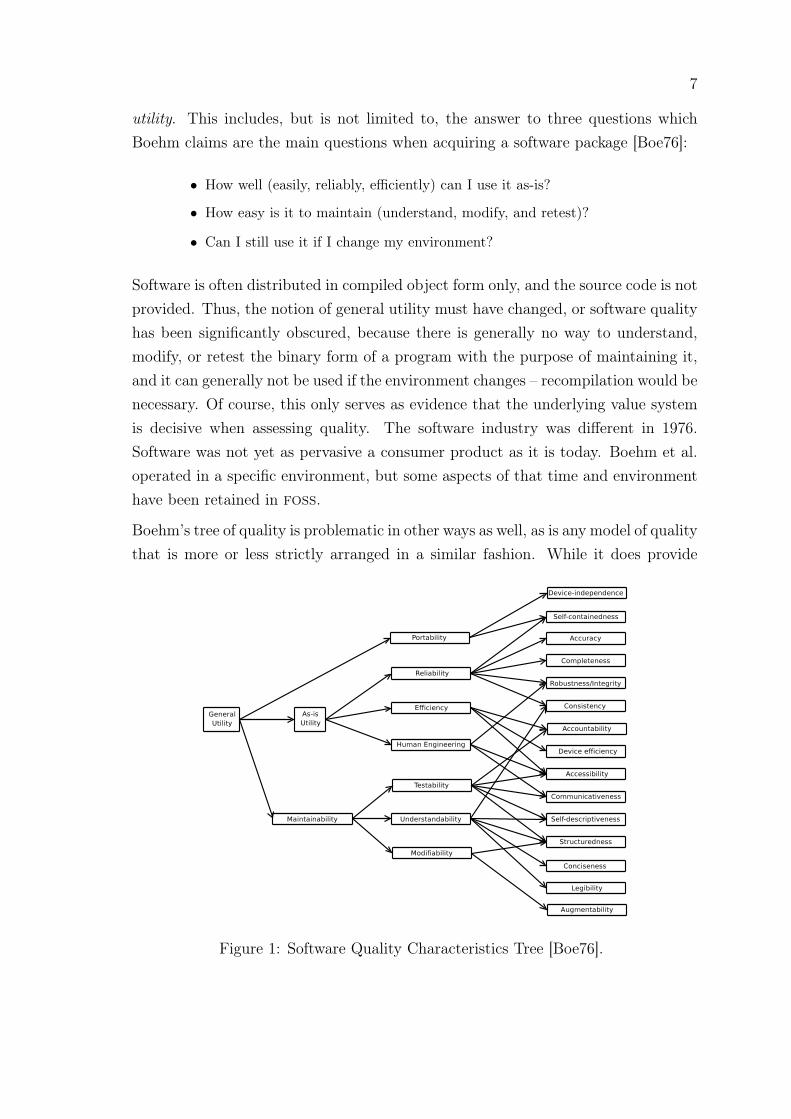
They used a stepwise approach to define quality characteristics and metrics attachedto those. In each step, they manually refined the characteristics and metrics to avoidoverlap and increase coverage. They found that the characteristics were related ina type of tree structure (Figure 1). The lower levels of the tree are preconditionsfor their parent characteristics, so for example, the degree of understandability andtestability directly influence the degree of maintainability of the program. Thus,the tree reflects the value system that they chose. Also, the idea of a single, overallquality value was not abandoned. The desire was to have a quality system thatwould allow some degree of comparison between different software products.
It is interesting to note that the view of software held by Boehm et al. is similar tothe foss view in one important way: it implicitly assumes that whoever acquiresthe software has access to the source code. In fact, software seems to be equatedwith source code. At the top of Boehm’s tree of quality is the characteristic general
7
utility. This includes, but is not limited to, the answer to three questions whichBoehm claims are the main questions when acquiring a software package [Boe76]:
• How well (easily, reliably, efficiently) can I use it as-is?
• How easy is it to maintain (understand, modify, and retest)?
• Can I still use it if I change my environment?
Software is often distributed in compiled object form only, and the source code is notprovided. Thus, the notion of general utility must have changed, or software qualityhas been significantly obscured, because there is generally no way to understand,modify, or retest the binary form of a program with the purpose of maintaining it,and it can generally not be used if the environment changes – recompilation would benecessary. Of course, this only serves as evidence that the underlying value systemis decisive when assessing quality. The software industry was different in 1976.Software was not yet as pervasive a consumer product as it is today. Boehm et al.operated in a specific environment, but some aspects of that time and environmenthave been retained in foss.
Boehm’s tree of quality is problematic in other ways as well, as is any model of qualitythat is more or less strictly arranged in a similar fashion. While it does provide
Figure 1: Software Quality Characteristics Tree [Boe76].

8
insight into the quality characteristics and their relations, it does not accuratelydefine them. The final and decisive definition becomes an exercise in interpretingambiguous human language, instead of being defined in an objectively measurableway. Also, the notion of an overall quality measure is extremely difficult to apply inpractice, and could at best be used in a limited subset of software with very similarrequirements [Sto90].
Even so, the notion continues to be part of many definitions of quality systems. Theieee ssqmm describes a flexible framework that helps an organisation to divide theview of quality into meaningful parts, quality attributes, which describe the qualityof the software system that is being built (Figure 2). The quality attributes are thenassigned quality factors, which can in turn be assigned subfactors. Finally, factorsand subfactors are associated to metrics that serve as quantitative, measurable rep-resentations of the factors. It should be noted that there is no assumption or claimin this framework that the metrics or factors can be recombined to give one singlequality value. Rather, the framework serves as a conceptual aid to establish whichfacets of quality the organisation wishes to monitor.
The task of upholding a quality system in an organisation is called quality assur-ance. It is performed by a department or organisation that defines the standards forquality, specifies and sometimes implements tools and aids for assessing quality, andapplies the tools to the software created by other parts of the organisation in orderto check for adherence to quality standards, to give them feedback, and to suggestareas of improvement [Gaf81]. This function is commonly folded into the program-
Figure 2: Ieee software quality metrics framework [IEE04].
9
ming team in order to make communication more effective or when resources arescarce, but it may also be an external function.
In order to translate intuition into a quality system, intimate knowledge of severaldifferent issues is required, and they must be balanced to fulfil the requirementsin each particular situation. As the requirements change over the lifetime of thesoftware, it may be necessary to revisit the choices and adjust the balance. Therefore,it is important to retain some knowledge of the underlying value system and thechoices made in the translation to a quality system.
2.3 Metrics as the building blocks of quality measurement
Software metrics are measurements of some properties of a software system, itsspecifications, and the software project to develop it [Cha06]. Some possible usesof software metrics are to estimate the time required to build a certain piece ofsoftware, the cost of the same, the number of programmers required given certaintime constraints, or, in the case of software quality metrics, to establish whether thesoftware meets the defined quality requirements and to alert an ongoing project ofemerging quality issues.
As indicated in the previous section, there is both theoretical and practical supportfor a general view of quality measurement that relies on metrics. The completepicture of quality is broken down into pieces, possibly in a hierarchical fashionand in multiple steps. Each piece is a measurable attribute of the software. Themeasurements can be divided into static or internal and dynamic or external. Theformer is derived from the program itself, such as the source code. The latteris derived from the behaviour of the program, such as assessment of the runningprogram or an aspect of running it [Gaf81, Nag04, Nag05]. In general, we wishto influence the external aspects, but we are limited to affecting the internal ones.Internal metrics can be collected earlier and easier than external ones, and havebeen shown to correlate with externally visible quality [Nag04, Nag05].
The purpose of metrics is both descriptive and predictive. In their descriptive capa-city, they help to classify software and projects. For example, the size of the sourcecode, the number of developers, the programming language used, and the age of thesoftware product are useful classifiers.
In their predictive capacity, metrics assist in performing educated guesses and sup-port decisions that affect the future of the software or project. For example, field

10
defects are defined as user-reported, code-related problems requiring programmerintervention to correct. Predictive metrics can be used to estimate the number orlikely location of the field defects, so that their number can be minimised before thesoftware is deployed and put to use. This implies that some metric data must beavailable before the software is finished.
When assessing quality, samples are taken from the software and used in a softwaremetric model. In general, the model relates the measured attributes – predictormetrics – to a target metric. The target metrics are quality factors as specified bythe quality system. Some models attempt to give an overall quality value by takingall factors into account and relating them to a single target factor, while otherssimply highlight different aspects of quality.
Once a metric model has been constructed, it is important to validate it, both theo-retically and with empirical data. The purpose of validation is to ensure that ourmeasurements are in fact giving us the information we seek. One part of validation isto run the metric model against a data set that has been validated by human obser-vation, and see how well it predicts the known outcome in those cases. For stochasticmodels, the prediction accuracy may be expressed as an error margin. Another partof validation is to theoretically confirm that a metric is an accurate representation ofthe phenomenon it measures. Knowledge of statistical and measurement-theoreticconcepts is needed in validation (Table 1).
Comparing metric models of different kinds can lead to adoption of valid modelswith better accuracy. Khoshgoftaar et al. have compared regression modelling withneural network modelling in software quality models. Initially, they observe that theset of available metrics is large, and that the metrics are often highly correlated. Thisis not desirable in multiple regression modelling. On the other hand, it is beneficialfor neural network models. In those, multiple inputs should lead to a more completemodel as the metrics focus on different, but overlapping and complementary aspectsof the software. In their comparison, Khoshgoftaar et al. find that neural networkmodels yield more accurate results although they require more time to train thanregression-based methods [Kho95].
Not all metrics are important for every case, nor is there likely to exist a singletechnique that suits all cases [Ola92]. To establish a predictor as important, Li etal. list three methods [Li05]. First, high correlation between the predictor and fielddefects can be shown. Second, it can be shown that the predictor is selected usinga model selection method. Third, it can be shown that the accuracy of predictionsimproves with the predictor included in the prediction model.

11
A great number of predictor or metric models and related metrics have been con-structed, described, and validated over more than 30 years. At the same time,software metrics are not put to good use in mainstream software engineering, partlybecause of their complexity but also because their relation to practical decision-making is vague [FeN00]. Metrics are often used as simple passing criteria for aspecific process phase, typically the testing phase. From a quality perspective, itis not adequate to simply count the amount of automated tests that the softwarepasses, or the number of defects discovered by the tests – quality is built into everyaction during the entire software production process [Oga96]. This is also importantbecause quality assessment must be performed early enough to allow developers totake corrective action [Nag04, Nag05].
2.3.1 Analysis and design metrics
Analysis and design metrics, also known as structure metrics, are global indicatorsof quality which can be taken early in the software life-cycle. They measure thosefeatures of the software product that have come into existence during the analysisand design phases [Kaf85]. Thus, they function as early indicators of the potentialquality of the final product, and also as a basis for effort, cost and risk estimation.
The primary use of analysis and design metrics is before the implementation phasestarts. If the design quality is too low, the project may have to take a few steps backand revisit some design decisions [Roy87]. Missing knowledge might be a reason forbad design, and that could be alleviated by choosing an iterative process model thatdoes not assume that all the required knowledge is in place from the start. Structuremetrics can also be used to compare the potential quality inherent in the softwaredesign with actual quality in the final product.
The information flow metric is a structure metric that measures the sources (fan-in)and destinations (fan-out) of all data related to a given software component. Thesefactors are used to compute the communication complexity of the component, whichis taken as a measure of the strength of its communication relationship with othercomponents. The fan-in consists of all function parameters and global data struc-tures from which the function retrieves its information, while the fan-out consists ofthe return values from function calls and the global data structures that the functionupdates [Kaf85, WaH88].
12
Another important structure metric draws attention to the “ripple effect” that occurswhen a change to one component causes a need for change in other components. Inthis stability measure, the flow of data through parameters and global variables isused to identify the components which could be affected by a change in a particularcomponent [Kaf85].
Both of these metrics reflect a quality risk. If program components are designed tobe too dependent on each other, flexibility is lost. This means the program is moredifficult to change in the future.
Other metrics that can be taken once the analysis and design phases are completeare the number of documents produced, the size of these documents, and severalmetrics that analyse the contents of the documents. Using these, a project coulddetermine whether the analysis and design quality is sufficient, or if more work isneeded.
2.3.2 Code metrics
Code metrics are all those metrics that measure the actual code produced in theimplementation phase of a software process. Together with structure metrics, theybelong to the class of internal attributes of a program. Code metrics are problematicin the sense that they are available only after the code has been produced, and thusit is relatively expensive to correct the problems they might reveal compared toaddressing the issues in the design phase [Kaf85, Roy87]. When simply measuringsoftware quality, they are of course useful regardless of whether addressing them ispractical or not.
Perhaps the oldest and most obvious metric is the lines of code metric (loc). It is ameasure of program size, and although simple at first glance, there are some issuesto consider when defining the precise way of calculating it, such as whether blanklines and comments should be included. Loc is a basic metric that is frequently acomponent in several higher-level calculations. For example, programmer produc-tivity measures and quality criteria have used loc as their basis. Loc has receivedcriticism, but it has been found no less valid than other, more sophisticated sizemeasures [Kaf85].
Halstead’s software science is a collection of metrics and equations based on thenumber of unique operators and operands, and the number of total operators andoperands in a program [Hal75]. From these, Halstead derives measures of program
13
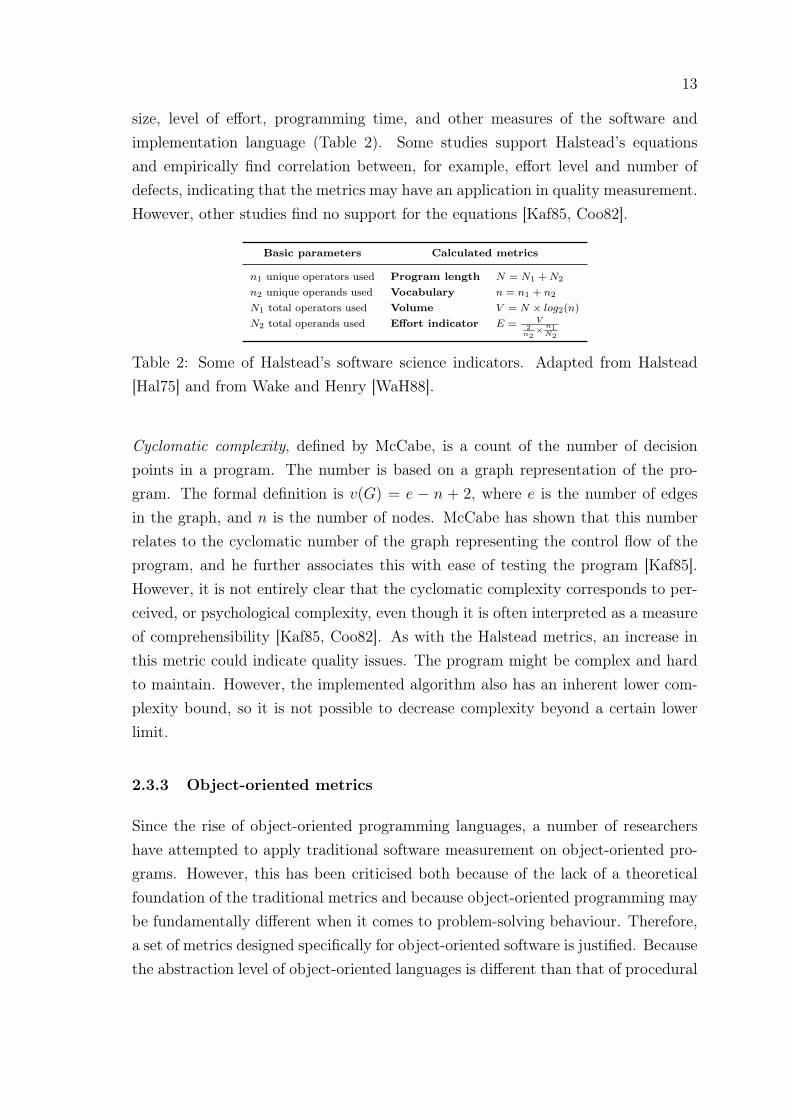
size, level of effort, programming time, and other measures of the software andimplementation language (Table 2). Some studies support Halstead’s equationsand empirically find correlation between, for example, effort level and number ofdefects, indicating that the metrics may have an application in quality measurement.However, other studies find no support for the equations [Kaf85, Coo82].
Basic parameters Calculated metrics
n1 unique operators used Program length N = N1 + N2
n2 unique operands used Vocabulary n = n1 + n2
N1 total operators used Volume V = N × log2(n)
N2 total operands used Effort indicator E = V2
n2× n1
N2
Table 2: Some of Halstead’s software science indicators. Adapted from Halstead[Hal75] and from Wake and Henry [WaH88].
Cyclomatic complexity, defined by McCabe, is a count of the number of decisionpoints in a program. The number is based on a graph representation of the pro-gram. The formal definition is v(G) = e − n + 2, where e is the number of edgesin the graph, and n is the number of nodes. McCabe has shown that this numberrelates to the cyclomatic number of the graph representing the control flow of theprogram, and he further associates this with ease of testing the program [Kaf85].However, it is not entirely clear that the cyclomatic complexity corresponds to per-ceived, or psychological complexity, even though it is often interpreted as a measureof comprehensibility [Kaf85, Coo82]. As with the Halstead metrics, an increase inthis metric could indicate quality issues. The program might be complex and hardto maintain. However, the implemented algorithm also has an inherent lower com-plexity bound, so it is not possible to decrease complexity beyond a certain lowerlimit.
2.3.3 Object-oriented metrics
Since the rise of object-oriented programming languages, a number of researchershave attempted to apply traditional software measurement on object-oriented pro-grams. However, this has been criticised both because of the lack of a theoreticalfoundation of the traditional metrics and because object-oriented programming maybe fundamentally different when it comes to problem-solving behaviour. Therefore,a set of metrics designed specifically for object-oriented software is justified. Becausethe abstraction level of object-oriented languages is different than that of procedural

14
languages, design of object-oriented systems produces designs that are closer to theimplementation code. Therefore, these metrics can be partly used to measure bothdesign and implementation – although some of them can only be used when theimplementation exists.
Chidamber and Kemerer have developed object-oriented metrics that have a rigoroustheoretical foundation and have validated them empirically [ChK94]. Their approachfocuses on the design of object-oriented software, and they argue that the benefitsof design evaluation can be substantially greater than metrics aimed at later phasesof the software life-cycle. Their metrics are independent of the particular object-oriented language. This means that upon actual use, some choices must be madedepending on the language in question.
The authors draw from theoretical philosophy in defining the following terms:
Coupling: The degree of interdependence between parts. Two objects are coupled if atleast one of them acts upon the other.
Cohesion: The internal consistency within parts. In object-oriented programming, thedegree to which related things are kept together; similarity between methods. Simi-larity between methods can be seen as the intersection of the sets of instance variablesused by the methods.
Complexity: The larger the number of properties, the higher the complexity. It can bedefined as the cardinality of the set of properties of an object.
Scope: How far the influence of a property extends in the class hierarchy. The influence ofa property on descendant classes is indicated by the number of children of the classthat has the observed property. The influence from properties of ancestors of a classis indicated by how deeply into the inheritance tree the observed class is located.
Combination: The result of combining two or more classes to generate another class.
This is related in some programming languages to multiple inheritance, but also to
class hierarchy, and the result is that the obtained class has as its properties the
union of the properties of the component classes.
Using these definitions, which the authors define precisely using set-theoretical con-cepts, a number of object-oriented metrics are given (Table 3). Weighted methodsper class (wmc) is the sum of the complexities of all methods in a class. Chidamberand Kemerer purposely do not define how the complexity of a method is calculated,to avoid making this metric specific to any programming language. They suggest

15
that some traditional metric may be appropriate. The utility of this metric is thatit predicts the time and effort required to develop and maintain the class. Withincreased wmc, the potential impact on the children of the class is increased, whichmeans the class may have a greater impact on the quality of the program. Also, thepossibility of reusing the class is decreased due to specialisation.
Depth of inheritance tree (dit) is the maximum length of a path from the noderepresenting a class to the root. This metric relates to the scope of the class, andit measures how many ancestor classes may potentially affect the class under ob-servation. With increased dit, the complexity of the class is likely to increase asthere are more possible ancestors to inherit methods from. Also, a large overall dit
means more classes and methods and thus greater design complexity. The deepera particular class is in the hierarchy, the greater the potential reuse of inheritedmethods. All these factors have potential quality implications.
Number of children (noc) is the number of immediate descendants of the classunder observation. This also relates to the scope of the class, and measures howmany subclasses inherit the methods of the class. With increased noc, the reusethrough inheritance has increased, but the likelihood of subclassing misuse has alsoincreased. noc is also a measure of the potential influence the class has on theoverall design.
Coupling between object classes (cbo) is the count of the number of other classes towhich the class under observation is coupled. Coupling between two classes existswhen one of them uses methods or instance variables of the other. A lower cbo
means the class is more independent and has greater potential for reuse. Also, a highoverall cbo means greater sensitivity to changes, increased maintenance difficultyand greater need for testing.
Response for a class (rfc) is the number of methods that can potentially be invokedin response to a method being called from outside the object. Increased rfc meansthe class is more complex and testing and debugging is more complicated.
Lack of cohesion in methods (lcom) relates to the similarity between all methodpairs in the class. The similarity is determined by the number of instance variablesthat both methods use. Decreased lcom means the class is more cohesive, whichpromotes the desired trait of encapsulation. Increased lcom increases complexityand implies that the class should probably be split into two or more subclasses.
16
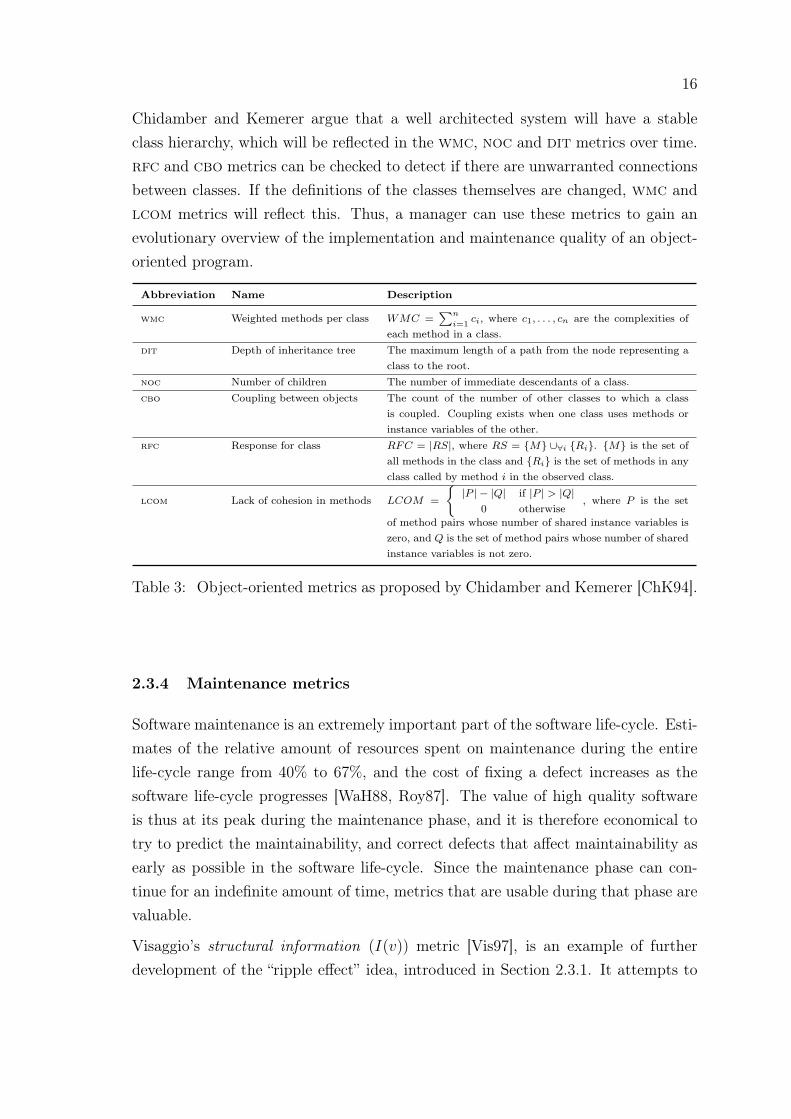
Chidamber and Kemerer argue that a well architected system will have a stableclass hierarchy, which will be reflected in the wmc, noc and dit metrics over time.rfc and cbo metrics can be checked to detect if there are unwarranted connectionsbetween classes. If the definitions of the classes themselves are changed, wmc andlcom metrics will reflect this. Thus, a manager can use these metrics to gain anevolutionary overview of the implementation and maintenance quality of an object-oriented program.
Abbreviation Name Description
wmc Weighted methods per class WMC =∑n
i=1ci, where c1, . . . , cn are the complexities of
each method in a class.dit Depth of inheritance tree The maximum length of a path from the node representing a
class to the root.noc Number of children The number of immediate descendants of a class.cbo Coupling between objects The count of the number of other classes to which a class
is coupled. Coupling exists when one class uses methods orinstance variables of the other.
rfc Response for class RFC = |RS|, where RS = {M} ∪∀i {Ri}. {M} is the set ofall methods in the class and {Ri} is the set of methods in anyclass called by method i in the observed class.
lcom Lack of cohesion in methods LCOM =
{|P | − |Q| if |P | > |Q|
0 otherwise, where P is the set
of method pairs whose number of shared instance variables iszero, and Q is the set of method pairs whose number of sharedinstance variables is not zero.
Table 3: Object-oriented metrics as proposed by Chidamber and Kemerer [ChK94].
2.3.4 Maintenance metrics
Software maintenance is an extremely important part of the software life-cycle. Esti-mates of the relative amount of resources spent on maintenance during the entirelife-cycle range from 40% to 67%, and the cost of fixing a defect increases as thesoftware life-cycle progresses [WaH88, Roy87]. The value of high quality softwareis thus at its peak during the maintenance phase, and it is therefore economical totry to predict the maintainability, and correct defects that affect maintainability asearly as possible in the software life-cycle. Since the maintenance phase can con-tinue for an indefinite amount of time, metrics that are usable during that phase arevaluable.
Visaggio’s structural information (I(v)) metric [Vis97], is an example of furtherdevelopment of the “ripple effect” idea, introduced in Section 2.3.1. It attempts to

17
connect decisions made in the requirements analysis, design and implementationphases of a software project. Visaggio constructs a dependency graph that showshow decisions in the analysis phase have resulted in design artefacts in the designphase, and how these in turn have resulted in specific parts of the implementation.The metric then measures how a change in one part of the system will affect otherparts. Visaggio relates this metric to the notion of quality of organisation in thesoftware.
Visaggio lists several advantages of this metric compared to what he calls “the com-mon complexity metrics” which are presumably code metrics such as those describedby Halstead and McCabe (Section 2.3.2). The metric has not been empirically vali-dated, and its biggest practical weakness is that the dependency graph cannot bebuilt automatically, because the necessary tools to produce machine-readable arte-facts in all stages of development are not commonly available. Such tools wouldhave to be used from the earliest point in the process, and could make the designwork more tedious and less flexible.
As another example of a metric model that predicts quality in the maintenance stage,Sharma and Jalote define stabilisation time, a metric that measures how long it takesfor a software product to reach a steady state of defect arrival frequency after it hasbeen installed [ShJ06]. They note that the failure rate often declines after softwareinstallation, and then stabilises at a certain level, after a certain time. Possiblecauses for this are that users learn to work around the defects, that configurationissues in new installations are resolved, and that user experimentation ceases aftersome time. This metric could be applied to foss, with proper adjustments to fiteach project.
In general, metrics for the maintenance phase are the same as those for other phases,but instead of taking single samples at the end of each development phase, regularsamples are taken and the rate of change is noted. Maintenance metrics can bethought of as software evolution metrics.
2.3.5 General metrics problems
One frequent problem with software metrics, which is accentuated in quality metrics,is that of incomplete data or missing samples. Chan et al. have applied statisticalmethods to such data in an effort to reduce the impact of this missing data. Theyused an imputation method to fill in missing data, which proved successful in their
18
case study. Also, they have tested a formal method to verify the statistical sig-nificance of predictor metrics on the target metrics and to eliminate unnecessarycategories in categorical predictor metrics [Cha06].
Another problem, prominently present in foss development, is the lack of softwareengineering experience, easily understandable metrics, and general understanding ofquality models. This leads to an inability to comprehend and make use of qualityimprovement methods, or to participate in projects where such methods are used.Conversely, foss projects already using such methods have a higher barrier of entryand may fail to attract the needed number of programmers.
Houdek and Kempter propose a method to address this issue in any software or-ganisation [HoK97]. Their aim is to explore how experience can be collected, storedand disseminated without distortion – written material is often ambiguous and in-correctly interpreted. They wish to use the findings for quality improvement. Theyobserve that the ability to understand why a software project has succeeded is keyto a repeatable process. They propose to use a systematic, scientific method to gaininsight into the process and then package this insight for reuse in later projects.
The scientific method of systematic information collection is an important step, andits primary objective is to describe the methods involved. However, Houdek andKempter emphasise that the insights gained through observation must be dissemi-nated or packaged in a reusable form. With this in mind, the authors propose theuse of patterns, pairs of problem and solution that can be applied, with some modi-fication, to a new problem. Similarly to design patterns, which guide the design andimplementation of software, quality patterns would be employed to guide qualityassurance.
Another problem is that statistics and machine learning can be very challenging tointerpret. The methods produce results, but the underlying model is often incom-prehensible to humans. Developing ways to visualise metrics can help observers whodo not have the time or knowledge to interpret complex, number-heavy statisticalmodels to extract the underlying rules. Also, if data exploration is desired, thechoice of one particular model may be premature and visual presentation beneficial.
Langelier et al. have experimented with mapping metrics to three-dimensional visualobjects. They mapped the size, cohesion and coherence of classes in object-orientedprograms to the size, colour and rotation of three-dimensional cubes and arrangedthem together to form a map of the program [Lan05]. This allows the observer togain an overview of the software, and assists in choosing more specific features forcloser observation.
19
Liu et al. emphasise that practical exercise in using quality prediction models isimportant in education [Liu07]. They describe an experiment set-up with prepareddata that can be used to train students in the use of quality metrics. There is anabundance of foss documentation that describes the use of software and partici-pation in projects in a how-to or pedagogical fashion, but we have not found anysuch document regarding foss quality. This is an area where foss could improvesignificantly.
3 Quality in the context of Free and Open Source
Software
In the philosophical and reflective works that define foss, the motivation of practi-tioners is idealistic, regardless of whether their primary focus is ethics or economics.This value system concerns the potential use and re-use of the software, not its func-tional aspects. At the same time, other foss advocates often cite higher quality intechnical form as the primary practical benefit. Defects, or bugs, will be eliminatedbecause of the sheer number of people looking at them – this is the reasoning oftenpresented. Peer review could be considered the primary method of quality assurancein foss projects. It somewhat resembles both the academic notion of peer review[Mic05a] and a formal technical review of program code, but may take many formsin practice [MäM06].
However, simply labelling a piece of software “foss” does not increase its technicalquality. In fact, most foss projects struggle with the same kinds of quality andprocess issues as most traditional software projects. Controlling functionality, effi-ciency, reliability, usability, maintainability, and portability of software is difficult.The challenge to deliver a product on schedule and according to specifications is notautomatically met by placing the source code in a publicly accessible repository.
In fact, foss may be completely overlooking certain aspects of software qualitysimply because the notion of quality has not been defined for foss. Developersmay be eager to solve their own problems and cater to their own needs but believethat all others are able or inclined to do the same. Quality is often equated withthe number of discovered defects that have been removed, and it is believed that avast number of random tests will efficiently remove all defects. Similarly, it is oftensaid that foss will automatically result in more secure software [Gre03] – again

20
assuming that source code availability will ensure this. Not all advocates emphasisethese aspects of quality; some focus on non-technical benefits instead. But if foss
is to be a repeatable practice, more insight into the reasons for success and failureis needed.
3.1 The foss mind set: catalyst or obstacle?
We observe that foss projects can quickly adapt and change their working methods,but that they are surprisingly resistant to certain types of change. Also, foss
developers usually have a very specific picture of themselves and their projects.Does this support or undermine quality assurance, and how do foss projects lendthemselves to quality assessment? We will explore these questions by presenting adetailed account of what foss development is or can be, and what it is not.
In an analysis of exploratory interviews with seven foss developers, Michlmayr etal. present the mind set of the developers and describe some key characteristics offoss projects, such as formation, membership, and work processes [Mic05a]. Theytie the analysis into a question of quality: what is the current understanding ofquality in foss projects, and how could these projects improve quality in both theirwork processes and in the final software deliverable?
Michlmayr et al. draw attention to two foss project characteristics that have impor-tant implications on quality assurance: their distributed nature, and the fact thatthe participants are usually unpaid volunteers. Project-level practices that are com-monly referred to as human resource management are difficult to achieve, since theparticipants cannot easily be held accountable for their involvement in the project.For instance, it is difficult to delegate tasks that no-one volunteers to perform. Theproject can only do things that a contributor is prepared to carry out. In a foss
project with paid employees, the mechanism for affecting motivation is different, butthe topic of how to motivate participants is different from the question of whetherthe work is performed or not.
A common pattern that Michlmayr et al. present as background to their researchis that a multitude of foss projects are abandoned early, and only relatively fewhave a large number of participants. Michlmayr et al. note that “more interestingprojects with a higher potential will probably attract a larger number of volunteers”but also that project failures might be related to lacking project management skills[Mic05a]. Thus, it appears that a project needs both skilled management and a“critical mass” of contributors to be sustainable.
21
Although only including comments from seven developers, the interviews appear tohave captured some of the beliefs that are commonly found among foss developers.The interviewees were asked questions about quality management in foss and non-foss projects, and otherwise the interviews were allowed to take a free form. Thus,the interviews attempted to capture a subjective or intuitive perception.
The interviewees presented the opinion that foss has a “higher potential to achievegreater quality” and “can react faster to critical issues” such as security flaws, com-pared to non-foss software. This is attributed to a number of factors such as morefeedback in the form of bug reports and feature requests, higher motivation becausecontributors participate by their own free choice, and chance of attracting betterhuman resources because the projects are distributed in nature and can draw froma greater pool of knowledge and expertise. The authors note that it is difficult tocompare foss software with non-foss software, because there is seldom access tosource code and defect reports from the latter. The authors do not report on theinterviewees’ overall software engineering experience.
The authors note very varied practices among different foss projects. For instance,the infrastructure varies: projects use many different tools for defect tracking, com-munication, and source code storage and versioning. Some projects have rigorousrequirements that must be fulfilled before committing new or changed source codeinto the source code repository, while others have more relaxed requirements. Someprojects allow nearly anyone to commit directly into the repository, some have entryrequirements and others allow only a small, fixed number of developers to commitwhile other contributors have to submit patches for review and possible later inclu-sion. Naturally, this is also affected by the capabilities of the source code repositorysystem.
Michlmayr et al. note a number of process-level practices that differ between projects.Projects can differ in the way they allow new participants to join, what requirementsthey impose upon releasing a new version of their software, how they create andmanage different versions or branches during development and after release, howpeer review is performed, if at all, how testing is organized, and finally, what overallprovisions the project has in place for quality assurance.
Furthermore, different kinds of projects have different kinds of goals and may re-quire different kinds of leadership [Nak02]. Nakakoji et al. have explored evolutionpatterns in foss systems and communities, and draw attention to three types offoss projects. Exploration-oriented projects wish to share innovation and know-
22
ledge and have an individual, centralised style of control. Utility-oriented projectsaim to satisfy individual needs and have a decentralised style of control. Service-oriented projects attempt to provide a stable service and have a central governingbody with a small number of members.
3.1.1 How foss compares to process models
It is easy to think that foss is a process model. It would fit conveniently besidetraditional process models, such as the waterfall model, and iterative or change-embracing models, such as Agile software development models. While there may besimilarities, and while foss may apply some of the same steps and procedures, thereis too much variance in foss projects to support the claim that all foss projectswould share a common process model or meta-model. Foss projects may employany process model, or none at all. However, foss does have a direct impact onthe process employed by a project, whether or not that process is consciously orrigorously defined.
Some of the main characteristics of foss are posed as differences compared to tra-ditional, industrial software development. Mockus et al. list a number of such differ-ences [Moc02]. Foss is built by potentially large numbers of participants, rangingin the hundreds or thousands. Work is not assigned, participants choose their ownwork. There is no explicit system-level design, or even detailed design, no projectplan, schedule, or list of deliverables.
However, Mockus et al. may not have looked carefully enough. They observe thatthe chance of success increases if developers use the software they write. If so,the requirements and design exists privately with the developer, although it is notcommunicated. In other cases, and we believe this is increasingly common, foss
projects do have plans, schedules and other project-level documentation [Mic05c],but they are part of a continuous design effort that runs in parallel with the rest ofdevelopment.
Mockus et al. also explicitly distinguish “pure” foss projects, which they define asthose that have no significant commercial involvement. This is a highly problematiclabel, and it is not clear what its utility is. First, commercial involvement does notappear to select the development methodology or process, and second, it may beimpossible to determine which foss projects do have a commercial involvement andwhich do not – individual developers may benefit financially although the project

23
does not charge fees for the software. Third, the notion of significant commercialinvolvement would have to be based on the real impact of the involvement, whichMockus et al. do not define.
In our view, the foss process can be described as the emergent behaviour of a largenumber of parallel iterations, varying but short in size. Nearly all foss activityconsists of this kind of parallel iteration, whether it is design, code writing, testing,documentation writing, debugging, or something else. All the phases of more clear-cut models occur more or less at once, similarly to the Unified Software DevelopmentProcess, but the iterations can be significantly shorter. It is not uncommon tohave several iterations occur per day. In large projects with many participants,the iterations frequently become shorter and more numerous, while smaller projectsprogress at a slower pace.
Each individual iteration includes only a small subset of the project participants,often just one or two developers, while the others are observers to that iteration.This is supported by the tools that foss has developed for its own work. Mailinglists and on-line chat are used for the inception phase of each micro-iteration. Col-laborative on-line editing tools, such as the wiki, are used to create documentationand plans. Recent version control tools support completely distributed work andallow each individual developer to handle a complete, separate branch of the entireproject source code – the work process ensures that changes are shared and appliedefficiently. These findings are similar to those of Huntley, who observes that whilethe individual developer’s actions may appear chaotic, the overall learning processis fairly rigorous with specialised tools to support each stage [Hun03].
Huntley describes the foss method as a continuous organisational learning pro-cess, “where the development starts with a rudimentary but useful implementation,which is then iteratively improved as the team learns about use cases, designs, andcoding techniques through experiment and user feedback” [Hun03]. However, notall projects are learning efforts, as Nakakoji et al. demonstrated [Nak02].
We note that the previous observations correspond remarkably well with the insightspresented by Royce in his description of large software system development [Roy87].It is ironic that the most valuable part of his contribution, the need for flexibilityin the process, has been carried forward by a working method that has generallyeschewed process as a concept.
When observing foss work, the overall process can be impossible to distinguish,because participants are constantly adapting and optimising for current require-ments. Therefore, in Michlmayr’s definition of process, what is described is actually

24
quite technical and may be characterised as the working methods of the projectrather than a high-level, managerial process. Nevertheless, to apply the insightsof Schneidewind, understanding that foss views process very differently than tra-ditional software engineering is vital when asking both when and why to measurequality [Sch02]. We propose that quality in foss projects should be measured atthe level of each micro-iteration as well as by an overall, separate quality assuranceprocess.
3.1.2 Process maturity and success
Process maturity is often cited as a prerequisite for repeatable quality. Like Polančičet al., Michlmayr hypothesises that there is a link between process maturity and thesuccess of a foss project [Pol04, Mic05c]. Michlmayr observes that foss projectshave an important volunteer component among contributors, and that they areusually globally distributed. This leads to a different set of motivations and adifferent value system than that of traditional software organisations, and a re-evaluation of traditional software engineering insights in a foss context is required.
Michlmayr uses the amount of software downloads as an indicator of success. It canthus be inferred that this view of success relates to popularity, and that popularitycan be an indirect indicator of quality. However, a large part of available foss
projects were started as mere experiments or as hobby activities, where success isnot necessarily defined as popularity, or at all.
Michlmayr’s methodology does correctly observe that comparison can only be mean-ingful if the compared projects are similar in all aspects except those whose relationis under scrutiny. He compares successful projects with unsuccessful ones and at-tempts to detect whether the process maturity differs in the two sets. Michlmayrfinds that the maturity of the process employed in foss projects has an impact onthe success of the project. However, the nature of this relationship is not inves-tigated and Michlmayr suggests thorough code quality comparison and qualitativeevaluation of release strategies as further research.
Crowston et al. have examined the work practices – effectively, the developmentprocess – of foss projects from the perspective of organisational theory [Cro04].They describe a hypothetical, layered team structure in foss projects. Mockus etal. have made similar findings in their study of Apache and Mozilla [Moc02].
25
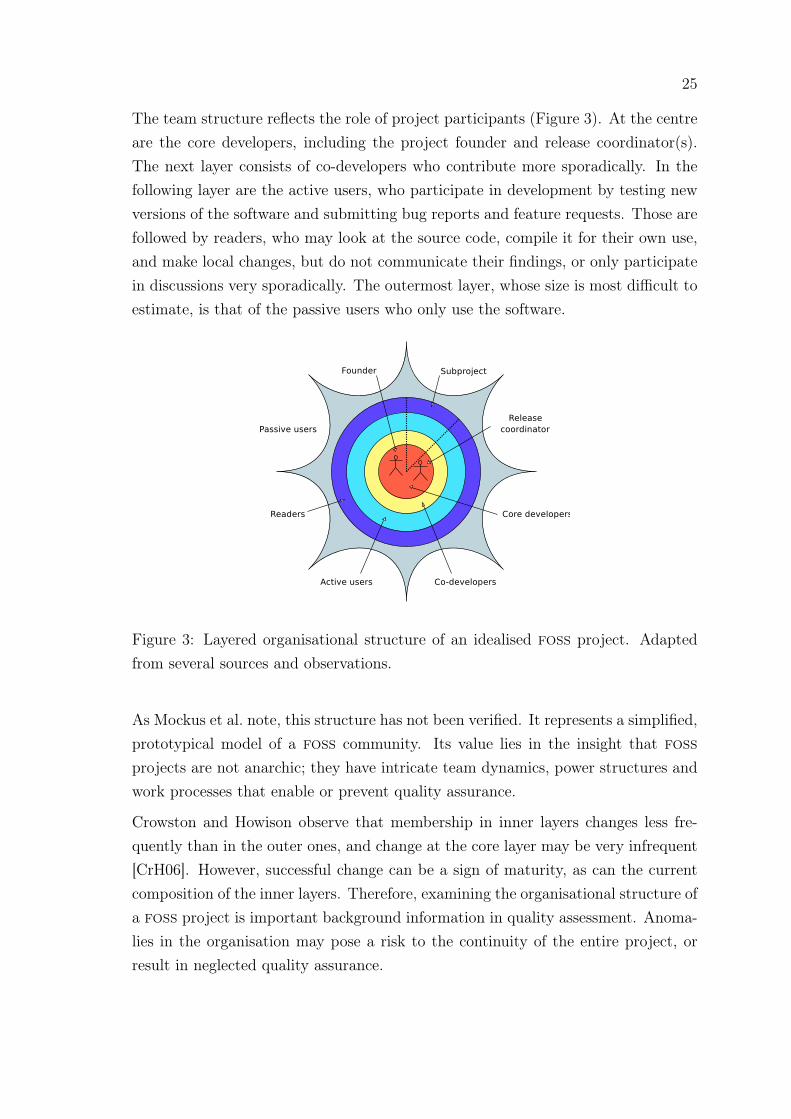
The team structure reflects the role of project participants (Figure 3). At the centreare the core developers, including the project founder and release coordinator(s).The next layer consists of co-developers who contribute more sporadically. In thefollowing layer are the active users, who participate in development by testing newversions of the software and submitting bug reports and feature requests. Those arefollowed by readers, who may look at the source code, compile it for their own use,and make local changes, but do not communicate their findings, or only participatein discussions very sporadically. The outermost layer, whose size is most difficult toestimate, is that of the passive users who only use the software.
Figure 3: Layered organisational structure of an idealised foss project. Adaptedfrom several sources and observations.
As Mockus et al. note, this structure has not been verified. It represents a simplified,prototypical model of a foss community. Its value lies in the insight that foss
projects are not anarchic; they have intricate team dynamics, power structures andwork processes that enable or prevent quality assurance.
Crowston and Howison observe that membership in inner layers changes less fre-quently than in the outer ones, and change at the core layer may be very infrequent[CrH06]. However, successful change can be a sign of maturity, as can the currentcomposition of the inner layers. Therefore, examining the organisational structure ofa foss project is important background information in quality assessment. Anoma-lies in the organisation may pose a risk to the continuity of the entire project, orresult in neglected quality assurance.
26
3.1.3 Openness and reliability
Van Wendel de Joode and de Bruijne have explored the relationship between open-ness and reliability [WeB06]. The authors conducted a small survey to explore therelationship between source code access and defect correction. Respondents agreedthat there is a relationship, but when asked to give further explanation, they con-cluded that “most users do not analyse the source code or try to report and solvebugs”, that “half of the bugs are resolved by only one person” and “the ten most ac-tive bug reporters are responsible for 85% of all bug reports”. The authors concludethat access does not guarantee quality.
Using organisational theories, the authors attempt to gain some insight into therelationship between openness and reliability. One theory, normal accident theory,states in part that if the elite in a group is unaffected by quality failure, thenresources will not be allocated toward ensuring safety and reliability. It also statesthat unencumbered access to information within the organisation is vital, as it allowsthe organisation to learn from mistakes. Another theory, high reliability theory,states that certain organisations have nurtured conditions where reliability can bemaintained despite the complexity of the systems managed. A strong presence ofexternal, stake-holding observers is one of these conditions.
Drawing from these theories, van Wendel de Joode and de Bruijne formulate threehypotheses on openness and reliability in foss communities. First, corresponding tothe elite: the bigger the percentage of developers who actually use the software theydevelop, the more reliable the software. Second, corresponding to organisationallearning: the more transparent the flow of information, the more reliable the soft-ware. Third, corresponding to external observers: the more popular the software,the more reliable it is [WeB06]. These hypotheses, while certainly not empiricallyproven, correspond well with what can be seen in real foss projects.
3.2 Previous work and case studies
A quick glance at some random foss projects may lead to conclusions that there is noplanning, requirements, quality goals, or project costs involved. Deeper knowledge ofseveral foss projects reveals that thought is given to many complex quality-relatedquestions, and that significant amounts of time and money have been invested infoss. However, many projects have not explicitly taken all the possible steps tocorrect their quality issues.
27
Furthermore, obtaining samples from foss projects requires deep understanding ofthe tools with which foss development is carried out. Enormous amounts of datais generated and stored in a wide variety of formats and in places that are not foundwithout some technical knowledge. For instance, while some research claims it isimpossible to know the number of developers involved in a particular foss project,this information is actually available to a great extent, for example in the packagedatabase of the Debian gnu/Linux distribution [Rob06] and in files accompanyingthe source code. It is important to review existing foss quality research and studyfoss projects in detail to gain an understanding of what information is available.
3.2.1 Growth, evolution and structural change
Godfrey and Tu have written a series of papers concerning the evolution of foss.They employ mostly statistical measures to examine the well-known Linux kernelproject from a source code perspective. They also draw on observations of foss
development principles and philosophy in general, and combine them with the mea-surements to explain certain behaviour in the Linux project [GoT00, GoT01].
Lehman’s laws of software evolution state, among other things, that systems growthleads to increasing difficulty in adding new code unless explicit steps are takento reorganize the overall design [Leh97]. However, Godfrey and Tu find that theevolution of the Linux kernel has seen a dramatic increase in size over a period ofsix years, contradicting Lehman’s hypothesis [GoT00]. The authors attribute thisto a number of factors, the most important being that the Linux kernel source codeconsists mostly of device driver code, and that the actual core is relatively small.
Further, Godfrey and Tu observe related work indicating that a top-level, full viewof the modules or subsystems of a large code base is not enough to detect theimportant evolutionary behaviour of the software process, and that a more detailedview of individual parts is needed. In their own work, it was important to detect thedistinction between the core code of Linux, and the relatively large body of devicedriver code. When viewed separately, different conclusions could be drawn aboutthe kernel compared to an overall view.
The authors compared the overall size of the source code and the size of the differ-ent subsystem modules in different versions of the Linux kernel over time. In otherwords, they tracked the evolution of different branches of the kernel, and the evolu-tion of the different subsystems. They also used external knowledge of features and
28
changes that the kernel developers had introduced at different points in time, suchas the porting of Linux to several different processor architectures. The authors didnot expand their research beyond loc analysis.
Although Godfrey and Tu present statistical evidence that seems to contradictLehman’s law, they fail to apply their own conclusion about the need for a moredetailed view to their own claim of contradiction. Since the Linux project is dividedinto several parallel projects, each maintaining a particular subsystem, the projectas a whole does not have to work with the entire code base at once. It appears thatLehman’s explicit steps have indeed been taken in the Linux project to organise theoverall design of the system as well as that of the working process in a manner thatsupports the current size and complexity of the system. Godfrey and Tu may havebecome blinded by the surprise of the total loc evolution curve. In any case, laterstudies have found that the super-linear growth has at least not been permanent.
Izurieta and Bieman have repeated some aspects of Godfrey’s and Tu’s study andalso applied the analysis to the freebsd kernel [IzB06]. In particular, they foundthat the claim of super-linear growth in Linux had no support. Both Linux andfreebsd displayed sub-linear or, at most, linear growth, which is what previousstudies by Lehman on industrially produced software have shown [Leh97].
There are several important methodological aspects of Izurieta’s and Bieman’s study.They used the existing project directory structure to divide the project into modulesfor individual study, as suggested by Godfrey and Tu, to eliminate observer bias.They used simply physical loc, and measured program size by loc. They alsoprovided an interesting overview of the different released versions of freebsd. Theirstudy concentrates only on the released versions of the software, and thus fails tocapture the impact of ongoing work.
3.2.2 Mining public repositories
Since our goal is to automate the collection and analysis of metric data as far aspossible, we must consider the practical possibilities and difficulty of data mining inpublicly accessible data repositories. Koch and Schneider have presented a method-ology similar to that of Godfrey and Tu. Their metrics and analysis displays awider variety, taking into account the continuous development process that takesplace in the source code repository and project discussion lists. They apply theirmethodology to the gnome project [KoS00].

29
Koch and Schneider use a more rigorous approach than Godfrey and Tu, first gain-ing an understanding of the relationships between the different pieces of data bymodelling them using an entity-relationship diagram. The model encompasses thepeople involved in the process, the discussion guiding it, and the actual source codeproduced. The model is based on observation of discussion list activity and activitywithin the gnome cvs source code repository.
Koch’s and Schneider’s methodology displays important characteristics that allowscapturing a number of defining aspects of foss development. First, the samplegranularity is much smaller than in Godfrey and Tu. For source code, the sampleis a single cvs commit action, instead of an entire release. Second, each action isassociated with the person who performs it. Godfrey and Tu have no concept of actorin their model, whereas Koch and Schneider demonstrate that it is an importantfactor in the foss project. Third, Koch and Schneider include the discussion listsin the model, and although they do not analyse the discussion contents, they dofind temporal correlation between discussion list activity and cvs activity. Fourth,Koch and Schneider apply time-line analysis throughout their methodology. Eachaction is placed on a time-line with very fine granularity, allowing the authors tomake effort estimations and track progress on a very accurate scale, among otherthings.
In this work, loc remains the primary metric to describe the size of source code andthe size of changes to source code. The authors describe the different metrics whereloc is used: loc added, loc deleted and loc changed, the last of which is definedas the difference between the first and the second during a given time period. Theauthors use a simple definition of loc, counting physical lines regardless of theircontents.
For the discussion lists, the authors define the metric number of postings. Theauthors then go on to define the checkin metric, and finally proceed to define derivedmetrics such as time spent on the project, programmer activity, loc added per checkinand loc added per hour.
Using these metrics and the correlations of the data model, the authors make anumber of observations. They observe that the contributions to source code for eachprogrammer follows a power law: a majority of programmers contribute only a smallamount of code, while the bulk is committed by a small core team. Further, theyattempt to define certain correlation patterns that concern the amount of changein the code, the tendency of active programmers to use smaller or larger commit

30
chunks, the difference in programming style and the connection between long projectmembership and amount of contribution.
The authors observe similar patterns in the discussion lists: a small number of pro-grammers contribute to most discussion list postings, while the majority of posterscontribute quite infrequently. Correlating postings with loc added, the authorsconclude that programmers who contribute more code are also more active in thediscussion lists. However, the authors could not find a correlation between the totalamount of postings and the total amount of added code within a given time interval.
The authors derive a number of interesting trend graphs. For example, they at-tempt to detect whether a particular module of the gnome project is undergoingan acceleration in development, or if it is nearing completion and development isslowing down.
The authors confirm that a higher number of contributors lead to more output.However, they note that the organisational structures may not support more thana given number of participants. When this saturation point is reached, an or-ganisational change is needed to sustain output growth, an observation that isconsistent with the findings presented by Mockus et al. and Dinh-Trong and Bie-man [Moc02, DiB04, DiB05].
Asklund and Bendix have successfully captured the state of the art in foss config-uration management in 2002 [AsB02]. They note that traditionally, configurationmanagement has been a manager activity, where the stages of the software develop-ment process have their defined activities within a configuration management tool.These activities include configuration identification, where the product structureis determined; configuration control, where changes to a configuration item is per-formed; configuration status accounting, where the status of each change is recordedand deviations from the specified basic configurations is noted; and configurationaudits, where configuration items are checked for conformance with their configura-tion, such as performance characteristics.
In foss however, configuration management is a developer activity, and includesversion control, build management, configuration selection, workspace management,concurrency control, change management and release management. These are socentral to foss development that it is only in the most special cases that theyare not used in some form. While Asklund and Bendix make several assumptionsand conclusions that are no longer valid in a modern foss environment, they havecorrectly identified configuration management as a crucial enabler for the distributed

31
work method common in foss. The important activity happens within the sourcecode repository, which is an increasingly distributed environment of which eachdeveloper holds a copy. To properly understand the decisions behind the sourcecode changes, researchers must correlate mailing list and other on-line discussionactivity with actual code commits. Asklund and Bendix correctly emphasize theimportance of open communication to coordinate and plan the programming.
Massey reports challenges when obtaining data from foss version control systems[Mas05]. Extraction of data seems simple, but in practice it is not. A particularproblem is that foss projects have periodically restarted their version control, eitherdue to problems in the version control software, because of project forks, or becausethe project has moved to a newer version control system. However, we note that it isnot always necessary to obtain or analyse the entire version control history. Instead,intelligently selecting a certain period of time can be sufficient and useful to explainimportant events in the history of a project, as noted by Massey. Furthermore,analysing and recording the current activity could yield usable results in a relativelyshort time. Models based on historical data may be invalid if the project has changedits production process.
3.2.3 Empirical tests of statistical quality models
Zhou and Davis have empirically tested a software reliability model on eight foss
projects [ZhD05]. They confirm that the defect arrival rate follows a Weibull distri-bution, but find no support that it would follow the more specific Rayleigh distribu-tion commonly found by the industry in non-foss software. They suggest that eachfoss project may require its own Weibull shape parameter, and that the parametermay change over time depending on several factors. They conclude that the defectarrival rate stabilises at a low level if the project continues for long enough. Simi-lar results are reported by Tamura and Yamada, who emphasise that interactionbetween software components should be taken into account [TaY05]. Also similaris the stabilisation time metric proposed by Sharma and Jalote, as described inSection 2.3.4 [ShJ06].
The significance and utility of these findings is that stabilisation of the defect arrivalrate has been used in the industry as a sign of reliability. When the curve stabilises,testing can cease and the software can be released. Adapting this to a foss envi-ronment could be an important tool for measuring overall quality and aid in releasemanagement.
32
Li et al. also attempt to fit a Weibull model to development defect arrival, examiningthe openbsd project [Li05]. Their results show that it is not possible to obtainresults before most of the defects have occurred, meaning that there is insufficientdata to fit the model. Thus, they conclude that this approach is infeasible, andturn to metrics-based field defect prediction instead. They find the most importantpredictor to be the number of messages to the technical mailing list during thedevelopment period. The lack of causal information suggests that this may be acase of confusing cause and effect – it is not the preceding discussion that createsthe defects; it is the testing and search for the defect that causes the discussion,which in turn causes the defect report to be filed. Nevertheless, the increase indiscussion may indicate that the project does perform active quality assurance.
Phadke and Allen have made similar experiments, and conclude that quality mo-delling is viable for predicting modules with a high risk of defects [PhA05]. Theycompare logistic regression and decision trees, and while both methods do performcorrect classification in some cases, neither produce satisfactory results over theirentire data set.
Dick and Sadia argue that parametric statistical models are not suitable for accuratequality prediction [DiS06]. As there is no conclusive theory that maps softwaremetrics to software defect rates, research in this area is reduced to a trial-and-errorsearch through an infinite space of models. Instead, useful results could be achievedby using machine learning. At the very minimum, managers could benefit from abinary decision about the expected quality of a code unit – that it needs or does notneed additional effort. They also note that the lack of large data sets with manysoftware metrics and defect data included is problematic, but in foss projects, theseitems are available.
The authors further note that no quality assessment process or metrics currentlyexist for foss, but they do not state why or how it would be different from non-foss. They collect a data set from the Mozilla project, and then analyse it usingfuzzy clustering algorithms. They conclude that their method was able to identifygroups of modules with a higher defect density than traditional models, yielding abasis for a useful tool in quality assurance.
33
3.2.4 Object-oriented metrics for foss
Gyimóthy et al. have validated a number of object-oriented metrics for fault pre-diction on foss projects [Gyi05]. The analyses used to validate the metrics wereregression analysis, logistic regression, and machine learning. All methods yieldedsimilar results and thus they should have high validity according to the authors.They were able to validate the wmc, dit, rfc, cbo, lcom, lcomn, and loc met-rics as valid predictors of future faults. The best single predictor was cbo, but loc
also performed well. dit and noc metrics were unsuitable for fault prediction.
Studying object-oriented programs is not without complication. Some of the object-oriented languages widely in use, such as c++ and Java, provide some features ofgeneric programming. Briefly, this allows the creation of classes that are genericwith respect to the objects they can interact with. The compiler, preprocessor orvirtual machine will instantiate versions of these template classes for each class thatthe template class will interact with. This poses a problem for analysing code,because the class hierarchy, and thus the program architecture, is not the samewhen analysing the source code and the code that is actually run. Also, programarchitecture may be very hard to recreate without duplicating the operation of thebuild system.
Gyimóthy et al. used a data-collecting script as a wrapper for the build tools andwere thus able to extract information from source code that was generated duringthe build. Compiler wrapping was used previously by the same authors to detectfault-proneness in the Mozilla suite [Fer04]. The authors describe the technique andtheir overall fact extraction process in detail.
The process was carried out using Columbus, a reverse engineering framework, andconsists of five steps (Figure 4). The first step, acquiring project and configurationinformation, is particularly problematic since the automatic actions of the buildsystem might produce code that should be analysed, but escapes analysis because itis only available during the build. This is in contrast to Robles et al., who explicitlyavoid counting automatically generated code, presumably because of the tool theyused [Rob06].
Ferenc et al. redirected calls normally made to the compiler and other build pro-grams to a wrapper script. This script behaved externally exactly like the originalprogram, accepting the same input and parameters and producing the same outputand return value. It invoked the real program with the original parameters, but it
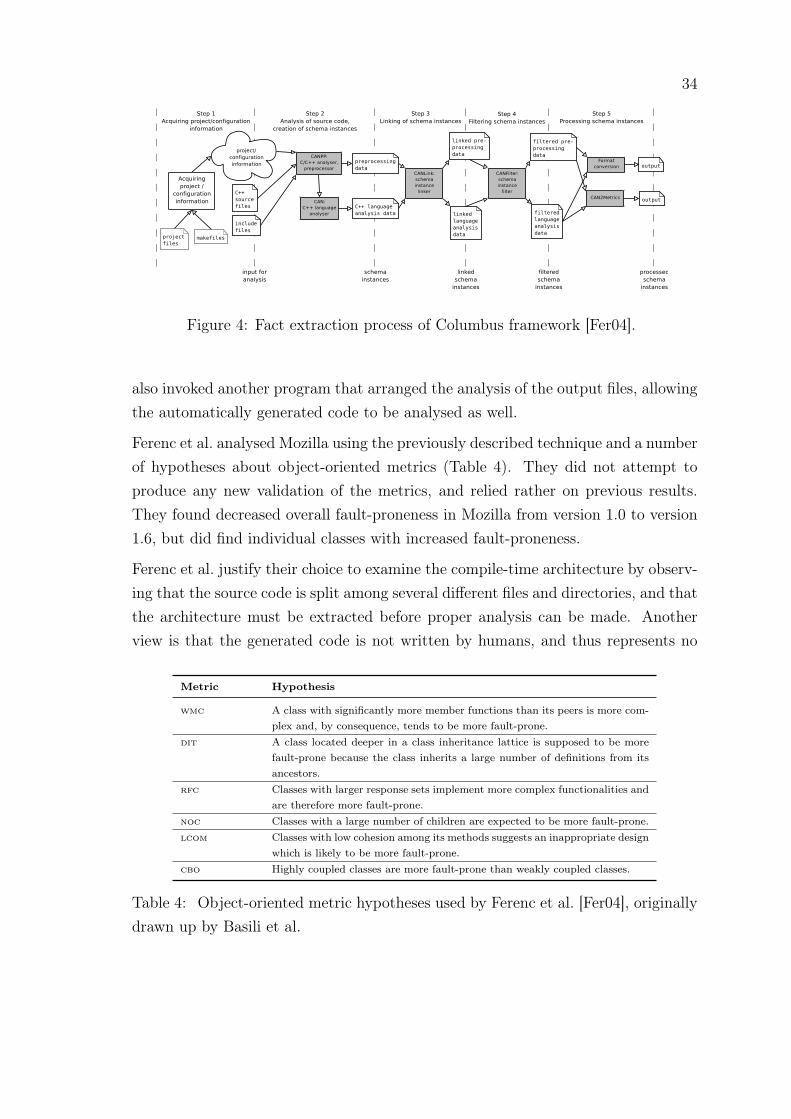
34
Figure 4: Fact extraction process of Columbus framework [Fer04].
also invoked another program that arranged the analysis of the output files, allowingthe automatically generated code to be analysed as well.
Ferenc et al. analysed Mozilla using the previously described technique and a numberof hypotheses about object-oriented metrics (Table 4). They did not attempt toproduce any new validation of the metrics, and relied rather on previous results.They found decreased overall fault-proneness in Mozilla from version 1.0 to version1.6, but did find individual classes with increased fault-proneness.
Ferenc et al. justify their choice to examine the compile-time architecture by observ-ing that the source code is split among several different files and directories, and thatthe architecture must be extracted before proper analysis can be made. Anotherview is that the generated code is not written by humans, and thus represents no
Metric Hypothesis
wmc A class with significantly more member functions than its peers is more com-plex and, by consequence, tends to be more fault-prone.
dit A class located deeper in a class inheritance lattice is supposed to be morefault-prone because the class inherits a large number of definitions from itsancestors.
rfc Classes with larger response sets implement more complex functionalities andare therefore more fault-prone.
noc Classes with a large number of children are expected to be more fault-prone.lcom Classes with low cohesion among its methods suggests an inappropriate design
which is likely to be more fault-prone.cbo Highly coupled classes are more fault-prone than weakly coupled classes.
Table 4: Object-oriented metric hypotheses used by Ferenc et al. [Fer04], originallydrawn up by Basili et al.
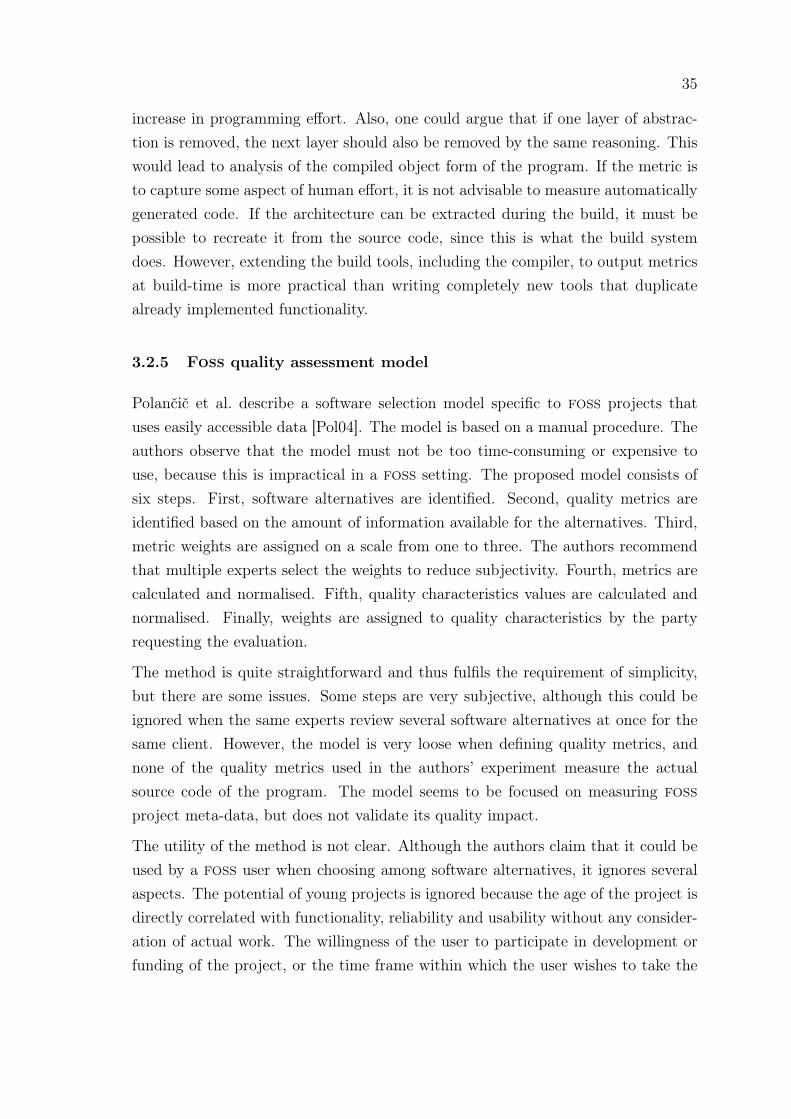
35
increase in programming effort. Also, one could argue that if one layer of abstrac-tion is removed, the next layer should also be removed by the same reasoning. Thiswould lead to analysis of the compiled object form of the program. If the metric isto capture some aspect of human effort, it is not advisable to measure automaticallygenerated code. If the architecture can be extracted during the build, it must bepossible to recreate it from the source code, since this is what the build systemdoes. However, extending the build tools, including the compiler, to output metricsat build-time is more practical than writing completely new tools that duplicatealready implemented functionality.
3.2.5 Foss quality assessment model
Polančič et al. describe a software selection model specific to foss projects thatuses easily accessible data [Pol04]. The model is based on a manual procedure. Theauthors observe that the model must not be too time-consuming or expensive touse, because this is impractical in a foss setting. The proposed model consists ofsix steps. First, software alternatives are identified. Second, quality metrics areidentified based on the amount of information available for the alternatives. Third,metric weights are assigned on a scale from one to three. The authors recommendthat multiple experts select the weights to reduce subjectivity. Fourth, metrics arecalculated and normalised. Fifth, quality characteristics values are calculated andnormalised. Finally, weights are assigned to quality characteristics by the partyrequesting the evaluation.
The method is quite straightforward and thus fulfils the requirement of simplicity,but there are some issues. Some steps are very subjective, although this could beignored when the same experts review several software alternatives at once for thesame client. However, the model is very loose when defining quality metrics, andnone of the quality metrics used in the authors’ experiment measure the actualsource code of the program. The model seems to be focused on measuring foss
project meta-data, but does not validate its quality impact.
The utility of the method is not clear. Although the authors claim that it could beused by a foss user when choosing among software alternatives, it ignores severalaspects. The potential of young projects is ignored because the age of the project isdirectly correlated with functionality, reliability and usability without any consider-ation of actual work. The willingness of the user to participate in development orfunding of the project, or the time frame within which the user wishes to take the

36
software into use are also relevant to such selection. Project meta-data might notbe usable at all except for comparing the project’s own view of itself against a moreobjective analysis.
4 Quality model for Free and Open Source Software
projects
There are many ways in which the quality of foss may be assessed and improved.Software consultants in the industry use simple methods, similar to the one describedby Polančič et al., to assess the quality of foss products before recommending themto customers [Pol04]. Integrators test the software using both static and dynamicmethods before and during deployment [MäM06]. These practices are likely to bevery specialised and the results are seldom reported back to foss projects. Qualityassurance that can occur both within the foss project itself, as well as externally,provides an opportunity for quality improvement instead of mere acceptance orrejection of the software as a whole. At best, the project incorporates continuousmeasurement and, as a result, grows more mature.
We shall focus on metrics as a primary means of obtaining information, and ourbase assumption is that certain process traits are key to continuous achievement ofquality. Our aim is not to describe a quality assurance process for some particularproduct, but rather to explore how quality factors in foss projects can be measuredand tracked generally. Our model is generalised to fit the most common traits inmost foss projects. Applications will reduce or adapt the model according to eachparticular case. Given a list of real requirements, this approach can be applied tomeasure the quality in a product for a particular user.
4.1 Preliminary description and project hypotheses
Wake and Henry have observed several quality studies and note that it is importantto examine changes in software from one version to the next, because maintenanceactivity results in structural complexity growth, a quality risk [WaH88]. They areinspired by the “ripple effect”, among other individual metrics, and attempt to cor-relate different metrics and quality observations.
37
In their experiment, Wake and Henry use a “code library” – probably an equivalentof a source code management or version control system – to track changes to thestudied software over time. The smallest unit of change in this system is a singleline of code. Additions as well as deletions of lines are stored, and a modification isidentified when a deleted line is followed directly by an added line.
Wake and Henry describe a number of additional facts that can be obtained fromthe code library. An important one is in which procedure each change has occurred.The authors note that by tabulating the additions, deletions, and number of changesfor each procedure, they obtain an indication of the maintenance activity that theprogram has gone trough during a specified period of time. This is an importantobservation for foss, where version control tools are frequently used. Wake andHenry use these facts as control data against which they verify the experiment.
The goal of the experiment was to predict how many lines of code were changedduring the maintenance phase, based on a number of metrics. In other words, changein lines of code is the dependent variable and the metric values are independentvariables in the statistical model. Wake and Henry chose to use multiple metricsbecause in initial tests with single metrics, the model was not accurate enough.Better accuracy was achieved using a multiple regression model with several metrics,but they still note that the selection of the metrics pose a challenge.
The authors compared and ranked several models, and then selected one for pre-sentation. They showed a prediction example where they consider two hypotheticalprocedures in the software. They calculate Halstead’s effort metric, McCabe’s cyclo-matic complexity and a metric further developed from information flow, informationflow with effort. The prediction equation directs the project manager toward one ofthe procedures where changes are likely to be required. Naturally, to act properlyon the indication, a programmer needs to understand the code and make the properchange. The method does not say what is wrong with the code.
However, version control systems include only the source code of the product. Thereare several other sources of information. Mockus et al. find that mailing lists, versioncontrol systems and bug tracking systems include important information about foss
projects [Moc02]. They pose seven hypotheses about foss projects, obtained byfirst observing the Apache project and then refining their findings by observingthe Mozilla project. Dinh-Trong and Bieman have checked the hypotheses againstfreebsd, and found support for some of them [DiB04, DiB05].
38
The first hypothesis is that foss projects will have a core of developers who controlthe code base, and will create approximately 80% or more of the new functionality.If this core group uses only informal means of coordinating their work, the groupwill be no larger than 10 to 15 people.
The second hypothesis is that if a project is so large that more than 10 to 15 peopleare required to complete 80% of the code in the desired time frame, then othermechanisms than informal arrangements will be required to coordinate the work.These mechanisms may include explicit development processes, individual or groupcode ownership, and required inspections.
The third hypothesis is that in successful foss projects, a group larger by an order ofmagnitude than the core will repair defects, and a group larger by yet another orderof magnitude will report problems. Taken together, these first three hypothesesimply that project structures will break down if the group grows large, and there isno effort of coordination. The composition of human resources in a foss project isa quality factor.
The fourth hypothesis concerns projects that have a strong core of developers butnever achieve large numbers of contributors beyond that core. It states that they willbe able to create new functionality, but will ultimately fail to become sustainablebecause their resources do not suffice to find and repair defects.
The fifth hypothesis is that defect density in foss releases will generally be lowerthan in commercial code that has only been feature-tested, that is, received a com-parable level of testing. The sixth hypothesis is that in successful foss projects,developers will also be users of the software. The seventh hypothesis is that foss
projects exhibit very rapid responses to customer problems.
4.2 Data sources
It is easy to fall into the trap of only analysing data that is easy to obtain, such asautomatically collected download statistics, or statistics produced by foss projectsthemselves. This may skew results as the easily obtainable data may highlight onlya single viewpoint. Similarly distorting is the practice of disconnecting artefactsand the people who produce them. Foss is an activity where discussion and codeinteract and are mixed. Discussion can frequently occur in or through the code, andvice versa [Bar05].

39
To avoid distortion and one-sided analysis, we include data sources from three prin-cipal information spaces (Table 5). In the discussion space, project participantsdiscuss and negotiate different aspects of the project using discussion lists and fora,as well as other means of communication. In the documentation space, the projectdocuments both its rules and practices and creates user documentation. Documen-tation external to the project exists in this space. In the implementation space, theactual software deliverable is produced, often using a network-accessible code repo-sitory or versioning system. Also, the implementation space is where users of thesoftware deploy the project deliverable. A similar taxonomy has been used in otherstudies [Bar05]. We will subsequently describe the three spaces in greater detail.
4.2.1 Discussion space sources
The discussion space of a project consists of mailing lists, web fora, newsgroupsand other real-time and non-real-time communications systems. In the discussionspace, participants contribute to a free flow of information. Individual participantscan be identified by their email address, name, or another identification token. Par-ticipation frequency, participation volume, the number of discussion threads theparticipant takes part in, and several other metrics can be calculated. It is possi-ble to connect the actions of a participant to actual work in the documentation orimplementation space, allowing observers to explore the relationships between thethree spaces.
In the discussion space, the flow of information is carried forward using several meth-ods. Barcellini et al. have compared a threading model and a quotation-based modeland concluded that the latter is better suited to analyse design-oriented discussions[Bar05]. These discussions can be evaluated to assess design quality. However, it iscomputationally intensive and hard to automate. A simpler alternative is to mea-sure only the frequency and volume of such discussions. This provides some insightinto how much design is performed overall.
4.2.2 Documentation space sources
In the documentation space, contributors can be identified for each artefact. Asproject-level documentation is revised over time, some contributors will have thestatus of initial author, while others will have an editorial role. This can be correlatedto participation in the discussion space and implementation space.
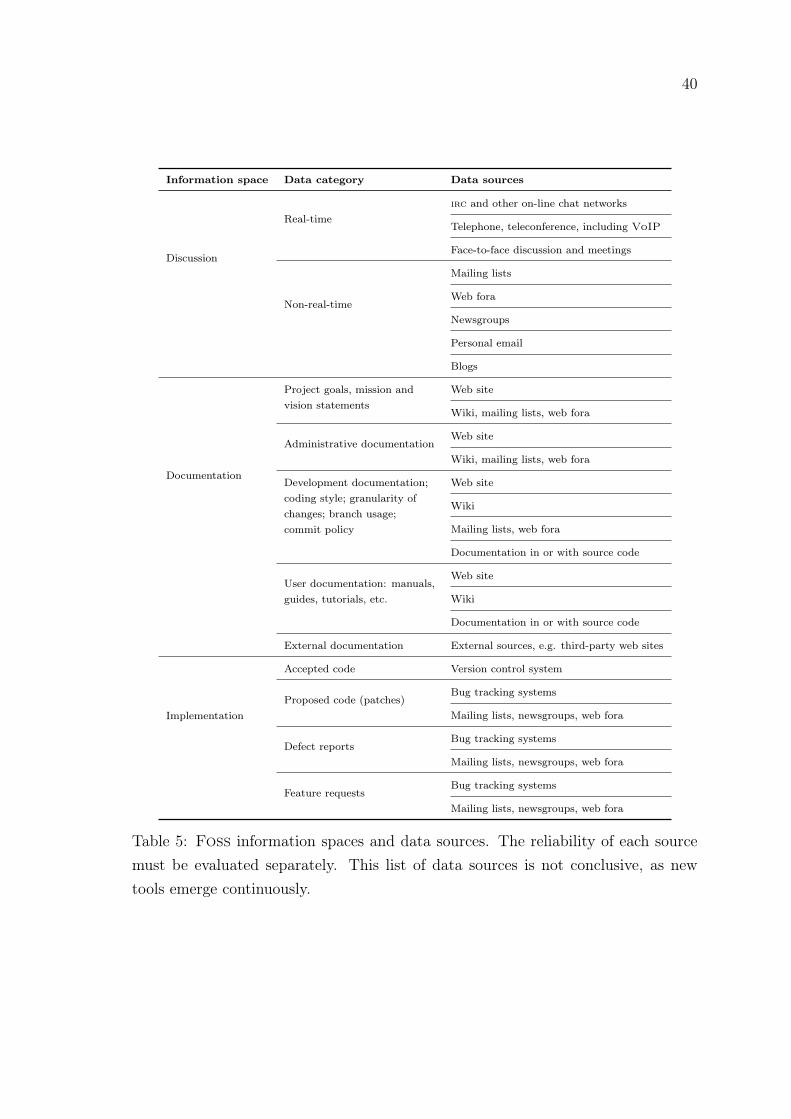
40
Information space Data category Data sources
Discussion
Real-timeirc and other on-line chat networks
Telephone, teleconference, including VoIP
Face-to-face discussion and meetings
Non-real-time
Mailing lists
Web fora
Newsgroups
Personal email
Blogs
Documentation
Project goals, mission andvision statements
Web site
Wiki, mailing lists, web fora
Administrative documentationWeb site
Wiki, mailing lists, web fora
Development documentation;coding style; granularity ofchanges; branch usage;commit policy
Web site
Wiki
Mailing lists, web fora
Documentation in or with source code
User documentation: manuals,guides, tutorials, etc.
Web site
Wiki
Documentation in or with source code
External documentation External sources, e.g. third-party web sites
Implementation
Accepted code Version control system
Proposed code (patches)Bug tracking systems
Mailing lists, newsgroups, web fora
Defect reportsBug tracking systems
Mailing lists, newsgroups, web fora
Feature requestsBug tracking systems
Mailing lists, newsgroups, web fora
Table 5: Foss information spaces and data sources. The reliability of each sourcemust be evaluated separately. This list of data sources is not conclusive, as newtools emerge continuously.
41
Furthermore, the availability and type of project-level and development documenta-tion can affect the sustainability and quality of the project. For example, completelack of a coding style decision could lead to inconsistent code, which then becomesdifficult to maintain over time as new developers enter the project. On the otherhand, lack of written documentation could be compensated in the discussion space,as new contributors learn how the project works by direct feedback or by lookingat previously given feedback. In that sense, some of the discussion space artefactsmay transfer into the documentation space. Conformance to existing documentationcan be assessed by comparison with the actual implementation. If the documenta-tion is not followed, this could be due to lack of agreement or understanding of thedocumentation, or due to outdated documentation.
The existence of user documentation must be viewed in light of the project goals.Not all programs need extensive documentation, but if it is directed to non-technicalusers, documentation can be an essential component.
4.2.3 Implementation space sources
Perhaps the most important data sources are the implementation space sources.They form the main part of the project deliverable, and most of the work is assumedto be directed to them. Since the implementation space artefacts are often stored ina source code repository with versioning capabilities, extracting data over given timeperiods is possible, enabling research into software evolution. A change in qualityover time can indicate the direction of the project, and allow the project to takecorrective steps if quality is declining.
Another implementation space data source are the bug tracking systems that theproject uses to keep track of defects and feature requests. Bug tracking systems arefrequently used in foss projects to determine when the software can be released. Acommon development pattern is to work on a development version of the code andthen go into “freeze”, introducing no new functionality while bugs are being fixed.When certain criteria are met in the bug tracking system, a release can be made.Recently, attention has been given to time-based releases, where the release dateis set in advance and a new version of the software is released if it meets qualitycriteria on that date [Mic05b, Mic07]. This method is most relevant when appliedto software collections – the collection follows a time-based release schedule, and theparts which are ready by release time are released, while those that are not have oldversions re-released.
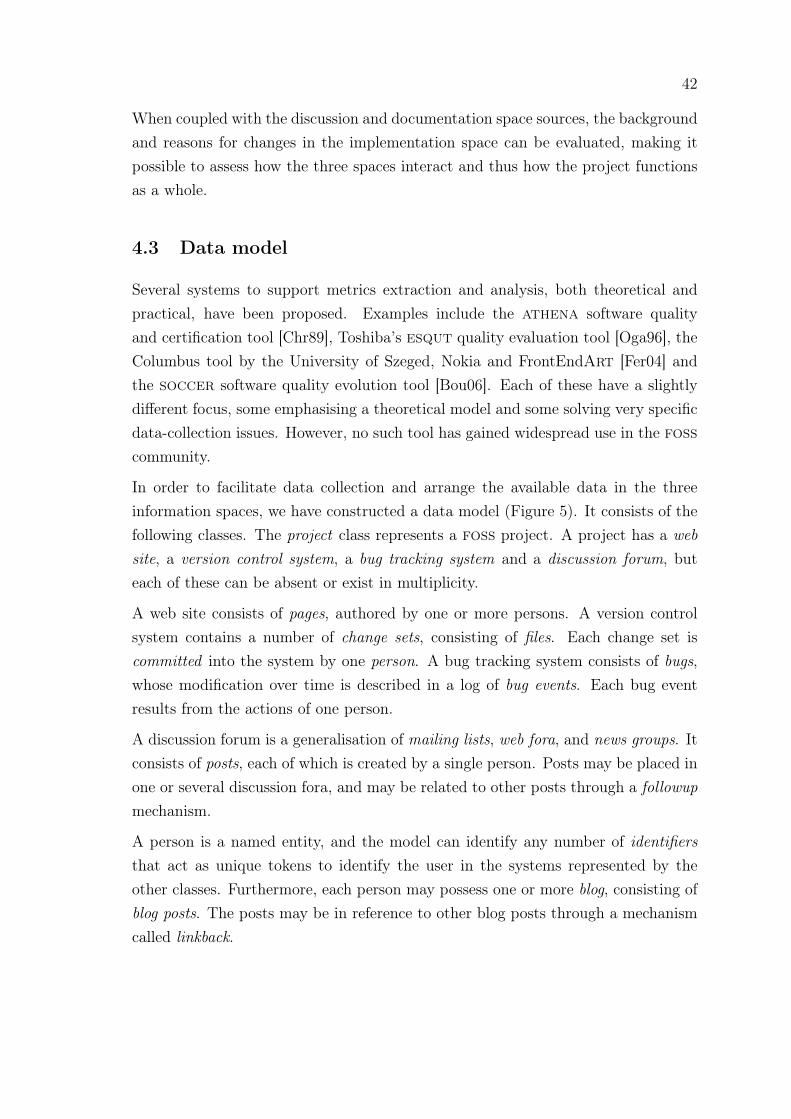
42
When coupled with the discussion and documentation space sources, the backgroundand reasons for changes in the implementation space can be evaluated, making itpossible to assess how the three spaces interact and thus how the project functionsas a whole.
4.3 Data model
Several systems to support metrics extraction and analysis, both theoretical andpractical, have been proposed. Examples include the athena software qualityand certification tool [Chr89], Toshiba’s esqut quality evaluation tool [Oga96], theColumbus tool by the University of Szeged, Nokia and FrontEndArt [Fer04] andthe soccer software quality evolution tool [Bou06]. Each of these have a slightlydifferent focus, some emphasising a theoretical model and some solving very specificdata-collection issues. However, no such tool has gained widespread use in the foss
community.
In order to facilitate data collection and arrange the available data in the threeinformation spaces, we have constructed a data model (Figure 5). It consists of thefollowing classes. The project class represents a foss project. A project has a website, a version control system, a bug tracking system and a discussion forum, buteach of these can be absent or exist in multiplicity.
A web site consists of pages, authored by one or more persons. A version controlsystem contains a number of change sets, consisting of files. Each change set iscommitted into the system by one person. A bug tracking system consists of bugs,whose modification over time is described in a log of bug events. Each bug eventresults from the actions of one person.
A discussion forum is a generalisation of mailing lists, web fora, and news groups. Itconsists of posts, each of which is created by a single person. Posts may be placed inone or several discussion fora, and may be related to other posts through a followupmechanism.
A person is a named entity, and the model can identify any number of identifiersthat act as unique tokens to identify the user in the systems represented by theother classes. Furthermore, each person may possess one or more blog, consisting ofblog posts. The posts may be in reference to other blog posts through a mechanismcalled linkback.
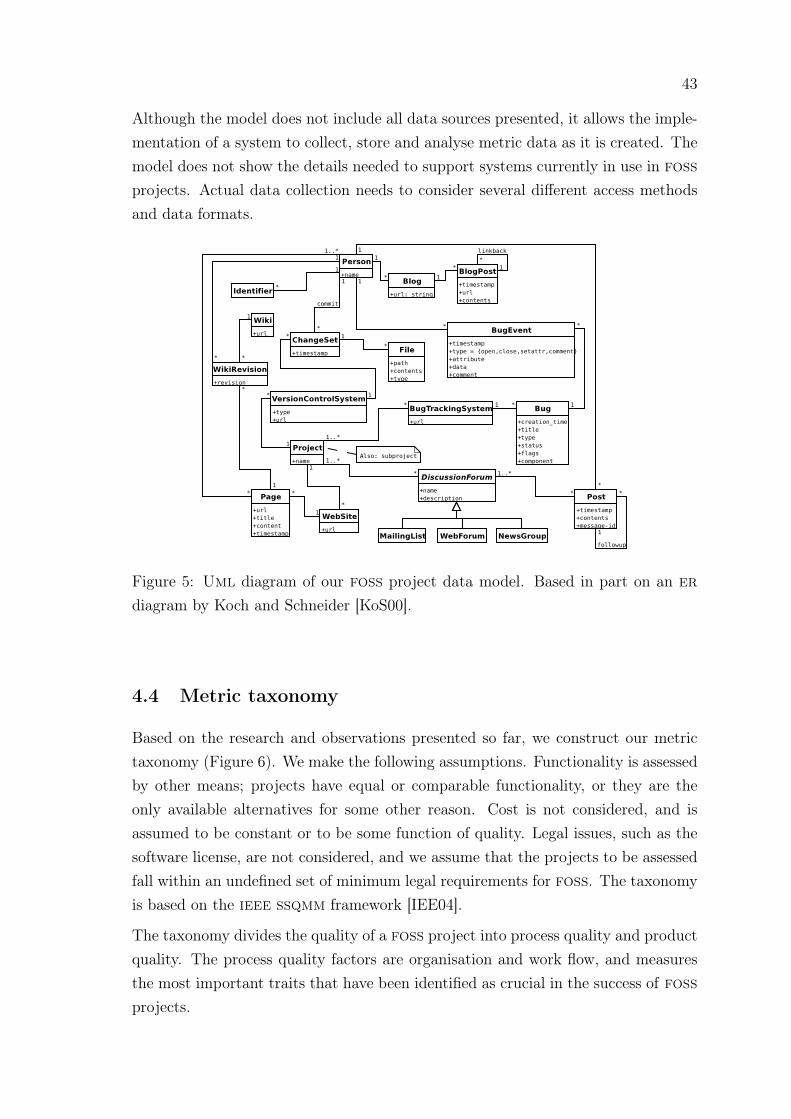
43
Although the model does not include all data sources presented, it allows the imple-mentation of a system to collect, store and analyse metric data as it is created. Themodel does not show the details needed to support systems currently in use in foss
projects. Actual data collection needs to consider several different access methodsand data formats.
Figure 5: Uml diagram of our foss project data model. Based in part on an er
diagram by Koch and Schneider [KoS00].
4.4 Metric taxonomy
Based on the research and observations presented so far, we construct our metrictaxonomy (Figure 6). We make the following assumptions. Functionality is assessedby other means; projects have equal or comparable functionality, or they are theonly available alternatives for some other reason. Cost is not considered, and isassumed to be constant or to be some function of quality. Legal issues, such as thesoftware license, are not considered, and we assume that the projects to be assessedfall within an undefined set of minimum legal requirements for foss. The taxonomyis based on the ieee ssqmm framework [IEE04].
The taxonomy divides the quality of a foss project into process quality and productquality. The process quality factors are organisation and work flow, and measuresthe most important traits that have been identified as crucial in the success of foss
projects.

44
Figure 6: Foss project quality model.
As product quality factors, we have chosen to reflect flexibility, fault density, andquality risk. Flexibility can be viewed as a form of maintainability measure, whichestimates how easy it is to make changes to the program. Fault density is an estimatewhich balances two concepts: how good is the code that has been written, and howeffective are the procedures we use for finding faults? Finally, quality risk estimatesto what extent we have found the defects that exist or are only repairing peripheralsymptoms, giving rise to new faults in the same area. Also, it measures whether thebugs found are concentrated to a particular part of the code or are spread evenly.The quality risk attempts to evaluate how large the potential is for defects to occurin the program or in a particular part of it. In other words, it reflects reliability.
Since foss developers have a very varying degree of knowledge, we have chosen met-rics that are as easy to understand as possible. Otherwise, project participants mayreject the model or make incorrect decisions due to misunderstanding. Since foss
development is rapid and frequently produces amounts of code that is impractical toanalyse manually, the metrics have been chosen so that they can be automaticallycollected and analysed with reasonable effort and computational resources. Also,their implementation is straightforward.
45
The model could be further extended, for example by including some of Boehm’squality characteristics, but this would ultimately lead to metrics that cannot becollected automatically. For example, interoperability is a quality characteristicthat is very difficult to test automatically. It should evaluate data exchange formatsand other interfaces of the program that allow communication with components thatare not part of the program itself. Usability is left out completely – it is such a largefield of its own that we could not hope to cover enough of it in this work. Anotherarea of quality which has been left out is that of performance, both in the sense ofefficiency and scalability. It is doubtful whether these have any general meaning,although they can be of great importance in specific cases.
5 Experiment: Applying quality analysis to real
Free and Open Source Software projects
We have analysed three foss projects using the quality model described in theprevious section. We first conducted an experiment prototype, in which we madefeasibility tests for obtaining data and taking measurements from it. We experi-mented with approximately ten different foss projects, including the Linux kernelproject and a few software packages of the Debian gnu/Linux distribution. Our pro-totype used a database schema directly derived from our data model (Figure 5) withsmall technical and practical changes. We wrote simple tools to collect data fromseveral different sources and calculate the metric values. We also evaluated morethan a dozen metric tools, and found some partly suitable to our needs. However,we were unable to find tools to cover all our needs.
The prototype revealed that many tools currently in use in foss projects are eithernot capable of easily and automatically exporting their entire event history, or animpractical amount of work would have been required to develop tools for extractingthe complete event history. For example, the Bugzilla bug tracking system can onlyexport the current status of a bug. Although the event history is stored, it cannotbe accessed in an unambiguous format that would be easily machine-readable unlessdirect access to the back-end database is obtained. Another example is the Debianbug tracking system, where complete bug logs are available, but the log formatis a human-readable representation which does not lend itself well to automaticprocessing. Therefore, we elected to use arrival rates for this experiment instead ofa full time-line event analysis.
46
5.1 Project selection
From the initial set of approximately ten foss projects, we selected three: Linux2.6, an operating system kernel, The gimp, a graphics program for creating and ma-nipulating two-dimensional images, and Blender, a 3d content creation suite whichincludes modelling, animation, rendering and interactive 3d features. Additionally,we included source code from old versions of the Linux kernel, ranging approximatelyfrom February 2002 to April 2005, as a comparison to the current Linux kernel tree.We refer to this code as Linux-historical.
These projects were selected because they are large and complex in terms of sourcecode, features, developer base and user base, and because their code has had theopportunity to reach a certain maturity during at least five years. Together, theycover a range of quite different approaches to and stages of foss development; theLinux kernel has an extremely rapid pace of development, The gimp is undergoingmajor refactoring to modernise it, and Blender is a highly specialised tool with ahighly specialised audience and developer base. Also, the necessary data for all threewas available and obtainable with reasonable effort.
5.2 Data identification, acquisition and cleaning
For each project, we identified the relevant data sources (Table 6). This informationwas obtained by visiting the web sites of each project, and by reading the projectdocumentation available there. This was trivial – less than an hour of time wasspent on obtaining the information. Also, all three projects have an enormous massof documentation available, ranging from user manuals and tutorials to completebooks. They cover a wide range of audiences and are of many different levels ofquality. Therefore, we decided not to include the web sites and documentation inthis comparison.
To acquire the data from each data source, we wrote special programs based on theearlier prototypes. All programs insert the results of their computation into an sql
database. The values of each computation can then be retrieved efficiently alongwith information about its context – from which project it was obtained, to whichpoint in time the value is connected, and so on. The programs were written in thePython language.
The first program processes compressed mailing list archives in the mbox format.The messages archives were downloaded manually. For each message, the program
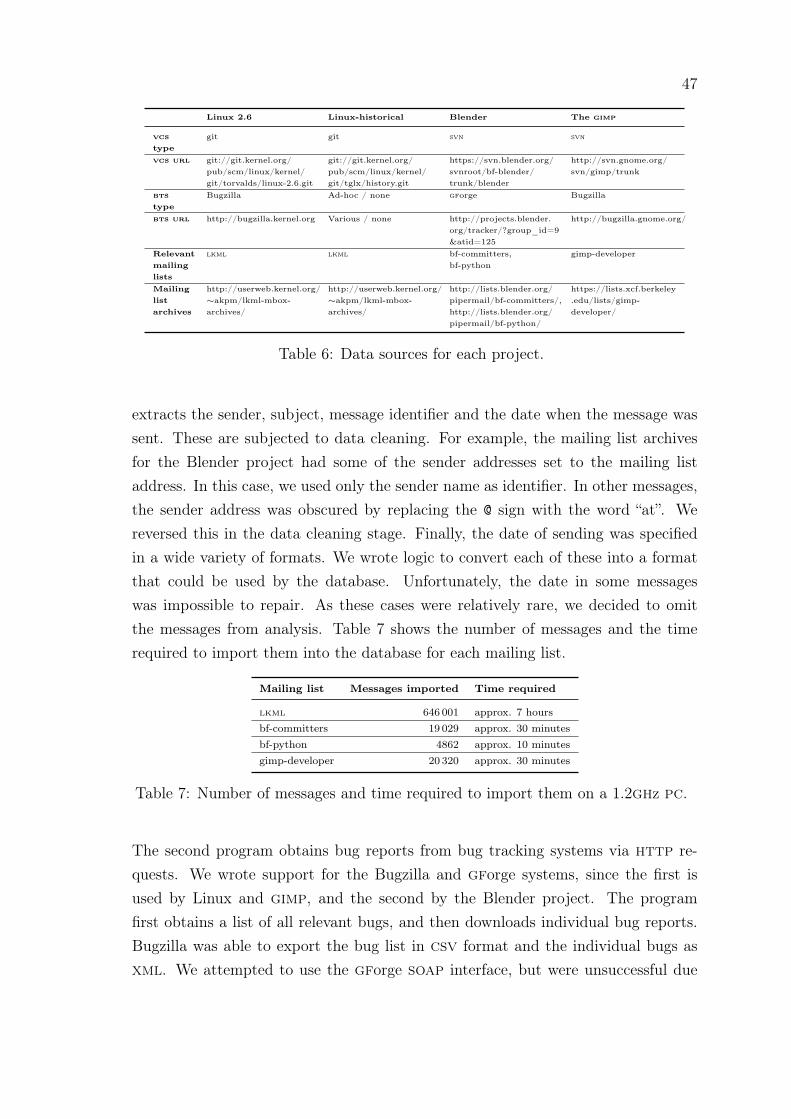
47
Linux 2.6 Linux-historical Blender The gimp
vcstype
git git svn svn
vcs url git://git.kernel.org/pub/scm/linux/kernel/git/torvalds/linux-2.6.git
git://git.kernel.org/pub/scm/linux/kernel/git/tglx/history.git
https://svn.blender.org/svnroot/bf-blender/trunk/blender
http://svn.gnome.org/svn/gimp/trunk
btstype
Bugzilla Ad-hoc / none gforge Bugzilla
bts url http://bugzilla.kernel.org Various / none http://projects.blender.org/tracker/?group_id=9&atid=125
http://bugzilla.gnome.org/
Relevantmailinglists
lkml lkml bf-committers,bf-python
gimp-developer
Mailinglistarchives
http://userweb.kernel.org/∼akpm/lkml-mbox-archives/
http://userweb.kernel.org/∼akpm/lkml-mbox-archives/
http://lists.blender.org/pipermail/bf-committers/,http://lists.blender.org/pipermail/bf-python/
https://lists.xcf.berkeley.edu/lists/gimp-developer/
Table 6: Data sources for each project.
extracts the sender, subject, message identifier and the date when the message wassent. These are subjected to data cleaning. For example, the mailing list archivesfor the Blender project had some of the sender addresses set to the mailing listaddress. In this case, we used only the sender name as identifier. In other messages,the sender address was obscured by replacing the @ sign with the word “at”. Wereversed this in the data cleaning stage. Finally, the date of sending was specifiedin a wide variety of formats. We wrote logic to convert each of these into a formatthat could be used by the database. Unfortunately, the date in some messageswas impossible to repair. As these cases were relatively rare, we decided to omitthe messages from analysis. Table 7 shows the number of messages and the timerequired to import them into the database for each mailing list.
Mailing list Messages imported Time required
lkml 646 001 approx. 7 hoursbf-committers 19 029 approx. 30 minutesbf-python 4862 approx. 10 minutesgimp-developer 20 320 approx. 30 minutes
Table 7: Number of messages and time required to import them on a 1.2ghz pc.
The second program obtains bug reports from bug tracking systems via http re-quests. We wrote support for the Bugzilla and gforge systems, since the first isused by Linux and gimp, and the second by the Blender project. The programfirst obtains a list of all relevant bugs, and then downloads individual bug reports.Bugzilla was able to export the bug list in csv format and the individual bugs asxml. We attempted to use the gforge soap interface, but were unsuccessful due
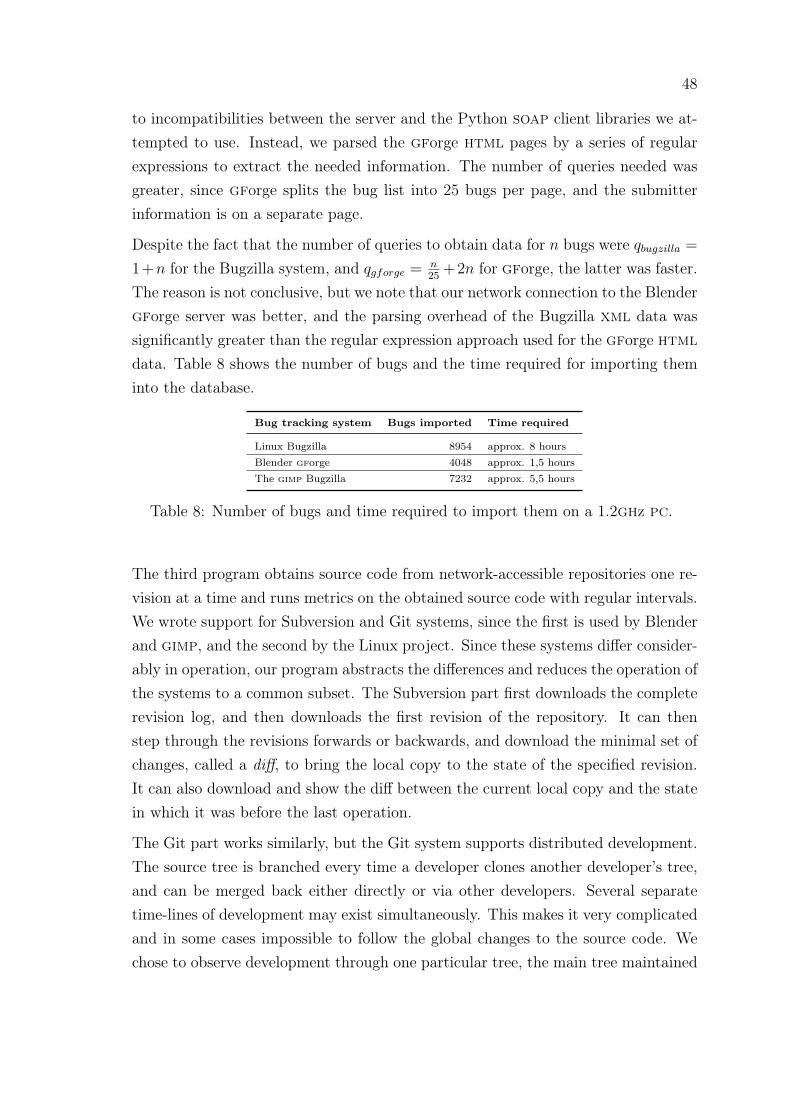
48
to incompatibilities between the server and the Python soap client libraries we at-tempted to use. Instead, we parsed the gforge html pages by a series of regularexpressions to extract the needed information. The number of queries needed wasgreater, since gforge splits the bug list into 25 bugs per page, and the submitterinformation is on a separate page.
Despite the fact that the number of queries to obtain data for n bugs were qbugzilla =
1+n for the Bugzilla system, and qgforge = n25
+2n for gforge, the latter was faster.The reason is not conclusive, but we note that our network connection to the Blendergforge server was better, and the parsing overhead of the Bugzilla xml data wassignificantly greater than the regular expression approach used for the gforge html
data. Table 8 shows the number of bugs and the time required for importing theminto the database.
Bug tracking system Bugs imported Time required
Linux Bugzilla 8954 approx. 8 hoursBlender gforge 4048 approx. 1,5 hoursThe gimp Bugzilla 7232 approx. 5,5 hours
Table 8: Number of bugs and time required to import them on a 1.2ghz pc.
The third program obtains source code from network-accessible repositories one re-vision at a time and runs metrics on the obtained source code with regular intervals.We wrote support for Subversion and Git systems, since the first is used by Blenderand gimp, and the second by the Linux project. Since these systems differ consider-ably in operation, our program abstracts the differences and reduces the operation ofthe systems to a common subset. The Subversion part first downloads the completerevision log, and then downloads the first revision of the repository. It can thenstep through the revisions forwards or backwards, and download the minimal set ofchanges, called a diff, to bring the local copy to the state of the specified revision.It can also download and show the diff between the current local copy and the statein which it was before the last operation.
The Git part works similarly, but the Git system supports distributed development.The source tree is branched every time a developer clones another developer’s tree,and can be merged back either directly or via other developers. Several separatetime-lines of development may exist simultaneously. This makes it very complicatedand in some cases impossible to follow the global changes to the source code. Wechose to observe development through one particular tree, the main tree maintained

49
by Linus Torvalds. Changes made to other trees are reviewed and later included intothis tree, temporarily merging the time-lines. Because of the way the Git systemworks, our program first downloads the entire tree of revisions, and then performsthe required operations locally.
The performance characteristics of the two systems are different. The Subversionpart is network-dependent in all stages, while the Git part is heavily network-dependent in the initial stage, and is then dependent on storage system i/o.
After obtaining the initial data, the program steps through each revision, noting therevision identifier of the underlying version control system and the author and dateof the revision, and inserts these into the database. With regular, user-definableintervals, the program can run a number of metrics on the source code. These arefurther explained in Section 5.3. Table 9 shows the number of revisions imported,the metric run interval, and the time required to perform this data acquisition.
Source code repository Revisions imported Full metrics interval Time required
Linux (git) 64 707 every 300 revisions approx. 44 hoursLinux-historical (git) 63 428 every 3000 revisions approx. 14 hoursBlender (svn) 10 826 every 100 revisions approx. 8 hoursThe gimp (svn) 21 157 every 500 revisions approx. 9.5 hours
Table 9: Number of revisions, run interval for full metrics calculation, and timerequired to import the data on a 1.2ghz pc.
All programs make use of the data already stored in the database to identify theactor whose action resulted in a mailing list message, a submitted bug, or a sourcecode revision. As artefacts were analysed, the database was automatically consultedto see if the associated actor identifier had already been recorded. If so, we assumethat the actor is the same person. Thus, we were able to make some correlationbetween actions in the different information spaces, although we did not use all thepossible data sources.
On inspection of the discovered correlations, we found that the identification tokenshave too little overlap between the different systems. In the Subversion system, theactor is identified only by a user name local to the main Subversion server. We foundthat this user name was frequently different from the name or email address usedelsewhere, so unambiguously connecting the actors in all three data sources was notpossible. We considered an approach where the analysis would be re-run each timea new identifier token is added, using tokens from previous runs to bootstrap the
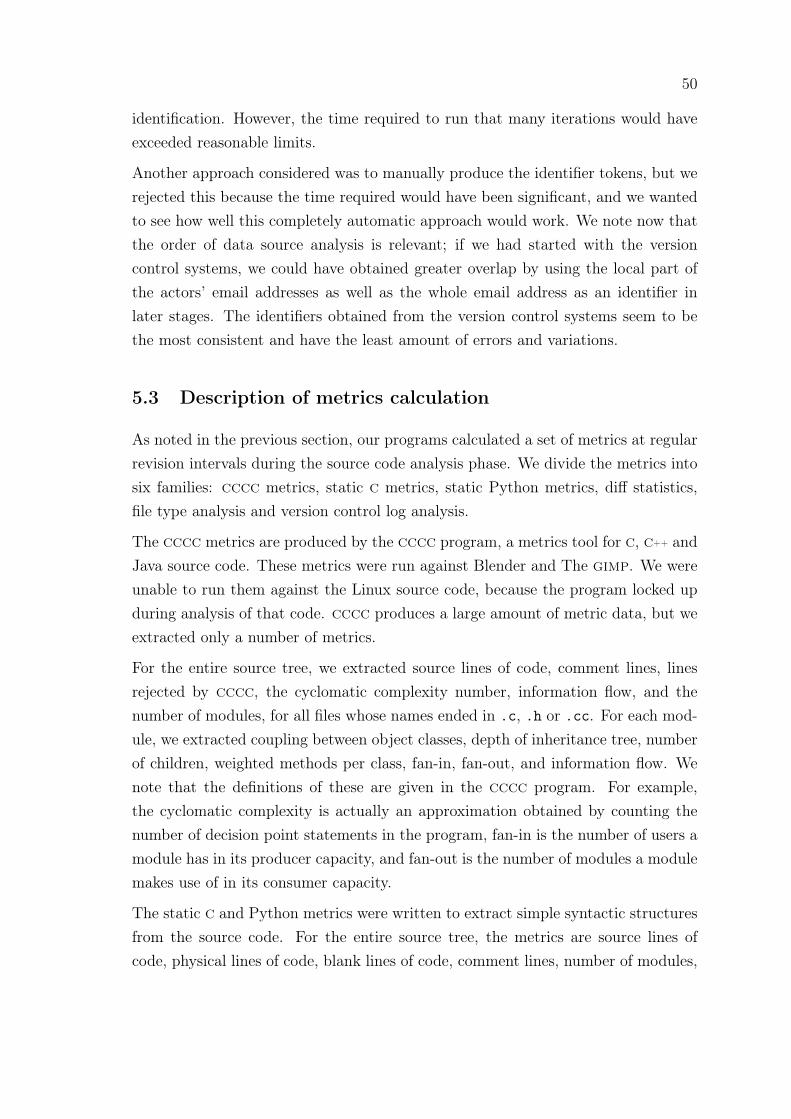
50
identification. However, the time required to run that many iterations would haveexceeded reasonable limits.
Another approach considered was to manually produce the identifier tokens, but werejected this because the time required would have been significant, and we wantedto see how well this completely automatic approach would work. We note now thatthe order of data source analysis is relevant; if we had started with the versioncontrol systems, we could have obtained greater overlap by using the local part ofthe actors’ email addresses as well as the whole email address as an identifier inlater stages. The identifiers obtained from the version control systems seem to bethe most consistent and have the least amount of errors and variations.
5.3 Description of metrics calculation
As noted in the previous section, our programs calculated a set of metrics at regularrevision intervals during the source code analysis phase. We divide the metrics intosix families: cccc metrics, static c metrics, static Python metrics, diff statistics,file type analysis and version control log analysis.
The cccc metrics are produced by the cccc program, a metrics tool for c, c++ andJava source code. These metrics were run against Blender and The gimp. We wereunable to run them against the Linux source code, because the program locked upduring analysis of that code. cccc produces a large amount of metric data, but weextracted only a number of metrics.
For the entire source tree, we extracted source lines of code, comment lines, linesrejected by cccc, the cyclomatic complexity number, information flow, and thenumber of modules, for all files whose names ended in .c, .h or .cc. For each mod-ule, we extracted coupling between object classes, depth of inheritance tree, numberof children, weighted methods per class, fan-in, fan-out, and information flow. Wenote that the definitions of these are given in the cccc program. For example,the cyclomatic complexity is actually an approximation obtained by counting thenumber of decision point statements in the program, fan-in is the number of users amodule has in its producer capacity, and fan-out is the number of modules a modulemakes use of in its consumer capacity.
The static c and Python metrics were written to extract simple syntactic structuresfrom the source code. For the entire source tree, the metrics are source lines ofcode, physical lines of code, blank lines of code, comment lines, number of modules,
51
an approximation of McCabe’s cyclomatic complexity, obtained by counting thenumber of decision statements in the code, and variants of fan-in and fan-out thatcalculate the number of parameters in a function or method, and the number ofreturn statements in a function or method. For individual modules, the same metricswere used and run against all programs for all files that ended in .c, .h or .py.We chose to include Python code, as it is used in two of our selected projects as ascripting and extension language, and since we have prior experience with automaticanalysis of this language.
The diff statistics counts the number of files changed and the number of added anddeleted lines of code. The file type analysis tries to guess the type of each file bylooking at the file name. The version control log analysis extracts authors, timestamps and native revision identifiers from a version control system log. These wererun against all programs. Table 10 shows all metrics and their codes.
For each program to be analysed, the full metrics were run against only a subset ofthe source code revisions. For the Blender project, full analysis was performed every100 revisions, for gimp, every 500 revisions, for the historical Linux code, every3000 revisions, and for the Linux 2.6 code, every 300 revisions (Table 9). Thesenumbers were chosen based on the observed activity in the project and practicalconsiderations such as the time available to perform data acquisition and analysis.This provides a sufficient approximation of the full data. It loses the ability to tell,for example, precisely how much code each contributor has written, but the numberof commits is an acceptable substitute.
The data obtained was a total of 521 mb in size, measured as sql statements. Beforedeciding on the exact values to present, we explored the data using data miningtechniques and simple graphing of the variables over time. We focused primarilyon the correlations between different data items and time-line analysis of single andmultiple variables. We used the model in Figure 6 to guide our exploration.
6 Experiment: Results
The collected data can be used as a basis for a wide variety of quality-related obser-vations. In the following sections, we will present metric observations that highlightsome of the important quality factors in our quality model for each of the threeselected projects. We find that the three foss projects vary in the amount of con-tributors involved and the amount of code produced and bugs submitted, but that

52
Metric family Metric source Metric code Metric description
cccc
All code
sloc Source lines of code
cloc Comment lines
rejloc Lines rejected by cccc
cyc Cyclomatic complexity
if Information flow
nom Number of modules
Per module
cbo Coupling between object classes
dit Depth of inheritance tree
wmc Weighted methods per class
fanin Fan-in (producer role)
fanout Fan-out (consumer role)
if Information flow
Static c and static Python All and per module
sloc Source lines of code
ploc Physical lines of code
bloc Blank lines of code
cloc Comment lines
nom Number of modules
cyc Cyclomatic complexity
fanin Fan-in (function parameters)
fanout Fan-out (return statements)
Diff statistics All codefc Files changed
loc_add Lines of code added
loc_del Lines of code deleted
File types All filesftype mime type of file
comp Compression type, if any
Version control log Revision logauthor Author of the revision
timestamp Timestamp of the revision
revid Native revision identifier
Table 10: Description of calculated metrics.

53
these are not decisive when determining the quality of the end result. However,some patterns are visible that are typical of foss projects.
6.1 Linux
Linux is an operating system kernel initially written in 1991 by Linus Torvalds, at thetime a student at the University of Helsinki. The kernel was written by replacingparts of the educational Minix system until none of the original parts remained.Since then, each part of the kernel has been rewritten or extended, and very littleremains of the original Linux version 1.0. Linux is used worldwide for a variety oftasks. The project has worked on the 2.6 branch since December 2003. Our databegins in January 2000 for the mailing lists, in October 2002 for the bugs, and inApril 2002 for the source code. We will make comparisons with the Linux-historicaldata where appropriate.
6.1.1 Process quality
The number of commits per author follows a power law, with most commits beingcontributed by a small number of authors (Figure 7). Estimating the number ofcommits for core developers at 500 or more, and for co-developers at 50 or more, wefind that the core developers constitute approximately half a percent of all commit-ters, and co-developers slightly more than 6% (Table 11). It should be noted thatthis definition of developer classes is only an approximation of the socially assignedroles within the project.
0 500 1000 1500 2000 2500 3000 3500
Author
0
200
400
600
800
1000
1200
1400
1600
Commits
Linux
0 200 400 600 800 1000 1200 1400 1600
Author
0
1000
2000
3000
4000
5000
6000
7000
Commits
Linux-historical
Figure 7: Commits per author for Linux (a) and Linux-historical (b).

54
Developer class Size:
Linux
Size:
Linux-
historical
Size: dif-
ference
Percentage of
committers:
Linux
Percentage of
committers:
Linux-historical
Percentage of
committers:
difference
Core developers(≥ 500 commits)
18 26 −8 0.54% 1.65% −1.11%
Co-developers(≥ 50 commits)
213 125 88 6.38% 7.93% −1.55%
Active users 3106 1426 1680 93.08% 90.42% 2.66%
Table 11: Developer classes in Linux and Linux-historical.
Compared to Linux-historical, the core team has shrunk by more than one percent-age unit, and the co-developers set has shrunk by slightly more than one and a halfpercentage units. The active user set has in turn grown by more than two and a halfpercentage units. This could indicate that there is a trend toward more distributeddevelopment, where a shrinking core is moderating a growing mass of changes. Thequality implication is that the use of the Git tool has enabled development to be-come more distributed, reducing the load on the core and co-developers, but alsoincreasing the need for a hierarchical peer-review process.
We made no attempt to estimate the number of passive users and readers. Theformer is likely to range in the millions, and the latter in at least the thousands.Therefore, they constitute a significant positive contribution to the organisationalquality; there is a very large number of external observers.
We detected a total of 22 236 distinct persons posting to the Linux kernel developers’mailing list, and a total of 646 001 messages. The same kind of distribution appliesto mailing list participation and bug submission as to source code commits (Figure8). These findings are consistent with the studies presented earlier; a majority of allwork is done by a small number of contributors, while the majority of contributorscontribute only once. There are no special quality implications compared to otherfoss projects other than the scale of the project.
6.1.2 Product quality
The sloc evolution graph shows that Linux 2.6 has been growing at a linear rate.The same is true for Linux-historical (Figure 9). In light of this data, we observethat there is no evidence for the super-linear growth found by Godfrey and Tu[GoT00, GoT01]. They formulated the polynomial y = 0.21x2 + 252x + 90 055 tomodel the uncommented sloc number y based on the number of days x since the

55
0.0 0.5 1.0 1.5 2.0 2.5
Poster x1e+4
0.0
0.5
1.0
1.5
2.0
Messages
x1e+4 Linux
0 1000 2000 3000 4000 5000
Submitter
0
10
20
30
40
50
60
70
Bugs
Linux
Figure 8: Posts per poster (a) and bugs per submitter (b) for Linux.
Feb 2005 Jun 2005 Oct 2005 Feb 2006 Jun 2006 Oct 2006 Feb 2007 Jun 2007 Oct 2007
Timestamp
3.4
3.6
3.8
4.0
4.2
4.4
Metr
ic v
alu
e
x1e+6 Linux
SLOC: CSLOC
Mar 2002Jul 2002Nov 2002Mar 2003Jul 2003Nov 2003Mar 2004Jul 2004Nov 2004Mar 2005
Timestamp
1.6
1.8
2.0
2.2
2.4
2.6
2.8
3.0
3.2
3.4
Metr
ic v
alu
e
x1e+6 Linux-historical
SLOC: CSLOC
Figure 9: Sloc evolution for Linux (a) and Linux-historical (b).
release of Linux 1.0 on the 13th of March 1994. Given that x is now approximately4900, y should be approximately 6 366 955, but the current size is almost two millionlines short of that (Figure 9(a)). Perhaps the time period measured by Godfrey andTu was an initial growth phase. As seen today, Linux has been following the samelinear growth rate as industrial software [Leh97]. This is also true at the subsystemlevel; the great majority of source code is in the drivers subsystem, which alsoexhibits the fastest growth, but not a super-linear one (Figure 10).
Thus, our findings give no reason to believe that the process employed by Linuxis of superior quality when sustained super-linear growth is desired. However, thedata does show that the Linux project has been able to keep its pace despite anincreasingly large and complex code base.
The commit frequency shows that activity has been varying between a few hundredcommits to nearly 4000 commits per 30-day interval (Figure 11(a)). It is difficultto detect a trend, but the activity does seem to be cyclic, more or less following the

56
Feb 2005 Jun 2005 Oct 2005 Feb 2006 Jun 2006 Oct 2006 Feb 2007 Jun 2007 Oct 2007
Timestamp
0.0
0.5
1.0
1.5
2.0
2.5
Metr
ic v
alu
e
x1e+6 Linux
SLOC: /fsSLOC: /driversSLOC: /netSLOC: /kernel
Mar 2002Jul 2002Nov 2002Mar 2003Jul 2003Nov 2003Mar 2004Jul 2004Nov 2004Mar 2005
Timestamp
0.0
0.5
1.0
1.5
2.0
Metr
ic v
alu
e
x1e+6 Linux-historical
SLOC: /fsSLOC: /driversSLOC: /netSLOC: /kernel
Figure 10: Subsystem growth in Linux (a) and Linux-historical (b).
Oct 2004Feb 2005Jun 2005Oct 2005Feb 2006Jun 2006Oct 2006Feb 2007Jun 2007Oct 2007
Timestamp
0
500
1000
1500
2000
2500
3000
3500
4000
Metr
ic v
alu
e
Linux
Commits per 30 days
2001 2002 2003 2004 2005 2006 2007 2008
Timestamp
0.0
0.2
0.4
0.6
0.8
1.0
1.2
1.4
Metr
ic v
alu
e
x1e+4 Linux
Posts per 30 days
Figure 11: Commit (a) and post (b) frequency for Linux.
development phases in use in the project. The post frequency shows a rising trend(Figure 11(b)). Discussion seems to be increasing, which could be a sign that moredesign work and coordination is performed as the code base grows. Alternatively,it could be a result of the steps taken to distribute development – as the barrier ofparticipation decreases, the pace of discussion increases.
The bug arrival rate shows no consistent trends (Figure 12(a)). It appears that thebug arrival rate has been declining during the year 2007, and that a similar declineoccurred from 2004 to mid-2005. The bug arrival rate per commit rate shows that theLinux project is capable of countering the amount of reported bugs without problems(Figure 12(b)). We note that the Linux project is somewhat divided in the use ofthe Bugzilla bug tracking system, as the project has traditionally communicated bugreports on the mailing list or directly between users and subsystem maintainers, apractice still in active use. Also, Linux distributions carry a significant percentageof the bugs originating from end-users in their own bug tracking systems, and thusonly a part of the bugs exist in the bug tracking system of the Linux project.
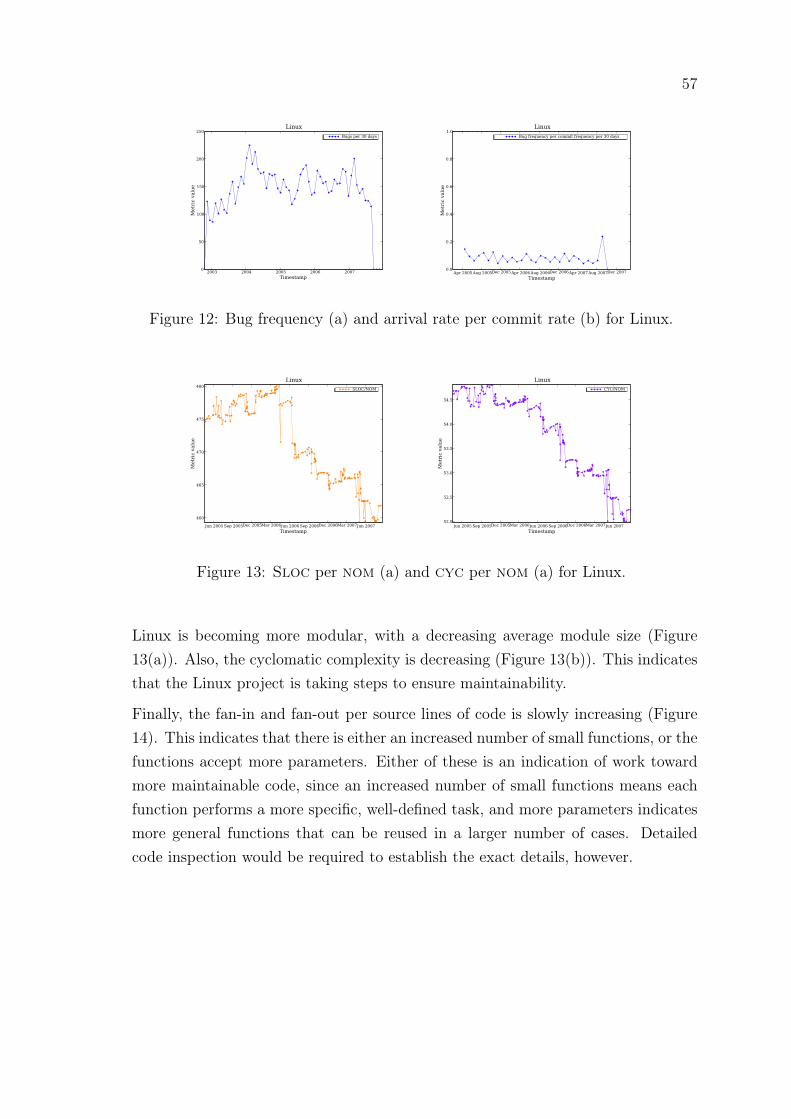
57
2003 2004 2005 2006 2007
Timestamp
0
50
100
150
200
250
Metr
ic v
alu
e
Linux
Bugs per 30 days
Apr 2005Aug 2005Dec 2005Apr 2006Aug 2006Dec 2006Apr 2007Aug 2007Dec 2007
Timestamp
0.0
0.2
0.4
0.6
0.8
1.0
Metr
ic v
alu
e
Linux
Bug frequency per commit frequency per 30 days
Figure 12: Bug frequency (a) and arrival rate per commit rate (b) for Linux.
Jun 2005 Sep 2005Dec 2005Mar 2006Jun 2006 Sep 2006Dec 2006Mar 2007Jun 2007
Timestamp
460
465
470
475
480
Metr
ic v
alu
e
Linux
SLOC/NOM
Jun 2005 Sep 2005Dec 2005Mar 2006Jun 2006 Sep 2006Dec 2006Mar 2007Jun 2007
Timestamp
52.0
52.5
53.0
53.5
54.0
54.5
Metr
ic v
alu
e
Linux
CYC/NOM
Figure 13: Sloc per nom (a) and cyc per nom (a) for Linux.
Linux is becoming more modular, with a decreasing average module size (Figure13(a)). Also, the cyclomatic complexity is decreasing (Figure 13(b)). This indicatesthat the Linux project is taking steps to ensure maintainability.
Finally, the fan-in and fan-out per source lines of code is slowly increasing (Figure14). This indicates that there is either an increased number of small functions, or thefunctions accept more parameters. Either of these is an indication of work towardmore maintainable code, since an increased number of small functions means eachfunction performs a more specific, well-defined task, and more parameters indicatesmore general functions that can be reused in a larger number of cases. Detailedcode inspection would be required to establish the exact details, however.

58
Jun 2005 Sep 2005Dec 2005Mar 2006Jun 2006 Sep 2006Dec 2006Mar 2007Jun 2007
Timestamp
0.045
0.050
0.055
0.060
0.065
0.070
Metr
ic v
alu
e
Linux
FANIN/SLOCFANOUT/SLOC
Figure 14: Fan-in and fan-out per sloc for Linux.
6.2 Blender
Blender is a 3d content creation suite. It includes modelling, animation, shading,rendering, a physics and particle system, imaging and compositing facilities, andreal-time 3d and game creation functions. Blender was initially an in-house tooldeveloped for an animation studio. The tool was spun off in 1998 to a separatecompany which was later shut down because of economical difficulties. In 2002, thenewly formed Blender Foundation bought the source code using donated funds fromthe foss community. Since then, Blender has been developed as a foss project.
6.2.1 Process quality
Figure 15 shows the commits per author, posts per poster and bugs per submitterfor the Blender project. The latter two display the usual power law distributioncommon in foss projects, but the first has some unusual properties. The number ofcode-submitting actors in the project is smaller than what might be expected fromthe code size and complexity of the project. Less than 70 persons have committedcode into the repository. Using the same definitions as for Linux, we see that thenumber of core developers is only two, and there is a surprisingly large amount ofco-developers (Table 12).
We believe that this is consistent with the very modular nature of the program.Blender acts as a framework for all 3d content creation tasks – tasks which arerelated within their field, but which result in very different implementation detailsand requirements of mathematical knowledge. The large co-developer class mayindicate that developers of specific sub-features work outside the Blender repositoryto implement the desired functionality, committing them in relatively few steps.

59
0 10 20 30 40 50 60 70
Author
0
500
1000
1500
2000
2500
3000
3500
Commits
Blender
0 100 200 300 400 500 600 700 800
Poster
0
500
1000
1500
2000
Messages
Blender
0 200 400 600 800 1000 1200 1400
Submitter
0
20
40
60
80
100
120
140
160
180Bugs
Blender
Figure 15: Commits per author (a), posts per poster (b) and bugs per submitter (c)for Blender.
Developer class Size Percentage of committers
Core developers (≥ 500 commits) 2 3.03%Co-developers (≥ 50 commits) 36 54.55%Active users 28 42.42%
Table 12: Developer classes in Blender.
We detected a total of 733 distinct persons posting to the two Blender developmentlists, one for the main program development and the other for Python-related de-velopment. A total of 23 891 messages were detected. We observe that Blender hasa highly specialised and small audience participating in the visible activities. Wesuspect that the activity is higher in the Blender web forums, but also that there isa very high number of passive users compared to the other actor classes. Blenderis directed toward artistic users who may not have an interest in participating intraditional foss activities. This is also visible when comparing the amount of com-mits, posts, and bugs – the last is perhaps the most anonymous and quick form offeedback, and the amount of bug submitters is roughly 30% larger than the amountof mailing list posters.

60
We conclude that communication in Blender is quite streamlined, and we suspectthat much of it occurs outside the observed data sources. The organisation is smallenough to work without complicated processes, and the challenge in this project liesin the knowledge of 3d graphics and 3d content production required to write thiskind of program.
6.2.2 Product quality
The sloc evolution of Blender shows a steady increase in the amount of Pythoncode (Figure 16(a)). It also shows a carefully super-linear growth until mid-2006,after which there is a large, sudden increase in code size. After that, sloc growthcontinues, but at a decreased pace.
Examining the subsystem-level sloc evolution reveals that the sudden increase incode size is due to two external libraries being imported into the Blender vcs:ffmpeg, a collection of libraries to handle digital audio and video, and Verse, alibrary for sharing 3d data over a network. Figure 16(b) shows the impact of these,and also reveals that the sloc evolution in the main Blender code continues itssuper-linear growth. The recent decrease in total sloc count likely results fromexternal libraries being shrunk or removed. We thus have reason to believe that theproject is highly efficient and can produce code at a rapid pace. Based on this data,the reason appears to be that Blender is a small enough project to avoid unnecessarycommunication overhead, that the developers are well synchronised, and that thereis a high degree of knowledge among the project members.
2003 2004 2005 2006 2007 2008
Timestamp
0
1
2
3
4
5
6
7
Metr
ic v
alu
e
x1e+5 Blender
SLOC: PythonSLOC: CSLOC
2003 2004 2005 2006 2007 2008
Timestamp
0.0
0.5
1.0
1.5
2.0
2.5
3.0
3.5
4.0
4.5
Metr
ic v
alu
e
x1e+5 Blender
SLOC: /extern/verseSLOC: /extern/ffmpegSLOC: /source
Figure 16: Sloc evolution (a) and sloc evolution for selected subsystems (b) inBlender.
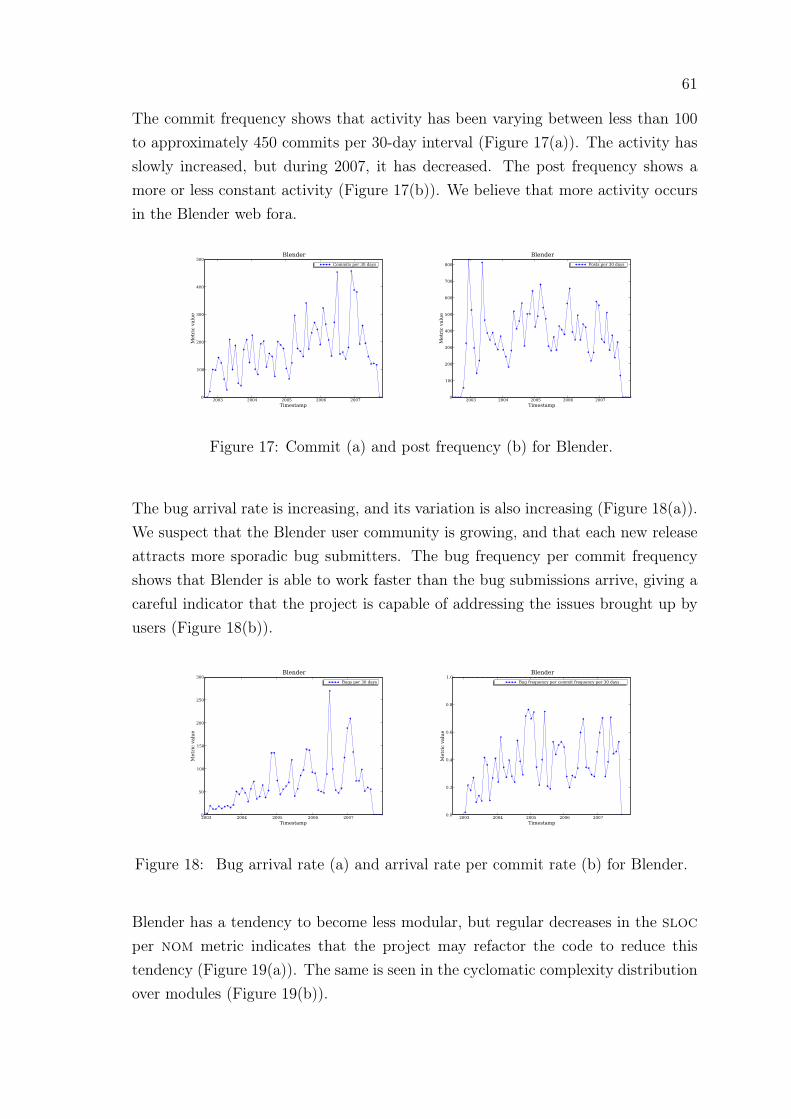
61
The commit frequency shows that activity has been varying between less than 100to approximately 450 commits per 30-day interval (Figure 17(a)). The activity hasslowly increased, but during 2007, it has decreased. The post frequency shows amore or less constant activity (Figure 17(b)). We believe that more activity occursin the Blender web fora.
2003 2004 2005 2006 2007
Timestamp
0
100
200
300
400
500
Metr
ic v
alu
e
Blender
Commits per 30 days
2003 2004 2005 2006 2007
Timestamp
0
100
200
300
400
500
600
700
800
Metr
ic v
alu
e
Blender
Posts per 30 days
Figure 17: Commit (a) and post frequency (b) for Blender.
The bug arrival rate is increasing, and its variation is also increasing (Figure 18(a)).We suspect that the Blender user community is growing, and that each new releaseattracts more sporadic bug submitters. The bug frequency per commit frequencyshows that Blender is able to work faster than the bug submissions arrive, giving acareful indicator that the project is capable of addressing the issues brought up byusers (Figure 18(b)).
2003 2004 2005 2006 2007
Timestamp
0
50
100
150
200
250
300
Metr
ic v
alu
e
Blender
Bugs per 30 days
2003 2004 2005 2006 2007
Timestamp
0.0
0.2
0.4
0.6
0.8
1.0
Metr
ic v
alu
e
Blender
Bug frequency per commit frequency per 30 days
Figure 18: Bug arrival rate (a) and arrival rate per commit rate (b) for Blender.
Blender has a tendency to become less modular, but regular decreases in the sloc
per nom metric indicates that the project may refactor the code to reduce thistendency (Figure 19(a)). The same is seen in the cyclomatic complexity distributionover modules (Figure 19(b)).

62
Dec 2002Jun 2003Dec 2003Jun 2004Dec 2004Jun 2005Dec 2005Jun 2006Dec 2006Jun 2007
Timestamp
450
500
550
600
Metr
ic v
alu
e
Blender
SLOC/NOM
Dec 2002Jun 2003Dec 2003Jun 2004Dec 2004Jun 2005Dec 2005Jun 2006Dec 2006Jun 2007
Timestamp
75
80
85
90
95
100
Metr
ic v
alu
e
Blender
CYC/NOM
Figure 19: Sloc per nom (a) and cyc per nom (b) for Blender.
Finally, the fan-in per sloc is slowly increasing while the fan-out per sloc hasbegun decreasing slightly in the second quarter of 2006 (Figure 20). This couldindicate that functions are becoming more generic, accepting a greater number ofparameters to control their behaviour, while the project is attempting to lower thecomplexity of the program by reducing the number of exit points from each function.However, since the decrease in fan-out appears to level out, this might be a purecoincidence.
Dec 2002Jun 2003Dec 2003Jun 2004Dec 2004Jun 2005Dec 2005Jun 2006Dec 2006Jun 2007
Timestamp
0.03
0.04
0.05
0.06
0.07
Metr
ic v
alu
e
Blender
FANIN/SLOCFANOUT/SLOC
Figure 20: Fan-in and fan-out per sloc for Blender.
6.2.3 Object-oriented features
Since Blender is written largely in c++, this project was the most suitable to ap-ply the object-oriented metrics on. The growth of information flow indicates thatthe coupling between classes has increased (Figure 21(a)). We can see that thedit and noc metrics react to the same changes: as the depth of the inheritancetree increases, the number of classes increases by the same relative amount (Figure

63
21(b)). These figures indicate that Blender is becoming more modular and thatthere is greater potential for code reuse. The flexibility of the code increases, but asa result, understandability could decrease.
The increasing wmc metric shows that the functionality of all classes has increased(Figure 21(c)). We also see correlation between cbo and fan-in – they measure essen-tially the same thing. Coupling between objects seems to have increased moderatelyover time, but the growth curve has stopped increasing in 2007, indicating that theclass hierarchy has stabilised.
Dec 2002Jun 2003Dec 2003Jun 2004Dec 2004Jun 2005Dec 2005Jun 2006Dec 2006Jun 2007
Timestamp
0.7
0.8
0.9
1.0
1.1
1.2
Metr
ic v
alu
e
x1e+6 Blender
IF
Dec 2002Jun 2003Dec 2003Jun 2004Dec 2004Jun 2005Dec 2005Jun 2006Dec 2006Jun 2007
Timestamp
200
300
400
500
600
Metr
ic v
alu
e
Blender
DITNOC
Dec 2002Jun 2003Dec 2003Jun 2004Dec 2004Jun 2005Dec 2005Jun 2006Dec 2006Jun 2007
Timestamp
0.5
1.0
1.5
2.0
2.5
Metr
ic v
alu
e
x1e+4 Blender
CBOWMCFANIN
Figure 21: Information flow (a), dit and noc (b), and cbo, wmc, and fan-in (c)for Blender.
6.3 The gimp
The gimp, also known as gimp, is a graphics program for tasks such as photoretouching, image composition and image authoring. It can be used as a simple paintprogram, an on-line batch processing system, a mass production image renderer, oran image format converter. Other uses are possible through scripting and plug-inmechanisms. gimp has been in development since 1996.
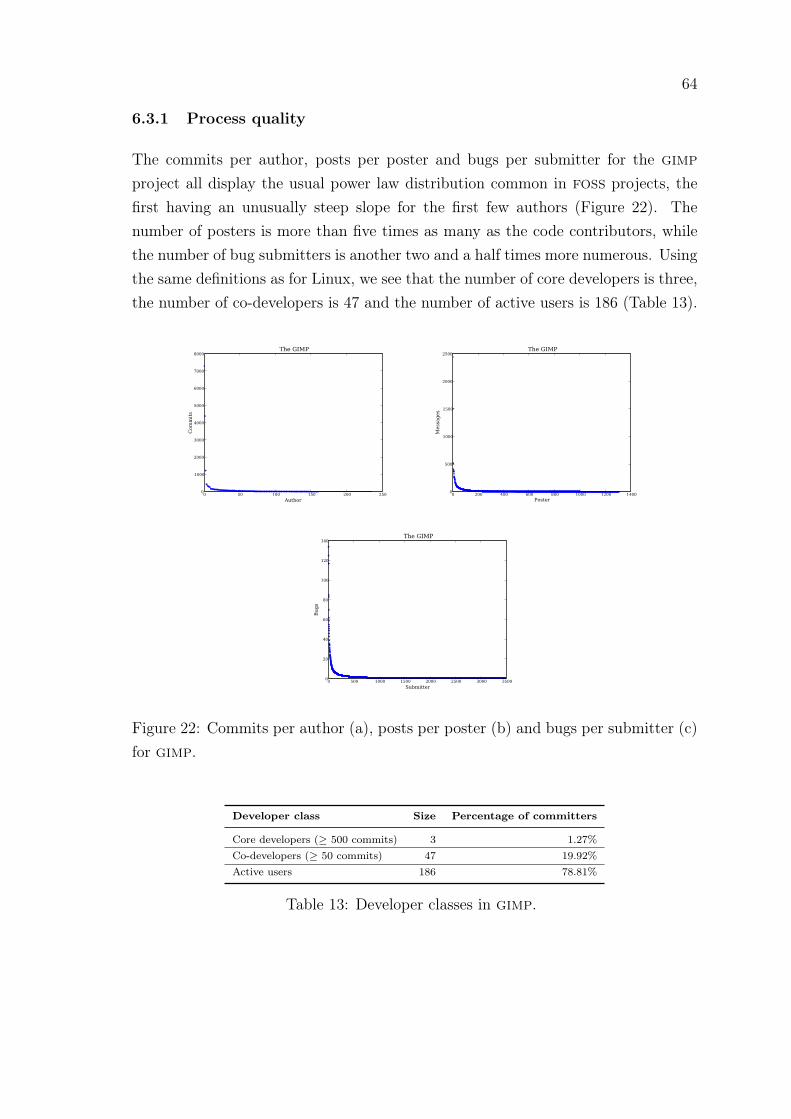
64
6.3.1 Process quality
The commits per author, posts per poster and bugs per submitter for the gimp
project all display the usual power law distribution common in foss projects, thefirst having an unusually steep slope for the first few authors (Figure 22). Thenumber of posters is more than five times as many as the code contributors, whilethe number of bug submitters is another two and a half times more numerous. Usingthe same definitions as for Linux, we see that the number of core developers is three,the number of co-developers is 47 and the number of active users is 186 (Table 13).
0 50 100 150 200 250
Author
0
1000
2000
3000
4000
5000
6000
7000
8000
Com
mit
s
The GIMP
0 200 400 600 800 1000 1200 1400
Poster
0
500
1000
1500
2000
2500
Messag
es
The GIMP
0 500 1000 1500 2000 2500 3000 3500
Submitter
0
20
40
60
80
100
120
140
Bu
gs
The GIMP
Figure 22: Commits per author (a), posts per poster (b) and bugs per submitter (c)for gimp.
Developer class Size Percentage of committers
Core developers (≥ 500 commits) 3 1.27%Co-developers (≥ 50 commits) 47 19.92%Active users 186 78.81%
Table 13: Developer classes in gimp.

65
We detected a total of 1306 distinct posters on the gimp developer mailing list,contributing to a total of 20 320 messages. This is not surprising given the age ofthe project.
We conclude that gimp is quite a typical foss project, consistent with the hypothe-ses put forward by Mockus et al. [Moc02]. In particular, the fourth hypothesis hasstrong support: gimp has successfully gained contributors beyond the core develop-ers, and has thus been able to sustain itself over a period of nearly ten years.
6.3.2 Product quality
The sloc evolution of gimp shows that code size increased sub-linearly until 2001,after which it returned to roughly its earlier size (Figure 23(a)). After that, growthhas been more controlled, but approximately linear. One reason for this may bethat much of the user interface code written for the program has been broken outinto a separate gui library called gtk+, and new functionality has gradually movedfrom the gimp project to gtk+.
Examining the subsystem-level sloc evolution shows that a significant portion ofthe code consists of the main application and the plug-ins. Another major part ofthe code is the libgimp library (Figure 23(b)).
The commit frequency shows that activity has been varying between less than 100to almost 500 commits per 30-day interval (Figure 24(a)). The activity appears tohave two phases, each being a rapid increase followed by a longer decrease. Thepost frequency shows a more or less constant activity (Figure 24(b)). The anomaly
1996 1997 1998 1999 2000 2001 2002 2003 2004 2005 2006 2007 2008 2009
Timestamp
0
1
2
3
4
5
6
7
8
Metr
ic v
alu
e
x1e+5 The GIMP
SLOC: PythonSLOC: CSLOC
1997 1998 1999 2000 2001 2002 2003 2004 2005 2006 2007 2008 2009
Timestamp
0.0
0.5
1.0
1.5
2.0
2.5
3.0
3.5
4.0
4.5
Metr
ic v
alu
e
x1e+5 The GIMP
SLOC: /app
SLOC: /plug-ins
SLOC: /libgimp
Figure 23: Sloc evolution (a) and sloc evolution for selected subsystems (b) ingimp.
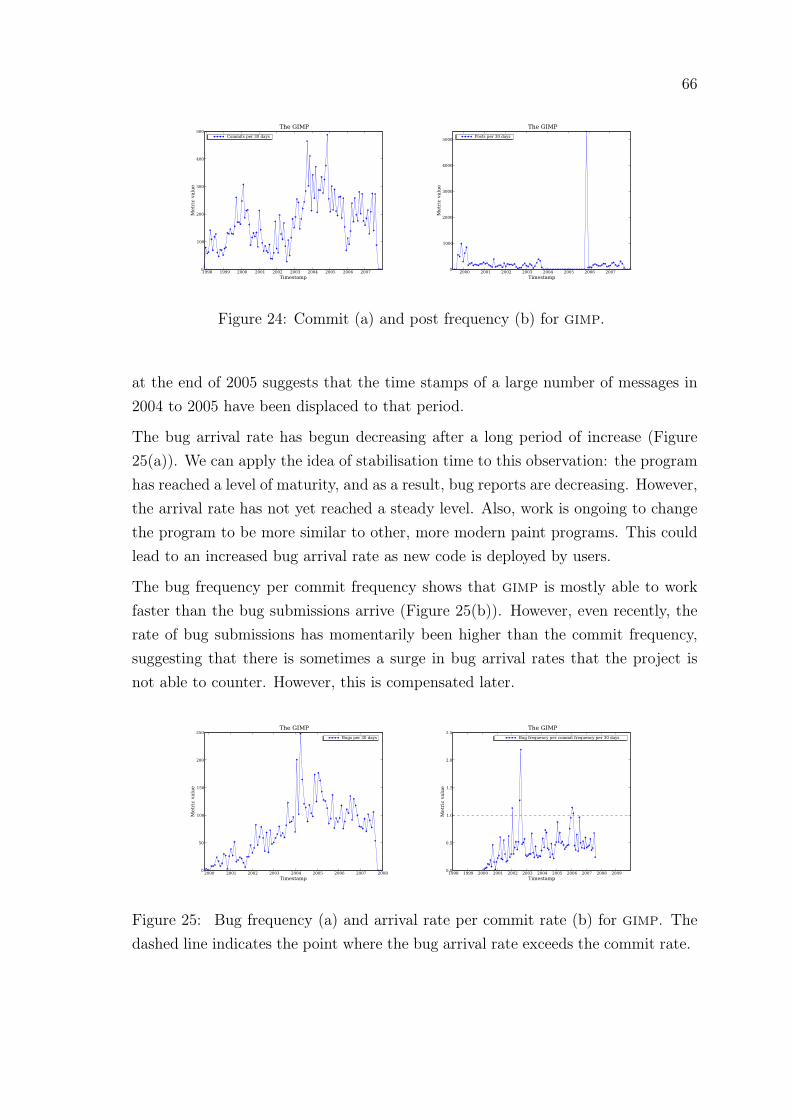
66
1998 1999 2000 2001 2002 2003 2004 2005 2006 2007
Timestamp
0
100
200
300
400
500
Metr
ic v
alu
e
The GIMP
Commits per 30 days
2000 2001 2002 2003 2004 2005 2006 2007
Timestamp
0
1000
2000
3000
4000
5000
Metr
ic v
alu
e
The GIMP
Posts per 30 days
Figure 24: Commit (a) and post frequency (b) for gimp.
at the end of 2005 suggests that the time stamps of a large number of messages in2004 to 2005 have been displaced to that period.
The bug arrival rate has begun decreasing after a long period of increase (Figure25(a)). We can apply the idea of stabilisation time to this observation: the programhas reached a level of maturity, and as a result, bug reports are decreasing. However,the arrival rate has not yet reached a steady level. Also, work is ongoing to changethe program to be more similar to other, more modern paint programs. This couldlead to an increased bug arrival rate as new code is deployed by users.
The bug frequency per commit frequency shows that gimp is mostly able to workfaster than the bug submissions arrive (Figure 25(b)). However, even recently, therate of bug submissions has momentarily been higher than the commit frequency,suggesting that there is sometimes a surge in bug arrival rates that the project isnot able to counter. However, this is compensated later.
2000 2001 2002 2003 2004 2005 2006 2007 2008
Timestamp
0
50
100
150
200
250
Metr
ic v
alu
e
The GIMP
Bugs per 30 days
1998 1999 2000 2001 2002 2003 2004 2005 2006 2007 2008 2009
Timestamp
0.0
0.5
1.0
1.5
2.0
2.5
Metr
ic v
alu
e
The GIMP
Bug frequency per commit frequency per 30 days
Figure 25: Bug frequency (a) and arrival rate per commit rate (b) for gimp. Thedashed line indicates the point where the bug arrival rate exceeds the commit rate.

67
Gimp has become more modular (Figure 26(a)). However, it may be reaching itspractical lower limit for sloc per number of modules, since the decrease in thisnumber has slowed down. The cyclomatic complexity per module reflects exactlythe same pattern, suggesting that the code itself has not become less complex, buthas been split up into more manageable parts (Figure 26(b)).
1998 1999 2000 2001 2002 2003 2004 2005 2006 2007
Timestamp
0
100
200
300
400
500
600
700
800
Metr
ic v
alu
e
The GIMP
SLOC/NOM
1998 1999 2000 2001 2002 2003 2004 2005 2006 2007
Timestamp
10
20
30
40
50
60
70
Metr
ic v
alu
e
The GIMP
CYC/NOM
Figure 26: Sloc per nom (a) and cyc per nom (b) for gimp.
Finally, the fan-in per sloc is slowly increasing while the fan-out per sloc is moreor less constant (Figure 27). This indicates that the project has not observed a needto simplify the interface of functions.
1998 1999 2000 2001 2002 2003 2004 2005 2006 2007
Timestamp
0.00
0.01
0.02
0.03
0.04
0.05
0.06
0.07
Metr
ic v
alu
e
The GIMP
FANIN/SLOCFANOUT/SLOC
Figure 27: Fan-in and fan-out per sloc for gimp.
6.4 Summary
Our experiment shows that the quality model described in Section 4 can be appliedto real foss projects. Both general software quality factors and foss-specific fac-tors contribute to the overall quality assessment in our experiment (Table 14). The

68
metric trends are either increasing or decreasing, or they follow a repeated cycle ofincrease and decrease over some time interval. In Linux, increased distribution ofdevelopment poses significant challenges, but our data shows that the project is han-dling this well. Increased discussion could be a sign of growing needs of coordination.However, the team roles have adjusted to include more hierarchical moderation. InBlender, there is a quality risk with regard to the program architecture; complexityis increasing and modularity is decreasing. The source code growth is super-linear,which may indicate that the project is undergoing heavy development compared tothe other two projects. The gimp appears to have moved to the maintenance phase,since the bug arrival rate has been decreasing for three years after a four-year periodof increase. The project may have to turn resources toward handling bug reports,especially if new features are to be introduced in the future.
Linux Linux-historical Blender The gimp
Core developers(≥ 500 commits)
18 (0.54%) 26 (1.65%) 2 (3.03%) 3 (1.27%)
Co-developers(≥ 50 commits)
213 (6.38%) 125 (7.93%) 36 (54.55%) 47 (19.92%)
Active users 1306 (93.08%) 1426 (90.42%) 28 (42.42.%) 186 (78.81%)Posters 22 236 – 733 1306
Messages 646 001 – 23 891 20 320
Growth linear linear super-linear sub-linear / linearBug submitters 4877 – 1214 3468
Bugs 8954 – 4048 7232
Total sloc4 366 435 3 361 971 596 815 560 408
(21.8.2007) (15.2.2005) (6.8.2007) (12.6.2007)
Commit fre-quency trend
cyclic cyclic slow increase cyclic
Post frequencytrend
increasing – constant constant
Bug arrival ratetrend
cyclic – increasing decreasing(after increase)
Bug frequencyper commitfrequency trend
constant low – increasing moderate constant moderate(≤ 0.25) (≤ 0.8) (≤ 1.6, most
samples ≤ 0.8)
Modularityincreasing increasing decreasing increasing
(some variation)Complexity decreasing decreasing increasing decreasing
Table 14: Summary and interpretation of experiment results.

69
7 Conclusions
We have presented a theoretical background for software quality, metrics, and theirapplication in a foss environment. We have shown that a vast amount of infor-mation is available from foss projects in three information spaces and we haveconstructed a quality model suitable for use in a foss context. Finally, we have ap-plied a subset of this model to three foss projects and highlighted both theoreticaland practical concerns in implementing automatic metric collection and analysis.
Foss projects are faced with challenges seldom seen in traditional software develop-ment projects. The scale at which many foss projects are operating belongs to thehigh end of software development in terms of participant numbers, code size, andproblem complexity. The cultural and practical barriers that have to be overcomeare significant, as are the requirements on leadership and administration. There-fore, we believe that foss projects can benefit from automatically collected datathat allows a higher-level view of progress than what is currently available.
We identify three core challenges that the foss community must overcome to im-prove quality processes. First, the tools used in foss development must be fittedwith features that allow data to be extracted in sensible formats. Currently, one ofthe most popular bug tracking systems, Bugzilla, lacks features to remotely exportthe entire bug event history in a machine-readable format. Similarly, the overheadrequired to download the entire event history from the Subversion version controlsystem is significant, as each operation requires network communication with themain server. The gcc compiler would be a natural location to place source codemetric calculation facilities, since it already implements a semantic parser for manyprogramming languages. Also, it benefits from information in the software buildsystem. Writing a completely new tool to extract all this information would be asignificant task.
Second, as foss has a low barrier to adoption of new technologies – we can safelysay that foss creates most of its own technology – metric tools for these are needed.Logic, dynamic, and interpreted languages such as Python and Ruby have enabledaccelerated development through higher expressive power, reusable code libraries,and in-language support for streamlined development and test cycles, but thereare few tools and methods to assess the complexity of programs written in theselanguages. There is also little knowledge of the architecture and design patterns thatthese languages encourage. In the same way as object-oriented design is different
70
from procedural design, these languages encourage a different cognitive approach.The quality of design cannot be assessed without further knowledge of the patternsthat these languages enable.
Finally, the foss culture has traditionally eschewed rigid processes and management-by-numbers, relying more on established experience and experimentation. In orderto introduce quality concepts and metrics-based evaluation, foss practitioners mustlearn about these and see their benefit in assisting their work. At best, foss projectswork as finely tuned engines, and any change in work flow must ensure that thereare no bottlenecks or single points of failure.
The most important factor for enabling quality in foss lies without doubt in thetransparent, publicly visible development method and the code of conduct thatencourages sharing of knowledge in all its forms. Without these traits, foss projectswould cease to experiment, their communities of users and developers would collapse,and they would become obsolete. An understanding of this value system must bepresent in any attempts to enhance the quality of Free and Open Source Softwareprojects.
References
AsB02 Asklund, U. and Bendix, L., A Study of Configuration Management inOpen Source Software Projects. IEEE Software, 149, pages 40–46.
Bou06 Bouktif, S., Antoniol, G. and Merlo, E., A feedback based quality as-sessment to support open source software evolution: the GRASS casestudy. Proceedings of the 22nd IEEE international conference on soft-ware maintenance, Washington, DC, USA, 2006, IEEE Computer So-ciety, pages 155–165.
Boe76 Boehm, B. W., Brown, J. R. and Lipow, M., Quantitative evaluationof software quality. Proceedings of the 2nd international conference onsoftware engineering, Los Alamitos, CA, USA, 1976, IEEE ComputerSociety Press, pages 592–605.
Bar05 Barcellini, F., Détienne, F., Burkhardt, J.-M. and Sack, W., Thematiccoherence and quotation practices in OSS design-oriented online dis-cussions. Proceedings of the 2005 international ACM SIGGROUP con-
71
ference on supporting group work, New York, NY, USA, 2005, ACMPress, pages 177–186.
Cro04 Crowston, K., Annabi, H., Howison, J. and Masango, C., Effective workpractices for software engineering: free/libre open source software de-velopment. Proceedings of the 2004 ACM workshop on interdisciplinarysoftware engineering research, New York, NY, USA, 2004, ACM Press,pages 18–26.
CrH06 Crowston, K. and Howison, J., Assessing the health of open sourcecommunities. IEEE Computer, 39,5(2006), pages 89–91.
ChK94 Chidamber, S. R. and Kemerer, C. F., A metrics suite for object ori-ented design. IEEE Transactions on Software Engineering, 20,6(1994),pages 476–493.
Coo82 Cook, M. L., Software metrics: an introduction and annotated bibliog-raphy. SIGSOFT Software Engineering Notes, 7,2(1982), pages 41–60.
Chr89 Christodoulakis, D., Tsalidis, C., van Gogh, C. and Stinesen, V., To-wards an automated tool for software certification. IEEE internationalworkshop on tools for artificial intelligence, Fairfax, VA, USA, 1989,IEEE, pages 670–676.
Cha06 Chan, V. K. Y., Wong, W. E. and Xie, T. F., Application of a statisti-cal methodology to simplify software quality metric models constructedusing incomplete data samples. Proceedings of the 6th international con-ference on quality software, Washington, DC, USA, 2006, IEEE Com-puter Society, pages 15–21.
DiS06 Dick, S. and Sadia, A., Fuzzy clustering of open-source software qualitydata: a case study of Mozilla. International Joint Conference on NeuralNetworks, Vancouver, BC, Canada, 2006, pages 4089–4096.
DiB04 Dinh-Trong, T. and Bieman, J. M., Open source software development:a case study of FreeBSD. Proceedings of the 10th international sym-posium on software metrics, Washington, DC, USA, 2004, IEEE Com-puter Society, pages 96–105.
DiB05 Dinh-Trong, T. and Bieman, J. M., The FreeBSD project: a replicationcase study of open source development. IEEE Transactions on Software
72
Engineering, 31,6(2005), pages 481–494. Senior Member-James M. Bie-man.
FeN00 Fenton, N. E. and Neil, M., Software metrics: roadmap. Proceedingsof the conference on the future of software engineering, New York, NY,USA, 2000, ACM Press, pages 357–370.
Fre07 Free Software Foundation Inc., The Free Software Definition, Www, 14June 2007. URL http://www.gnu.org/philosophy/free-sw.html.
Fer04 Ferenc, R., Siket, I. and Gyimothy, T., Extracting facts from opensource software. Proceedings of the 20th IEEE international conferenceon software maintenance, Washington, DC, USA, 2004, IEEE Com-puter Society, pages 60–69.
Gaf81 Gaffney, J. E. J., Metrics in software quality assurance. Proceedings ofthe ACM ’81 conference, New York, NY, USA, 1981, ACM Press, pages126–130.
Gre03 Greiner, S., Boskovič, B., Brest, J. and Žumer, V., Security issues ininformation systems based on open-source technologies. The IEEE Re-gion 8 EUROCON 2003. Computer as a Tool., 2, pages 12–15.
Gyi05 Gyimothy, T., Ferenc, R. and Siket, I., Empirical validation of object-oriented metrics on open source software for fault prediction. IEEETransactions of Software Engineering, 31,10(2005), pages 897–910.
GoT00 Godfrey, M. and Tu, Q., Evolution in open source software: A casestudy. Proceedings of the international conference on software main-tenance, Washington, DC, USA, 2000, IEEE Computer Society, page131.
GoT01 Godfrey, M. and Tu, Q., Growth, evolution, and structural change inopen source software. Proceedings of the 4th international workshopon principles of software evolution, New York, NY, USA, 2001, ACMPress, pages 103–106.
Hal75 Halstead, M. H., Toward a theoretical basis for estimating programmingeffort. Proceedings of the 1975 ACM annual conference, New York, NY,USA, 1975, ACM Press, pages 222–224.
73
HoK97 Houdek, F. and Kempter, H., Quality patterns – an approach to packag-ing software engineering experience. Proceedings of the 1997 symposiumon software reusability, New York, NY, USA, 1997, ACM Press, pages81–88.
HaO01 Hars, A. and Ou, S., Working for free? – motivations of participatingin open source projects. Proceedings of the 34th annual Hawaii interna-tional conference on system sciences, volume 7, Washington, DC, USA,2001, IEEE Computer Society, page 7014.
Hun03 Huntley, C. L., Organizational learning in open-source softwareprojects: An analysis of debugging data. IEEE Transactions on Engi-neering Management, 50,4(2003), pages 485–493.
IzB06 Izurieta, C. and Bieman, J., The evolution of FreeBSD and Linux. Pro-ceedings of the 2006 ACM/IEEE international symposium on empiricalsoftware engineering, New York, NY, USA, 2006, ACM Press, pages204–211.
IEE04 IEEE Computer Society, New York, NY, USA, IEEE Standard for aSoftware Quality Metrics Methodology (IEEE Std 1061), R2004 edition,24 June 2004.
Kaf85 Kafura, D., A survey of software metrics. Proceedings of the 1985 ACMannual conference on the range of computing: mid-80’s perspective, NewYork, NY, USA, 1985, ACM Press, pages 502–506.
KoS00 Koch, S. and Schneider, G., Results from Software Engineering Re-search into Open Source Development Projects Using Public Data.Discussion paper for Tätigkeitsfeld Informationsverarbeitung und In-formationswirtschaft, Wirtschaftsuniversität Wien, 2000.
Kho95 Khoshgoftaar, T. M., Szabo, R. M. and Guasti, P. J., Exploring thebehaviour of neural network software quality models. Software Engi-neering Journal, 10, pages 89–96.
Li05 Li, P. L., Herbsleb, J. and Shaw, M., Finding predictors of field defectsfor open source software systems in commonly available data sources:a case study of OpenBSD. Proceedings of the 11th IEEE internationalsoftware metrics symposium, Washington, DC, USA, 2005, IEEE Com-puter Society, page 32.
74
Lin04 Lindman, J., Effects of open source software on the business patterns ofsoftware industry. Master’s thesis, Helsinki School of Economics, 2004.
Leh97 Lehman, M. M., Ramil, J. F., Wernick, P. D., Perry, D. E. and Turski,W. M., Metrics and laws of software evolution - the nineties view. Pro-ceedings of the 4th international symposium on software metrics, Wash-ington, DC, USA, 1997, IEEE Computer Society, page 20.
Lan05 Langelier, G., Sahraoui, H. and Poulin, P., Visualization-based analy-sis of quality for large-scale software systems. Proceedings of the 20thIEEE/ACM international conference on automated software engineer-ing, New York, NY, USA, 2005, ACM Press, pages 214–223.
Liu07 Liu, Y., Yao, J.-F., Williams, G. and Adkins, G., Studying softwaremetrics based on real-world software systems. Journal of Computing inSmall Colleges, 22,5(2007), pages 55–61.
MäM06 Mäki-Asiala, P. and Matinlassi, M., Quality assurance of open sourcecomponents: Integrator point of view. Proceedings of the 30th annualinternational computer software and applications conference, Washing-ton, DC, USA, 2006, IEEE Computer Society, pages 189–194.
Mas05 Massey, B., Longitudinal analysis of long-timescale open source repo-sitory data. Proceedings of the 2005 workshop on predictor models insoftware engineering, New York, NY, USA, 2005, ACM Press, pages1–5.
Moc02 Mockus, A., Fielding, R. T. and Herbsleb, J. D., Two case studies ofopen source software development: Apache and Mozilla. ACM Trans-actions on Software Engineering and Methodology, 11,3(2002), pages309–346.
Mic05a Michlmayr, M., Hunt, F. and Probert, D., Quality practices and prob-lems in free software projects. Proceedings of the First InternationalConference on Open Source Systems, Scotto, M. and Succi, G., editors,Genova, Italy, 2005, pages 24–28.
Mic05b Michlmayr, M., Quality improvement in volunteer free softwareprojects: Exploring the impact of release management. Proceedingsof the First International Conference on Open Source Systems, Scotto,M. and Succi, G., editors, Genova, Italy, 2005, pages 309–310.

75
Mic05c Michlmayr, M., Software process maturity and the success of free soft-ware projects. Software Engineering: Evolution and Emerging Tech-nologies, Zielinski, K. and Szmuc, T., editors, Krakow, Poland, 2005,IOS Press, pages 3–14.
Mic07 Michlmayr, M., Quality Improvement in Volunteer Free and OpenSource Software Projects: Exploring the Impact of Release Manage-ment. Ph.D. thesis, University of Cambridge, March 2007.
Nag04 Nagappan, N., Toward a software testing and reliability early warn-ing metric suite. Proceedings of the 26th international conference onsoftware engineering, Washington, DC, USA, 2004, IEEE ComputerSociety, pages 60–62.
Nag05 Nagappan, N., Williams, L., Vouk, M. and Osborne, J., Early estima-tion of software quality using in-process testing metrics: a controlledcase study. Proceedings of the third workshop on software quality, NewYork, NY, USA, 2005, ACM Press, pages 1–7.
Nak02 Nakakoji, K., Yamamoto, Y., Nishinaka, Y., Kishida, K. and Ye, Y.,Evolution patterns of open-source software systems and communities.Proceedings of the international workshop on principles of software evo-lution, New York, NY, USA, 2002, ACM Press, pages 76–85.
Ola92 Olagunju, A. O., Concepts of operational software quality metrics. Pro-ceedings of the 1992 ACM annual conference on communications, NewYork, NY, USA, 1992, ACM Press, pages 301–308.
Ope07 Open Source Initiative, The Open Source Definition, Www, 14 June2007. URL http://www.opensource.org/docs/osd.
Oga96 Ogasawara, H., Yamada, A. and Kojo, M., Experiences of softwarequality management using metrics through the life-cycle. Proceedings ofthe 18th international conference on software engineering, Washington,DC, USA, 1996, IEEE Computer Society, pages 179–188.
PhA05 Phadke, A. A. and Allen, E. B., Predicting risky modules in open-sourcesoftware for high-performance computing. Proceedings of the secondinternational workshop on software engineering for high performancecomputing system applications, New York, NY, USA, 2005, ACM Press,pages 60–64.
76
Pol04 Polančič, G., Horvat, R. V. and Rozman, T., Comparative assessmentof open source software using easy accessible data. Proceedings of the26th international conference on information technology interfaces, vol-ume 1, Slovenia, 2004, Faculty of Electrical Engineering and ComputerScience, Maribor University, pages 673–678.
Rob06 Robles, G., Gonzalez-Barahona, J. M., Michlmayr, M. and Amor, J. J.,Mining large software compilations over time: another perspective ofsoftware evolution. Proceedings of the 2006 international workshop onmining software repositories, New York, NY, USA, 2006, ACM Press,pages 3–9.
Roy87 Royce, W. W., Managing the development of large software systems:concepts and techniques. Proceedings of the 9th international confer-ence on software engineering, Los Alamitos, CA, USA, 1987, IEEEComputer Society Press, pages 328–338. Reprinted from Proceedings,IEEE Wescon, August 1970, pages 1-9.
Roy90 Royce, W., Pragmatic quality metrics for evolutionary software devel-opment models. Proceedings of the conference on TRI-ADA ’90, NewYork, NY, USA, 1990, ACM Press, pages 551–565.
Sch02 Schneidewind, N. F., Body of knowledge for software quality measure-ment. IEEE Computer, 35,2(2002), pages 77–83.
ShJ06 Sharma, V. S. and Jalote, P., Stabilization time - a quality metric forsoftware products. Proceedings of the 17th international symposiumon software reliability engineering, Washington, DC, USA, 2006, IEEEComputer Society, pages 45–51.
Sto90 Stockman, S. G., Todd, A. R. and Robinson, G. A., A Frameworkfor Software Quality Measurement. IEEE Journal on selected areas incommunications, 8,2(1990), pages 224–233.
TaY05 Tamura, Y. and Yamada, S., Comparison of software reliability assess-ment methods for open source software. Proceedings of the 11th in-ternational conference on parallel and distributed systems – workshops,Washington, DC, USA, 2005, IEEE Computer Society, pages 488–492.
77
Vis97 Visaggio, G., Structural information as a quality metric in softwaresystems organization. Proceedings of the International Conference onSoftware Maintenance. IEEE, 1997, pages 92–99.
WeB06 van Wendel de Joode, R. and de Bruijne, M., The organization of opensource communities: Towards a framework to analyze the relationshipbetween openness and reliability. Proceedings of the 39th annual hawaiiinternational conference on system sciences, Washington, DC, USA,2006, IEEE Computer Society, page 118.2.
WaH88 Wake, S. A. and Henry, S. M., A model based on software qualityfactors which predicts maintainability. Technical Report, Departmentof Computer Science, Virginia Tech, Blacksburg, VA, USA, 1988.
ZhD05 Zhou, Y. and Davis, J., Open source software reliability model: anempirical approach. Proceedings of the fifth workshop on open sourcesoftware engineering, New York, NY, USA, 2005, ACM Press, pages1–6.