on the right track: measuring tracking efficiency in...
TRANSCRIPT

Morningstar ETF Research
February 2013
Authors:Ben Johnson, Director, Global Passive Fund ResearchHortense Bioy, CFA, Director, European Passive Fund ResearchAlastair Kellett, CFA, CAIA, International ETF AnalystLee Davidson, ETF Analyst
On The Right Track:Measuring Tracking Efficiency in ETFs

©2013 Morningstar. All rights reserved. The information, data, analyses, and opinions contained herein (1) are proprietary to Morningstar, Inc. and its affiliates (collectively, “Morningstar”), (2) may not be copied or redistributed, (3) do not constitute investment advice offered by Morningstar (4) are provided solely for informational purposes and therefore are not an offer to buy or sell a security, and (5) are not warranted to be accurate, complete, or timely. Certain information may be self-reported by the investment vehicle and not subject to independent verification. Morningstar shall not be responsible for any trading decisions, damages, or other losses resulting from, or related to, this information, data, analyses or opinions or their use. Past performance is no guarantee of future results.
2
Contents
Executive Summary 3
Foreword 4
Defining Common Metrics: Tracking Error 5
Defining Common Metrics: Tracking Difference 9
How Well Are These Trackers Tracking? 10
A Better Mousetrap? Morningstar’s Estimated Holding Cost 22
Appendix 1—Methodology 29
Appendix 2—Historical Cumulative Tracking Difference 31
On The Right Track: Measuring Tracking Efficiency in ETFsFebruary 2013
©2013 Morningstar. All rights reserved. The information, data, analyses, and opinions contained herein (1) are proprietary to Morningstar, Inc. and its affiliates (collectively, “Morningstar”), (2) may not be copied or redistributed, (3) do not constitute investment advice offered by Morningstar (4) are provided solely for informational purposes and therefore are not an offer to buy or sell a security, and (5) are not warranted to be accurate, complete, or timely. Certain information may be self-reported by the investment vehicle and not subject to independent verification. Morningstar shall not be responsible for any trading decisions, damages, or other losses resulting from, or related to, this information, data, analyses or opinions or their use. Past performance is no guarantee of future results.
3
Tracking error and tracking difference can vary considerably over time and are very sensitive to the time horizon that is selected for their calculation.
Morningstar proposes an alternative approach to measuring ETFs’ tracking efficiency for buy and hold investors. Like tracking difference, Morningstar’s Estimated Holding Cost (EHC) metric seeks to measure the realised performance of an ETF relative to its benchmark after all holding expenses and revenues are taken into account. By virtue of using a larger number of data points for its calculation, however, Estimated Holding Cost offers a smoother and more reliable estimation of an ETF’s tracking performance than tracking difference.
We believe that investors would benefit from a harmonised approach to calculating tracking error beyond the definition already provided by ESMA in its final guidelines on ETFs and other UCITS. In the absence of a standard methodology for tracking error, the choice of calculation will be, in many cases, left at the discretion of the provider and investors will be forced to compare numbers across funds based on different and sometimes self-serving methodologies.
While all the tracking metrics we discuss in this paper are important to consider when evaluating an ETF, they are not the only metrics that investors should look at. Other key factors to assess are factors affecting trading costs such as commissions and bid-ask spreads, product and index construction, counterparty risk, and tax considerations, among others.
Executive Summary
Beginning in 2013, providers of index tracking UCITS will be required by European regulation to disclose predictions of their funds’ tracking error and tracking difference, the two most popular ways of measuring replication quality. Providers will also have to explain any divergence between their predictions and the funds’ actual performance.
The purpose of this study is to examine the factors that influence tracking error and tracking difference, and to apply those metrics to a selection of 65 Exchange Traded Funds (ETFs) linked to eight popular equity indices.
Our first key finding is that, generally speaking, the ETFs we studied have done a very good job of limiting tracking error.
We also found that, in the majority of cases, ETFs using synthetic replication produced lower tracking error than those using physical replication. However, there was less of a direct relationship between tracking difference and a fund’s replication method.
Looking at the relationship between Total Expense Ratio (TER) and tracking difference, we found that a fund’s TER is an important factor in determining its performance relative to its benchmark, but not the only determinant. Other factors such as securities lending income, cash drag, tax optimisation, rebalancing costs for physical ETFs and swap fees for synthetic ETFs can all impact a fund’s relative performance.
While it is often assumed that high tracking error means poor relative performance and low tracking error means good relative performance, our study shows that it is not necessarily the case. In fact, though there is a relationship between tracking error and tracking difference, it is not a particularly strong one.

On The Right Track: Measuring Tracking Efficiency in ETFsFebruary 2013
©2013 Morningstar. All rights reserved. The information, data, analyses, and opinions contained herein (1) are proprietary to Morningstar, Inc. and its affiliates (collectively, “Morningstar”), (2) may not be copied or redistributed, (3) do not constitute investment advice offered by Morningstar (4) are provided solely for informational purposes and therefore are not an offer to buy or sell a security, and (5) are not warranted to be accurate, complete, or timely. Certain information may be self-reported by the investment vehicle and not subject to independent verification. Morningstar shall not be responsible for any trading decisions, damages, or other losses resulting from, or related to, this information, data, analyses or opinions or their use. Past performance is no guarantee of future results.
4
This new requirement will allow for greater scrutiny of the ability of fund managers to deliver on their promises. But it doesn’t come without challenges. One of them is the computation of these measures. While ESMA provided clear definitions of tracking error and tracking difference, it stopped short of imposing a common computation method. In the absence of a standard methodology, the choice of calculation for tracking error will be left at the discretion of the provider and/or local regulators in the country where the funds are domiciled and/or distributed.
The purpose of this study is to first examine the two most popular ways of measuring replication quality, namely tracking error and tracking difference. After defining these measures and discussing the factors that influence them, we will analyse the historical tracking ability of 65 ETFs linked to eight popular equity indices. In total, this sample represents roughly 37% of the assets invested in European-domiciled equity ETFs and 21% of the assets invested in all European-domiciled exchange-traded products (ETPs).
After defining these metrics and measuring our sample against them, we propose an alternative approach to measuring these funds’ tracking efficiency. Similar to tracking difference, Morningstar’s Estimated Holding Cost metric seeks to measure the realised performance of an ETF relative to its benchmark index after all holding expenses are taken into account, excluding ETF trading costs. We believe that, in essence, the Estimated Holding Cost offers a smoother and more reliable estimation of an ETF’s tracking performance for long term investors.
Foreword
Exchange-traded funds (ETFs) are, with the exception of certain actively managed products, designed to track the performance of an index. While this concept is easy to understand, putting it into practice is far more difficult than it seems. While indices are typically replicable in theory, index returns are an unattainable ideal, as they ignore the practicalities of portfolio construction and ongoing management. Investors need to be aware of these realities and manage their expectations accordingly. There will always be factors involved in the replication process that will cause mis-tracking.
There are numerous ways to evaluate how well an ETF tracks its benchmark index. The method of choice will ultimately vary on a case-by-case basis and depends primarily on an investor’s objectives and time horizon.
In an effort to harmonise the reporting of index-tracking UCITS’s performance across Europe, the European Securities and Markets Authorities (ESMA) recently set forth new rules pertaining to tracking error and tracking difference, the two most popular measures of tracking performance. Based on ESMA’s final guidelines on ETFs and other UCITS issued in July 2012, beginning in 2013, providers of index-tracking UCITS will be required to disclose ex-ante predictions of their funds’ tracking error and tracking difference in funds’ annual and semi-annual reports. They will also have to explain any divergence between these ex-ante figures and the funds’ actual performance over the relevant period.
On The Right Track: Measuring Tracking Efficiency in ETFsFebruary 2013
©2013 Morningstar. All rights reserved. The information, data, analyses, and opinions contained herein (1) are proprietary to Morningstar, Inc. and its affiliates (collectively, “Morningstar”), (2) may not be copied or redistributed, (3) do not constitute investment advice offered by Morningstar (4) are provided solely for informational purposes and therefore are not an offer to buy or sell a security, and (5) are not warranted to be accurate, complete, or timely. Certain information may be self-reported by the investment vehicle and not subject to independent verification. Morningstar shall not be responsible for any trading decisions, damages, or other losses resulting from, or related to, this information, data, analyses or opinions or their use. Past performance is no guarantee of future results.
5
Defining Common Metrics
Tracking ErrorTracking error is often cited as one of the most important considerations when selecting an ETF. It measures the quality of index replication, i.e. how well a fund manager replicates the performance of a specific index. Investors typically expect their ETF to adhere tightly to an index.
Different industry participants define tracking error in different ways. Some use the term to refer to the absolute difference in returns between an ETF and its benchmark over a period of time. In other words, they view it as a simple arithmetic exercise where the performance of the benchmark is subtracted from the fund’s performance, with the difference representing “tracking error”. While this definition is easy to understand, it is not the most widely recognised way of calculating tracking error and is fraught with issues. For our purposes, we will refer to the result of this simple arithmetic as an ETF’s “tracking difference”, which we will examine in more detail shortly.
As it is more commonly defined, tracking error is a measure of the standard deviation of a fund’s excess returns. In this context, excess returns refer to the absolute difference between the fund’s performance and that of its benchmark. This is congruent with the definition that ESMA and IOSCO (International Organisation of Securities Commissions) communicated in their latest consultation papers on the subject: ESMA’s consultation paper states that tracking error is “the volatility of the difference of the returns of the fund and of the returns of the index.”
Lower tracking error is indicative of more consistency in the periodic deviations between the return of the fund and that of its benchmark. Said differently, the higher a fund’s tracking error the more likely it is to out- or underperform its benchmark in any single period.
Indices representing certain segments of the market are inherently more difficult for managers of ETFs and other index funds to track than others. This is particularly the case in those instances where the benchmark in question has a very large number of constituents or when the index’s components are illiquid or otherwise difficult to access. For example, as we will see in the next section, ETFs
tracking emerging market equities tend to exhibit higher tracking error than those based on developed market large cap indices like the DAX or the S&P 500.
Sources of Tracking ErrorWhen it comes to index-tracking funds, tracking error is a risk, i.e. a risk that the fund’s performance will diverge from that of its benchmark. When this occurs, it is crucial to understand why. Tracking error can be caused by many factors, and some are more likely than others to cause mis-tracking because of their unstable, non-recurring nature. Here is a list of the key factors influencing tracking error.
Transaction and Rebalancing CostsRebalancing costs are typically incurred by physical replication ETFs when an index’s methodology requires a reweighting of its constituents or when market events force the rebalancing of a fund. Other transaction costs like stamp duties can increase rebalancing costs.
Synthetic ETFs are not directly affected by transaction and rebalancing costs. The level of index turnover will be taken into consideration in the negotiation of the swap’s price. Transaction and rebalancing costs could also manifest themselves as a premium between the ETF’s market price and its net asset value in secondary market trading.
Cash DragCash drag can result from periods when funds are forced to hold a portion of their portfolio in cash. This may occur during index rebalancing or be a result of the fund’s dividend (or coupon) distribution policy. In the case that an index changes composition, for a physical replication ETF there may be a time lag between the liquidation of the index’s old constituents and the addition of its new constituents. During this span, the fund will hold cash.
Also, for those ETFs that regularly distribute income to shareholders, there can often be a lag between the time when the ETF receives dividends or coupon payments from its underlying holdings and the time that it ultimately distributes this income to its own investors. Between these dates, which can last from a few days to a few months, the pending distribution sits in an interest bearing account instead of being reinvested in the constituents of the benchmark index. In some cases, depending on the underlying index, the dividend income may be reinvested in futures contracts linked to the fund’s benchmark in order

On The Right Track: Measuring Tracking Efficiency in ETFs
February 2013
©2013 Morningstar. All rights reserved. The information, data, analyses, and opinions contained herein (1) are proprietary to Morningstar, Inc. and its affiliates (collectively, “Morningstar”), (2) may not be copied or redistributed, (3) do not constitute investment advice offered by Morningstar (4) are provided solely for informational purposes and therefore are not an offer to buy or sell a security, and (5) are not warranted to be accurate, complete, or timely. Certain information may be self-reported by the investment vehicle and not subject to independent verification. Morningstar shall not be responsible for any trading decisions, damages, or other losses resulting from, or related to, this information, data, analyses or opinions or their use. Past performance is no guarantee of future results.
6
to limit cash drag. It is important to note that physical replication ETFs that capitalise income and synthetic ETFs are not affected by the timing of distribution payments.
In both of the cases outlined above, the difference in returns between the fund’s cash position and its underlying index can generate a cash drag over the period before the cash is either reinvested or distributed to shareholders. Cash drag will cause the fund to underperform its benchmark in the case that the index rises at a greater rate than the rate earned on cash during this time. Likewise it will cause the fund to outperform its benchmark in the event that its benchmark index falls during this time.
Funds with a high level of turnover and income-oriented funds with high distribution levels are most susceptible to cash drag.
Differing Dividend Reinvestment AssumptionsDifferences in the dividend reinvestment assumptions between the index and the fund can also lead to tracking error. For instance, while the index may assume an immediate reinvestment of dividends on ex-dividend dates, a physical replication fund will have to wait to receive the cash dividend and reinvest it.
Also, in the case of synthetic ETFs, the underlying total return swap(s) might not be based on the same assumptions and calculations as the reference index. For example, a fund’s NAV may be calculated on a total return basis but benchmarked against a price return index or a price return index plus dividends. The discrepancy between the two can be a source of tracking error.
Dividend TaxationThe tax treatment of dividends and coupon payments received by an ETF may differ from that assumed in its benchmark index’s calculation, leading to another potential source of tracking friction. Some indices—typically Gross Total Return indices—assume that dividends are reinvested without any tax deduction, but the fund will be liable for tax on dividend distributions. Conversely, other indices—typically the Net Total Return indices—assume a withholding tax is paid on dividends, but in practice, either some portion of or all of this tax can be reclaimed by the ETF’s manager at its source jurisdiction, provided that there is a branch office in the country where the tax is levied. This activity, known as tax optimisation or dividend
tax enhancement, can boost a fund’s return relative to its benchmark, but it can also increase its tracking error.
Both physical and synthetic replication ETFs can be affected by tax optimisation. In the case of ETFs employing physical replication, this activity will be carried out at the fund level, directly impacting fund returns, while in the case of synthetic ETFs, it will be implemented at the level of the bank(s) standing behind the swap(s) embedded in the fund, thereby indirectly impacting fund returns. The bank(s) providing the swap(s) can decide whether or not to pass on any revenues from dividend tax enhancements within the framework of the swap agreement between the fund manager and the swap providers.
Securities LendingPhysical replication ETFs can lend securities from their portfolios to generate incremental revenue that can help to reduce the negative impact of costs like the total expense ratio (TER) on a fund’s performance relative to its benchmark. The revenues earned by a fund engaged in this activity will vary over time according to changes in the level of lending activity within the fund and market lending rates. As such, securities lending can reduce or increase tracking error.
It is important to bear in mind that this return enhancement activity doesn’t come without risk. Securities lending introduces counterparty risk which has to be mitigated. For a more detailed examination of this practice, see our report Securities Lending in Physical Replication ETFs: A Review of Providers’ Practices.
In the case of ETFs employing synthetic replication, securities lending is rarely carried out at the fund level. Rather, it is more often undertaken outside the fund by the swap counterparty. The bank providing the swap may lend the securities of its hedging baskets, i.e. those that the bank bought to hedge the exposure it has committed to deliver to the fund. The revenues derived from this practice can help the bank to cover the costs relating to the swap and/or reduce expenses charged to ETF shareholders. In this case, the risk of a borrower default is directly assumed by the bank, not the fund.

On The Right Track: Measuring Tracking Efficiency in ETFs
February 2013
©2013 Morningstar. All rights reserved. The information, data, analyses, and opinions contained herein (1) are proprietary to Morningstar, Inc. and its affiliates (collectively, “Morningstar”), (2) may not be copied or redistributed, (3) do not constitute investment advice offered by Morningstar (4) are provided solely for informational purposes and therefore are not an offer to buy or sell a security, and (5) are not warranted to be accurate, complete, or timely. Certain information may be self-reported by the investment vehicle and not subject to independent verification. Morningstar shall not be responsible for any trading decisions, damages, or other losses resulting from, or related to, this information, data, analyses or opinions or their use. Past performance is no guarantee of future results.
7
Sampling The manner in which physical replication ETFs seek to replicate their benchmark can be a substantial source of tracking error. For instance, a physical replication fund that tracks a benchmark containing a number of small, illiquid components may use “sampling” techniques to replicate the returns of its reference index. Sampling involves investing in a select basket of only the largest and most liquid components of the benchmark index in an effort to improve the overall liquidity of the fund itself (it makes the ETF shares easier and cheaper for market makers to hedge or create) and to minimise costs. While sampling has some obvious advantages, by virtue of excluding some of the smaller, less liquid components of a fund’s reference index, it creates another potential source of tracking error as the fund could stray from its benchmark. In market stressed events, such replication technique may produce significant tracking error.
Variable Swap SpreadsProviders of synthetic ETFs commit to deliver the performance of a reference index through the use of total return swap agreements which are regularly renegotiated. These swap spreads depend on various factors, including the costs borne by the swap provider in hedging its exposure, the cost of collateral, and any revenue generated from techniques such as securities lending and tax optimisation. The absolute level of swap fees will not directly impact the tracking error to the extent that it is constant from one period to the next, but changes in swap spreads will have an impact on synthetic ETFs’ tracking error.
Total Expense RatioThe Total Expense Ratio (TER) is an annual expense charged to the fund to cover costs ranging from index licensing to custodial fees. This charge is deducted from a fund’s NAV on a daily basis. TER is often mistakenly cited as the biggest source of tracking error. But tracking error only results if TER varies over time, which happens rather infrequently. Because tracking error is a measure of volatility, it is not affected by revenues and costs that remain constant over the calculation’s time period.
TER will directly impact tracking difference though. For example, a fund that charges a TER of 0.15% and suffers no other sources of return deviation would have a tracking error of zero but a tracking difference of 0.15%. The same can be said about swap spreads. For example, a synthetic ETF with a TER of 0.15% and a swap spread of 0.20% that is reviewed every year could claim to have a 1 year-tracking error of zero during the year when its swap spread is fixed. Its tracking difference, however, would be 0.35%.
Operational RisksTracking error, as the name suggests, can also come from errors in the construction or management of the fund, such as execution-related errors that result in the wrong quantity of a security being bought or sold in the case of physical replication ETFs.
Is There a Relationship Between Replication Method and Tracking Error?As we will see in the next section, the choice of replication method (physical or synthetic) has an impact on tracking error. Synthetic ETFs typically offer superior tracking to physical ETFs. Tracking error is minimised by the fact that the fund’s return is guaranteed by a bank through a total return swap rather than being derived from a full or sampled physical portfolio of the reference index’s underlying components. For this same reason, synthetic ETFs are also generally less expensive to run (they don’t incur trading costs, experience cash drag, etc.), and these cost savings are in turn often shared with fund holders in the form of lower total expense ratios. However, there is no such thing as a free lunch. Improved tracking and lower fees come at the expense of counterparty exposure. Investors should ask themselves if they are being adequately compensated for assuming this additional source of risk.

On The Right Track: Measuring Tracking Efficiency in ETFs
February 2013
©2013 Morningstar. All rights reserved. The information, data, analyses, and opinions contained herein (1) are proprietary to Morningstar, Inc. and its affiliates (collectively, “Morningstar”), (2) may not be copied or redistributed, (3) do not constitute investment advice offered by Morningstar (4) are provided solely for informational purposes and therefore are not an offer to buy or sell a security, and (5) are not warranted to be accurate, complete, or timely. Certain information may be self-reported by the investment vehicle and not subject to independent verification. Morningstar shall not be responsible for any trading decisions, damages, or other losses resulting from, or related to, this information, data, analyses or opinions or their use. Past performance is no guarantee of future results.
8
Numerous Calculation MethodologiesAs previously mentioned, the most widely used calculation for tracking error is the annualised standard deviation of the return differences between a fund and its benchmark1.
If a fund’s tracking error is 0.50%, we can say that the fund’s annual return is expected to be within +/- 0.50% of its average deviation from the index return with 68% confidence and within +/- 1% of its average deviation from the index return with 95% confidence.
It is important to realise that the calculation of tracking error can result in different values depending on a variety of factors which include but are not limited to: The frequency of observations, i.e. whether daily, weekly or monthly data is used The day chosen as the starting point for the calculation when weekly data is used, i.e. whether weekly returns are calculated from Friday to Friday, Monday to Monday, etc., or also whether weekly average data is usedThe time period, i.e. whether tracking error is calculated over one, three or five years, or longer
As of today, ETF providers are at liberty to adjust any of these parameters when calculating and publishing tracking error, unless a standard methodology is imposed by the regulator of the country where the fund is domiciled. For example in France, the AMF requires the disclosure of an ex-post tracking error based on the standard deviation of weekly return differences. However, there is currently no obligation for funds domiciled in Luxembourg and Ireland—two prominent UCITS hubs— to disclose ex-post tracking error, and no recommended methodology for its calculation has so far been put forth by their national regulators. Consequently, in the case of Luxembourg and Ireland domiciled funds, providers are free to choose the methodology they want. For example, in some of its fund documentation, iShares publishes tracking error based on daily data, although in practice the firm, like others, is happy to provide clients with different results based on their preferred methodology. Elsewhere, in its ETF factsheets, Credit Suisse ETF publishes tracking error based on monthly data.
Suffice it to say that there is no one best way of measuring tracking error. The best metric ultimately depends on each investor’s profile and objective. Certain investors may prefer one frequency of data over another depending on their investment horizon and the length of a fund’s history.
Specifically, looking at daily data over a short time period might be more appropriate for someone who trades these funds frequently, while weekly or monthly data over a few years’ horizon might be more relevant for a long term investor, provided that the number of data points is sufficient to make the calculation statistically meaningful.
That said, we believe that investors would benefit from a standard approach to calculating tracking error beyond the definition already provided by ESMA. This would allow investors to make direct like-for-like comparisons between European index tracking funds, even if some investors (most likely institutional investors) will always prefer to use their own calculation methods to suit their investment needs. Without a common way of calculating tracking error, investors will be forced to compare numbers across funds domiciled in various Member States based on different and sometimes self-serving methodologies.
Challenges in Calculating Tracking ErrorAccurately measuring tracking error can be challenging for fund providers and investors alike. One of the challenges they face relates to data issues. The sheer volume of data necessary to compute tracking error leaves ample room for errors.
In addition to mistakes in the calculation or reporting of the fund’s NAV, there could be issues posed by holidays, missing or misaligned data, outliers, rounding, etc. Because these factors can distort results significantly, it is important to ensure that the data series provided are accurate, complete and aligned. All told, an unusually high level of tracking error can often be attributed to data errors.
Another challenge when measuring tracking error is choosing the right benchmark index for the calculation. For instance, a fund whose NAV is calculated on a total return basis, i.e. including reinvested dividends, should be compared to a total return index. Comparing it to a price return index would result in different, and most likely meaningless, tracking error numbers. Sometimes, both fund NAV and index data need adjusting, as we have done in a few cases for the purpose of this study. It is equally important that the ETF NAV and index data are expressed in the same currency.
1. There are other approaches to calculating tracking error put forth by academic studies and used by investors but these are beyond the scope of this paper.
r
r
r

On The Right Track: Measuring Tracking Efficiency in ETFsFebruary 2013
©2013 Morningstar. All rights reserved. The information, data, analyses, and opinions contained herein (1) are proprietary to Morningstar, Inc. and its affiliates (collectively, “Morningstar”), (2) may not be copied or redistributed, (3) do not constitute investment advice offered by Morningstar (4) are provided solely for informational purposes and therefore are not an offer to buy or sell a security, and (5) are not warranted to be accurate, complete, or timely. Certain information may be self-reported by the investment vehicle and not subject to independent verification. Morningstar shall not be responsible for any trading decisions, damages, or other losses resulting from, or related to, this information, data, analyses or opinions or their use. Past performance is no guarantee of future results.
9
Defining Common Metrics
Tracking DifferenceWhen evaluating the tracking quality of an ETF, tracking error is not the only metric investors should look at. One limitation of tracking error is that it doesn’t capture the actual magnitude of underperformance or outperformance of an ETF. For this, investors should also look at tracking difference, also known as performance difference.
Tracking difference is simply the annualised difference between a fund’s actual return and its benchmark return over a specific period of time. A small tracking difference indicates that the ETF has done a good job matching its index over the period in question.
Tracking difference is usually negative, meaning that the ETF underperforms its benchmark. This is a logical
What Matters More to Whom?The question we often hear from investors is what matters more, tracking error or tracking difference? Again, the answer mainly depends on the type of investor, their investment objective and investment horizon. Buy-and-hold investors, because they generally focus on maximising return while minimising costs, do not need to be as
outcome. Assuming otherwise perfect tracking, an ETF should underperform its benchmark by an amount equal to its total expense ratio on an annual basis. For reasons we will explore later, an ETF’s tracking difference can also be positive, in which case the ETF has outperformed its benchmark.
What are the Sources of Tracking Difference?Tracking difference is caused by the same factors as tracking error, i.e. transaction and rebalancing costs, cash drag, dividend taxation, securities lending, swap spreads, etc. But the biggest factor influencing tracking difference is the fund’s total expense ratio (TER). The TER is also the most predictable and readily quantifiable source of tracking difference for both physical and synthetic ETFs.
The various factors affecting tracking difference are mostly negative, but some can be positive. We outline the impact of these factors on an individual basis in the table below.
concerned about tracking error as short-term investors. For these long-term investors, tracking difference is the more appropriate metric to consider. Asset managers concerned with tracking an index precisely by mandate or for hedging purposes will see tracking error as an important metric to monitor.
Figure 1
Direct Sources of Tracking Difference (Impact: Positive / Negative)
Sources Physical ETFs Synthetic ETFs
TER Negative Negative
Transaction and Rebalancing Costs Negative N/A*
Cash Drag Negative / Positive N/A*
Dividend Taxation Negative / Positive N/A*
Dividend Reinvestment Assumptions Negative / Positive Negative / Positive
Securities Lending Positive N/A*
Swap Spread N/A Negative / Positive**
Sampling Negative / Positive N/A
*Factors embedded in swap pricing. **Depending on the underlying index, the swap provider may decide to pass on all or part of the revenues generated from return enhancement techniques to the fund, sometimes resulting in negative swap spreads, i.e. a gain for the fund (in terms of its performance relative to its benchmark) rather than a cost.

On The Right Track: Measuring Tracking Efficiency in ETFsFebruary 2013
©2013 Morningstar. All rights reserved. The information, data, analyses, and opinions contained herein (1) are proprietary to Morningstar, Inc. and its affiliates (collectively, “Morningstar”), (2) may not be copied or redistributed, (3) do not constitute investment advice offered by Morningstar (4) are provided solely for informational purposes and therefore are not an offer to buy or sell a security, and (5) are not warranted to be accurate, complete, or timely. Certain information may be self-reported by the investment vehicle and not subject to independent verification. Morningstar shall not be responsible for any trading decisions, damages, or other losses resulting from, or related to, this information, data, analyses or opinions or their use. Past performance is no guarantee of future results.
10
Table 1
Tracking Error for FTSE 100 ETFs
Fund Replication Method Daily Tracking Error % Weekly Tracking Error %
Amundi ETF FTSE 100-GBP Synthetic 0.03 0.02
ComStage ETF FTSE 100 TR Synthetic 0.02 0.01
CS ETF (IE) on FTSE 100 Physical – Full 0.09 0.09
db x-trackers FTSE 100 Synthetic 0.02 0.02
HSBC FTSE 100 ETF Physical – Full 0.04 0.04
iShares FTSE 100 (DE) Physical – Full 0.24 0.24
iShares FTSE 100 (IE) Physical – Full 0.04 0.03
Lyxor ETF FTSE 100 Synthetic 0.10 0.10
Source FTSE 100 ETF Synthetic 0.02 0.02
UBS-ETF FTSE 100 SF A Synthetic 0.02 0.01
Average FTSE 100 ETF 0.06 0.06
Average Physical Replicator 0.10
Average Synthetic Replicator 0.03
Annualised calculations from 14/07/2010 to 28/09/2012
How Well Are These Trackers Tracking?
ETFs Track WellWe have found from our research that, generally speaking, tracking error has been limited amongst the ETFs that we studied. On average, ETFs tracking the FTSE 100, DAX, MSCI Japan, and S&P 500 indices exhibited annualised tracking error of about 4–7 basis points over the measurement periods. These were followed by funds based on the MSCI World Index (which had an average TE of 11 basis points), MSCI Brazil (average TE of 13 bps) and the EURO STOXX 50 (average TE of 21 bps). And perhaps
unsurprisingly, it is amongst the MSCI Emerging Markets ETFs that we see meaningfully higher annualised tracking error, averaging 0.81% across our sample.
Synthetic Replication Offers Superior TrackingWhat we have also found is that in general, ETFs using synthetic replication produced lower tracking error than those using physical replication. In the case of seven out of the eight benchmarks we studied, synthetic funds’ average annualised tracking error was on average 30 basis points lower than that of their physically replicated counterparts. In the eighth case, those ETFs tracking the S&P 500 index, the physical replication funds had average tracking error equal to the synthetics’ average.
In Table 1, it is worth highlighting the significant difference in tracking error between the iShares FTSE 100 (DE) and iShares FTSE 100 (IE). This difference relates to the unique investment and operational aspects of the fund platforms
in the two domiciles. This difference can be explained by varying degrees of futures usage to equitise cash exposure, securities lending activity, and withholding taxes between the Irish and German regimes.

On The Right Track: Measuring Tracking Efficiency in ETFsFebruary 2013
©2013 Morningstar. All rights reserved. The information, data, analyses, and opinions contained herein (1) are proprietary to Morningstar, Inc. and its affiliates (collectively, “Morningstar”), (2) may not be copied or redistributed, (3) do not constitute investment advice offered by Morningstar (4) are provided solely for informational purposes and therefore are not an offer to buy or sell a security, and (5) are not warranted to be accurate, complete, or timely. Certain information may be self-reported by the investment vehicle and not subject to independent verification. Morningstar shall not be responsible for any trading decisions, damages, or other losses resulting from, or related to, this information, data, analyses or opinions or their use. Past performance is no guarantee of future results.
11
Table 2
Tracking Error for S&P 500 ETFs
Fund Replication Method Daily Tracking Error % Weekly Tracking Error %
Amundi ETF S&P 500-USD Synthetic 0.13 0.06
ComStage ETF S&P 500 Synthetic 0.11 0.08
CS ETF (IE) on S&P 500 Physical – Full 0.04 0.04
db x-trackers S&P 500 TR 1C Synthetic 0.02 0.02
EasyETF S&P 500 USD Synthetic 0.04 0.05
HSBC S&P 500 ETF Physical – Full 0.05 0.05
iShares S&P 500 (Acc) (IE) Physical – Full 0.04 0.03
Lyxor ETF S&P 500 B USD Synthetic 0.03 0.03
Source S&P 500 ETF Synthetic 0.02 0.01
UBS ETFs plc - S&P 500 SF (USD) A-acc Synthetic 0.02 0.02
Average S&P 500 ETF 0.05 0.04
Average Physical Replicator 0.05
Average Synthetic Replicator 0.05
Annualised calculations from 16/12/2010 to 28/09/2012
Table 3
Tracking Error for DAX ETFs
Fund Replication Method Daily Tracking Error % Weekly Tracking Error %
ComStage ETF DAX Synthetic 0.01 0.01
db x-trackers DAX ETF Synthetic 0.02 0.02
ETFlab DAX Acc Physical – Full 0.04 0.03
iShares DAX (DE) Physical – Full 0.05 0.05
Lyxor ETF DAX Synthetic 0.09 0.09
Average DAX ETF 0.04 0.04
Average Physical Replicator 0.05
Average Synthetic Replicator 0.04
Annualised calculations from 01/07/2010 to 28/09/2012

On The Right Track: Measuring Tracking Efficiency in ETFs
February 2013
©2013 Morningstar. All rights reserved. The information, data, analyses, and opinions contained herein (1) are proprietary to Morningstar, Inc. and its affiliates (collectively, “Morningstar”), (2) may not be copied or redistributed, (3) do not constitute investment advice offered by Morningstar (4) are provided solely for informational purposes and therefore are not an offer to buy or sell a security, and (5) are not warranted to be accurate, complete, or timely. Certain information may be self-reported by the investment vehicle and not subject to independent verification. Morningstar shall not be responsible for any trading decisions, damages, or other losses resulting from, or related to, this information, data, analyses or opinions or their use. Past performance is no guarantee of future results.
12
Table 4
Tracking Error for EURO STOXX 50 ETFs
Fund Replication Method Daily Tracking Error % Weekly Tracking Error %
Amundi ETF EURO STOXX 50 (C) Synthetic 0.20 0.16
ComStage ETF EURO STOXX 50 NR Synthetic 0.14 0.18
CS ETF (IE) on EURO STOXX 50 Physical – Full 0.17 0.15
db x-trackers EURO STOXX 50 ETF 1C Synthetic 0.07 0.11
EasyETF Euro Stoxx 50 B Physical – Full 0.17 0.20
ETFlab EURO STOXX 50 Physical – Full 0.51 0.49
HSBC EURO STOXX 50 ETF Physical – Full 0.14 0.18
iShares Euro STOXX 50 (IE) Physical – Full 0.17 0.15
iShares Euro STOXX 50 (DE) Physical – Full 0.55 0.52
Lyxor ETF EURO STOXX 50 D Synthetic 0.15 0.18
Source EURO STOXX 50 ETF Synthetic 0.05 0.05
UBS-ETF EURO STOXX 50 I Physical – Full 0.16 0.18
Average EURO STOXX 50 ETF 0.21 0.21
Average Physical Replicator 0.27
Average Synthetic Replicator 0.12
Annualised calculations from 29/01/2010 to 28/09/2012
Table 5
Tracking Error for MSCI World ETFs
Fund Replication Method Daily Tracking Error % Weekly Tracking Error %
Amundi ETF MSCI World-USD Synthetic 0.05 0.03
ComStage ETF MSCI World Synthetic 0.02 0.02
CS ETF (IE) on MSCI World Physical – Sampling 0.11 0.13
db x-trackers MSCI World TRN Index 1C Synthetic 0.03 0.02
HSBC MSCI World ETF Physical – Sampling 0.39 0.38
iShares MSCI World (Acc) (IE) Physical – Sampling 0.25 0.24
Lyxor ETF MSCI World B Synthetic 0.03 0.03
Source MSCI World ETF Synthetic 0.02 0.01
UBS-ETF MSCI World A Physical – Sampling 0.13 0.08
Average MSCI World ETF 0.11 0.10
Average Physical Replicator 0.22
Average Synthetic Replicator 0.03
Annualised calculations from 01/02/2011 to 28/09/2012
The tracking error for those ETFs following the EURO STOXX 50 index was fairly high on a relative basis, in part due to the use of enhancement techniques that led many of these funds to outperform their benchmark. We will examine this phenomenon in more detail later in this section of the report.
As we previously discussed in the case of the two iShares FTSE 100 ETFs, the difference in tracking error between the iShares Euro Stoxx 50 (IE) and iShares Euro Stoxx 50 (DE) relate to the unique investment and operational aspects of the fund platforms in the two different domiciles.

On The Right Track: Measuring Tracking Efficiency in ETFs
February 2013
©2013 Morningstar. All rights reserved. The information, data, analyses, and opinions contained herein (1) are proprietary to Morningstar, Inc. and its affiliates (collectively, “Morningstar”), (2) may not be copied or redistributed, (3) do not constitute investment advice offered by Morningstar (4) are provided solely for informational purposes and therefore are not an offer to buy or sell a security, and (5) are not warranted to be accurate, complete, or timely. Certain information may be self-reported by the investment vehicle and not subject to independent verification. Morningstar shall not be responsible for any trading decisions, damages, or other losses resulting from, or related to, this information, data, analyses or opinions or their use. Past performance is no guarantee of future results.
13
Table 6
Tracking Error for MSCI Emerging Markets ETFs
Fund Replication Method Daily Tracking Error % Weekly Tracking Error %
Amundi ETF MSCI Emerging Markets-USD Synthetic 0.35 0.27
CS ETF (Lux) on MSCI Emerging Markets A Physical – Sampling 1.91 1.50
db x-trackers MSCI Emerg Mkts TRN 1C Synthetic 0.10 0.25
ETFlab MSCI Emerging Markets Synthetic 0.09* 0.04
iShares MSCI Emerging Markets (Acc) (IE) Physical – Sampling 1.66 1.07
Lyxor ETF MSCI Emerging Markets D-USD Synthetic 0.23 0.23
Source MSCI Emerging Markets ETF Synthetic 0.09 0.24
UBS-ETF MSCI Emerging Markets A Physical – Sampling 1.74 0.98
Average MSCI Emerging Markets ETF 0.77 0.57
Average Physical Replicator 1.77
Average Synthetic Replicator 0.17
Annualised calculations from 21/12/2010 to 28/09/2012
*The ETFlab MSCI Emerging Markets ETF aims to track a midday price for the index that corresponds with the time at which the NAV of the fund is struck, rather than the official closing price of the index. For our tracking error calculation of this fund, we have therefore used those same midday index prices to calculate benchmark performance.
*
In general, the higher levels of tracking error in physical replication ETFs tracking the MSCI Emerging Markets index stem from a combination of factors, including the number and the illiquidity of the underlying constituents. When a security is illiquid, there may be differences between its price as observed in the calculation of the index and the level at which a tracking portfolio can actually transact a buy or sell order for that security.
Moreover, physical emerging markets funds typically use optimised sampling techniques, whereby they hold a basket of securities designed to match the characteristics of the benchmark but not the exact securities in the exact weights. Again, optimised sampling is typically employed in situations where the index has fairly illiquid constituents, a large number of index members, or where there exist legal and regulatory barriers to owning certain securities. The very nature of this technique is
imprecise, and it follows that it can lead to higher tracking error. The same is true of the replication techniques typically used in funds that physically replicate the MSCI World index, which helps to explain why physical replicators in that group showed, on average, 19 basis points of additional annual tracking error than their synthetic counterparts.
An additional factor potentially affecting the tracking efficiency of physical replication funds tracking the MSCI Emerging Markets index is that many of these funds, instead of buying and selling the underlying local securities, trade American Depositary Receipts (ADRs) or Global Depositary Receipts (GDRs). Listed on large U.S. or European exchanges, ADRs and GDRs are designed to mirror the ownership of a company’s domestic stock listing. Any deviation between these proxies and their local parents will contribute to tracking error in the ETF.
On The Right Track: Measuring Tracking Efficiency in ETFs
February 2013
©2013 Morningstar. All rights reserved. The information, data, analyses, and opinions contained herein (1) are proprietary to Morningstar, Inc. and its affiliates (collectively, “Morningstar”), (2) may not be copied or redistributed, (3) do not constitute investment advice offered by Morningstar (4) are provided solely for informational purposes and therefore are not an offer to buy or sell a security, and (5) are not warranted to be accurate, complete, or timely. Certain information may be self-reported by the investment vehicle and not subject to independent verification. Morningstar shall not be responsible for any trading decisions, damages, or other losses resulting from, or related to, this information, data, analyses or opinions or their use. Past performance is no guarantee of future results.
14
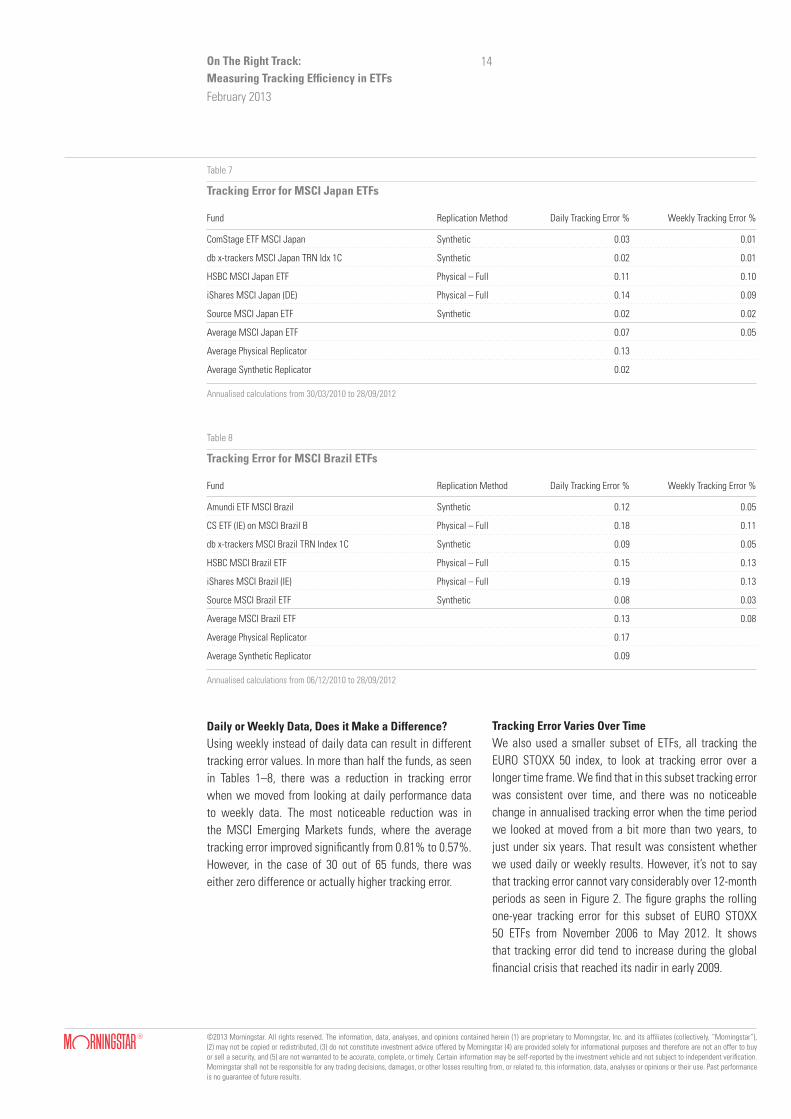
Table 7
Tracking Error for MSCI Japan ETFs
Fund Replication Method Daily Tracking Error % Weekly Tracking Error %
ComStage ETF MSCI Japan Synthetic 0.03 0.01
db x-trackers MSCI Japan TRN Idx 1C Synthetic 0.02 0.01
HSBC MSCI Japan ETF Physical – Full 0.11 0.10
iShares MSCI Japan (DE) Physical – Full 0.14 0.09
Source MSCI Japan ETF Synthetic 0.02 0.02
Average MSCI Japan ETF 0.07 0.05
Average Physical Replicator 0.13
Average Synthetic Replicator 0.02
Annualised calculations from 30/03/2010 to 28/09/2012
Table 8
Tracking Error for MSCI Brazil ETFs
Fund Replication Method Daily Tracking Error % Weekly Tracking Error %
Amundi ETF MSCI Brazil Synthetic 0.12 0.05
CS ETF (IE) on MSCI Brazil B Physical – Full 0.18 0.11
db x-trackers MSCI Brazil TRN Index 1C Synthetic 0.09 0.05
HSBC MSCI Brazil ETF Physical – Full 0.15 0.13
iShares MSCI Brazil (IE) Physical – Full 0.19 0.13
Source MSCI Brazil ETF Synthetic 0.08 0.03
Average MSCI Brazil ETF 0.13 0.08
Average Physical Replicator 0.17
Average Synthetic Replicator 0.09
Annualised calculations from 06/12/2010 to 28/09/2012
Daily or Weekly Data, Does it Make a Difference?Using weekly instead of daily data can result in different tracking error values. In more than half the funds, as seen in Tables 1–8, there was a reduction in tracking error when we moved from looking at daily performance data to weekly data. The most noticeable reduction was in the MSCI Emerging Markets funds, where the average tracking error improved significantly from 0.81% to 0.57%. However, in the case of 30 out of 65 funds, there was either zero difference or actually higher tracking error.
Tracking Error Varies Over TimeWe also used a smaller subset of ETFs, all tracking the EURO STOXX 50 index, to look at tracking error over a longer time frame. We find that in this subset tracking error was consistent over time, and there was no noticeable change in annualised tracking error when the time period we looked at moved from a bit more than two years, to just under six years. That result was consistent whether we used daily or weekly results. However, it’s not to say that tracking error cannot vary considerably over 12-month periods as seen in Figure 2. The figure graphs the rolling one-year tracking error for this subset of EURO STOXX 50 ETFs from November 2006 to May 2012. It shows that tracking error did tend to increase during the global financial crisis that reached its nadir in early 2009.

On The Right Track: Measuring Tracking Efficiency in ETFs
February 2013
©2013 Morningstar. All rights reserved. The information, data, analyses, and opinions contained herein (1) are proprietary to Morningstar, Inc. and its affiliates (collectively, “Morningstar”), (2) may not be copied or redistributed, (3) do not constitute investment advice offered by Morningstar (4) are provided solely for informational purposes and therefore are not an offer to buy or sell a security, and (5) are not warranted to be accurate, complete, or timely. Certain information may be self-reported by the investment vehicle and not subject to independent verification. Morningstar shall not be responsible for any trading decisions, damages, or other losses resulting from, or related to, this information, data, analyses or opinions or their use. Past performance is no guarantee of future results.
15
Table 9
Long-Term Tracking Error
Fund Daily Tracking Error % Weekly Tracking Error % Monthly Tracking Error %
Since Nov 2006 Since Feb 2010 Since Nov 2006 Since Feb 2010 Since Nov 2006
EasyETF Euro Stoxx 50 B 0.21 0.17 0.22 0.20 0.33
iShares Euro STOXX 50 (IE) 0.17 0.17 0.12 0.15 0.17
iShares Euro STOXX 50 (DE) 0.48 0.55 0.45 0.52 0.48
Lyxor ETF EURO STOXX 50 D 0.15 0.15 0.18 0.18 0.30
UBS-ETF EURO STOXX 50 I 0.14 0.16 0.16 0.18 0.18
Average 0.23 0.24 0.23 0.25 0.29
Annualised calculations to 28/09/2012
EasyETF iShares DE (Adj.) iShares IE (Adj.) Lyxor (Adj.) UBS (Adj.)
05/11/07 21/04/08 06/10/08 23/03/09 07/09/09 22/02/10 09/08/10 24/01/11 11/07/11 26/12/11 28/09/12
0.7
0.6
0.5
0.4
0.3
0.2
0.1
0.0
Figure 2
Rolling One-Year Tracking Error For a Subset of EURO STOXX 50 ETFs
For this subset of funds we also examined monthly tracking error, which would have been difficult over the shorter time-frame due to a paucity of data points. What we found was that, similar to moving from daily to weekly data, there was generally no reduction in observed tracking error when we ran the numbers on a monthly basis. Of the
five ETFs comprising the subset, three showed the same or slightly lower tracking error on a monthly basis, but the other two exhibited higher monthly tracking error than weekly or daily. On average the group’s monthly tracking error was higher than its weekly and daily tracking error over the same period.

On The Right Track: Measuring Tracking Efficiency in ETFs
February 2013
©2013 Morningstar. All rights reserved. The information, data, analyses, and opinions contained herein (1) are proprietary to Morningstar, Inc. and its affiliates (collectively, “Morningstar”), (2) may not be copied or redistributed, (3) do not constitute investment advice offered by Morningstar (4) are provided solely for informational purposes and therefore are not an offer to buy or sell a security, and (5) are not warranted to be accurate, complete, or timely. Certain information may be self-reported by the investment vehicle and not subject to independent verification. Morningstar shall not be responsible for any trading decisions, damages, or other losses resulting from, or related to, this information, data, analyses or opinions or their use. Past performance is no guarantee of future results.
16
Tracking DifferenceWhat we found from the research on tracking difference— the absolute level of annual out- or underperformance of each ETF relative to its benchmark—is that it tends to vary considerably depending on the reference index involved. While one can expect an ETF to produce returns that lag its benchmark, it is not always the case.
An example of this can be seen in ETFs tracking the EURO STOXX 50 index which have exhibited a well-documented tendency to outperform their benchmark. As shown in the table below, the twelve EURO STOXX 50 ETFs we examined were able, on average, to outperform their benchmark by 0.47% per year over the last two years through the end of September. In addition to the EURO STOXX 50, the S&P 500 was another index whose ETFs managed on average to outshine it, though only just.
Unsurprisingly, MSCI Emerging Markets ETFs exhibited the highest underperformance with an average tracking difference of -0.95% per year.
In Tables 10–17, we have listed the annual tracking difference for all the funds in our study. In Appendix 1, we have graphed the tracking difference through time for the ETFs tracking all eight benchmarks. Note that within each index grouping the date range is the same, but across benchmarks the data has varying start dates. Although in all cases the tracking difference is shown as an annualised figure, the compounding nature of the metric means that comparing the level of tracking difference from one group to another is not strictly speaking an apples-to-apples assessment. Our choice of time period in each case reflects a balance between going as far back in time as possible, and including as many funds as we could.
The Curious Case of EURO STOXX 50 ETFsMuch of the outperformance of ETFs tracking the EURO STOXX 50 can be explained by the choice of benchmark. The ‘Net Return’ version of the index, against which we have measured these funds, assumes certain withholding taxes on the dividends paid by the index’s constituents. In practice, many physical ETFs, by virtue of their country of domicile and double tax treaties, can achieve lower withholding tax rates than those assumed by the index, creating a built-in degree of outperformance. Alternatively, a fund can reduce its tax bill by lending out certain securities whenever dividend dates come around to counterparties located in more tax-efficient jurisdictions.
Synthetic ETFs can also benefit from such practice, known as dividend tax optimisation, but it is typically carried out by the swap counterparty outside the fund, with some portion of the enhancements transferred to the benefit of the fund.
The outperformance of many of these EURO STOXX 50 ETFs, which does after all represent a deviation from the reference index, helps to explain their higher average tracking error vis-à-vis the ETFs tracking other benchmarks we’ve included in our study (see Table 1), particularly as the outperformance has tended to come in bursts around May of each year as a result of dividend optimisation techniques previously described.
Table 10
Tracking Difference for EURO STOXX 50 ETFs
Fund Replication Method TER % Tracking Difference %
Amundi ETF EURO STOXX 50 (C) Synthetic 0.15 0.43
ComStage ETF EURO STOXX 50 NR Synthetic 0.10 0.52
CS ETF (IE) on EURO STOXX 50 Physical – Full 0.20 0.23
db x-trackers Euro STOXX 50 ETF 1C Synthetic 0.00 0.44
EasyETF Euro Stoxx 50 B Physical – Full 0.45 0.57
ETFlab EURO STOXX 50 Physical – Full 0.15 0.91
HSBC EURO STOXX 50 ETF Physical – Full 0.15 0.60
iShares Euro STOXX 50 (IE) Physical – Full 0.35 0.45
iShares Euro STOXX 50 (DE) Physical – Full 0.16 0.58
Lyxor ETF EURO STOXX 50 D Synthetic 0.25 0.48
Source EURO STOXX 50 ETF Synthetic 0.15 -0.05
UBS-ETF EURO STOXX 50 I Physical – Full 0.15 0.49
Average EURO STOXX 50 ETF 0.47
Average Physical Replicator 0.55
Average Synthetic Replicator 0.36
Annualised calculations from 29/01/2010 to 28/09/2012

On The Right Track: Measuring Tracking Efficiency in ETFs
February 2013
©2013 Morningstar. All rights reserved. The information, data, analyses, and opinions contained herein (1) are proprietary to Morningstar, Inc. and its affiliates (collectively, “Morningstar”), (2) may not be copied or redistributed, (3) do not constitute investment advice offered by Morningstar (4) are provided solely for informational purposes and therefore are not an offer to buy or sell a security, and (5) are not warranted to be accurate, complete, or timely. Certain information may be self-reported by the investment vehicle and not subject to independent verification. Morningstar shall not be responsible for any trading decisions, damages, or other losses resulting from, or related to, this information, data, analyses or opinions or their use. Past performance is no guarantee of future results.
17
Table 11
Tracking Difference for FTSE 100 ETFs
Fund Replication Method TER % Tracking Difference %
Amundi ETF FTSE 100-GBP Synthetic 0.25 -0.31
ComStage ETF FTSE 100 TR Synthetic 0.25 -0.30
CS ETF (IE) on FTSE 100 Physical – Full 0.33 -0.53
db x-trackers FTSE 100 Synthetic 0.30 -0.36
HSBC FTSE 100 ETF Physical – Full 0.35 -0.44
iShares FTSE 100 (DE) Physical – Full 0.51 -0.74
iShares FTSE 100 (IE) Physical – Full 0.40 -0.48
Lyxor ETF FTSE 100 Synthetic 0.30 -0.49
Source FTSE 100 ETF Synthetic 0.20 -0.54
UBS-ETF FTSE 100 SF A Synthetic 0.30 -0.37
Average FTSE 100 ETF -0.46
Average Physical Replicator -0.55
Average Synthetic Replicator -0.39
Annualised calculations from 14/07/2010 to 28/09/2012
Table 12
Tracking Difference for DAX ETFs
Fund Replication Method TER % Tracking Difference %
ComStage ETF DAX Synthetic 0.12 -0.16
db x-trackers DAX ETF Synthetic 0.15 -0.25
ETFlab DAX Acc Physical – Full 0.15 -0.09
iShares DAX (DE) Physical – Full 0.16 -0.25
Lyxor ETF DAX Synthetic 0.15 -0.40
Average DAX ETF -0.23
Average Physical Replicator -0.17
Average Synthetic Replicator -0.27
Annualised calculations from 01/07/2010 to 28/09/2012

On The Right Track: Measuring Tracking Efficiency in ETFs
February 2013
©2013 Morningstar. All rights reserved. The information, data, analyses, and opinions contained herein (1) are proprietary to Morningstar, Inc. and its affiliates (collectively, “Morningstar”), (2) may not be copied or redistributed, (3) do not constitute investment advice offered by Morningstar (4) are provided solely for informational purposes and therefore are not an offer to buy or sell a security, and (5) are not warranted to be accurate, complete, or timely. Certain information may be self-reported by the investment vehicle and not subject to independent verification. Morningstar shall not be responsible for any trading decisions, damages, or other losses resulting from, or related to, this information, data, analyses or opinions or their use. Past performance is no guarantee of future results.
18
Table 13
Tracking Difference for S&P 500 ETFs
Fund Replication Method TER % Tracking Difference %
Amundi ETF S&P 500-USD Synthetic 0.15 -0.06
ComStage ETF S&P 500 Synthetic 0.18 -0.14
CS ETF (IE) on S&P 500 Physical – Full 0.20 0.14
db x-trackers S&P 500 TR 1C Synthetic 0.20 0.17
EasyETF S&P 500 USD Synthetic 0.20 0.14
HSBC S&P 500 ETF Physical – Full 0.09 0.29
iShares S&P 500 (Acc) (IE) Physical – Full 0.40 -0.09
Lyxor ETF S&P 500 B USD Synthetic 0.20 -0.05
Source S&P 500 ETF Synthetic 0.20 -0.15
UBS ETFs plc - S&P 500 SF (USD) A-acc Synthetic 0.10 -0.07
Average S&P 500 ETF 0.02
Average Physical Replicator 0.11
Average Synthetic Replicator -0.02
Annualised calculations from 16/12/2010 to 28/09/2012
Table 14
Tracking Difference for MSCI Emerging Markets ETFs
Fund Replication Method TER % Tracking Difference %
Amundi ETF MSCI Emerging Markets-USD Synthetic 0.45 -0.69
CS ETF (Lux) on MSCI Emerging Markets A Physical – Sampling 0.68 -1.29
db x-trackers MSCI Emerg Mkts TRN 1C Synthetic 0.65 -0.87
ETFlab MSCI Emerging Markets Synthetic 0.38 -0.87
iShares MSCI Emerging Markets (Acc) (IE) Physical – Sampling 0.75 -0.67
Lyxor ETF MSCI Emerging Markets D-USD Synthetic 0.65 -1.08
Source MSCI Emerging Markets ETF Synthetic 0.45 -1.01
UBS-ETF MSCI Emerging Markets A Physical – Sampling 0.70 -1.14
Average MSCI Emerging Markets ETF -0.95
Average Physical Replicator -1.03
Average Synthetic Replicator -0.91
Annualised calculations from 21/12/2010 to 28/09/2012
Funds tracking the S&P 500, many of which have shown positive tracking difference, may also have been able to outperform the benchmark thanks to tax optimisation. S&P Dow Jones Indices assumes a withholding tax rate of 30% for the U.S. market.

On The Right Track: Measuring Tracking Efficiency in ETFs
February 2013
©2013 Morningstar. All rights reserved. The information, data, analyses, and opinions contained herein (1) are proprietary to Morningstar, Inc. and its affiliates (collectively, “Morningstar”), (2) may not be copied or redistributed, (3) do not constitute investment advice offered by Morningstar (4) are provided solely for informational purposes and therefore are not an offer to buy or sell a security, and (5) are not warranted to be accurate, complete, or timely. Certain information may be self-reported by the investment vehicle and not subject to independent verification. Morningstar shall not be responsible for any trading decisions, damages, or other losses resulting from, or related to, this information, data, analyses or opinions or their use. Past performance is no guarantee of future results.
19
Table 15
Tracking Difference for MSCI World ETFs
Fund Replication Method TER % Tracking Difference %
Amundi ETF MSCI World-USD Synthetic 0.38 -0.31
ComStage ETF MSCI World Synthetic 0.40 -0.22
CS ETF (IE) on MSCI World Physical – Sampling 0.40 -0.19
db x-trackers MSCI World TRN Index 1C Synthetic 0.45 -0.19
HSBC MSCI World ETF Physical – Sampling 0.35 -0.03
iShares MSCI World (Acc) (IE) Physical – Sampling 0.50 -0.36
Lyxor ETF MSCI World B Synthetic 0.45 -0.28
Source MSCI World ETF Synthetic 0.45 -0.48
UBS-ETF MSCI World A Physical – Sampling 0.45 -0.27
Average MSCI World ETF -0.26
Average Physical Replicator -0.21
Average Synthetic Replicator -0.30
Annualised calculations from 01/02/2011 to 28/09/2012
Table 16
Tracking Difference for MSCI Japan ETFs
Fund Replication Method TER % Tracking Difference %
ComStage ETF MSCI Japan Synthetic 0.45 -0.42
db x-trackers MSCI Japan TRN Idx 1C Synthetic 0.50 -0.47
HSBC MSCI Japan ETF Physical – Full 0.40 -0.43
iShares MSCI Japan (DE) Physical – Full 0.59 -0.52
Source MSCI Japan ETF Synthetic 0.40 -0.59
Average MSCI Japan ETF -0.49
Average Physical Replicator -0.47
Average Synthetic Replicator -0.49
Annualised calculations from 30/03/2010 to 28/09/2012
Table 17
Tracking Difference for MSCI Brazil ETFs
Fund Replication Method TER % Tracking Difference %
Amundi ETF MSCI Brazil Synthetic 0.55 -0.42
CS ETF (IE) on MSCI Brazil B Physical – Full 0.65 -0.47
db x-trackers MSCI Brazil TRN Index 1C Synthetic 0.65 -0.66
HSBC MSCI Brazil ETF Physical – Full 0.60 -0.45
iShares MSCI Brazil (IE) Physical – Full 0.74 -0.54
Source MSCI Brazil ETF Synthetic 0.65 -0.92
Average MSCI Brazil ETF -0.58
Average Physical Replicator -0.49
Average Synthetic Replicator -0.67
Annualised calculations from 06/12/2010 to 28/09/2012
On The Right Track: Measuring Tracking Efficiency in ETFs
February 2013
©2013 Morningstar. All rights reserved. The information, data, analyses, and opinions contained herein (1) are proprietary to Morningstar, Inc. and its affiliates (collectively, “Morningstar”), (2) may not be copied or redistributed, (3) do not constitute investment advice offered by Morningstar (4) are provided solely for informational purposes and therefore are not an offer to buy or sell a security, and (5) are not warranted to be accurate, complete, or timely. Certain information may be self-reported by the investment vehicle and not subject to independent verification. Morningstar shall not be responsible for any trading decisions, damages, or other losses resulting from, or related to, this information, data, analyses or opinions or their use. Past performance is no guarantee of future results.
20
Does One Replication Method Offer Higher Returns?Whereas tracking error was consistently lower in synthetic ETFs, there was less of a direct relationship between tracking difference and a fund’s replication method. In the case of four out of the eight indices we examined—those tracking the DAX, MSCI World, MSCI Japan, and MSCI Brazil—physical funds had, on average, tighter absolute tracking difference (meaning less underperformance or less outperformance relative to the benchmark) than the synthetic funds tracking the same index. In the other four cases, synthetic funds showed tighter tracking difference.
Is There a Relationship Between Tracking Difference and TER?The level of a fund’s fees is often assumed to have a significant impact on its level of tracking difference, given that fees and expenses detract from a fund’s performance but not that of the benchmark index. Indeed, we found in our study some relationship between total expense ratio (TER) and tracking difference. The two sets of values exhibited a correlation of 71% and a coefficient of determination, R2, of 0.505, implying that just over 50% of a fund’s tracking difference could be explained by its TER. Hence a fund’s fees are an important factor in determining its tracking difference, but not the only determinant.
Other factors such as securities lending income, cash drag, tax optimisation, rebalancing costs for physical ETFs and swap fees for synthetic ETFs can all impact a fund’s relative performance. An example of the nuanced relationship between cost and performance can be seen in the case of db x-trackers EURO STOXX 50 ETF, which has a well-publicised TER of 0.00%, yet exhibited below-average benchmark outperformance over the period in question, when compared with peers that are, on the surface, costlier.
What’s in the Cards for Securities Lending?Revenue from securities lending can make a meaningful contribution to a fund’s net return by partially, or in some cases completely, offsetting the TER. As we have previously discussed, however, securities lending is but one factor among several others.
New guidelines published by the European Securities and Markets Authority (ESMA) in 2012 have called for fund companies to return all net profits from securities lending
to unit holders. That change may have the effect of adding more to the net fund return, if lending activity remains constant; or it may cause fund providers to curtail their lending activity if the economics are not as favourable for them. Because of the way the new rules were written, they do not technically compel a change in the portion of lending revenue that flows to investors, so it is also possible there will be no major impact from the guidelines.
Tracking Error vs. Tracking Difference: Don’t Get Your Signals CrossedAlso worth noting is the relationship between tracking error and tracking difference. Tracking error can be used to develop a degree of confidence in predicting tracking difference. It is often assumed that a high amount of tracking error means that the fund has performed poorly relative to its benchmark, but it is not necessarily the case. In fact, a high tracking error doesn’t necessarily imply anything about the magnitude of tracking difference over a given time period.
A good case in point is the iShares MSCI Emerging Markets. The fund exhibited above average tracking error but also the lowest tracking difference of the group, underperforming the index by just 67 basis points per year (compared with the group average tracking difference of -0.95%). Conversely, the ETFlab Euro STOXX 50 ETF had one of the highest levels of tracking error compared with its peers, but also the highest tracking difference.
At the same time, a low tracking error doesn’t necessarily imply a low tracking difference (in absolute terms), as shown in Figure 3. For example, Source FTSE 100 ETF exhibited extremely tight tracking error of 2 basis points per year, but also underperformed its peers with a tracking difference of -0.54%, compared with an average for the group of -0.46%.
An analysis of the correlation between daily tracking error and the absolute level of tracking difference across all 65 funds in the study yields a result of 0.55, implying that there is some relationship between the two but that it is not particularly strong.

On The Right Track: Measuring Tracking Efficiency in ETFs
February 2013
©2013 Morningstar. All rights reserved. The information, data, analyses, and opinions contained herein (1) are proprietary to Morningstar, Inc. and its affiliates (collectively, “Morningstar”), (2) may not be copied or redistributed, (3) do not constitute investment advice offered by Morningstar (4) are provided solely for informational purposes and therefore are not an offer to buy or sell a security, and (5) are not warranted to be accurate, complete, or timely. Certain information may be self-reported by the investment vehicle and not subject to independent verification. Morningstar shall not be responsible for any trading decisions, damages, or other losses resulting from, or related to, this information, data, analyses or opinions or their use. Past performance is no guarantee of future results.
21
Figure 3
Absolute Tracking Difference Plotted Against Tracking Error* for Our Selected ETFs
1.00.50.0 1.5 2.0
Tracking Error %
Tracking Difference %
1.5
1.2
0.9
0.6
0.3
0.0
*Based on daily data
How Stable is Tracking Difference Over Time?Tracking difference tends to vary over time and is very sensitive to the time horizon that is selected. The figure below graphs the rolling one-year tracking difference for the subset of EURO STOXX 50 ETFs that we selected earlier. It shows that tracking difference can indeed fluctuate considerably over time.
In the case of EURO STOXX 50 ETFs, these fluctuations can partially be attributed to dividend tax optimisation
(typically occurring in April–May) that lends an element of seasonality to this particular time-series. However, even if we were to control for seasonality here (i.e. compare the one-year tracking difference from April of one year to April of the next), we still observe substantial volatility. Upon examining other ETFs in our sample, we find that this phenomenon is not confined strictly to the case of EURO STOXX 50 ETFs, but is in fact pervasive across all tracking difference time-series we have collected for this study.

On The Right Track: Measuring Tracking Efficiency in ETFs
February 2013
©2013 Morningstar. All rights reserved. The information, data, analyses, and opinions contained herein (1) are proprietary to Morningstar, Inc. and its affiliates (collectively, “Morningstar”), (2) may not be copied or redistributed, (3) do not constitute investment advice offered by Morningstar (4) are provided solely for informational purposes and therefore are not an offer to buy or sell a security, and (5) are not warranted to be accurate, complete, or timely. Certain information may be self-reported by the investment vehicle and not subject to independent verification. Morningstar shall not be responsible for any trading decisions, damages, or other losses resulting from, or related to, this information, data, analyses or opinions or their use. Past performance is no guarantee of future results.
22
EasyETF iShares DE (Adj.) UBS (Adj.)iShares IE (Adj.) Lyxor
05/11/07 21/04/08 06/10/08 23/03/09 07/09/09 22/02/10 09/08/10 24/01/11 11/07/11 07/06/12 28/09/1226/12/11
1.2%
1.0
0.8
0.6
0.4
0.2
0.0
-0.2
Figure 4
Rolling One-Year Tracking Difference for a Subset of EURO STOXX 50 ETFs
A Better Mousetrap? Morningstar’s Estimated Holding CostAs evidenced above, one drawback of tracking difference is its instability over time. This is due to the fact that its calculation relies on only one set of returns over a certain period of time to make a judgement about an ETF’s ability to deliver its index’s performance.
Morningstar proposes a more robust approach by taking into account a larger number of data points. Our methodology is based on twenty sets of trailing one-year returns derived from the prior twenty trading days. We then calculate twenty return ratios between the fund and its benchmark, and take the geometric average of these twenty return ratios. The result is a smoothed, annualised estimation of the ETF’s divergence from its index over a year. Morningstar has named this proprietary data point “Estimated Holding Cost”.
Like tracking difference, Morningstar’s Estimated Holding Cost accounts for all the estimated cost components of
holding an ETF such as total expense ratio, rebalancing costs, cash drag, securities lending revenues, swap fees, etc., while excluding costs associated with buying and selling the ETF.
Although we believe that Estimated Holding Cost is a more reliable metric than tracking difference it should similarly be looked at in conjunction with tracking error to get a complete picture of tracking efficiency.
A More Moderate ApproachCalculating Estimated Holding Cost for our sample of ETFs yields some intriguing results. Namely, that Estimated Holding Cost for most ETFs has been systematically more moderate than tracking difference. In other words, we find that, in our sample for the time period measured, Estimated Holding Cost tends to be smaller in absolute value than tracking difference, as shown in Figure 6.

On The Right Track: Measuring Tracking Efficiency in ETFs
February 2013
©2013 Morningstar. All rights reserved. The information, data, analyses, and opinions contained herein (1) are proprietary to Morningstar, Inc. and its affiliates (collectively, “Morningstar”), (2) may not be copied or redistributed, (3) do not constitute investment advice offered by Morningstar (4) are provided solely for informational purposes and therefore are not an offer to buy or sell a security, and (5) are not warranted to be accurate, complete, or timely. Certain information may be self-reported by the investment vehicle and not subject to independent verification. Morningstar shall not be responsible for any trading decisions, damages, or other losses resulting from, or related to, this information, data, analyses or opinions or their use. Past performance is no guarantee of future results.
23
This indicates in our sample, that tracking difference tended to give overly optimistic estimates when an ETF outperformed its index and overly pessimistic when an ETF underperformed its index. It is unreasonable to assert that this will always be the case, but it serves to illustrate that meaningful differences can be observed by utilising different methodologies.
Similar to our findings on tracking difference, we find that the level of Estimated Holding Cost for each ETF relative to its benchmark tends to vary considerably depending on the benchmark involved.
The largest divergence between tracking difference and Estimated Holding Cost was seen amongst those ETFs
tracking the MSCI Emerging Markets, MSCI Brazil, and MSCI World indices. This certainly makes intuitive sense. European-domiciled ETFs tracking international indices tend to have higher tracking error. Higher tracking error means higher volatility of daily excess returns. When daily excess returns are highly volatile, the likelihood increases that a point-to-point estimate of tracking efficiency, like tracking difference, will misrepresent reality. Instead, a geometric average should be relied upon to smooth out the impact of tracking error. In this respect, Estimated Holding Cost provides value for the investor. Again, since Estimated Holding Cost takes into account more data than tracking difference, the results derived from the Estimated Holding Cost methodology are likely to be more robust. Table 18 houses our results.
Figure 5
Comparison Between Estimated Holding Cost and One-Year Tracking Difference for All 65 ETFs
Calculations from 01/10/2011 to 30/09/2012
1.0
0.5
0.0
-0.5
-1.0
-1.5
Estimated Holding Cost (Inverse) Tracking Difference

On The Right Track: Measuring Tracking Efficiency in ETFs
February 2013
©2013 Morningstar. All rights reserved. The information, data, analyses, and opinions contained herein (1) are proprietary to Morningstar, Inc. and its affiliates (collectively, “Morningstar”), (2) may not be copied or redistributed, (3) do not constitute investment advice offered by Morningstar (4) are provided solely for informational purposes and therefore are not an offer to buy or sell a security, and (5) are not warranted to be accurate, complete, or timely. Certain information may be self-reported by the investment vehicle and not subject to independent verification. Morningstar shall not be responsible for any trading decisions, damages, or other losses resulting from, or related to, this information, data, analyses or opinions or their use. Past performance is no guarantee of future results.
24
Table 18
Comparison Between Estimated Holding Cost and One-Year Tracking Difference at the Fund Level
Fund Replication Method Estimated Holding Cost % Tracking Difference %
Amundi ETF EURO STOXX 50 (C) Synthetic -0.50 0.59
ComStage ETF EURO STOXX 50 NR Synthetic -0.49 0.62
CS ETF (IE) on EURO STOXX 50 Physical – Full -0.51 0.54
db x-trackers Euro STOXX 50 ETF 1C Synthetic -0.60 0.69
EasyETF Euro Stoxx 50 B Physical – Full -0.56 0.71
ETFlab EURO STOXX 50 Physical – Full -0.47 0.79
HSBC EURO STOXX 50 ETF Physical – Full -0.81 0.93
iShares Euro STOXX 50(IE) Physical – Full -0.62 0.66
iShares Euro STOXX 50 (DE) Physical – Full -0.27 0.49
Lyxor ETF EURO STOXX 50 D Synthetic -0.52 0.64
Source EURO STOXX 50 ETF Synthetic -0.17 0.14
UBS-ETF EURO STOXX 50 I Physical – Full -0.66 0.75
Amundi ETF FTSE 100-GBP Synthetic 0.27 -0.37
ComStage ETF FTSE 100 TR Synthetic 0.24 -0.33
CS ETF (IE) on FTSE 100 Physical – Full 0.46 -0.63
db x-trackers FTSE 100 Synthetic 0.29 -0.40
HSBC FTSE 100 ETF Physical – Full 0.36 -0.49
iShares FTSE 100 (DE) Physical – Full 0.72 -0.97
iShares FTSE 100 (IE) Physical – Full 0.41 -0.56
Lyxor ETF FTSE 100 Synthetic 0.29 -0.43
Source FTSE 100 ETF Synthetic 0.35 -0.52
UBS-ETF FTSE 100 SF A Synthetic 0.32 -0.44
ComStage ETF DAX Synthetic 0.14 -0.22
db x-trackers DAX ETF Synthetic 0.24 -0.36
ETFlab DAX Acc Physical – Full 0.15 -0.19
iShares DAX (DE) Physical – Full 0.16 -0.28
Lyxor ETF DAX Synthetic 0.21 -0.42
Amundi ETF S&P 500-USD Synthetic 0.03 -0.05
ComStage ETF S&P 500 Synthetic 0.10 -0.16
CS ETF (IE) on S&P 500 Physical – Full -0.15 0.18
db x-trackers S&P 500 TR 1C Synthetic -0.14 0.20
EasyETF S&P 500 USD Synthetic -0.20 0.25
HSBC S&P 500 ETF Physical – Full -0.17 0.36
iShares S&P 500 (Acc) (IE) Physical – Full 0.06 -0.09
Lyxor ETF S&P 500 B USD Synthetic -0.05 0.04
Source S&P 500 ETF Synthetic 0.08 -0.13
UBS ETFs plc - S&P 500 SF (USD) A-acc Synthetic 0.03 -0.05

On The Right Track: Measuring Tracking Efficiency in ETFs
February 2013
©2013 Morningstar. All rights reserved. The information, data, analyses, and opinions contained herein (1) are proprietary to Morningstar, Inc. and its affiliates (collectively, “Morningstar”), (2) may not be copied or redistributed, (3) do not constitute investment advice offered by Morningstar (4) are provided solely for informational purposes and therefore are not an offer to buy or sell a security, and (5) are not warranted to be accurate, complete, or timely. Certain information may be self-reported by the investment vehicle and not subject to independent verification. Morningstar shall not be responsible for any trading decisions, damages, or other losses resulting from, or related to, this information, data, analyses or opinions or their use. Past performance is no guarantee of future results.
25
Comparison Between Estimated Holding Cost and One-Year Tracking Difference at the Fund Level (Continued)
Fund Replication Method Estimated Holding Cost % Tracking Difference %
Amundi ETF MSCI Emerging Markets-USD Synthetic 0.94 -0.95
CS ETF (Lux) on MSCI Emerging Markets A Physical – Sampling 0.33 -1.38
db x-trackers MSCI Emerg Mkts TRN 1C Synthetic 0.95 -0.97
ETFlab MSCI Emerging Markets Synthetic 1.00 -0.97
iShares MSCI Emerging Markets (Acc) (IE) Physical – Sampling -0.18 -0.43
Lyxor ETF MSCI Emerging Markets D-USD Synthetic 1.00 -0.94
Source MSCI Emerging Markets ETF Synthetic 0.92 -0.99
UBS-ETF MSCI Emerging Markets A Physical – Sampling 1.00 -0.94
Amundi ETF MSCI World-USD Synthetic 0.31 -0.36
ComStage ETF MSCI World Synthetic 0.03 -0.23
CS ETF (IE) on MSCI World Physical – Sampling -0.31 -0.09
db x-trackers MSCI World TRN Index 1C Synthetic 0.16 -0.21
HSBC MSCI World ETF Physical – Sampling -0.52 0.28
iShares MSCI World (Acc) (IE) Physical – Sampling 0.53 -0.30
Lyxor ETF MSCI World B Synthetic 0.03 -0.28
Source MSCI World ETF Synthetic 0.21 -0.52
UBS-ETF MSCI World A Physical – Sampling -0.29 -0.24
ComStage ETF MSCI Japan Synthetic 0.37 -0.40
db x-trackers MSCI Japan TRN Idx 1C Synthetic 0.43 -0.45
HSBC MSCI Japan ETF Physical – Full 0.31 -0.35
iShares MSCI Japan (DE) Physical – Full 0.51 -0.57
Source MSCI Japan ETF Synthetic 0.39 -0.40
Amundi ETF MSCI Brazil Synthetic 0.55 -0.44
CS ETF (IE) on MSCI Brazil B Physical – Full 0.58 -0.45
db x-trackers MSCI Brazil TRN Index 1C Synthetic 0.88 -0.68
HSBC MSCI Brazil ETF Physical – Full 0.85 -0.38
iShares MSCI Brazil (IE) Physical – Full 0.68 -0.60
Source MSCI Brazil ETF Synthetic 1.21 -0.94
Calculations from 01/10/2011 to 30/09/2012

On The Right Track: Measuring Tracking Efficiency in ETFs
February 2013
©2013 Morningstar. All rights reserved. The information, data, analyses, and opinions contained herein (1) are proprietary to Morningstar, Inc. and its affiliates (collectively, “Morningstar”), (2) may not be copied or redistributed, (3) do not constitute investment advice offered by Morningstar (4) are provided solely for informational purposes and therefore are not an offer to buy or sell a security, and (5) are not warranted to be accurate, complete, or timely. Certain information may be self-reported by the investment vehicle and not subject to independent verification. Morningstar shall not be responsible for any trading decisions, damages, or other losses resulting from, or related to, this information, data, analyses or opinions or their use. Past performance is no guarantee of future results.
26
Table 19
Comparison Between Estimated Holding Cost and One-Year Tracking Difference by Benchmark
Estimated Holding Cost % Tracking Difference %
Average for EURO STOXX 50 ETFs -0.51 0.63
Average for FTSE 100 ETFs 0.37 -0.51
Average for DAX ETFs 0.18 -0.29
Average for S&P 500 ETFs -0.04 0.05
Average for MSCI Emerging Markets ETFs 0.74 -0.94
Average for MSCI World ETFs 0.02 -0.22
Average for MSCI Japan ETFs 0.40 -0.44
Average for MSCI Brazil ETFs 0.85 -0.67
Calculations from 01/10/2011 to 30/09/2012
Similar to the findings with respect to tracking difference and a fund’s replication method, we do not find a discernible relationship between a fund’s replication method and its Estimated Holding Cost. In the case of four out of the eight indices we examined—those tracking the EURO STOXX 50, FTSE 100, S&P 500, and MSCI Japan—synthetic funds had, on average, a tighter absolute value of Estimated Holding Cost (meaning less underperformance or less outperformance relative to the benchmark) than the physical funds tracking the same index. In two of the other four cases, physical funds showed tighter absolute Estimated Holding Cost. And in the final two cases, the absolute value of Estimated Holding Cost was equal.
It can be said that in terms of relative value, physical replication funds tended to be less costly than synthetic funds tracking the same index as measured by Estimated Holding Cost. This means that for six out of the eight indices we examined the Estimated Holding Cost for physical funds was less than it was for synthetic funds. However, tracking efficiency should not be thought of in these terms alone. The ultimate goal should be to minimise the absolute value of Estimated Holding Cost. Regardless of the sign, the closer Estimated Holding Cost approaches 0%, the better. In this respect, we find that there is no discernible relationship between a fund’s replication method and its Estimated Holding Cost.

On The Right Track: Measuring Tracking Efficiency in ETFs
February 2013
©2013 Morningstar. All rights reserved. The information, data, analyses, and opinions contained herein (1) are proprietary to Morningstar, Inc. and its affiliates (collectively, “Morningstar”), (2) may not be copied or redistributed, (3) do not constitute investment advice offered by Morningstar (4) are provided solely for informational purposes and therefore are not an offer to buy or sell a security, and (5) are not warranted to be accurate, complete, or timely. Certain information may be self-reported by the investment vehicle and not subject to independent verification. Morningstar shall not be responsible for any trading decisions, damages, or other losses resulting from, or related to, this information, data, analyses or opinions or their use. Past performance is no guarantee of future results.
27
Table 20
Estimated Holding Cost vs. One-Year Tracking Difference by Replication Method
Estimated Holding Cost % Tracking Difference %
EURO STOXX 50
Average of Physical Replicators -0.56 0.69
Average of Synthetic Replicators -0.45 0.54
FTSE 100
Average of Physical Replicators 0.49 -0.66
Average of Synthetic Replicators 0.29 -0.42
DAX
Average of Physical Replicators 0.16 -0.23
Average of Synthetic Replicators 0.20 -0.33
S&P 500
Average of Physical Replicators -0.09 0.11
Average of Synthetic Replicators -0.02 0.02
MSCI Emerging Markets
Average of Physical Replicators 0.38 -0.91
Average of Synthetic Replicators 0.96 -0.96
MSCI World
Average of Physical Replicators -0.15 -0.09
Average of synthetic Replicators 0.15 -0.32
MSCI Japan
Average of Physical Replicators 0.41 -0.46
Average of Synthetic Replicators 0.40 -0.42
MSCI Brazil
Average of Physical Replicators 0.82 -0.65
Average of Synthetic Replicators 0.88 -0.68
Calculations from 01/10/2011 to 30/09/2012
Higher Fees Result in Worse Index TrackingBriefly, we want to touch on the issue of fees and expenses in the context of Estimated Holding Cost. Similar to our findings on Tracking Difference, we do find a relationship between the fund’s total expense ratio (TER) and its Estimated Holding Cost. The two sets of values exhibit a correlation of 63%, and a coefficient of determination, R2, of 0.395, implying that nearly 40% of the variance in a fund’s Estimated Holding Cost can be explained by its TER. Economically-speaking, a basis point increase in an ETF’s TER will correlate with a 1.6 basis point increase in the ETF’s Estimated Holding Cost. This gives credence to the notion that higher fees generally result in worse index tracking.
Similar to the results found in examining tracking difference, a fund’s fees are an important factor in determining its Estimated Holding Cost, but not the only determinant. In fact, the explanatory power of TER in relation to Estimated Holding Cost is lower, and by implication, there tends to be more non-TER related information in the Estimated Holding Cost data point than in tracking difference. Of course, other factors such as securities lending, cash drag, and tax optimisation can all impact a fund’s relative performance as we have already discussed.

On The Right Track: Measuring Tracking Efficiency in ETFsFebruary 2013
©2013 Morningstar. All rights reserved. The information, data, analyses, and opinions contained herein (1) are proprietary to Morningstar, Inc. and its affiliates (collectively, “Morningstar”), (2) may not be copied or redistributed, (3) do not constitute investment advice offered by Morningstar (4) are provided solely for informational purposes and therefore are not an offer to buy or sell a security, and (5) are not warranted to be accurate, complete, or timely. Certain information may be self-reported by the investment vehicle and not subject to independent verification. Morningstar shall not be responsible for any trading decisions, damages, or other losses resulting from, or related to, this information, data, analyses or opinions or their use. Past performance is no guarantee of future results.
28
Conclusion
Is it Desirable for an ETF to Outperform its Benchmark?In discussing tracking difference and Estimated Holding Cost, at some point it’s valid to ask: is it desirable for an ETF to outperform its benchmark?
Certainly, if you own the ETF, the extra basis points of return will augment your bottom line. And viewed through the traditional prism of investment management, a higher return is generally considered preferable to a lower one. But unlike actively-managed funds, ETFs have a clear objective to track—not outperform—a benchmark. Any deviation from that objective, on the upside or the downside, represents a subversion of their mission.
To see why that distinction might matter, consider the market participant that sells an ETF short. That investor will be hurt, not helped, by the outperformance, and might justly criticise the fund for falling short of its stated objective. Source, for example, has publicly stated its intention to offer stable tracking rather than reaching for extra performance so that its funds can be just as useful for short sellers as for long owners.
What Else Matters When Evaluating an ETF? Finally, it is important to mention that while all the tracking metrics we discussed in this paper, namely tracking error, tracking difference and Estimated Holding Cost are important factors to consider when evaluating an ETF, they are not the only metrics that investors should look at. Additional factors to take into consideration include, but are by no means limited to:Trading costs, including commissions, bid-ask spreads, and market impact ETFs’ market price relative to NAV over time (i.e. premiums and discounts)Counterparty riskTax considerations
Some of these considerations have been the subject of previous Morningstar studies, while others will be covered in future research papers.
r
r
r
r

On The Right Track: Measuring Tracking Efficiency in ETFsFebruary 2013
©2013 Morningstar. All rights reserved. The information, data, analyses, and opinions contained herein (1) are proprietary to Morningstar, Inc. and its affiliates (collectively, “Morningstar”), (2) may not be copied or redistributed, (3) do not constitute investment advice offered by Morningstar (4) are provided solely for informational purposes and therefore are not an offer to buy or sell a security, and (5) are not warranted to be accurate, complete, or timely. Certain information may be self-reported by the investment vehicle and not subject to independent verification. Morningstar shall not be responsible for any trading decisions, damages, or other losses resulting from, or related to, this information, data, analyses or opinions or their use. Past performance is no guarantee of future results.
29
Appendix 1
MethodologyFor the purpose of this study we have tried to focus on ETFs covering a sample of the broadest and most widely used equity indices for European investors; hence our choice of the EURO STOXX 50, the FTSE 100, the S&P 500, the DAX, the MSCI Emerging Markets, the MSCI World, and the MSCI Japan. We added the MSCI Brazil as an example of a market that has placed restrictions on share purchases.
For each of these benchmarks, we have included all the European-listed ETFs for which we have data and for which there is sufficient history. In total, the funds in our study constituted, at the time of writing, roughly 37% of the assets under management within European-domiciled equity ETFs.
Our choice of the time period used in our calculations for each benchmark reflected a balance between going as far back in time as possible, and including as many funds as we could. In all cases this resulted in a measurement period somewhere between one and three years.
Wherever possible we have used the capitalising share class of a fund to compare it to total return benchmarks. In all other cases we have used an ‘adjusted’ net asset value (NAV) that assumed immediate reinvestment of any distribution made by the ETF. Some ETF providers publish this adjusted NAV series on their websites, while others provided it upon request. In some cases we have used Morningstar data to calculate it ourselves.
As well, we’ve excluded from our data set the values for any days when a fund did not produce a net asset value but the index did produce a price, or vice versa. The “holiday effect” that would result from leaving this data in the calculation has a tendency to make tracking error look much higher than otherwise, when in fact it stems from the absence of a price on a particular day rather than reflecting the normal tracking error we are trying to measure.
In all of our calculations, we have used the funds’ net asset value, rather than their closing price. We made this decision in order to be consistent for funds that trade on multiple exchanges, as a better reflection of the quality of fund management rather than secondary market support, and in light of the reality that a great deal of ETF trading in Europe is done over-the-counter (with some investors preferring to trade at NAV) as opposed to on an exchange. It is highly likely that our results would have looked markedly different had we used price data instead of NAV data.
Tracking ErrorTo measure tracking error, we have calculated the standard deviation of return differences between each fund and its benchmark, and annualised it:
Tracking Error = std (Rnav – Rindex) x √n
Where:Rnav is the single period total return of the fund’s NAVRindex is the single period total return of the indexn is the number of observations per year
For weekly results, we measured returns from Wednesday to Wednesday, except in the cases of EURO STOXX 50 ETFs and MSCI Brazil ETFs, where we have measured from Tuesday to Tuesday, and MSCI Japan ETFs, where we have used Friday to Friday. For monthly tracking error or EURO STOXX ETFs, returns where calculated from the 13th of the month or preceding weekday.
Tracking DifferenceTo measure tracking difference, we have calculated the difference between the fund return and the benchmark return, and annualised the total period value:
Tracking Difference = (1 + Rnav – Rindex)1/N – 1
Where:Rnav is the total return of the fund’s NAV over the entire measurement period.Rindex is the total return of the index over the entire measurement period.N is the number of years.

On The Right Track: Measuring Tracking Efficiency in ETFs
February 2013
©2013 Morningstar. All rights reserved. The information, data, analyses, and opinions contained herein (1) are proprietary to Morningstar, Inc. and its affiliates (collectively, “Morningstar”), (2) may not be copied or redistributed, (3) do not constitute investment advice offered by Morningstar (4) are provided solely for informational purposes and therefore are not an offer to buy or sell a security, and (5) are not warranted to be accurate, complete, or timely. Certain information may be self-reported by the investment vehicle and not subject to independent verification. Morningstar shall not be responsible for any trading decisions, damages, or other losses resulting from, or related to, this information, data, analyses or opinions or their use. Past performance is no guarantee of future results.
30
Morningstar’s Estimated Holding CostTo measure Morningstar’s Estimated Holding Cost, we have calculated twenty sets of return ratios derived from the prior twenty trading days:
Ratioi = (1 + Rnav,i) / (1 + Rindex,i)
For each value of i from 1 through 20. Where: Rnav,i is the one-year trailing total return of the fund’s NAV up to i trading days ago. Rindex,i is the one-year trailing total return of the index up to i trading days ago.
To calculate the Estimated Holding Cost we have determined the geometric average of these twenty return ratios:
Estimated Holding Cost = 100 x (1 – G0)
Where:G0 is the geometric mean of the twenty ratios.
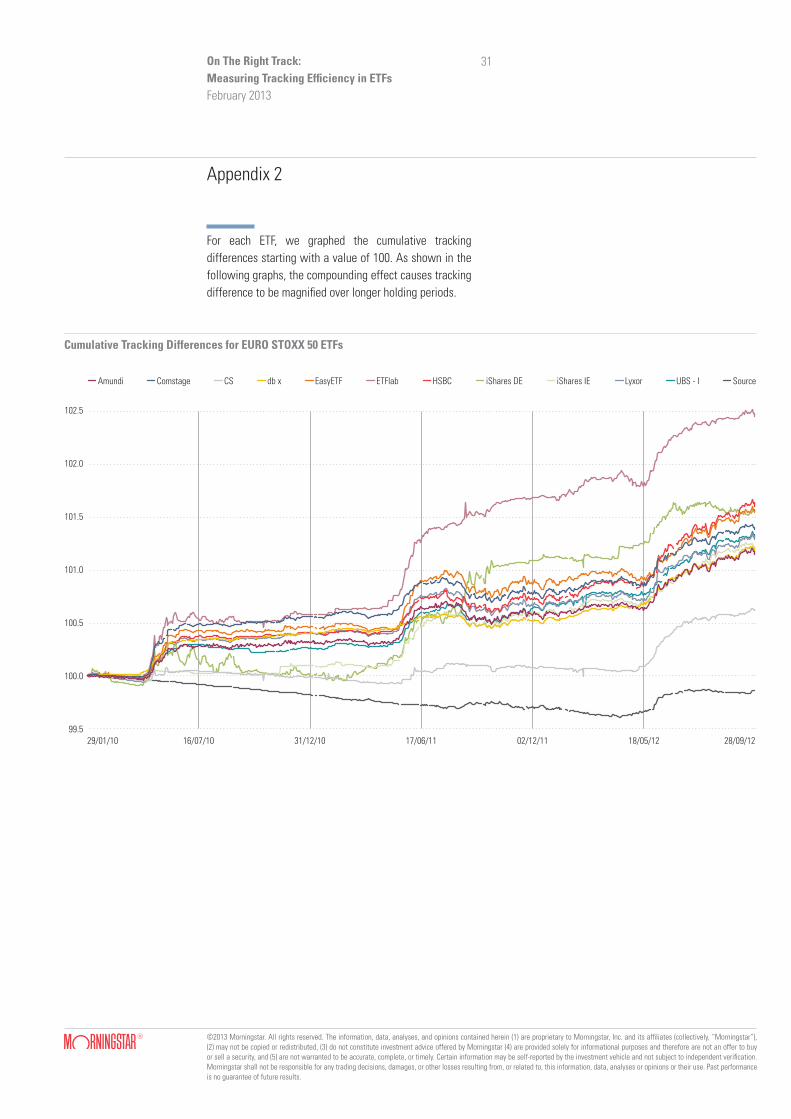
On The Right Track: Measuring Tracking Efficiency in ETFsFebruary 2013
©2013 Morningstar. All rights reserved. The information, data, analyses, and opinions contained herein (1) are proprietary to Morningstar, Inc. and its affiliates (collectively, “Morningstar”), (2) may not be copied or redistributed, (3) do not constitute investment advice offered by Morningstar (4) are provided solely for informational purposes and therefore are not an offer to buy or sell a security, and (5) are not warranted to be accurate, complete, or timely. Certain information may be self-reported by the investment vehicle and not subject to independent verification. Morningstar shall not be responsible for any trading decisions, damages, or other losses resulting from, or related to, this information, data, analyses or opinions or their use. Past performance is no guarantee of future results.
31
Appendix 2
For each ETF, we graphed the cumulative tracking differences starting with a value of 100. As shown in the following graphs, the compounding effect causes tracking difference to be magnified over longer holding periods.
Source
29/01/10 16/07/10 31/12/10 17/06/11 02/12/11 18/05/12 28/09/12
102.5
102.0
101.5
101.0
100.5
100.0
99.5
UBS - IiShares DE iShares IEETFlabEasyETFdb xCSComstageAmundi HSBC Lyxor
Cumulative Tracking Differences for EURO STOXX 50 ETFs

On The Right Track: Measuring Tracking Efficiency in ETFs
February 2013
©2013 Morningstar. All rights reserved. The information, data, analyses, and opinions contained herein (1) are proprietary to Morningstar, Inc. and its affiliates (collectively, “Morningstar”), (2) may not be copied or redistributed, (3) do not constitute investment advice offered by Morningstar (4) are provided solely for informational purposes and therefore are not an offer to buy or sell a security, and (5) are not warranted to be accurate, complete, or timely. Certain information may be self-reported by the investment vehicle and not subject to independent verification. Morningstar shall not be responsible for any trading decisions, damages, or other losses resulting from, or related to, this information, data, analyses or opinions or their use. Past performance is no guarantee of future results.
32
Cumulative Tracking Differences for FTSE 100 ETFs
db x-trackers iShares IEiShares DEHSBCAmundi Comstage CS SourceLyxor UBS SF - A
14/07/10 17/11/10 23/03/11 27/07/11 30/11/11 04/04/12 28/09/12
100.0
99.5
99.0
98.5
98.0
db x-trackers iShares DEETFlabComstage Lyxor
01/07/10 04/11/10 10/03/11 14/07/11 17/11/11 22/03/12 28/09/12
100.2
100.0
99.8
99.6
99.4
99.2
99.0
Cumulative Tracking Differences for DAX ETFs

On The Right Track: Measuring Tracking Efficiency in ETFs
February 2013
©2013 Morningstar. All rights reserved. The information, data, analyses, and opinions contained herein (1) are proprietary to Morningstar, Inc. and its affiliates (collectively, “Morningstar”), (2) may not be copied or redistributed, (3) do not constitute investment advice offered by Morningstar (4) are provided solely for informational purposes and therefore are not an offer to buy or sell a security, and (5) are not warranted to be accurate, complete, or timely. Certain information may be self-reported by the investment vehicle and not subject to independent verification. Morningstar shall not be responsible for any trading decisions, damages, or other losses resulting from, or related to, this information, data, analyses or opinions or their use. Past performance is no guarantee of future results.
33
Cumulative Tracking Differences for S&P 500 ETFs
16/12/10 07/04/11 28/07/11 17/11/11 08/03/12 28/09/12
100.6
100.4
100.2
100.0
99.8
99.6
EasyETFdb x-trackers iShares IE SourceHSBCAmundi Comstage CS Lyxor UBS
100.5
100.0
99.5
99.0
98.5
98.0
97.521/12/10 26/04/11 30/08/11 03/01/12 08/05/12 28/09/12
db x-trackers iShares IEAmundi SourceETFlabCS Lyxor UBS
Cumulative Tracking Differences for MSCI Emerging Markets ETFs
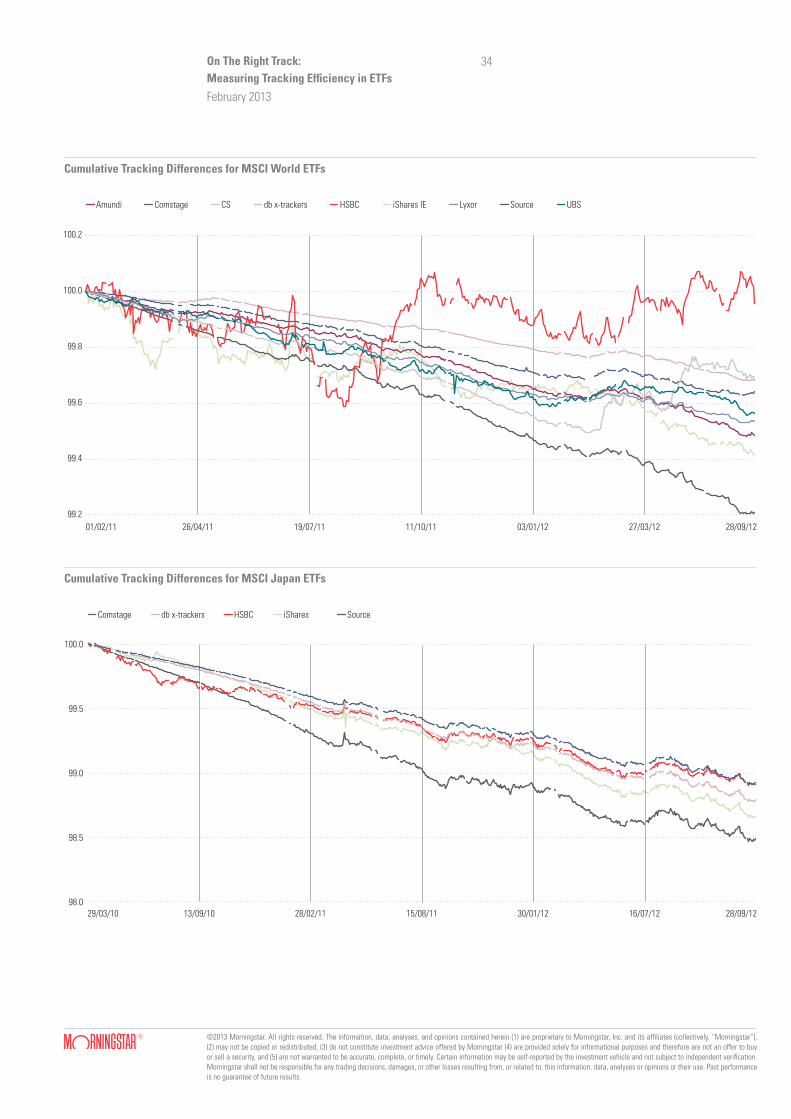
On The Right Track: Measuring Tracking Efficiency in ETFs
February 2013
©2013 Morningstar. All rights reserved. The information, data, analyses, and opinions contained herein (1) are proprietary to Morningstar, Inc. and its affiliates (collectively, “Morningstar”), (2) may not be copied or redistributed, (3) do not constitute investment advice offered by Morningstar (4) are provided solely for informational purposes and therefore are not an offer to buy or sell a security, and (5) are not warranted to be accurate, complete, or timely. Certain information may be self-reported by the investment vehicle and not subject to independent verification. Morningstar shall not be responsible for any trading decisions, damages, or other losses resulting from, or related to, this information, data, analyses or opinions or their use. Past performance is no guarantee of future results.
34
Cumulative Tracking Differences for MSCI World ETFs
100.2
100.0
99.8
99.6
99.4
99.201/02/11 26/04/11 19/07/11 11/10/11 03/01/12 27/03/12 28/09/12
db x-trackers iShares IEAmundi SourceHSBCComstage CS Lyxor UBS
100.0
99.5
99.0
98.5
98.029/03/10 13/09/10 28/02/11 15/08/11 30/01/12 16/07/12 28/09/12
iSharesdb x-trackers SourceHSBCComstage
Cumulative Tracking Differences for MSCI Japan ETFs

On The Right Track: Measuring Tracking Efficiency in ETFs
February 2013
©2013 Morningstar. All rights reserved. The information, data, analyses, and opinions contained herein (1) are proprietary to Morningstar, Inc. and its affiliates (collectively, “Morningstar”), (2) may not be copied or redistributed, (3) do not constitute investment advice offered by Morningstar (4) are provided solely for informational purposes and therefore are not an offer to buy or sell a security, and (5) are not warranted to be accurate, complete, or timely. Certain information may be self-reported by the investment vehicle and not subject to independent verification. Morningstar shall not be responsible for any trading decisions, damages, or other losses resulting from, or related to, this information, data, analyses or opinions or their use. Past performance is no guarantee of future results.
35
Cumulative Tracking Differences for MSCI Brazil ETFs
100.0
99.5
99.0
98.5
98.003/12/10 20/05/11 04/11/11 20/04/12 28/09/12
db x-trackers iSharesAmundi SourceHSBCCS

©2013 Morningstar. All rights reserved. The information, data, analyses, and opinions contained herein (1) are proprietary to Morningstar, Inc. and its affiliates (collectively, “Morningstar”), (2) may not be copied or redistributed, (3) do not constitute investment advice offered by Morningstar (4) are provided solely for informational purposes and therefore are not an offer to buy or sell a security, and (5) are not warranted to be accurate, complete, or timely. Certain information may be self-reported by the investment vehicle and not subject to independent verification. Morningstar shall not be responsible for any trading decisions, damages, or other losses resulting from, or related to, this information, data, analyses or opinions or their use. Past performance is no guarantee of future results.
36
Contacts
Hortense Bioy, CFA, Director, European Passive Fund [email protected]
Alastair Kellett, CFA, CAIA, International ETF [email protected]
Lee Davidson, ETF [email protected]