measuring and assessing the impact of basic skills on ...cee.lse.ac.uk/ceedps/ceedp03.pdf ·...
TRANSCRIPT

Measuring and Assessing the Impact of Basic Skills on Labour Market Outcomes
Steven McIntosh and Anna Vignoles
November 2000
ISSN 2045-6557
Published by Centre for the Economics of Education London School of Economics and Political Science Houghton Street London WC2A 2AE Steven McIntosh and Anna Vignoles, submitted July 2000 ISBN 0 7530 1434 3 Individual copy price: £5 The Centre for the Economics of Education is an independent research centre funded by the Department of Education and Employment. The view expressed in this work are those of the authors and do not necessarily reflect the views of the Department of Education and Employment. All errors and omissions remain the authors. This work is based on the Skills Task Force Research Paper SKT 27 and the Department of Education and Employment Research Report 192 (ISBN 1 84185 261 9) published in June 2000. The original report remains Crown Copyright 2000 and was published with the permission of DfEE on behalf of the Controller of Her Majesty's Stationery Office.
Executive Summary The work on the effect of basic literacy and numeracy skills on labour market outcomes arises from a recent report by Sir Claus Moser, which investigated the basic skills of English adults (DfEE, 1999). This report suggested that approximately 20% of adults in England, i.e. nearly seven million people, have severe literacy difficulties, whilst around 40% have some numeracy problems. Furthermore, the report showed that this ‘skills gap’ is one of the worst in Europe. Other recent research has confirmed this gloomy picture, indicating that as many as one in five UK adults have literacy problems1. Although this government is committed to tackling poor literacy and numeracy2, much of the emphasis thus far has been on finding ways to improve the basic skills of those who are still in the school system, with initiatives such as the National Strategies for Numeracy and Literacy. However, these initiatives will obviously not help adults, who have already left the education system, to overcome their numeracy and literacy problems. Instead, Moser suggested a National Strategy for Adult Basic Skills, with clear and ambitious national targets to reduce the number of functionally illiterate and innumerate adults. To investigate the possible benefits of such a strategy, this report evaluates the economic returns to having better literacy and numeracy skills.
Apart from the obvious policy need for an analysis of the effects of basic skills on earnings, this work also fills a significant gap in the literature. Although there is substantial international evidence that the labour market rewards certain skills, particularly mathematical skills, there has been very little research that specifically investigates the impact of basic literacy and numeracy on labour market outcomes. The main findings are as follows; • Currently around 80% of UK adults have achieved Level 1 literacy skills, and 60% Level 1 in
numeracy (British Skills Agency Standard). DfEE (1999) suggested a target of 90% and 70% respectively by 2010.
• This report evaluates the impact of better literacy and numeracy skills on individuals’ economic outcomes, focusing particularly on the effect of increasing numeracy and literacy skills up to Level 1.
• We found evidence of a large positive effect on earnings and employment rates from having better numeracy skills, specifically from achieving at least Level 1 skills, although there was also evidence of a large premium from acquiring just Entry Level numeracy skills.
• Not taking into account other factors that influence earnings, individuals with Level 1 numeracy skills earn around 15-19% more than those with skills below this level. Even after allowing for an independent effect from the worker’s education/qualification level, and after controlling for family background, workers with Level 1 numeracy skills earn around 6-7% more than their less skilled peers. We also use NCDS data to control for initial ability in reading and mathematics at age 7, ability at 16 and education level, thus giving an approximate estimate of the effect of moving an adult up the numeracy distribution. The results still suggest that, for a given level of numeracy and literacy at 16, improving an adult’s numeracy skills to Level 1 will raise their earnings by 6%.
1 Bynner and Parsons (1997a) found that 20% of a sample of UK adults had low or very low levels of literacy. The data they used is also the basis for some of the analysis in this report.
2 See the White Paper ‘Excellence in Schools’ (DfEE (1997).
• Individuals with Level 1 numeracy skills are around five percentage points more likely to be employed (not taking into account other factors). Even in the full model which conditions for a person’s education level, Level 1 numeracy skills are still associated with having a 2-3 percentage point higher probability of being in employment.
• There was also evidence of a positive relationship between literacy and economic outcomes, although the results from the two data sets used in this chapter differ substantially. IALS data indicate that the effect of literacy skills on both earnings and employment is of a similar magnitude to the numeracy effect and may, in the case of the effect on employment rates, be larger than the numeracy effect.
• With no controls, Level 1 literacy is associated with having 15% higher earnings (similar to the numeracy effect). Once other variables are added to the model the effect from Level 1 literacy is reduced to 1-3% in the NCDS but is still a sizeable 11% in IALS.
• With no controls in the model, having Level 1 literacy skills is associated with a 5 percentage point higher probability of employment in the NCDS, and 13 percentage point higher probability in IALS. Once all the controls are added, including education level, there is no effect from Level 1 literacy in NCDS but a 10 percentage point higher probability of employment from IALS.
• This report focuses exclusively on the economic benefits of literacy and numeracy. However, there may well be non-economic benefits associated with both literacy and numeracy, perhaps more so with the former. Further work on this issue is needed to give a more rounded picture of the total benefits to individuals, and to society as a whole, from improving people’s basic skills.

Measuring and Assessing the Impact of Basic Skills on Labour Market Outcomes
Steven McIntosh and Anna Vignoles
1. Introduction 1 2. Basic Skills: Policy Issues and Evidence 1 3. Data 2 3.1 The National Child Development Study 3 3.2 The International Adult Literacy Survey 3 4. Measuring Literacy and Numeracy Skills 3 4.1 What measures and what standards? 3
4.2 Basic skills measures in the National Child Development Study 5
4.3 Basic skills measures in the International Adult Literacy Survey 6
4.4 Comparisons between data sources 7 4.5 International comparisons 7 5. Estimation 8 5.1 Dependent variables 9 5.2 Specification issues 9
5.3 Summary results – the effect of literacy and numeracy on wages 11
5.4 Detailed NCDS results – the effect of literacy and numeracy on wages 13 5.5 Detailed IALS results – the effect of
literacy and numeracy on wages 14 5.6 Summary results – the effect of literacy and
Numeracy on employment 14 5.7 Detailed NCDS results – the effect of literacy
and numeracy on employment 15 5.8 Detailed IALS results – the effect of literacy
and numeracy on employment 16
6. Conclusions 17 Appendix 19 References 25
Acknowledgments
This work has been sponsored by the Department for Education and Employment. The full report on which this paper is based can be obtained from the DfEE (Dearden et al, 2000). The authors would like to thank Lorraine Dearden (IFS) and Richard Layard (CEP) for their help and advice. The paper also benefited greatly from the comments made by participants at the International Skills Conference at the University of Kent and the Centre for Economic Performance Tuesday Seminar. The NCDS data were supplied by the Centre for Longitudinal Studies at the Institute of Education. The IALS data were supplied by Statistics Canada.
Steven McIntosh and Anna Vignoles are both members of the Centre for the Economics of Education, and are based at the Centre for Economic Performance, London School of Economics. The Centre for the Economics of Education is an independent research centre funded by the Department of Education and Employment. The view expressed in this work are those of the authors and do not necessarily reflect the views of the Department of Education and Employment. All errors and omissions remain the authors.
This work is based on the Skills Task Force Research Paper SKT 27 and the Department of Education and Employment Research Report 192 (ISBN 1 84185 261 9) published in June 2000. The original report remains Crown Copyright 2000 and was published with the permission of DfEE on behalf of the Controller of Her Majesty's Stationery Office.

Measuring and Assessing the Impact of Basic Skills on Labour Market Outcomes
Steven McIntosh and Anna Vignoles 1. Introduction As discussed elsewhere in this collection of papers, workers’ skill levels can be measured in a number of distinct ways. For example, a person’s education level, the qualifications they hold, and the amount of on- and off-the-job training that they have received are all somewhat different measures of their skills. Indeed, much of the research that has looked at the relationship between worker skill level and labour market success has focused specifically on these skill measures. Nonetheless, it is obviously crucial, in an era of apparently rising demand for skills, that we have evidence on the labour market value of the full range of worker skills, including basic literacy and numeracy. However, the role of basic literacy and numeracy skills in the labour market is relatively under-researched. The reason for this is that there are significant problems associated with measuring workers’ basic skills levels, particularly when trying to make comparisons across countries, and up to now there has also been a distinct lack of data on this issue.
This paper therefore attempts fill this gap in the literature, using two unique data sets, the UK National Child Development Study and the International Adult Literacy Survey, to measure UK workers’ basic literacy and numeracy skills. The paper then evaluates the impact of these skills on respondents’ labour market outcomes, particularly wages. We find clear evidence of a wage and employment return for workers with higher level literacy and numeracy skills.
The paper is set out as follows. Since our data are from the UK, section 2 outlines the UK policy context for this research and reviews some of the available UK and international evidence on this issue. In Section 3 we discuss the data. Section 4 focuses on the problems of measuring literacy and numeracy skills. Section 5 presents the results of an analysis of the impact of basic skills on workers’ labour market success. Section 6 concludes. 2. Basic Skills: Policy Issues and Evidence In recent years policy-makers in the UK have become increasingly concerned about the issue of workers’ basic skills. This has been partly as a result of complaints by employers about the poor skill level of British workers. In 1999 a UK government inquiry, led by Sir Claus Moser, undertook a formal investigation of the basic literacy and numeracy skills of English adults (DfEE, 1999). The inquiry suggested that approximately 20% of adults in England, i.e. nearly seven million people, have severe literacy difficulties, whilst around 40% have some numeracy problems. Furthermore, the report showed that this ‘basic skills gap’ is one of the worst in Europe. This report prompted the UK government to set ambitious targets to reduce the number of functionally illiterate and innumerate adults by 2010. It appears likely therefore, that basic literacy and numeracy skills will remain an important policy issue in the early 21st century, at least in the UK.
2
Another important outcome from the Moser report (DfEE, 1999) was the realisation that the UK had a significant knowledge gap on this issue, both in terms of adequate data, and in terms of any systematic assessment of the costs of and benefits from improving individuals’ basic skills. The evidence that is available is sparse and somewhat mixed. For example, the UK Department for Education and Employment’s ‘Skill Needs Surveys’ indicates that less than 5% of employers perceive that they face a serious skill gap, in terms of their employees’ basic literacy and numeracy. More firms complain about the lack of higher level skills, such as management and I.T. skills (Robinson, 1997). By contrast, several reports have put very high estimates on the cost of poor basic skills for the British economy (ALBSU, 1993), although such calculations are problematic. Focusing on the effects of poor basic skills, Parsons and Bynner (1998) found evidence that adults with poor numeracy or literacy are more likely to be unemployed, less likely to receive on-the-job training, less likely to own their own home and more likely to be in prison. On the other hand, Green et al (1998) found that UK workers who used some basic skills for their job, such as mathematical skills, earned no more than those who did not use such skills3.
There has also been remarkably little international research into the effects of numeracy and literacy on earnings, although there is a large literature on the relationship between individuals’ scores on various standardised tests4 and their labour market outcomes. Numerous studies have found positive wage returns to mathematical ability (Kenny et al, 1979; Willis and Rosen, 1979; Grogger and Eide, 1995; Murnane et al, 1995). There is also some evidence that mathematical skills have become more important determinants of wages in recent years, at least in the US (Murnane et al, 1995; Grogger and Eide, 1995). Tyler, et al, 1999). At the macro level, Hanushek and Kim (1995), using data from the IEA5 and the IAEP6 on 39 countries, concluded that cognitive skills are an important determinant of labour productivity. However, other studies that have attempted to evaluate the macro effect of specific skills on economic growth have generally found insignificant results (Doyle and Weale, 1994). For example, in international tests, above average scores in mathematics or science do not appear positively correlated with per capita GNP (Robinson, 1997).
In the light of the paucity of this evidence, this paper should represent a much-needed addition to the literature on the value of basic skills. 3. Data We use UK data from the National Child Development Study (NCDS) and the International Adult Literacy Survey (IALS). Descriptive statistics can be found in Tables A1 and A2 in the Appendix.
3 However, workers using 'moderately' complex computer applications at work earned more, as did workers who used problem solving and verbal skills in their jobs.
4 The tests that have been most commonly used in the US are the Armed Forces Qualification Test (AFQT) and Scholastic Aptitude Test scores.
5 International Association for the Evaluation of Educational Achievement.
6 International Assessment of Educational Progress.
3
3.1 The National Child Development Study The National Child Development Study (NCDS) is a continuing longitudinal survey of people living in Great Britain who were born between 3 and 9 March 1958. There have been 5 waves of the NCDS, the last full survey having been undertaken in 1991 when the cohort members were 33 years of age. We also make use of a follow-up survey of a 10 per cent sub-sample of the NCDS cohort, which was carried out in 1995, when the cohort was aged 37. The advantage of using the NCDS to examine basic skills is that, in addition to information on respondents’ educational achievements and basic skills at age 37, the data also include early ability test scores and comprehensive details of individuals’ family backgrounds. This background information is obviously crucial when we attempt to model the effects of basic skills. We drop from our sample individuals who are employed but who have missing observations on wages, those who did not sit ability tests at the age of 7 and those for whom we do not have information on qualifications from any source. We also drop individuals who are self-employed or in full-time education7. This leaves us with a final usable sample of 1570. 3.2 The International Adult Literacy Survey The International Adult Literacy Survey (IALS) was carried out in Great Britain in 1995, as part of an international survey of adult literacy in twelve countries (Germany, Sweden, the Netherlands, Switzerland, Poland, the USA, Canada, New Zealand, Ireland, Northern Ireland and Belgium being the other eleven). The British Survey was conducted by the Office for National Statistics and was the first literacy survey to be carried out in Britain on a national random sample of adults of working age. The objective of the survey was to profile the literacy of UK adults using internationally agreed measurement instruments and survey protocols (Carey et al, 1997).
IALS provides data on workers’ annual earnings in 1994 and covers all those aged 16-64. The major limitation of the data set is that the wage variable only records the quintile of the earnings distribution, within which the respondents’ annual earnings fall. The IALS usable sample size is 1533. 4. Measuring Literacy and Numeracy Skills 4.1 What measures and what standards? As already discussed, there are a number of difficulties associated with measuring literacy and numeracy skills and it is difficult to get good data on this issue. Certainly there is some disagreement about how to define basic skills, i.e. should ‘basic skills’ just include literacy and numeracy, or should they perhaps also include other skills, such as the use of simple information technology. The second major issue concerns which tests/indicators to use to measure attainment in basic skills. In the UK in particular, numerous different tests and indicators have been used to measure literacy and numeracy skills, many of which give slightly different measures of these basic skills, and hence even
7 Rather than dropping individuals who have missing information on other variables of interest, we include missing dummy variables.

4
the official statistics sometimes give conflicting evidence (Robinson, 1997)8. For example, in the UK context, age 16 examination results in English and mathematics (GCSE9 results), various standardised test scores and even the person’s overall qualification level, have been used by official sources as potential indicators of numeracy and literacy. These measures have not always been used consistently and have therefore provided different estimates of the extent of the literacy and numeracy problem in the UK. One objective of this paper is therefore to provide some clarification as to the actual literacy and numeracy skill level of British workers. To do this, we first discuss the way in which basic skills have been measured and classified in the UK.
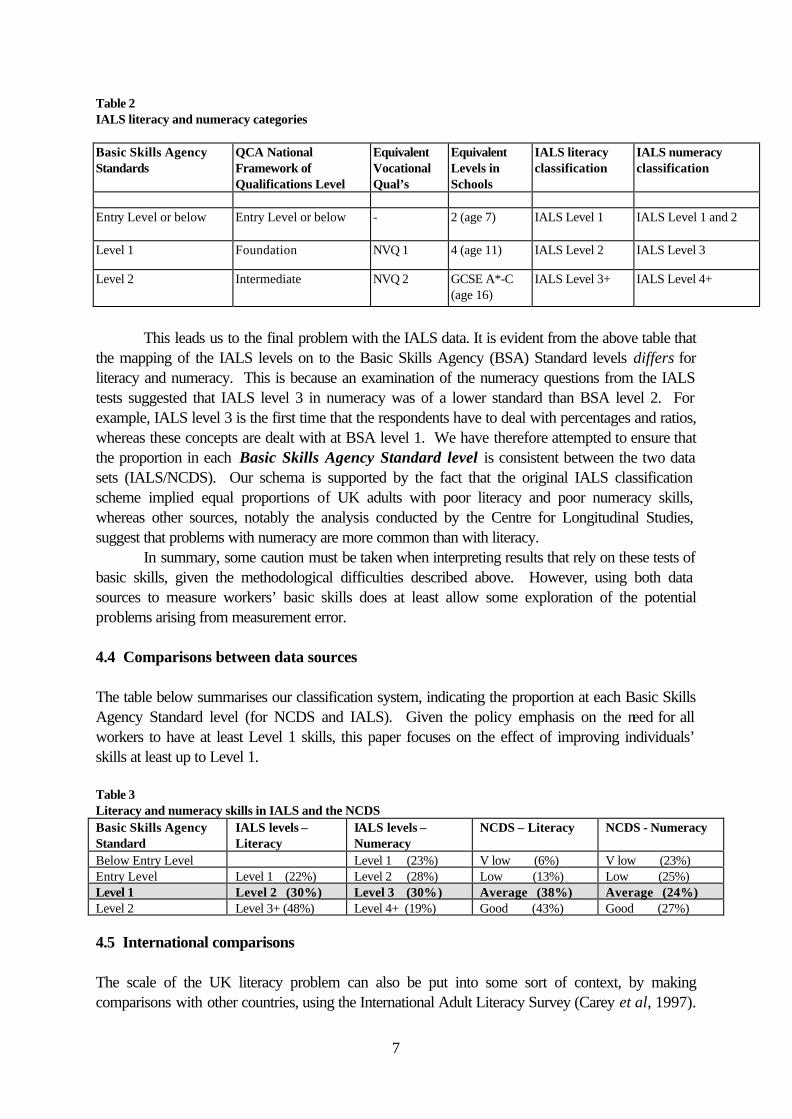
Most of the UK work that has been done on measuring literacy and numeracy skills has been undertaken by the Centre for Longitudinal Studies (CLS) for the Basic Skills Agency10. It was on the basis of this evidence that Moser suggested that 6% of the adult working population have “great difficulty with any reading, struggling to read the simplest and shortest texts…”11, whilst around 20% of adults “…may read slowly with little understanding…”12. However, equating these percentages to other possible measures of skill is problematic. DfEE (1999) therefore suggested the classification system in Table 1. The table equates the Qualifications and Curriculum Authority framework of qualifications with the Basic Skills Agency Standards, as well as the system of UK vocational qualifications and achievement levels in schools.
Table 1 Different indicators of skill (Moser (DfEE, 1999))
Basic Skills Agency Standards
QCA National Framework of Qualifications Level
Equivalent Vocational Qualifications
Equivalent Levels in Schools
% of Adults at this Level for Literacy
% of Adults at this Level for Numeracy
Below Entry Level Below Entry Level - 6 23 Entry Level Entry Level - 2 (age 7) 13 25 Level 1 Foundation NVQ 1 4 (age 11) 38 24 Level 2 Intermediate+ NVQ 2 GCSE A*-C 43+ 27+ + Figure includes all those with literacy skills at Level 2 or above.
Thus so called ‘Level 1’ basic skills (according to the BSA standards) are equivalent to Foundation Level in the QCA framework, to NVQ Level 1 in the vocational qualification framework, and to Level 4 achievement in schools, a level which should generally be achieved by age 11. The final column gives Moser’s estimate of the percentage of adults at this level, in terms of their literacy and numeracy skills (based on NCDS data). The Moser Report (DfEE, 1999) 8 For a discussion of the confusing UK terminology surrounding the issue of basic skills, the use of ‘Standard Assessment Tasks’ (SATs) to measure attainment in literacy and numeracy for National Targets, and more specifically the possible inconsistency between various literacy and numeracy measures - such as SATs and GCSEs (General Certificates of Secondary Education), see Robinson (1997).
9 General Certificates of Secondary Education.
10 The CLS (Bynner and Parsons (1997a/1997b) used the National Child Development Study data for much of this work.
11 DfEE (1999), p. 16.
12 DfEE (1999), p. 17.
5
recommended that the government set national targets, for 90% of adults to reach Level 1 literacy and 70% to reach Level 1 numeracy by the year 2010. As is evident from Table 1, current achievement levels are about 80% and 50%13 respectively. Having briefly considered the basic framework that is used to measure basic skills in the UK, we now consider the specific measures of skill used in this paper. 4.2 Basic skills measures in the National Child Development Study In this paper we too make use of the NCDS measures of literacy and numeracy, as reported in the Moser report (DfEE, 1999) and shown in Table 1. The literacy and numeracy tests used for the National Child Development Study were designed by the National Foundation for Educational Research14. The tests consist of eight literacy tasks (23 different questions) and nine numeracy tasks (18 different questions), which measure a person’s ability to apply literacy15 and numeracy skills to an every day context. For example, one question assessed the respondent’s ability to read and use a Yellow Pages directory. The adult literacy skill measure (with a maximum score of 23) is right censored, with a relatively low standard deviation, and 20% of the sample achieved the highest literacy score possible. This reflects the fact that the literacy test is not a good discriminator at the upper end of the distribution, and was primarily designed to identify basic skills problems, rather than focus on higher achievers. The numeracy test scores are more widely distributed, and only 5% of the sample achieved the highest score.
The limitations of the NCDS data are serious but straightforward, in comparison with the problems associated with IALS data, as discussed in the next section. Firstly, there is some evidence of inconsistency in the Basic Skills Agency tests, on which the literacy and numeracy measures in the NCDS are based. For example, in 1994 Gallup interviewed around 3000 UK adults and assessed their literacy and numeracy skills, using the same Basic Skills Agency tests16. As reported in Robinson (1997), the proportions found to be below Entry level in literacy were 4%, and 15% in numeracy, for all age groups. Amongst the age group relevant to the NCDS cohort (age 32-34 in 1994), the proportions below Entry level were just 2% and 10%, in literacy and numeracy respectively. Clearly the proportions with very low level basic skills in the Gallup survey are much lower than in the NCDS data. This inconsistency is obviously cause for concern. Furthermore, the Basic Skills Agency results do not reflect GCSE/O level attainment at 16 particularly well, the latter suggesting higher levels of attainment than the BSA tests. An obvious question is whether the 30 minute Basic Skills Agency test, with only around 40 questions in total, is an adequate test of individuals’ literacy and numeracy skills. Certainly one might assume it measures respondents’ basic skills with some error.
13 Moser (DfEE (1999) estimated that 60% of the British population are at Level 1 numeracy or above.
14 Several NCDS surveys also asked respondents’ to make self-assessments of their skills in reading, writing and number. We use these questions to consider the issue of measurement error but generally found that they were not strongly correlated with individuals’ actual skills, as measured by the age 37 literacy and numeracy tests.
15 The literacy test assesses reading rather than writing. Since a higher proportion of the population has problems with writing than with reading, these tests will understate any literacy problem in the UK (Parsons and Bynner (1998).
16 See Robinson (1997) for a full discussion of this issue.
6
4.3 Basic skills measures in the International Adult Literacy Survey As part of the IALS survey, respondents completed tests of their literacy and numeracy. We make use of the results from two tests, of quantitative literacy and prose literacy, labelled numeracy and literacy respectively. The numeracy test involved 33 questions, designed to test the knowledge and skills required to apply arithmetic operations to numbers embedded in printed materials. The literacy test involved 34 questions, designed to test the knowledge and skills needed to understand and use information from texts. The tests were scored according to an Item Response Model (IRM), which fits a mathematical model evaluating the probability of a respondent answering an item, based on the respondents’ ability and the graded difficulty of the item under consideration. Given the items each respondent actually got right, and the associated difficulty of each, an ability score on a scale of 0 to 500 can be calculated for each respondent. The collectors of the data then classified these scores into five skill levels. Basically, the levels were assigned so that the respondent would have at least an 80% chance of correctly answering a question graded at that level.
Goldstein (2000) outlines potential problems with the IRM approach adopted in IALS. First, he queries the choice of the three domains of literacy (document literacy being the third in addition to the two that we use). Are the three measures really capturing three separate abilities? Given that there is a high degree of correlation between the scores across individuals, the answer to this question may be no. Goldstein hypothesises that they all may be affected by another factor or dimension that varies across individuals. Thus the criticism comes down to a problem with the unidimensional nature of the IRM model employed; that an individual’s chances of answering a particular question, say a prose literacy question, is assumed to be affected only by that person’s literacy ability, and nothing else. Any test item that did not ‘fit’ the imposed unidimensional model was excluded from the survey results. However, the item may not have fit precisely because it was influenced by two or more dimensions. The removal of this item will create biases in those countries where the discrepancies are largest.
A related problem is how to interpret the five IALS levels. The underlying assumption is that all individuals at the same level will find questions graded at that level equally difficult. Once we allow for another dimension affecting their performance in answering the questions, however, then this need not be the case. Individual X may perform well on question 1 but badly on question 2, but individual Y does badly on question 1 and well on question 2, resulting in a similar overall score. Thus, IALS throws away potential information about abilities along other dimensions, by forcing everyone to be ranked along a single scale.
In essence, then, we cannot be absolutely sure whether the IALS scores can distinguish between individuals purely according to their different literacy or numeracy skills, or whether the scores are affected by other dimensions. However, this does not mean that we cannot use the test scores to analyse their affects on labour market outcomes, just that the interpretation is open to question. This clearly illustrates the problems associated with testing people to obtain measures of their basic numeracy and literacy.
To make the results as comparable as possible with the British standard levels discussed above, we re-classified the five IALS skill levels as follows.
7
Table 2 IALS literacy and numeracy categories
Basic Skills Agency Standards
QCA National Framework of Qualifications Level
Equivalent Vocational Qual’s
Equivalent Levels in Schools
IALS literacy classification
IALS numeracy classification
Entry Level or below Entry Level or below - 2 (age 7) IALS Level 1 IALS Level 1 and 2
Level 1 Foundation NVQ 1 4 (age 11) IALS Level 2 IALS Level 3
Level 2 Intermediate NVQ 2 GCSE A*-C (age 16)
IALS Level 3+ IALS Level 4+
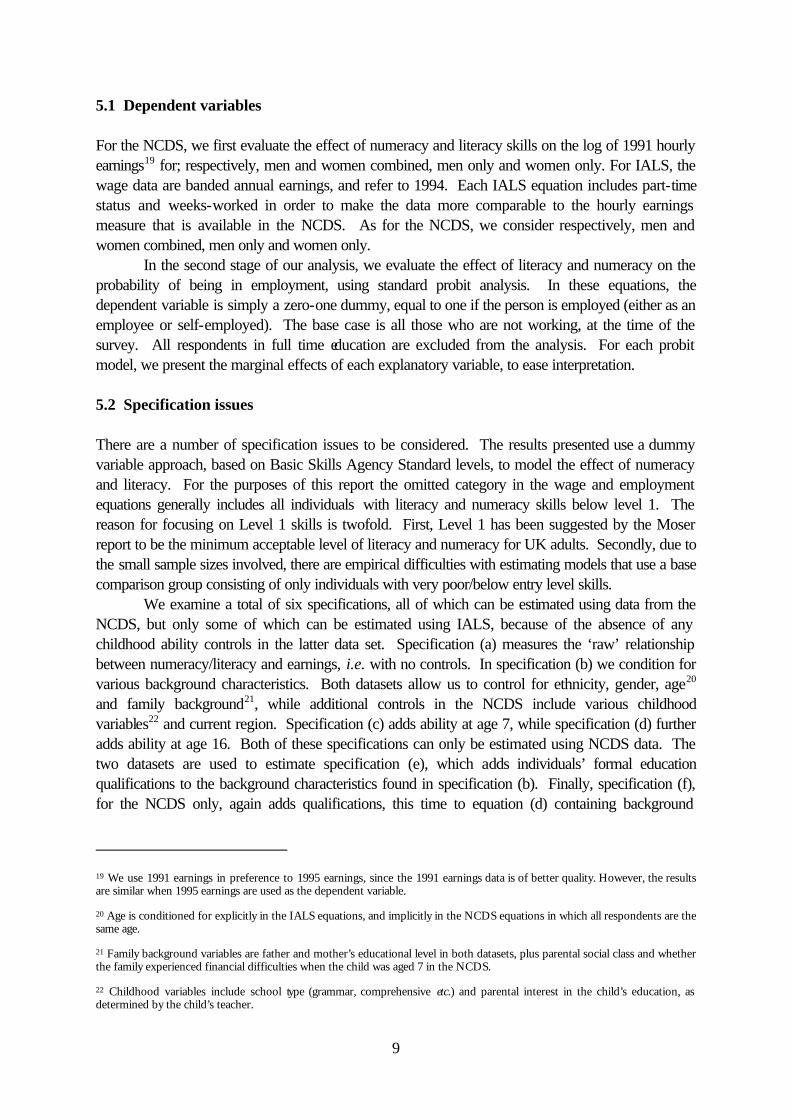
This leads us to the final problem with the IALS data. It is evident from the above table that
the mapping of the IALS levels on to the Basic Skills Agency (BSA) Standard levels differs for literacy and numeracy. This is because an examination of the numeracy questions from the IALS tests suggested that IALS level 3 in numeracy was of a lower standard than BSA level 2. For example, IALS level 3 is the first time that the respondents have to deal with percentages and ratios, whereas these concepts are dealt with at BSA level 1. We have therefore attempted to ensure that the proportion in each Basic Skills Agency Standard level is consistent between the two data sets (IALS/NCDS). Our schema is supported by the fact that the original IALS classification scheme implied equal proportions of UK adults with poor literacy and poor numeracy skills, whereas other sources, notably the analysis conducted by the Centre for Longitudinal Studies, suggest that problems with numeracy are more common than with literacy.
In summary, some caution must be taken when interpreting results that rely on these tests of basic skills, given the methodological difficulties described above. However, using both data sources to measure workers’ basic skills does at least allow some exploration of the potential problems arising from measurement error. 4.4 Comparisons between data sources The table below summarises our classification system, indicating the proportion at each Basic Skills Agency Standard level (for NCDS and IALS). Given the policy emphasis on the need for all workers to have at least Level 1 skills, this paper focuses on the effect of improving individuals’ skills at least up to Level 1. Table 3 Literacy and numeracy skills in IALS and the NCDS Basic Skills Agency Standard
IALS levels – Literacy
IALS levels – Numeracy
NCDS – Literacy NCDS - Numeracy
Below Entry Level Level 1 (23%) V low (6%) V low (23%) Entry Level Level 1 (22%) Level 2 (28%) Low (13%) Low (25%) Level 1 Level 2 (30%) Level 3 (30%) Average (38%) Average (24%) Level 2 Level 3+ (48%) Level 4+ (19%) Good (43%) Good (27%) 4.5 International comparisons The scale of the UK literacy problem can also be put into some sort of context, by making comparisons with other countries, using the International Adult Literacy Survey (Carey et al, 1997).

8
However, the IALS data should be used with some caution for inter-country comparisons, as there appear to have been some problems translating the tests used into the various different languages. Blum and Guerin-Pace (2000) describe some of these. The main problem seems to be with the translation of the test questions into the various languages of the participating countries. Blum and Guerin-Pace highlight a number of examples where a particular phrase in the question is repeated in the correct multiple choice answer, thus guiding individuals towards the correct response, in English versions, but not in French versions. In addition, terms seem to have been sometimes more precisely used in English questionnaires than in French ones, making it clearer exactly how respondents should answer. Finally, there were some simple translation errors. To illustrate the possible effects of these translation problems, Blum and Guerin-Pace show that the success rate on particular questions is strongly correlated with geographic and linguistic factors. Thus particular questions were answered better by all English speakers, or all North American respondents.
Another problem noted by Blum and Guerin-Pace is how the issue of non-response was dealt with. Non-response can be taken as an indicator of an inability to answer the question, or of boredom with the questionnaire or not taking it seriously. The official line in the coding of the IALS data was that if a question was omitted (i.e. followed by questions that were answered) then it should be marked wrong, while if a question was not reached (i.e. not followed by any further answers) then it should be assumed that respondents gave up, and these questions should not play any part in the calculation of the individuals score17. Blum and Guerin-Pace distinguished actual wrong answers, and questions that were simply omitted, and analysed the determinants of each, using the French IALS data. While individual characteristics, in particular age and qualifications, were the key predictors of whether a question was answered incorrectly, these factors played no significant role in the equation determining omissions. Rather the key factor influencing omissions was the French geographical region of the respondent. The authors suggest that these dummy variables proxy different cultural attitudes to interview response. Thus omissions should not be treated as wrong answers, but may be due to unwillingness to answer the question. If such cultural differences to interview response are present across the regions of France, they are likely to be even greater across the various countries in IALS.
If one takes the data at face value though, the UK does not compare well18, having the third highest incidence of very low literacy of all the countries sampled, and also faring badly in terms of the proportion of the adult population with very low numeracy skills. 5. Estimation This section presents estimates of the effect of literacy and numeracy skills on labour market outcomes.
17 For such questions, another respondent with the same demographic characteristics was chosen at random, and their answer to the question taken to proxy the first respondent’s answer.
18 Other research has confirmed the poor performance of UK in many international assessment tests (Basic Skills Agency (1997)18; Keys et al (1996); Reynolds and Farrell (1996). Furthermore, the UK (along with the US) has a relatively high proportion of unskilled/unqualified workers (Green and Steedman (1997).
9
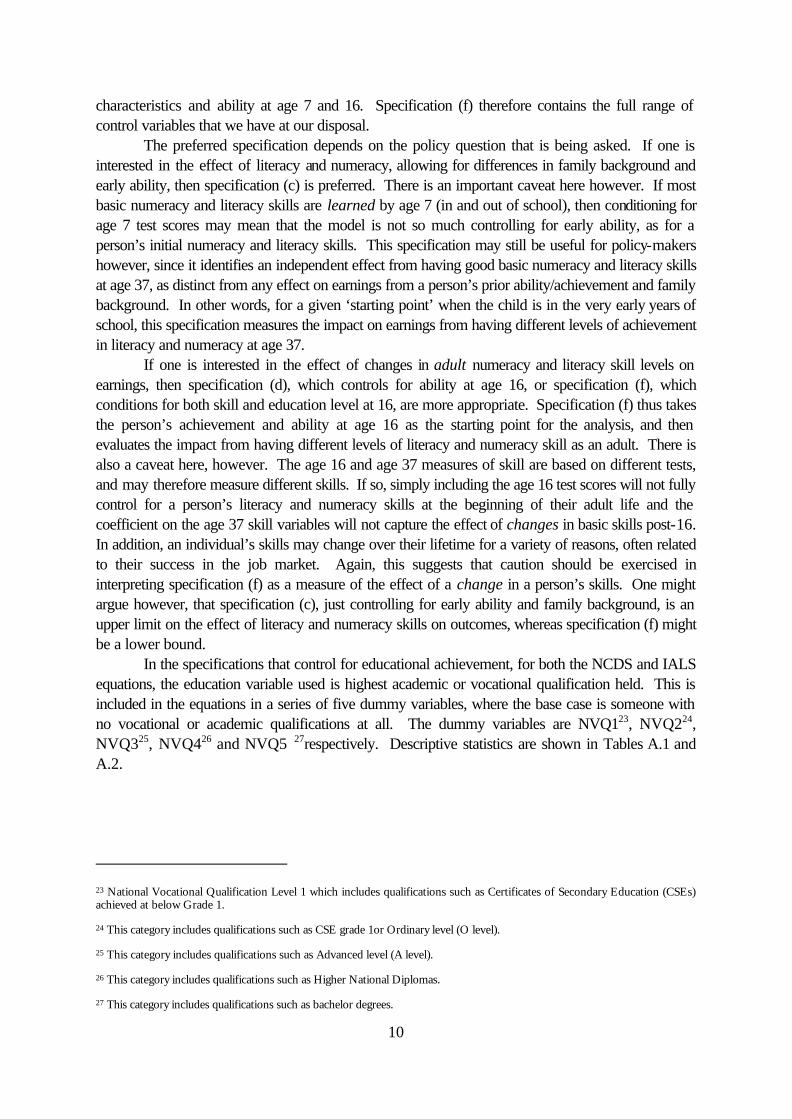
5.1 Dependent variables For the NCDS, we first evaluate the effect of numeracy and literacy skills on the log of 1991 hourly earnings19 for; respectively, men and women combined, men only and women only. For IALS, the wage data are banded annual earnings, and refer to 1994. Each IALS equation includes part-time status and weeks-worked in order to make the data more comparable to the hourly earnings measure that is available in the NCDS. As for the NCDS, we consider respectively, men and women combined, men only and women only.
In the second stage of our analysis, we evaluate the effect of literacy and numeracy on the probability of being in employment, using standard probit analysis. In these equations, the dependent variable is simply a zero-one dummy, equal to one if the person is employed (either as an employee or self-employed). The base case is all those who are not working, at the time of the survey. All respondents in full time education are excluded from the analysis. For each probit model, we present the marginal effects of each explanatory variable, to ease interpretation. 5.2 Specification issues There are a number of specification issues to be considered. The results presented use a dummy variable approach, based on Basic Skills Agency Standard levels, to model the effect of numeracy and literacy. For the purposes of this report the omitted category in the wage and employment equations generally includes all individuals with literacy and numeracy skills below level 1. The reason for focusing on Level 1 skills is twofold. First, Level 1 has been suggested by the Moser report to be the minimum acceptable level of literacy and numeracy for UK adults. Secondly, due to the small sample sizes involved, there are empirical difficulties with estimating models that use a base comparison group consisting of only individuals with very poor/below entry level skills.
We examine a total of six specifications, all of which can be estimated using data from the NCDS, but only some of which can be estimated using IALS, because of the absence of any childhood ability controls in the latter data set. Specification (a) measures the ‘raw’ relationship between numeracy/literacy and earnings, i.e. with no controls. In specification (b) we condition for various background characteristics. Both datasets allow us to control for ethnicity, gender, age20 and family background21, while additional controls in the NCDS include various childhood variables22 and current region. Specification (c) adds ability at age 7, while specification (d) further adds ability at age 16. Both of these specifications can only be estimated using NCDS data. The two datasets are used to estimate specification (e), which adds individuals’ formal education qualifications to the background characteristics found in specification (b). Finally, specification (f), for the NCDS only, again adds qualifications, this time to equation (d) containing background
19 We use 1991 earnings in preference to 1995 earnings, since the 1991 earnings data is of better quality. However, the results are similar when 1995 earnings are used as the dependent variable.
20 Age is conditioned for explicitly in the IALS equations, and implicitly in the NCDS equations in which all respondents are the same age.
21 Family background variables are father and mother’s educational level in both datasets, plus parental social class and whether the family experienced financial difficulties when the child was aged 7 in the NCDS.
22 Childhood variables include school type (grammar, comprehensive etc .) and parental interest in the child’s education, as determined by the child’s teacher.
10
characteristics and ability at age 7 and 16. Specification (f) therefore contains the full range of control variables that we have at our disposal.
The preferred specification depends on the policy question that is being asked. If one is interested in the effect of literacy and numeracy, allowing for differences in family background and early ability, then specification (c) is preferred. There is an important caveat here however. If most basic numeracy and literacy skills are learned by age 7 (in and out of school), then conditioning for age 7 test scores may mean that the model is not so much controlling for early ability, as for a person’s initial numeracy and literacy skills. This specification may still be useful for policy-makers however, since it identifies an independent effect from having good basic numeracy and literacy skills at age 37, as distinct from any effect on earnings from a person’s prior ability/achievement and family background. In other words, for a given ‘starting point’ when the child is in the very early years of school, this specification measures the impact on earnings from having different levels of achievement in literacy and numeracy at age 37.
If one is interested in the effect of changes in adult numeracy and literacy skill levels on earnings, then specification (d), which controls for ability at age 16, or specification (f), which conditions for both skill and education level at 16, are more appropriate. Specification (f) thus takes the person’s achievement and ability at age 16 as the starting point for the analysis, and then evaluates the impact from having different levels of literacy and numeracy skill as an adult. There is also a caveat here, however. The age 16 and age 37 measures of skill are based on different tests, and may therefore measure different skills. If so, simply including the age 16 test scores will not fully control for a person’s literacy and numeracy skills at the beginning of their adult life and the coefficient on the age 37 skill variables will not capture the effect of changes in basic skills post-16. In addition, an individual’s skills may change over their lifetime for a variety of reasons, often related to their success in the job market. Again, this suggests that caution should be exercised in interpreting specification (f) as a measure of the effect of a change in a person’s skills. One might argue however, that specification (c), just controlling for early ability and family background, is an upper limit on the effect of literacy and numeracy skills on outcomes, whereas specification (f) might be a lower bound.
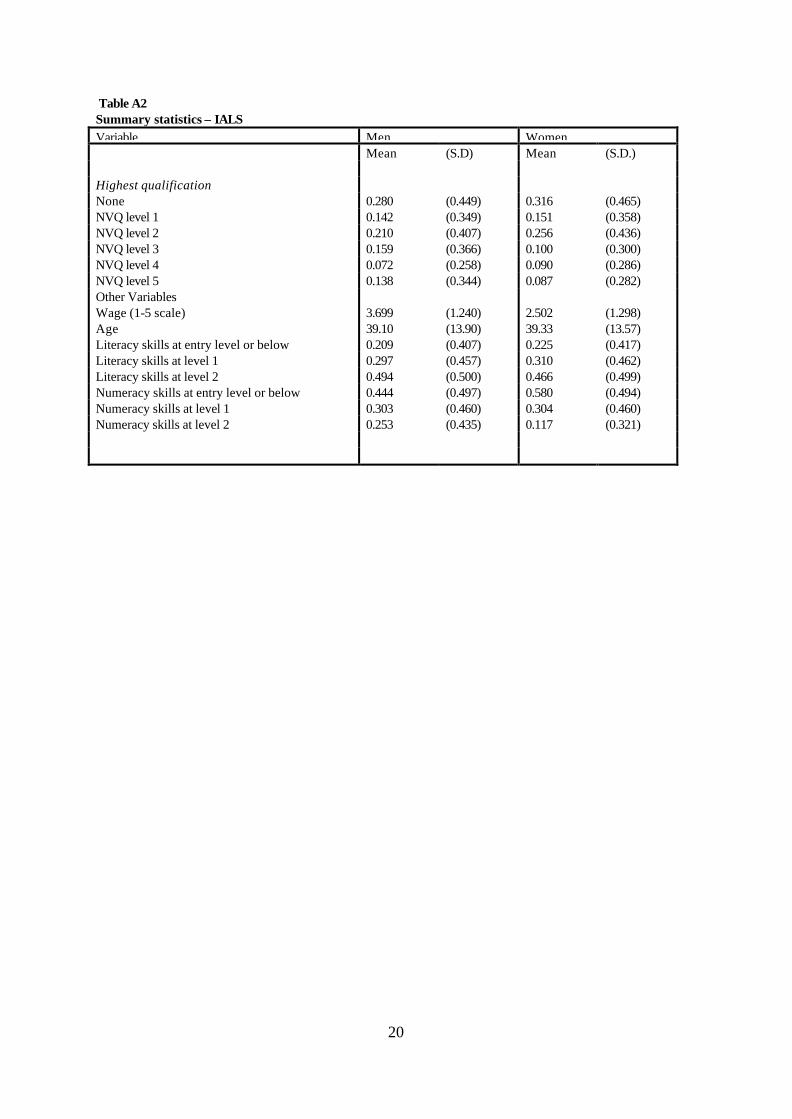
In the specifications that control for educational achievement, for both the NCDS and IALS equations, the education variable used is highest academic or vocational qualification held. This is included in the equations in a series of five dummy variables, where the base case is someone with no vocational or academic qualifications at all. The dummy variables are NVQ123, NVQ224, NVQ325, NVQ426 and NVQ5 27respectively. Descriptive statistics are shown in Tables A.1 and A.2.
23 National Vocational Qualification Level 1 which includes qualifications such as Certificates of Secondary Education (CSEs) achieved at below Grade 1.
24 This category includes qualifications such as CSE grade 1or Ordinary level (O level).
25 This category includes qualifications such as Advanced level (A level).
26 This category includes qualifications such as Higher National Diplomas.
27 This category includes qualifications such as bachelor degrees.
11
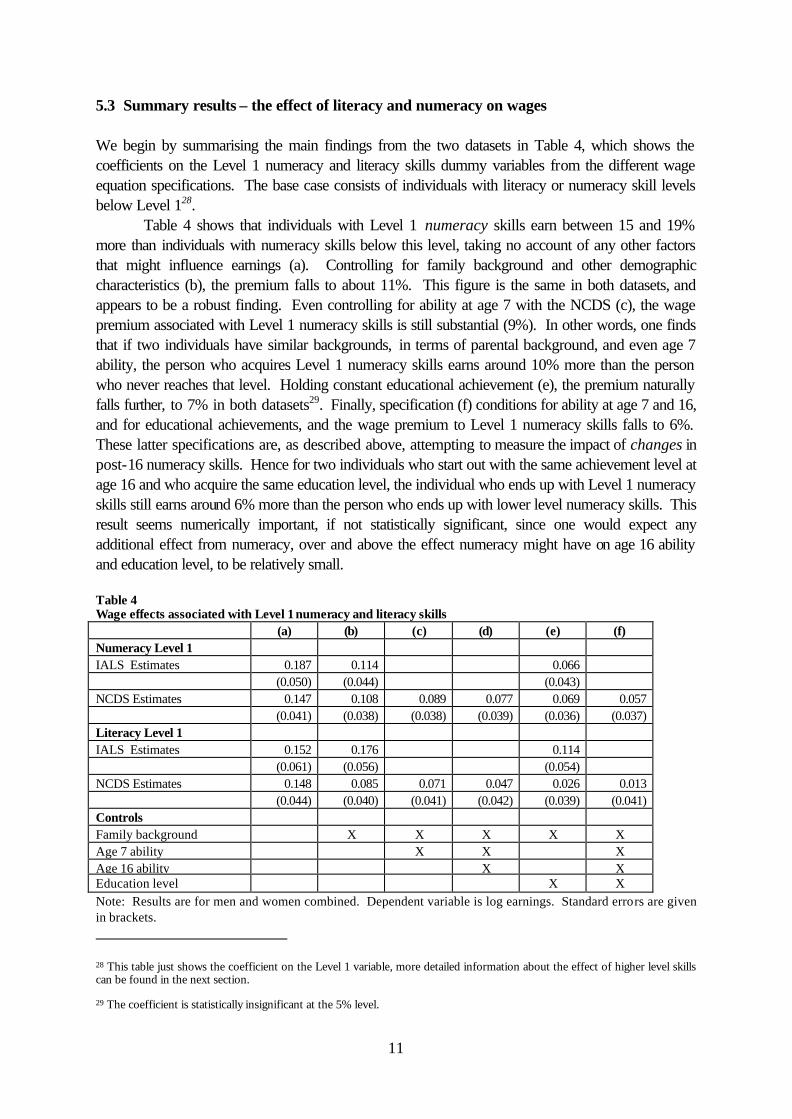
5.3 Summary results – the effect of literacy and numeracy on wages We begin by summarising the main findings from the two datasets in Table 4, which shows the coefficients on the Level 1 numeracy and literacy skills dummy variables from the different wage equation specifications. The base case consists of individuals with literacy or numeracy skill levels below Level 128.
Table 4 shows that individuals with Level 1 numeracy skills earn between 15 and 19% more than individuals with numeracy skills below this level, taking no account of any other factors that might influence earnings (a). Controlling for family background and other demographic characteristics (b), the premium falls to about 11%. This figure is the same in both datasets, and appears to be a robust finding. Even controlling for ability at age 7 with the NCDS (c), the wage premium associated with Level 1 numeracy skills is still substantial (9%). In other words, one finds that if two individuals have similar backgrounds, in terms of parental background, and even age 7 ability, the person who acquires Level 1 numeracy skills earns around 10% more than the person who never reaches that level. Holding constant educational achievement (e), the premium naturally falls further, to 7% in both datasets29. Finally, specification (f) conditions for ability at age 7 and 16, and for educational achievements, and the wage premium to Level 1 numeracy skills falls to 6%. These latter specifications are, as described above, attempting to measure the impact of changes in post-16 numeracy skills. Hence for two individuals who start out with the same achievement level at age 16 and who acquire the same education level, the individual who ends up with Level 1 numeracy skills still earns around 6% more than the person who ends up with lower level numeracy skills. This result seems numerically important, if not statistically significant, since one would expect any additional effect from numeracy, over and above the effect numeracy might have on age 16 ability and education level, to be relatively small. Table 4 Wage effects associated with Level 1 numeracy and literacy skills
(a) (b) (c) (d) (e) (f) Numeracy Level 1 IALS Estimates 0.187 0.114 0.066 (0.050) (0.044) (0.043) NCDS Estimates 0.147 0.108 0.089 0.077 0.069 0.057 (0.041) (0.038) (0.038) (0.039) (0.036) (0.037) Literacy Level 1 IALS Estimates 0.152 0.176 0.114 (0.061) (0.056) (0.054) NCDS Estimates 0.148 0.085 0.071 0.047 0.026 0.013 (0.044) (0.040) (0.041) (0.042) (0.039) (0.041) Controls Family background X X X X X Age 7 ability X X X Age 16 ability X X Education level X X Note: Results are for men and women combined. Dependent variable is log earnings. Standard errors are given in brackets. 28 This table just shows the coefficient on the Level 1 variable, more detailed information about the effect of higher level skills can be found in the next section.
29 The coefficient is statistically insignificant at the 5% level.

12
Table 4 also reveals that the wage premium associated with Level 1 literacy skills is only slightly smaller than the numeracy effect, in specification (a). Specifically, an individual with Level 1 literacy skills earns around 15% more than someone with lower level literacy, when no controls are used in the model. Controlling for background characteristics (b) has no impact on the IALS estimate of this premium, although the NCDS coefficient is significantly reduced. Including early ability (c) further reduces the premium to 7% (insignificant). Specification (e), where we add education qualifications to the basic controls, more or less eliminates the wage premium to Level 1 literacy in the NCDS but in IALS the premium only falls to 11%. Finally, after controlling for age 7 and 16 ability and education level, the Level 1 literacy effect is very small and insignificant.
Table 4 cannot say whether numeracy or literacy skills have a greater effect on wages. Not controlling for any other factors, the premium to Level 1 numeracy skills is slightly higher than to Level 1 literacy skills, although the difference is not statistically significant. When we build up the equations and condition for other influences on earnings, the two data sets continue to tell a similar story about the effects of numeracy. However, while IALS suggests that literacy has a larger impact on wages than numeracy, the NCDS suggests the reverse, with its literacy coefficient quickly falling away to statistical insignificance.
There are a number of possible explanations for the quite substantial differences between the IALS and the NCDS literacy results. Firstly, we have already discussed the limitations of the NCDS literacy measure, which is based on fewer questions than the IALS test and is severely right censored. Measurement error might therefore be generating the smaller NCDS coefficient. We attempted to correct for measurement error in the NCDS equations using an instrumental variable method. Potential instruments should predict a person’s literacy and numeracy score but not influence their wages directly. We used a battery of different instruments including; the person’s own perception of their numeracy and literacy skills, their teachers’ assessment of their ability in reading and mathematics, whether they had read a book in the last six months, whether they had ever had problems getting or changing jobs as a result of poor literacy and numeracy, and also their earlier test scores at ages 11 and 1630. These instruments proved more powerful in predicting a person’s numeracy level than their literacy level, particularly for women. However, in no case did we reject the null hypothesis of no measurement error31. We conclude from this that our concerns about possible measurement error in the NCDS literacy variable may be unjustified. Alternatively, it may be that we have not found good instruments for literacy. Given the problems identified in Section 4 with obtaining good measures of basic numeracy and literacy, finding good instruments for these variables is likely to prove equally difficult.
Another possible cause of the difference in literacy results between datasets may be that the returns to literacy in particular are subject to bias when ability is not controlled for. Table 4 reveals that taking into account early ability in reading and mathematics at age 7 and 16 (specifications (c) and (d)) reduces the Level 1 literacy coefficient by more than the Level 1 numeracy coefficient. Hence the IALS literacy coefficient might be a significant overestimate of the effect of literacy on earnings, because we are not able to control for prior ability in the IALS data. Note however that this cannot completely explain the gap between the NCDS and IALS estimates, which differ significantly even when both are subject to omitted ability bias (specification (b)).
30 Test scores at age 7 could not be used since these variables are in the main wage equation (specification (c)).
31 The Mills ratios were insignificant. Full results are available from the authors.
13
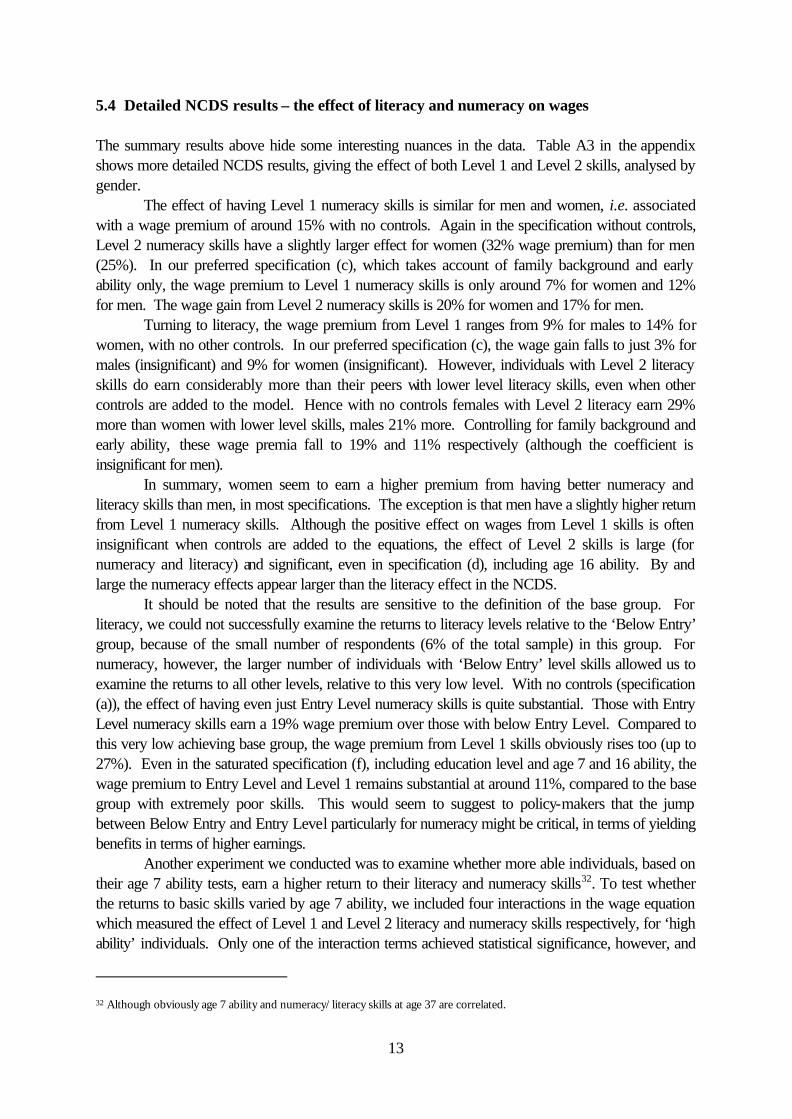
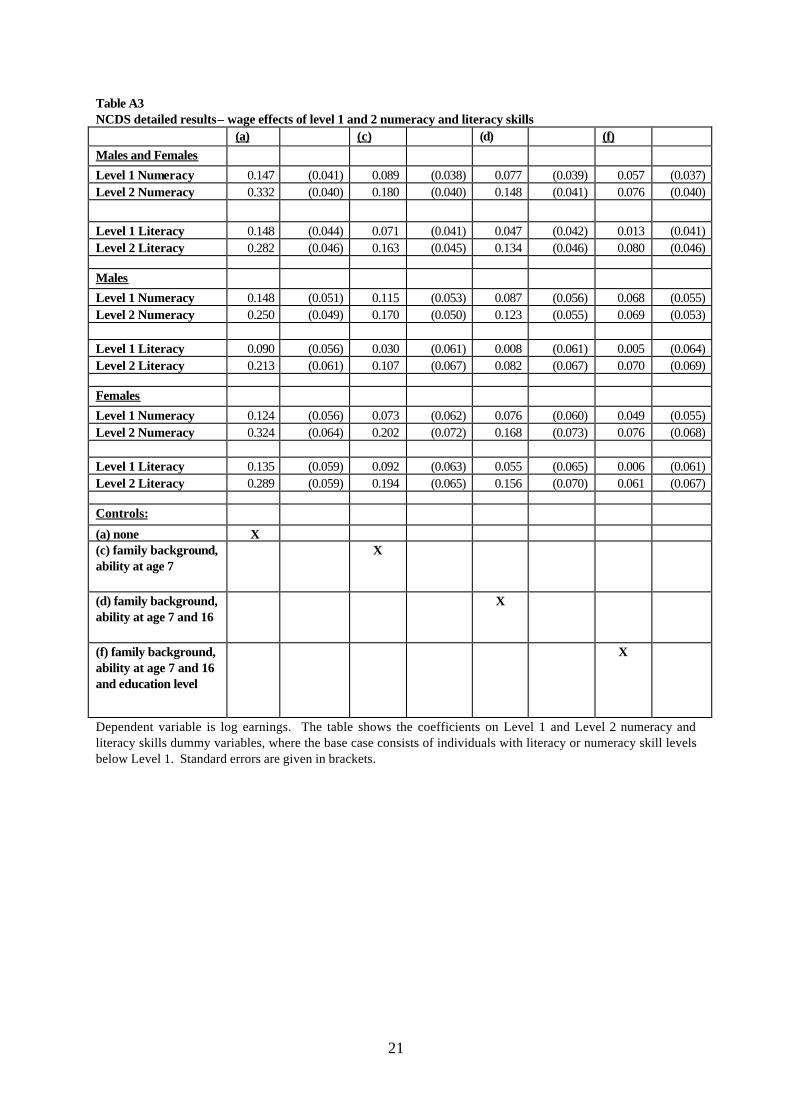
5.4 Detailed NCDS results – the effect of literacy and numeracy on wages The summary results above hide some interesting nuances in the data. Table A3 in the appendix shows more detailed NCDS results, giving the effect of both Level 1 and Level 2 skills, analysed by gender.
The effect of having Level 1 numeracy skills is similar for men and women, i.e. associated with a wage premium of around 15% with no controls. Again in the specification without controls, Level 2 numeracy skills have a slightly larger effect for women (32% wage premium) than for men (25%). In our preferred specification (c), which takes account of family background and early ability only, the wage premium to Level 1 numeracy skills is only around 7% for women and 12% for men. The wage gain from Level 2 numeracy skills is 20% for women and 17% for men.
Turning to literacy, the wage premium from Level 1 ranges from 9% for males to 14% for women, with no other controls. In our preferred specification (c), the wage gain falls to just 3% for males (insignificant) and 9% for women (insignificant). However, individuals with Level 2 literacy skills do earn considerably more than their peers with lower level literacy skills, even when other controls are added to the model. Hence with no controls females with Level 2 literacy earn 29% more than women with lower level skills, males 21% more. Controlling for family background and early ability, these wage premia fall to 19% and 11% respectively (although the coefficient is insignificant for men).
In summary, women seem to earn a higher premium from having better numeracy and literacy skills than men, in most specifications. The exception is that men have a slightly higher return from Level 1 numeracy skills. Although the positive effect on wages from Level 1 skills is often insignificant when controls are added to the equations, the effect of Level 2 skills is large (for numeracy and literacy) and significant, even in specification (d), including age 16 ability. By and large the numeracy effects appear larger than the literacy effect in the NCDS.
It should be noted that the results are sensitive to the definition of the base group. For literacy, we could not successfully examine the returns to literacy levels relative to the ‘Below Entry’ group, because of the small number of respondents (6% of the total sample) in this group. For numeracy, however, the larger number of individuals with ‘Below Entry’ level skills allowed us to examine the returns to all other levels, relative to this very low level. With no controls (specification (a)), the effect of having even just Entry Level numeracy skills is quite substantial. Those with Entry Level numeracy skills earn a 19% wage premium over those with below Entry Level. Compared to this very low achieving base group, the wage premium from Level 1 skills obviously rises too (up to 27%). Even in the saturated specification (f), including education level and age 7 and 16 ability, the wage premium to Entry Level and Level 1 remains substantial at around 11%, compared to the base group with extremely poor skills. This would seem to suggest to policy-makers that the jump between Below Entry and Entry Level particularly for numeracy might be critical, in terms of yielding benefits in terms of higher earnings.
Another experiment we conducted was to examine whether more able individuals, based on their age 7 ability tests, earn a higher return to their literacy and numeracy skills32. To test whether the returns to basic skills varied by age 7 ability, we included four interactions in the wage equation which measured the effect of Level 1 and Level 2 literacy and numeracy skills respectively, for ‘high ability’ individuals. Only one of the interaction terms achieved statistical significance, however, and
32 Although obviously age 7 ability and numeracy/literacy skills at age 37 are correlated.
14
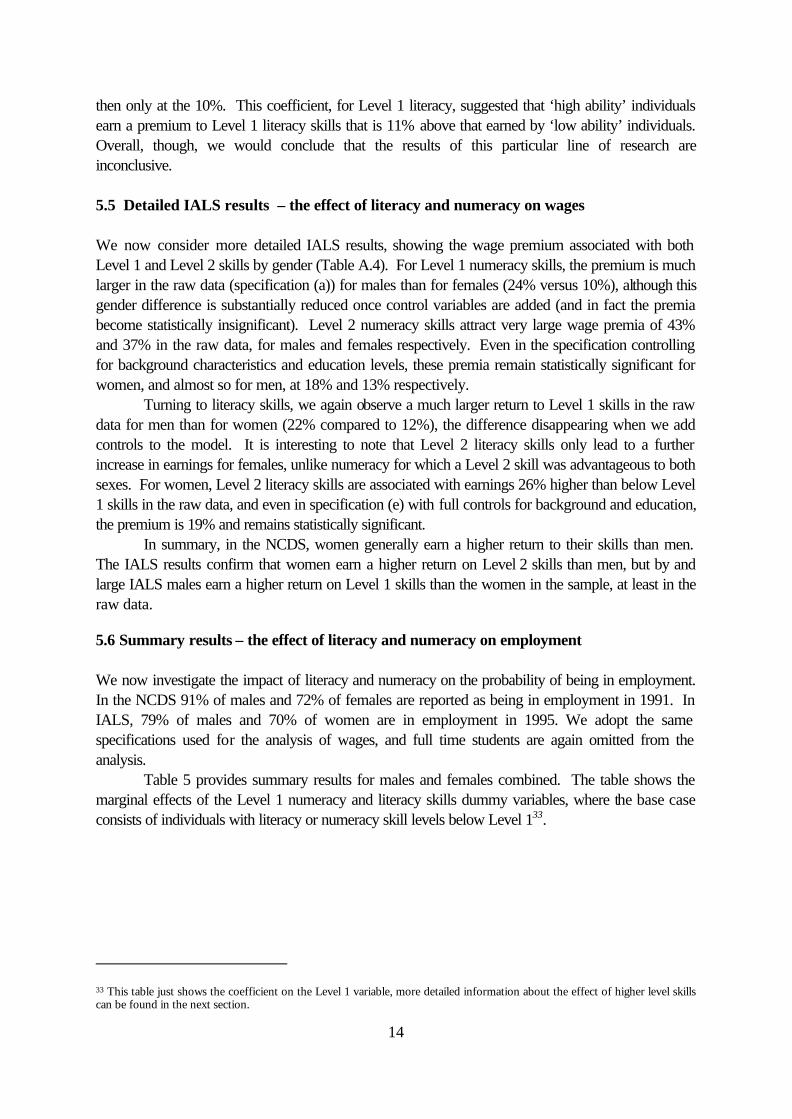
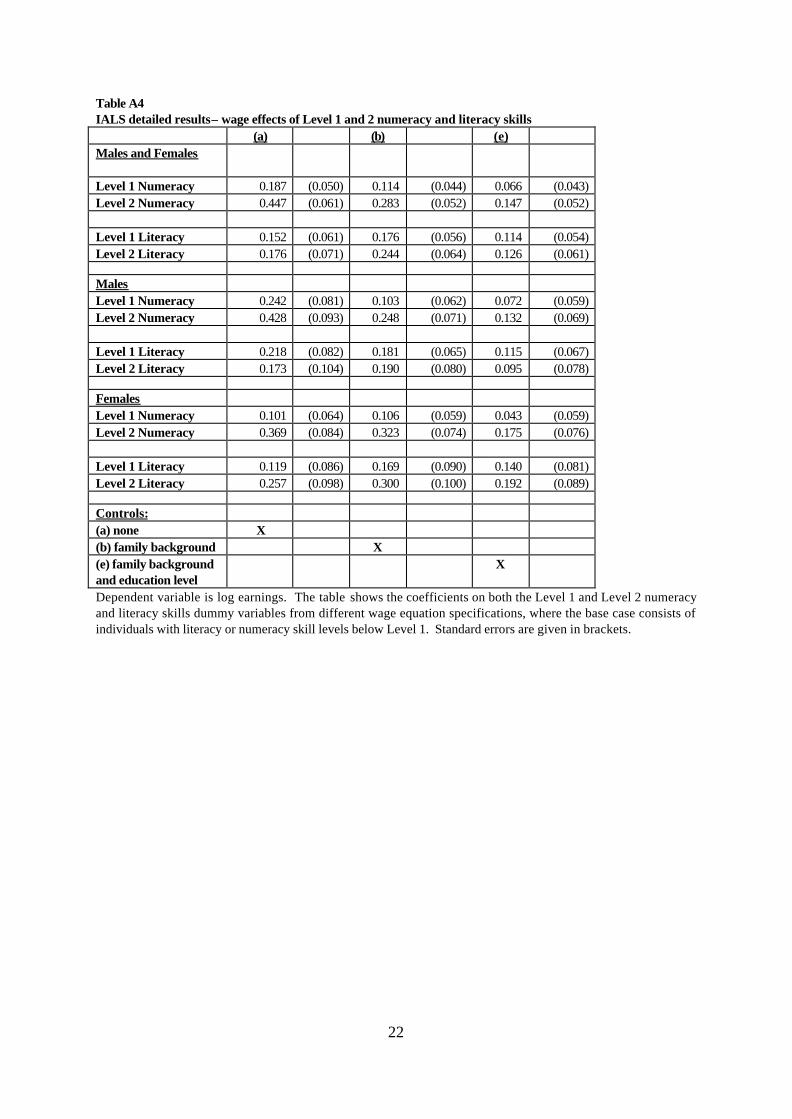
then only at the 10%. This coefficient, for Level 1 literacy, suggested that ‘high ability’ individuals earn a premium to Level 1 literacy skills that is 11% above that earned by ‘low ability’ individuals. Overall, though, we would conclude that the results of this particular line of research are inconclusive. 5.5 Detailed IALS results – the effect of literacy and numeracy on wages We now consider more detailed IALS results, showing the wage premium associated with both Level 1 and Level 2 skills by gender (Table A.4). For Level 1 numeracy skills, the premium is much larger in the raw data (specification (a)) for males than for females (24% versus 10%), although this gender difference is substantially reduced once control variables are added (and in fact the premia become statistically insignificant). Level 2 numeracy skills attract very large wage premia of 43% and 37% in the raw data, for males and females respectively. Even in the specification controlling for background characteristics and education levels, these premia remain statistically significant for women, and almost so for men, at 18% and 13% respectively.
Turning to literacy skills, we again observe a much larger return to Level 1 skills in the raw data for men than for women (22% compared to 12%), the difference disappearing when we add controls to the model. It is interesting to note that Level 2 literacy skills only lead to a further increase in earnings for females, unlike numeracy for which a Level 2 skill was advantageous to both sexes. For women, Level 2 literacy skills are associated with earnings 26% higher than below Level 1 skills in the raw data, and even in specification (e) with full controls for background and education, the premium is 19% and remains statistically significant.
In summary, in the NCDS, women generally earn a higher return to their skills than men. The IALS results confirm that women earn a higher return on Level 2 skills than men, but by and large IALS males earn a higher return on Level 1 skills than the women in the sample, at least in the raw data.
5.6 Summary results – the effect of literacy and numeracy on employment We now investigate the impact of literacy and numeracy on the probability of being in employment. In the NCDS 91% of males and 72% of females are reported as being in employment in 1991. In IALS, 79% of males and 70% of women are in employment in 1995. We adopt the same specifications used for the analysis of wages, and full time students are again omitted from the analysis.
Table 5 provides summary results for males and females combined. The table shows the marginal effects of the Level 1 numeracy and literacy skills dummy variables, where the base case consists of individuals with literacy or numeracy skill levels below Level 133.
33 This table just shows the coefficient on the Level 1 variable, more detailed information about the effect of higher level skills can be found in the next section.

15
Table 5 Employment effects associated with Level 1 numeracy and literacy skills
(a) (b) (c) (d) (e) (f) Numeracy Level 1 IALS Estimates 0.056 0.033 0.020 (0.028) (0.029) (0.029) NCDS Estimates 0.045 0.045 0.048 0.042 0.027 0.029 (0.023) (0.022) (0.022) (0.023) (0.023) (0.024) Literacy Level 1 IALS Estimates 0.134 0.122 0.096 (0.027) (0.028) (0.029) NCDS Estimates 0.051 0.034 0.039 0.030 -0.003 0.002 (0.026) (0.026) (0.026) (0.027) (0.027) (0.027) Controls Family background X X X X X Age 7 ability X X X Age 16 ability X X Education level X X Note: Results are marginal effects for men and women combined. Dependent variable is a binary variable equal to one if the person is employed. Standard errors are given in brackets.
Once again, the IALS and NCDS results for numeracy are remarkably similar. With no controls in the model (a), having Level 1 numeracy skills is associated with a 5 percentage points higher probability of being in employment, as compared to individuals with numeracy skills below Level 1. Adding in family background and other personal characteristics (b) reduces the effect to 3 percentage points in IALS, although the difference from the raw specification which excludes any other controls is not significant. With the NCDS results, there is no effect at all from adding in family background variables. Even when age 7 ability (c) and age 16 ability (d) are added to the model, the increased chances of employment for those with Level 1 numeracy skills remain essentially unchanged. The only controlling variable that seems to have any effect on the probability of employment is education level. Once we control for individuals’ qualifications, the marginal effect of Level 1 numeracy skills on the probability of employment falls to 2-3 percentage points, whether or not early ability is controlled for (e and f).
Again, the IALS and NCDS literacy results differ substantially. Specifically, the magnitude of the positive effects from Level 1 literacy is greater in IALS. In the specification with no controls (a), having Level 1 literacy skills is associated with a 5 percentage point higher probability of employment in the NCDS, and a 13 percentage point higher probability in IALS. Again, the crucial controlling variable is education level; once qualifications are added to the model, there is no effect from Level 1 literacy in the NCDS but a 10 percentage point higher probability of employment in IALS. Given that IALS covers the entire age range (16-64) and therefore has a lower aggregate level of employment than the NCDS sample, and that IALS cannot control for age 7 ability, perhaps these differences are unsurprising.
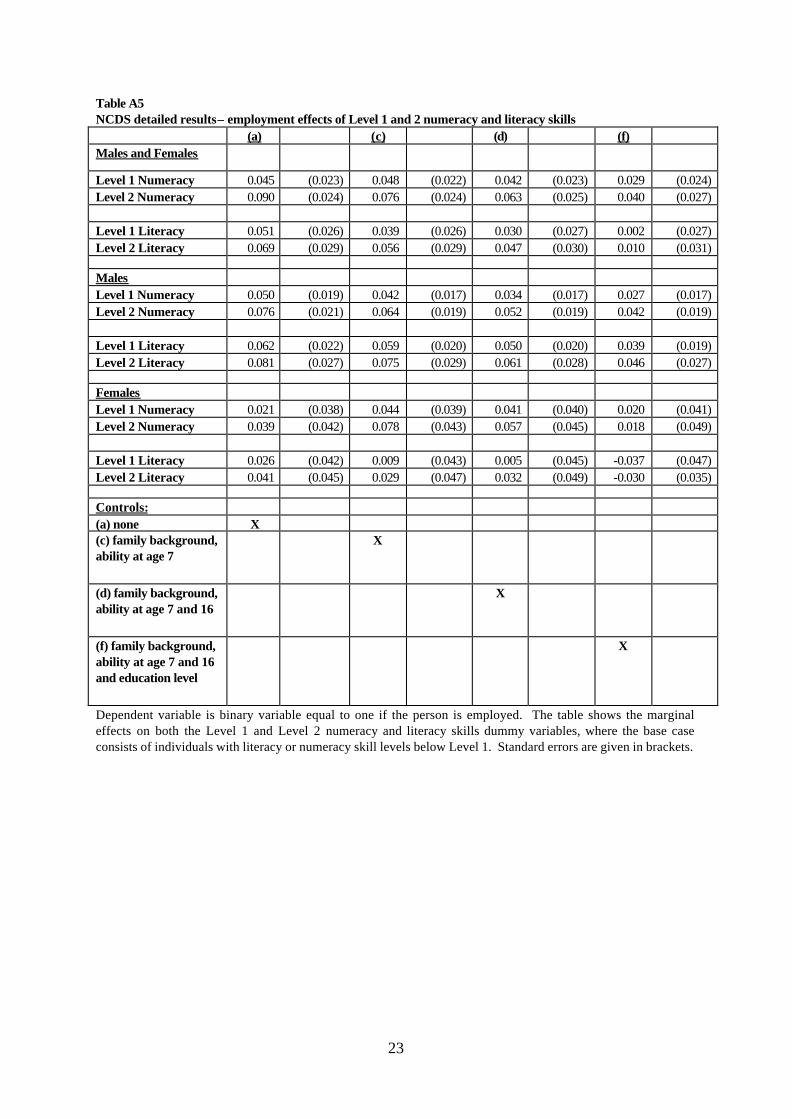
5.7 Detailed NCDS results – the effect of literacy and numeracy on employment Table A5 in the appendix shows more detailed NCDS results, focusing particularly on the gender differences in the effect of Level 1 and Level 2 skills on the probability of employment. In specification (a) without controls, it is apparent that numeracy and literacy skills are more important determinants of employment for males. The magnitude of the literacy and numeracy coefficients in

16
the female wage equations are generally much smaller and statistically insignificant. The female employment rate is much lower in the NCDS sample, and one might expect that child-rearing decisions would have a greater impact on female participation decisions34. This may confound the effects of numeracy and literacy. For example, if more educated and hence more literate/numerate women have children later (mid thirties), it is possible that the NCDS survey in 1991, when respondents were aged 33, will show a lower employment rate for more literate/numerate women. Conditioning for whether a woman has a child or not does increase the positive impact of numeracy on employment slightly, consistent with this argument, although including the child dummy has mixed effects on the generally insignificant literacy variables.
If one focuses only on males, the results differ quite considerably from the summary given in Table 5. Table 5, which presented results for males and females combined, suggested that any positive effect on employment from higher literacy skills was small and fell to zero in the full specification (f). However, for males this is not so. For males, the positive effects from Level 1 numeracy and literacy skills on the probability of employment are quite similar and sizeable (3-4 percentage points), even once education level and age 16 ability are added to the model, as in specification (f). Level 2 numeracy and literacy skills are associated with a 4-5 percentage point higher probability of employment for males. Hence although the NCDS literacy results are still considerably smaller than those found in IALS (see next section), better literacy skills are still associated with positive employment outcomes for males.
As for the wage analysis, we again also investigated the effect of using individuals with very low or Below Entry Level skills as the base group. Without controls (a), the effect from having even just Entry Level numeracy skills is an 8 percentage points increase in the probability of employment. The effect from Level 1 skills, compared to Below Entry numeracy skills, is 9 percentage points. This indicates that there is a distinct jump between Below Entry and Entry Level numeracy skills, in terms of their impact on employment. This replicates the wage results. The findings also hold up in the specification with full controls (f).35
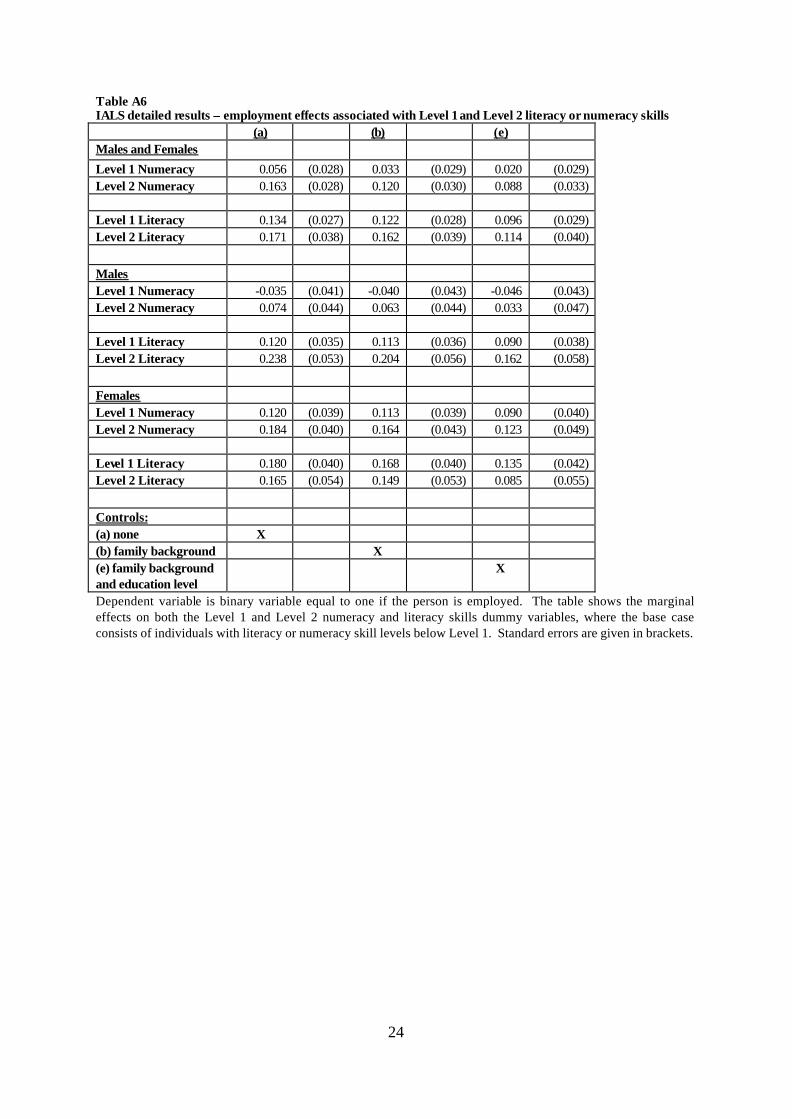
5.8 Detailed IALS results – the effect of literacy and numeracy on employment This section gives more detail on the effects of literacy and numeracy on employment in IALS. The most striking feature of Table A.6 is once again the relatively large literacy effects, as compared to the previous NCDS results. Possible reasons for this have already been discussed. For women, the IALS numeracy effects are also larger.
Table A6 also highlights the substantial gender differences within the IALS sample. For women, in the specification with no controls (a), Level 1 numeracy is associated with a 12 percentage point higher probability of being employed, the corresponding figure for Level 2 numeracy skills is 18 percentage points. Even in specification (e), controlling for education level, women with Level 1 numeracy are 9 percentage points more likely to be employed and women with Level 2 numeracy skills are 12 percentage points more likely to be employed. These are clearly very sizeable effects. However for males, even in the specification with no controls (a), Level 1 numeracy skills do not increase the probability of being employed and Level 2 skills increase it by
34 Indeed if a dummy variable indicating whether the woman has a child is entered into the equation it is always negative and significant.
35 The literacy results are again mixed in sign and statistically insignificant when the Below Entry Level group is used as the base case, due to the very small size of this group.
17
just 7 percentage points36. In other words, more numerate women are substantially more likely to be employed but numeracy skills do not seem as important for males. These results contradict the NCDS results in that the effects for female are so much stronger in IALS. This does not however, reflect the fact that IALS includes a wider age range of women, since the IALS results for women age 30-40 are quite similar to the results for the entire age range. We conclude that the literacy results differ between NCDS and IALS (for the wage and employment equations) primarily because the tests are different.
6. Conclusions The UK government has set ambitious targets to improve the literacy and numeracy skills of British workers. Specifically the target is for 90% of all adults to achieve a minimum of BSA Level 1 literacy, and 70% of adults to achieve Level 1 numeracy, by 2010. This appears to be a major undertaking, given that those proportions currently stand at approximately 80% and 50-60%, for literacy and numeracy respectively. This paper has investigated the difficulties in measuring these basic skills, and estimated the potential private return to improving adult numeracy and literacy, looking specifically at the effect of these skills on earnings and employment rates.
We conclude that obtaining consistent measures of individuals’ literacy and numeracy skill levels is problematic, at least in the UK. Both the data sets used in this paper suffer from significant, but different, measurement problems. The NCDS data is extremely rich, but the literacy and numeracy tests used for the NCDS have generated somewhat inconsistent estimates of the extent of literacy/numeracy problems in the UK. The IALS data may be more robust; it is based on a lengthier test and uses a more sophisticated assessment system. However, even IALS suffers from a number of potential measurement difficulties, particularly when making international comparisons of literacy/numeracy levels. All this suggests some caution when interpreting the results presented here. Future research should also concentrate on generating robust measures of numeracy and literacy, which have been thoroughly tested in replication studies.
Nonetheless our evidence is convincing. Not taking into account other factors that influence earnings, individuals with Level 1 numeracy skills earn around 15-19% more than those with skills below this level. Even after allowing for an independent effect from the worker’s education/qualification level (specification f), workers with Level 1 numeracy skills earn around 6% more than their less skilled peers. Since this model specification, using NCDS data, conditions for an individual’s initial ability in reading and mathematics on entering school, their ability at age 16 and also their education level, one might argue that this a lower bound on the effect on earnings from improving adult basic skills. The evidence also suggests that better numeracy is associated with higher employment rates. Specifically, individuals with Level 1 numeracy skills are around five percentage points more likely to be employed (not taking into account other factors). Even in the full model which conditions for a person’s education level (specification f), Level 1 numeracy skills are still associated with having a 3 percentage point higher probability of being in employment.
The evidence on literacy is more mixed and there are significant differences between the two data sets used. With no controls, Level 1 literacy is associated with 15% higher earnings (similar to 36 However, these results are again sensitive to specification. There is a big jump in the probability of employment for males with Entry level numeracy skills, relative to those with below Entry skills.

18
the numeracy effect), although once other variables are added to the model the effect from Level 1 literacy is reduced to 1% in the NCDS but remains at 11% in IALS. We have rehearsed a number of arguments, relating to measurement error and other issues, which might explain the differences between the two data sets. However, we cannot give conclusive guidance as to the validity of one data set over another and therefore suggest that the high wage gain from literacy shown in the IALS data be taken seriously. We also note that the IALS data suggest that, whilst numeracy skills may be slightly more important for earnings, literacy skills have a bigger impact on the probability of being employed. In general we conclude that, although many more individuals have poor numeracy skills than have poor literacy skills, the empirical evidence on the effects of basic skills supports the view that both literacy and numeracy skills are important determinants of economic outcomes.
19
Appendix
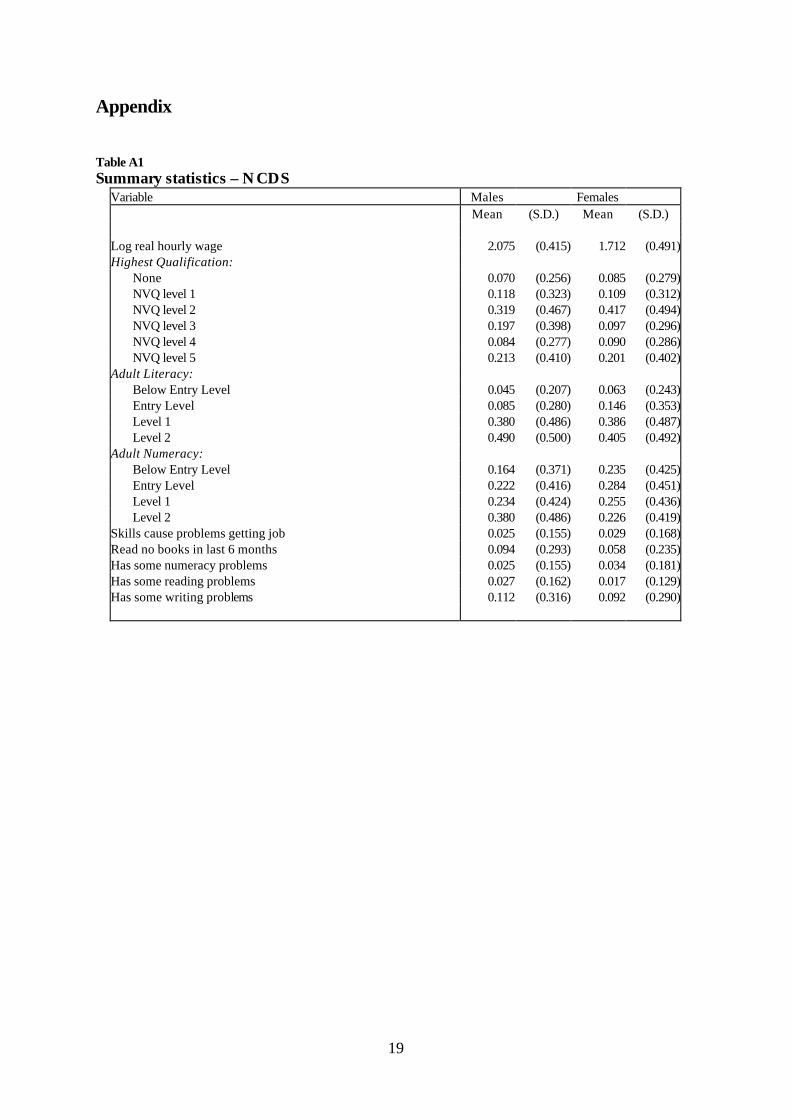
Table A1 Summary statistics – NCDS
Variable Males Females Mean (S.D.) Mean (S.D.) Log real hourly wage 2.075 (0.415) 1.712 (0.491)Highest Qualification: None 0.070 (0.256) 0.085 (0.279) NVQ level 1 0.118 (0.323) 0.109 (0.312) NVQ level 2 0.319 (0.467) 0.417 (0.494) NVQ level 3 0.197 (0.398) 0.097 (0.296) NVQ level 4 0.084 (0.277) 0.090 (0.286) NVQ level 5 0.213 (0.410) 0.201 (0.402)Adult Literacy: Below Entry Level 0.045 (0.207) 0.063 (0.243) Entry Level 0.085 (0.280) 0.146 (0.353) Level 1 0.380 (0.486) 0.386 (0.487) Level 2 0.490 (0.500) 0.405 (0.492)Adult Numeracy: Below Entry Level 0.164 (0.371) 0.235 (0.425) Entry Level 0.222 (0.416) 0.284 (0.451) Level 1 0.234 (0.424) 0.255 (0.436) Level 2 0.380 (0.486) 0.226 (0.419)Skills cause problems getting job 0.025 (0.155) 0.029 (0.168)Read no books in last 6 months 0.094 (0.293) 0.058 (0.235)Has some numeracy problems 0.025 (0.155) 0.034 (0.181)Has some reading problems 0.027 (0.162) 0.017 (0.129)Has some writing problems 0.112 (0.316) 0.092 (0.290)
20
Table A2 Summary statistics – IALS Variable Men Women Mean (S.D) Mean (S.D.) Highest qualification None 0.280 (0.449) 0.316 (0.465) NVQ level 1 0.142 (0.349) 0.151 (0.358) NVQ level 2 0.210 (0.407) 0.256 (0.436) NVQ level 3 0.159 (0.366) 0.100 (0.300) NVQ level 4 0.072 (0.258) 0.090 (0.286) NVQ level 5 0.138 (0.344) 0.087 (0.282) Other Variables Wage (1-5 scale) 3.699 (1.240) 2.502 (1.298) Age 39.10 (13.90) 39.33 (13.57) Literacy skills at entry level or below 0.209 (0.407) 0.225 (0.417) Literacy skills at level 1 0.297 (0.457) 0.310 (0.462) Literacy skills at level 2 0.494 (0.500) 0.466 (0.499) Numeracy skills at entry level or below 0.444 (0.497) 0.580 (0.494) Numeracy skills at level 1 0.303 (0.460) 0.304 (0.460) Numeracy skills at level 2 0.253 (0.435) 0.117 (0.321)
21
Table A3 NCDS detailed results– wage effects of level 1 and 2 numeracy and literacy skills (a) (c) (d) (f) Males and Females
Level 1 Numeracy 0.147 (0.041) 0.089 (0.038) 0.077 (0.039) 0.057 (0.037) Level 2 Numeracy 0.332 (0.040) 0.180 (0.040) 0.148 (0.041) 0.076 (0.040)
Level 1 Literacy 0.148 (0.044) 0.071 (0.041) 0.047 (0.042) 0.013 (0.041) Level 2 Literacy 0.282 (0.046) 0.163 (0.045) 0.134 (0.046) 0.080 (0.046) Males
Level 1 Numeracy 0.148 (0.051) 0.115 (0.053) 0.087 (0.056) 0.068 (0.055) Level 2 Numeracy 0.250 (0.049) 0.170 (0.050) 0.123 (0.055) 0.069 (0.053) Level 1 Literacy 0.090 (0.056) 0.030 (0.061) 0.008 (0.061) 0.005 (0.064) Level 2 Literacy 0.213 (0.061) 0.107 (0.067) 0.082 (0.067) 0.070 (0.069) Females
Level 1 Numeracy 0.124 (0.056) 0.073 (0.062) 0.076 (0.060) 0.049 (0.055) Level 2 Numeracy 0.324 (0.064) 0.202 (0.072) 0.168 (0.073) 0.076 (0.068) Level 1 Literacy 0.135 (0.059) 0.092 (0.063) 0.055 (0.065) 0.006 (0.061) Level 2 Literacy 0.289 (0.059) 0.194 (0.065) 0.156 (0.070) 0.061 (0.067) Controls:
(a) none X (c) family background, ability at age 7
X
(d) family background, ability at age 7 and 16
X
(f) family background, ability at age 7 and 16 and education level
X
Dependent variable is log earnings. The table shows the coefficients on Level 1 and Level 2 numeracy and literacy skills dummy variables, where the base case consists of individuals with literacy or numeracy skill levels below Level 1. Standard errors are given in brackets.
22
Table A4 IALS detailed results– wage effects of Level 1 and 2 numeracy and literacy skills (a) (b) (e) Males and Females
Level 1 Numeracy 0.187 (0.050) 0.114 (0.044) 0.066 (0.043) Level 2 Numeracy 0.447 (0.061) 0.283 (0.052) 0.147 (0.052) Level 1 Literacy 0.152 (0.061) 0.176 (0.056) 0.114 (0.054) Level 2 Literacy 0.176 (0.071) 0.244 (0.064) 0.126 (0.061) Males Level 1 Numeracy 0.242 (0.081) 0.103 (0.062) 0.072 (0.059) Level 2 Numeracy 0.428 (0.093) 0.248 (0.071) 0.132 (0.069) Level 1 Literacy 0.218 (0.082) 0.181 (0.065) 0.115 (0.067) Level 2 Literacy 0.173 (0.104) 0.190 (0.080) 0.095 (0.078) Females Level 1 Numeracy 0.101 (0.064) 0.106 (0.059) 0.043 (0.059) Level 2 Numeracy 0.369 (0.084) 0.323 (0.074) 0.175 (0.076) Level 1 Literacy 0.119 (0.086) 0.169 (0.090) 0.140 (0.081) Level 2 Literacy 0.257 (0.098) 0.300 (0.100) 0.192 (0.089) Controls: (a) none X (b) family background X (e) family background and education level
X
Dependent variable is log earnings. The table shows the coefficients on both the Level 1 and Level 2 numeracy and literacy skills dummy variables from different wage equation specifications, where the base case consists of individuals with literacy or numeracy skill levels below Level 1. Standard errors are given in brackets.
23
Table A5 NCDS detailed results– employment effects of Level 1 and 2 numeracy and literacy skills
(a) (c) (d) (f) Males and Females
Level 1 Numeracy 0.045 (0.023) 0.048 (0.022) 0.042 (0.023) 0.029 (0.024) Level 2 Numeracy 0.090 (0.024) 0.076 (0.024) 0.063 (0.025) 0.040 (0.027) Level 1 Literacy 0.051 (0.026) 0.039 (0.026) 0.030 (0.027) 0.002 (0.027) Level 2 Literacy 0.069 (0.029) 0.056 (0.029) 0.047 (0.030) 0.010 (0.031) Males Level 1 Numeracy 0.050 (0.019) 0.042 (0.017) 0.034 (0.017) 0.027 (0.017) Level 2 Numeracy 0.076 (0.021) 0.064 (0.019) 0.052 (0.019) 0.042 (0.019) Level 1 Literacy 0.062 (0.022) 0.059 (0.020) 0.050 (0.020) 0.039 (0.019) Level 2 Literacy 0.081 (0.027) 0.075 (0.029) 0.061 (0.028) 0.046 (0.027) Females Level 1 Numeracy 0.021 (0.038) 0.044 (0.039) 0.041 (0.040) 0.020 (0.041) Level 2 Numeracy 0.039 (0.042) 0.078 (0.043) 0.057 (0.045) 0.018 (0.049) Level 1 Literacy 0.026 (0.042) 0.009 (0.043) 0.005 (0.045) -0.037 (0.047) Level 2 Literacy 0.041 (0.045) 0.029 (0.047) 0.032 (0.049) -0.030 (0.035) Controls: (a) none X (c) family background, ability at age 7
X
(d) family background, ability at age 7 and 16
X
(f) family background, ability at age 7 and 16 and education level
X
Dependent variable is binary variable equal to one if the person is employed. The table shows the marginal effects on both the Level 1 and Level 2 numeracy and literacy skills dummy variables, where the base case consists of individuals with literacy or numeracy skill levels below Level 1. Standard errors are given in brackets.
24
Table A6 IALS detailed results – employment effects associated with Level 1 and Level 2 literacy or numeracy skills (a) (b) (e) Males and Females
Level 1 Numeracy 0.056 (0.028) 0.033 (0.029) 0.020 (0.029) Level 2 Numeracy 0.163 (0.028) 0.120 (0.030) 0.088 (0.033) Level 1 Literacy 0.134 (0.027) 0.122 (0.028) 0.096 (0.029) Level 2 Literacy 0.171 (0.038) 0.162 (0.039) 0.114 (0.040)
Males Level 1 Numeracy -0.035 (0.041) -0.040 (0.043) -0.046 (0.043) Level 2 Numeracy 0.074 (0.044) 0.063 (0.044) 0.033 (0.047) Level 1 Literacy 0.120 (0.035) 0.113 (0.036) 0.090 (0.038) Level 2 Literacy 0.238 (0.053) 0.204 (0.056) 0.162 (0.058)
Females Level 1 Numeracy 0.120 (0.039) 0.113 (0.039) 0.090 (0.040) Level 2 Numeracy 0.184 (0.040) 0.164 (0.043) 0.123 (0.049) Level 1 Literacy 0.180 (0.040) 0.168 (0.040) 0.135 (0.042) Level 2 Literacy 0.165 (0.054) 0.149 (0.053) 0.085 (0.055)
Controls: (a) none X (b) family background X (e) family background and education level
X
Dependent variable is binary variable equal to one if the person is employed. The table shows the marginal effects on both the Level 1 and Level 2 numeracy and literacy skills dummy variables, where the base case consists of individuals with literacy or numeracy skill levels below Level 1. Standard errors are given in brackets.

25
References ALBSU (1993), The Cost to British Industry: Basic Skills and the Workforce. Basic Skills Agency (1997), International Numeracy Survey: a Comparison of the Basic
Numeracy Skills of Adults 16-60 in Seven Countries, Basic Skills Agency: London. Blum, A. and Guerin-Pace, F. (2000), “Weaknesses and Defects of IALS”, in Carey, S. (ed),
Measuring Adult Literacy: The International Adult Literacy Survey in the European Context, Office for National Statistcis: London.
Bynner, J. and Parsons, S. (1997a.), It Doesn’t Get Any Better: The Impact of Poor Basic Skills
on the Lives of 37 Year-Olds, Basic Skills Agency: London. Bynner, J. and Parsons, S. (1997b), Does Numeracy Matter? Basic Skills Agency: London. Carey, S., Low, S. and Hansbro, J. (1997), Adult Literacy in Britain, The Stationery Office:
London. Dearden, L., McIntosh, S., Myck, M. and Vignoles, A. (2000), “The Returns to Academic,
Vocational and Basic Skills in Britain,” DfEE Report. Department for Education and Employment (1997), Excellence in Schools, Cm 3681, July 1997. Department for Education and Employment (DfEE) (1999), Improving Literacy and Numeracy: a
Fresh Start, Great Britain Working Group on Post-School Basic Skills chaired by Sir Claus Moser, Department for Education and Employment: London.
Doyle, C., and Weale, M. (1994), ''Education, Externalities, Fertility and Economic Growth'',
Education Economics, Vol.2, No.2, pp.129-167. Goldstein, H. (2000), “IALS – A Commentary on the Scaling and Data Analysis” in Carey, S. (ed),
Measuring Adult Literacy: The International Adult Literacy Survey in the European Context, Office for National Statistics: London.
Green, F., Felstead, A., and Gallie, D. (1998), “Changing Skill-Intensity: an Analysis Based on Job
Characteristics”, working paper. Green, A., and Steedman, H. (1997), Into the Twenty-First Century: an Assessment of British
Skill Profiles, Special Report, Centre for Economic Performance, London School of Economics.
26
Grogger, J. and Eide, E. (1995), “Changes in College Skills and the Rise in the College Wage
Premium”, The Journal of Human Resources, 30, pp.280-310. Hanushek, E., and Kim, R. (1995), “Schooling, Labor Force Quality and Economic Growth”,
Rochester Centre for Economic Research, Working Paper No.411. Kenny, L.W., Lee, L., Maddala, G.S., and Trost, R.P. (1979), “Returns to College Education: an
Investigation of Self-selection Bias Based on the Project Talent Data”, International Economic Review, Vol.20, No.3, pp.775-789.
Keys, W., Harris, S. and Fernandes, C. (1996), Third International Mathematics and Science
Study, National Foundation for Educational Research: London. Maddala, G.S. (1977), Econometrics, McGraw-Hill: New York. Maddala, G.S. (1983), Limited-Dependent and Qualitative Variables in Econometrics,
Cambridge University Press: Cambridge. Murnane, R.J., Willett, J.B. and Levy, F. (1995), 'The Growing Importance of Cognitive Skills in
Wage Determination', Review of Economics and Statistics, 77, pp.251-66. Parsons, S., and Bynner, J. (1998), Influences on Adult Basic Skills: Factors Affecting the
Development of Literacy And Numeracy from Birth To 37, The Basic Skills Agency: London.
Reynolds, D. and Farrell, S. (1996), Worlds Apart? A Review of International Surveys of
Educational Achievement Involving England, Office for Standards in Education: London.
Robinson, P. (1997), “Literacy and Numeracy and Economic Performance”, Working Paper No.
888, Centre for Economic Performance, London School of Economics. Tyler, J.H., Murnane, R.J., and Willett, J.B. (1999), “Do the Cognitive Skills of School Dropouts
Matter in the Labor Market?”, National Bureau of Economic Research, Working Paper 7101.
Willis, R.J. and Rosen, S. (1979), “Education and Self-Selection”, Journal of Political Economy,
Vol.87, No.5, pp.S7-S37.
27
CENTRE FOR THE ECONOMICS OF EDUCATION
Recent Discussion Papers
1 A. Vignoles T. Desai E. Montado
An Audit of the Data Needs of the DfEE Centres for the Economics of Education and the Wider Benefits of Learning
2 A. Vignoles R. LevaÖiÉ J. Walker S. Machin D. Reynolds
The Relationship Between Resource Allocation and Pupil Attainment: A Review
To order a discussion paper, please contact the Publications Unit
Tel 020 7955 7673 Fax 020 7955 7595

28