cee dp 139 student awareness of costs and benefits of ...cee.lse.ac.uk/ceedps/ceedp139.pdf ·...
TRANSCRIPT
CEE DP 139
Student Awareness of Costs and Benefits of Educational Decisions: Effects of an Information
Campaign
Martin McGuigan
Sandra McNally
Gill Wyness
August 2012

Published by
Centre for the Economics of Education
London School of Economics
Houghton Street
London WC2A 2AE
© M. McGuigan, S. McNally and G. Wyness, submitted August 2012
All rights reserved. No part of this publication may be reproduced, stored in a retrieval
system or transmitted in any form or by any means without the prior permission in writing of
the publisher nor be issued to the public or circulated in any form other than that in which it
is published.
Requests for permission to reproduce any article or part of the Working Paper should be
sent to the editor at the above address.
The Centre for the Economics of Education is an independent multidisciplinary research
centre. All errors and omissions remain the authors.

Student Awareness of Costs and Benefits of Educational Decisions: Effects of an Information Campaign
Martin McGuigan
Sandra McNally
Gill Wyness
1. Introduction 2
2. A Brief Literature Review 3
3. The Institutional Context 6
4. The Experiment 9
Randomisation 9
Logistics 10
The treatment 11
Methodology 12
Baseline survey 12
Focus on soft outcomes 13
5. The Main Results 15
Knowledge of student finance and perception of costs 15
Perception of benefits 16
Costs and earnings expectations 16
Future intentions 17
Interpretation of main results 18
6. Heterogeneity 18
Media coverage 19
School type 20
Student’s socio-economic status 21
7. Conclusion 23
References 23
Figures 25
Tables 29
Appendices 41
Acknowledgments
Martin McGuigan is a PhD candidate at Queen’s Management School, Belfast. Sandra
McNally is Professor of Economics at the University of Surrey, a Research Fellow and
Director of the Education & Skills Programme at the Centre for Economic Performance,
London School of Economics and Deputy Director of the Centre for the Economics of
Education. Gill Wyness is a CEE Research Officer and a Research Associate at CentreForum.
The authors are grateful for financial support from the Economic and Social Research
Council. They would like to thank Cleveratom Ltd (particularly Hais Deakin) for developing
the website and Charley Greenwood, Robert French and Jo Cantlay for excellent research
assistance. They would like to thank participants of various seminars/conferences for
comments: the Centre for Economic Performance, LSE; the Institute for Fiscal Studies, the
University of Sheffield and the conference of the Association for Education, Finance and
Policy. In particular, they would like to thank Emla Fitzsimons, Eric Maurin, Steve Machin,
John Van Reenen, and Marcos Vera Hernandez for helpful discussions.

Executive Summary The economic benefits of staying on in education have been well established. But do students know this? One of the reasons why students might drop out of education too soon is because they are not well informed about the costs and benefits of staying on in education at an appropriate time of their educational career. Indeed, the fact that university fees have trebled in recent times (in England) have led to fears that many young people may be put off from participating in further and higher education – especially those from low income backgrounds. This could exacerbate inequalities that are already very stark. In this paper, we investigate students’ knowledge and their receptiveness to information campaigns about the costs and benefits of staying on in education. We design an ‘information campaign’ that provides some simple facts about economic and financial aspects of educational decisions and test students’ response to this campaign. The fieldwork for our information campaign mainly took place over the first two terms of 2010-2011 - the period in which the trebling of university fees was announced (amid much controversy). This provided us with an opportunity to measure students’ receptiveness to the surrounding publicity in the media. The material for our ‘information campaign’ consists of a (password protected) website, materials that can be used by the teacher (a video and presentation) and a one page flyer that can be handed out to students. The materials used in the research are now publicly available at http://www.whats4.me.uk/. All secondary schools in London were invited to take part in our study. Over 12,000 pupils from 54 schools took part in the main evaluation which took place over the school year 2010-2011. Within each school, all year 10 students (i.e. 14/15 year olds) completed a 40 minute survey (under exam conditions). They were then given a very similar survey to complete 8-12 weeks later. In between the two periods, some schools were given ‘information materials’ whereas other schools were given the materials some time later (after their students had completed the second survey). Schools were randomly assigned into two groups – with ‘treatment’ schools getting the materials between the two surveys and ‘control schools’ getting the materials some time later. The purpose was to test whether students in treatment schools showed any change in knowledge and aspirations 8-12 weeks later compared to students in the control schools. We also looked at the relationship between the number of media reports on tuition fees (on the BBC website) and students’ knowledge and aspirations at the time of each survey. One crucial difference between our information campaign and the media reporting is that the latter emphasised the huge rise in university fees, without always giving emphasis to the favourable terms of loans and the availability of grants. We chose Year 10 because these students do their GCSE exams one year later (Year 11), as well as make important decisions on what to do subsequently. The participating schools were above average in terms of GCSE performance and were relatively less deprived (in terms of percentage of students eligible to receive free school meals). The results indicate that students in participating schools have significant gaps in their basic knowledge about the costs and benefits of staying in education and going to university. However, the information experiment and media reporting worked in the same direction for knowledge of when fees are paid, increasing the probability of correctly understanding the basics of when fees are paid by 5.8 and 9 percentage points respectively (from a baseline of 46% of students, who knew the right answer in the first survey). Moreover, our information experiment increased the probability of agreeing that ‘student loans

are a cheaper/better way to borrow money than other types of borrowing’ by 7.6 percentage points (from a baseline of 48.6%) while media reporting had no effect. For the perceived importance of financial constraints on staying in education, the information experiment and media reporting had opposite effects. Our information campaign led students to think that staying in education would be affordable (loan conditions and grants were carefully explained) whereas media reporting led students to think that going to university would be ‘too expensive’. For example, the proportion of students put off by financial aspects of university fell by 5 percentage points. Media reporting, on the other hand, increased the negative perceptions of affordability in all cases, with, for example, the proportion of students put off by financial aspects of university increasing by 6.5 percentage points. This is a sizeable impact when put alongside the baseline levels of agreement of 25.7%. On knowledge about the benefits of staying in education, media reporting had no effect that is statistically different from zero. But the information experiment increased the probability that students perceive that they have a better chance of getting a job if they stay in education to the age of 18 or if they go to university. At the same time, the information experiment reduced the probability of agreeing with (incorrect) statements about choice of subject and university. Finally, the information experiment had an impact on whether students plan to stay in education - but no impact on university intentions. But the effect of media reporting was to reduce the probability of stating ‘it is very likely I will ever apply to university to do a degree’ by four percentage points. Our results indicate that media reporting and a fairly ‘light-touch’ information campaign have quite sizeable effects on student attitudes – at least in the short-term. Of course, this does not necessarily translate into behaviour. But there is certainly a strong correlation between students’ attitudes and their subsequent behaviour (as we show using the Longitudinal Survey of Young People in England). If there is a chain of causation between student beliefs about the affordability of higher education and how hard they work to ensure they can access opportunities, then informing students properly might also be a way of improving performance at GCSE. All the indications are that the hike in fees in late 2010 (and specifically, media reporting of the changes) increased the perception of going to university as ‘too expensive’. This perception was significantly higher in comprehensive schools (compared with independent and selective state schools) and among children eligible for free school meals. If these perceptions influence effort at school or behaviour post-16, this will increase socio-economic inequality in the future. On the positive side, a fairly light-touch information campaign in schools can reverse some of these negative effects. It can give a more rounded view of the reforms – stressing the availability of grants and how loans can be repaid – rather than focusing on the increase in fees per se. An information campaign like the one used in this project can be effective at a low cost. However, we should not assume that information gets conveyed in the right way – or at all – to students. Policy attention should focus on the incentives that schools have to invest time and effort in providing careers information (which is not regulated and does not influence ‘league tables’) as well as available resources to ensure that information is conveyed in an appropriate way.


2
1. Introduction
Economists are well aware of the economic benefits of staying on in education. However, we
do not know how well informed (or otherwise) students are of costs and benefits at the time
at which they make important decisions about their future. After the age of 16, students in
England can leave education permanently – and many do. At the end of 2011, 14.5% of 18
year olds were not in education, training or employment in England. Although there are many
possible reasons why students might not stay on, one possibility is that they are not well
informed about the benefits and costs of educational decisions. Lack of information might
also affect the choice of post-compulsory education (e.g. subject and institution of study). It
is important that students are well informed early on in their school career as if information
does play a role, it could influence effort in school exams (and/or effort in particular subjects).
This could influence their future trajectory as much weight is placed on how students do in
their age 16 exams (GCSEs) for what they are able to do later on.
In this study, we investigate what students know in a sample of London schools when
they are aged between 14 and 15. We design an ‘information campaign’ that gives some
simple facts about economic and financial aspects of educational decisions. We analyse the
impact of this information campaign on students’ knowledge and aspirations by use of a
randomised control trial. During the fieldwork for this study, the government announced the
trebling of university fees. This announcement received a great deal of media attention. We
investigate the impact of media reports on knowledge and aspirations.
The material for our ‘information campaign’ consists of a (password protected)
website, materials that can be used by the teacher (a video and presentation) and a one page
flyer than can be handed out to students. We survey whole year groups of 14-15 year olds on
two occasions, 8-12 weeks apart. This mainly took place over the first two terms of the
academic year 2010-2011. We evaluate whether students receiving the material in-between
the two surveys demonstrated different knowledge and aspirations by the time of the second
survey, relative to students in schools that obtained the material at a later stage.
The students in our study appear to have fairly low baseline knowledge but the
information materials offered have a significant effect both on knowledge and on future
aspirations. In many cases, the magnitude of the effect is comparable to the effect of media
reports (which we measure between the two surveys for every school). Also, it can work in
the opposite direction – countering some of the imbalance in the media reporting about
government announcements on student fees. The analysis of our experiment and the (non-
experimental) media campaign suggests that ‘information’ has an important role in this
3
context – at least in terms of knowledge and perceptions. From a policy perspective, perhaps
most troubling is the finding that disadvantaged young people (who would be eligible for
large bursaries) appear to react to media reports by saying that going to university is ‘too
expensive’ – and that the magnitude of the change is twice as high as that for other students.
More positively, our information campaign shows that fairly ‘light-touch’ information
campaigns can really help to mitigate these concerns.
Thus, our contribution to the literature on the effects of information is to conduct a
study about English students at a time close to when they make important decisions and
investigate the impact of a simple information campaign, at the same time as significant
changes are taking place in the ‘real world’ about tuition fees. The study covers about 10% of
the schools (54/515) in London and all students within particular year groups in these schools.
This is one of the first studies to use randomised control trials at this sort of scale to evaluate
an education intervention in the UK.
The paper continues as follows. Section 2 reviews some relevant literature in this field.
Section 3 describes the institutional structure in the UK. Section 4 provides a detailed
description of the experiment and data. Section 5 then describes the main results. In Section 6
we look in detail at different groups within the sample, exploring results by extent of media
exposure on tuition fees between surveys, school type and social background. We conclude in
Section 7.
2. A Brief Literature Review
There is a growing literature about how students make decisions on their future careers –
including the formation of wage expectations. There is also a literature specifically about the
effects of providing information – in a similar context to our study and in economics more
generally. We discuss some of these studies.
A number of studies investigate the wage expectations of students (usually when they
are at university). Dominitz and Manski (1996) and Betts (1996) are two early examples of
studies in this literature. The former look at student expectations of the returns to different
types of schooling using a computer based survey. The survey contains questions about their
unconditional earnings expectations at ages 30 and 40, their expected earnings under
hypothetical schooling scenarios (e.g. if they were to go to college/ finish high school), their
expectations of the level of schooling they will actually attain, and their beliefs about the
current earnings distribution at various schooling levels. They find that although respondents
perceive a positive return to a degree, there is a lot of variation between respondents and also
4
a high degree of uncertainty. In comparing beliefs to reality, male respondents are more likely
to have an accurate perception of true (current) male earnings, but female respondents over-
estimate current earnings. Respondents also tend to over-estimate the extent of earnings
inequality compared with reality.
Betts (1996) studies access to information and knowledge of future wages among
undergraduates at the University of California, San Diego. The survey covers their
perceptions of national salaries under different scenarios. On average, students make accurate
estimations of the starting salaries of young workers, but their estimates get progressively
worse as they need to take account of the effects of experience. Students also perform poorly
at estimating salaries outside their own field of study. There is also some evidence of
heterogeneity: students from lower socio-economic groups give lower earnings estimates;
students in the final years of college have lower wage expectations than those in the first year,
suggesting that knowledge is constantly updated.
Several recent studies have considered wage expectations while also studying the
effects of providing information. For example, Nguyen, (2008) looks at the perceived returns
to primary and secondary schooling among households in rural Madagascar, concentrating on
the knowledge and perceptions of parents. The baseline survey reveals a high degree of
uncertainty and much variation between respondents. 30% of parents are unable to answer
simple questions on the returns to education and those from poorer areas are found to have
lower expectations compared to those from richer areas. The more prosperous think they will
earn a lot irrespective of their education level. The experiment involves providing various
treatments to parents. The first provides parents with simple statistics on returns to education.
The second treatment uses a role model to present his/her success story, while a third
treatment group receives both statistics and the role model. He finds that the pure statistics
intervention leads to a significant reduction in the gap between baseline perceived returns and
actual returns, driven by increased accuracy among poor households. He also finds evidence
of a behavioural response - the statistics intervention improved test scores and school
attendance five months later. However, the role model intervention resulted in no significant
change in the perception of returns to education.
Again testing the impact of an information campaign in a developing country, Jensen
(2009) undertakes a study of the perceived returns to education and the demand for schooling
in the Dominican Republic. He first surveys household members to estimate actual wage
returns, and then goes on to interview students about their knowledge and perceptions of
returns. He finds the perceived return to secondary school to be very low compared with

5
reality. He implements an information experiment by providing a statement with facts about
returns to education to students at randomly selected schools. He finds the intervention to
significantly increase the perceived returns to education, and also finds evidence of a
behavioural response on outcomes such as the likelihood of returning to school in the next
academic year, completing high school and years of schooling.
The above papers are similar to this one for testing the impact of providing
information to students. However, the focus is on expected returns. More similar to our paper
is that by Oreopoulous and Dunn (2009). They evaluate the impact of information about costs
and benefits of remaining in education on disadvantaged high school students in Toronto. In a
computer based survey and intervention, students are randomly selected to view a video
which gives simplified information about costs, benefits and access to university. Students
are also invited to try out an online financial aid calculator. While most survey participants
intend to go to university, students exposed to the intervention are more likely to say they
aspire to complete a degree and have higher expectations of the returns. Despite high attrition
rates, the results point clearly to the relevance of information provision and how it is
presented.
Booji et al. (2012) look at the role of information for influencing student attitudes
towards the cost of education in The Netherlands. They use a representative sample of
students in higher education. Half of these students are given information about loan
conditions (including interest rates, the maximum loan amount, the grace period and the
repayment period). Results indicate that Dutch students are relatively poorly informed about
loan conditions and that information significantly improves knowledge. However, while the
experiment influences knowledge, it does not affect actual behaviour: loan take-up is not
significantly different between the treatment and control group after the treatment. This
suggests that while information campaigns are successful in improving student knowledge,
they are not always sufficient to influence behaviour.
Bettinger et al (2009) undertake an experiment to examine the influence of providing
information and help to students with college financial aid forms in Ohio and Carolina. They
find no effect of the ‘information only’ treatment on the probability of applying for financial
aid. However, they find impressively large effects for those who also received help with
filling in their forms and having them sent off. This is another case where information alone
is not sufficient to generate an effect on behaviour.
Finally, there are several other papers that look at effects of providing information in
different contexts. For example, Duflo and Saez (2003) investigate the impact of information
6
about pensions on retirement behaviour in the US; Liebman and Luttmer (2010) consider
how information about Social Security provisions affects labour market participation in the
US. Duflo et al. (2006) and Dupas (2006) evaluate the effects of information about HIV/AIDs
prevention in Kenya. All these studies show a strong link between information, attitudes and
actual behaviour.
In our study, we cannot consider the behavioural consequences of the information
campaign. We can only consider how the information affects knowledge and attitudes. While
information is not a sufficient condition to affect behaviour, it is very likely to be a necessary
condition. Furthermore, it is reasonable to expect a link between student’s motivation to stay
on in education and their actual probability of doing so. This is one of the issues considered
in Section 4, with the use of the Longitudinal Survey of Young People in England.
3. The Institutional Context
In England, compulsory education currently lasts up to age 16. During their final compulsory
school year (Year 11), students decide what subjects they want to study the following year (if
they intend to continue their education) and apply to different educational providers (if their
school does not provide for their educational requirements after age 16). At the end of Year
11, all students take their GCSE exams.
There are many colleges of further education which provide vocational courses and
some ‘sixth form’ colleges that offer preparation for academic exams at age 18 (A-levels).
The usual (though not exclusive) route into higher education is to take A-levels, either at a
school providing age 11-18 education or at a sixth form college.
2The higher education sector is dominated by publicly funded universities . As a result
of rapid expansion in the number of students going to university over recent decade, the
government has implemented a series of major funding policy changes. In particular, the UK
has moved from a situation where higher education was free of charge to all students to a
system where students are expected to contribute a significant proportion of the cost of their
education.
Tuition fees were first introduced to the UK in 1998. The fees (of up to £1,000 per
year) were payable upfront and means-tested according to parental income. In 2006, upfront
fees were abolished and replaced by a deferred £3,000 fee – payable by all regardless of
parental income but fully covered by a fee loan with quite generous terms. The 2006 reforms
2 There are only 2 privately owned degree-granting institutions in the UK, versus 120 publicly owned
universities

7
were met with much controversy, particularly since participation has consistently been
dominated by youths from high socio-economic groups while those from poorer backgrounds
tend to be under-represented (Blanden et al, 2003). As part of the package of the 2006
reforms, it was agreed that the move to deferred fees would be subject to an independent
review once all students in the system were paying the full fee. As degrees typically take
three years, the review was set for 2009, a time of severe economic conditions.
3The ‘Browne review’ reported in October 2010, and the most controversial of its
recommendations – that the tuition fee cap, which had risen to £3,300 per year at the time of
4the review, should be removed altogether – received a great deal of press attention. It was
generally accepted that tuition fees would rise substantially as a result of the review. The
government response to the review came shortly afterwards, in November 2010, with the
announcement that fees would not be unlimited but would instead be capped at £9,000 per
year, and furthermore, that government funding for certain subjects would be removed
altogether so that they would be funded entirely by tuition fees. Again, this announcement
received a great deal of press attention, with much coverage focusing on the potential
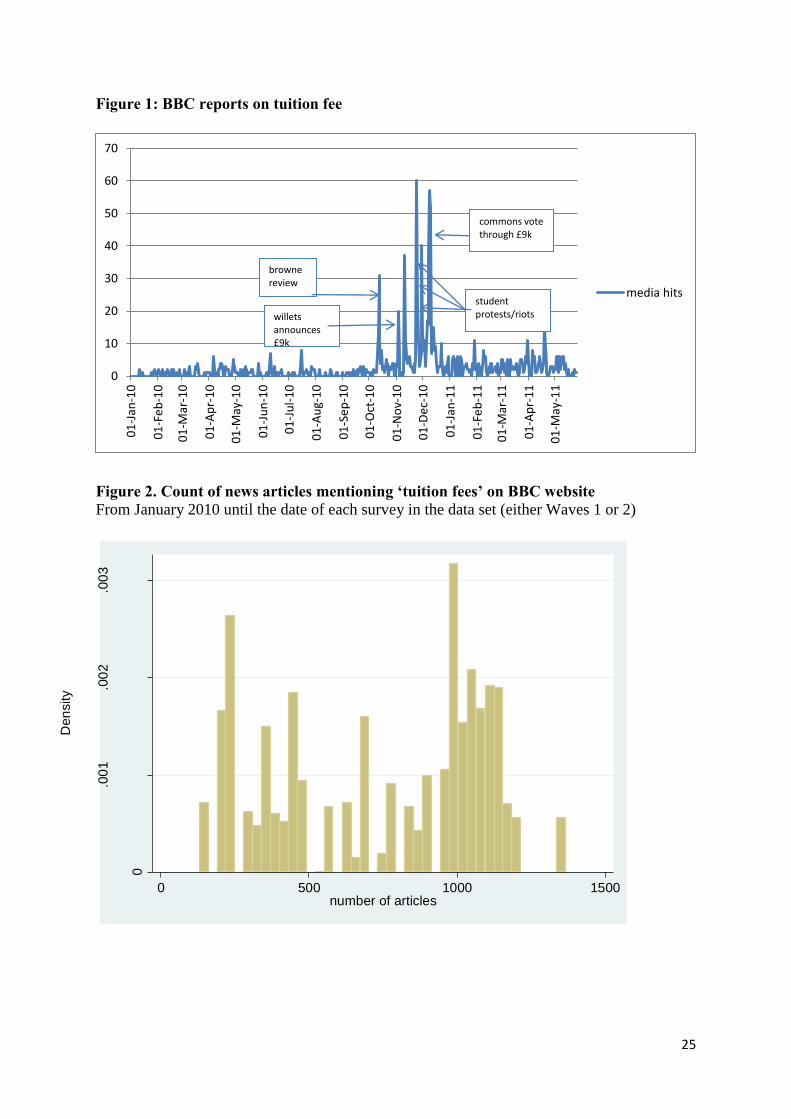
5negative effects of the fee increases on student participation. The media coverage on tuition
fees is illustrated in Figure 1 (This shows the number of hits on the BBC website mentioning
tuition fees between January 2010 and May 2011. Figure 2 shows the number of hits from
January 2010 until the dates of the relevant survey in each school – the variable used in our
analysis). The fee increases met with a great degree of public anger, and a mass protest of
tens of thousands of students and lecturers took place in November 2010. Nevertheless, the
rise in tuition fees was successfully passed through parliament in December 2010.
The new system of finance, which will be first implemented in the 2012 academic
year, is highly complex. The main features are as follows:
Tuition fees: Universities are allowed to charge up to £9,000 per year, and while there is
some variation in tuition fees across universities, the average fee is towards the upper end, at
6around £8,393 per year . Tuition fees are deferred, meaning that students do not have to pay
3 The Browne Review is formally titled ‘Securing a Sustainable Future for Higher Education in England’ and is
available at http://hereview.independent.gov.uk/hereview/report/. 4 See for example: J.Vasagar ‘Browne review: Universities must set their own tuition fees’, The Guardian, 12
Oct 2010; ‘At a glance: Browne report’, BBC News, 12 October 2010 5 See for example J. Vasagar and J. Shepherd ‘Willetts announces student fees of up to £9,000’, The Guardian,
3rd
November 2010; 'Coalition plot to blow up education': Nick Clegg faces student leader's anger at £9,000 cap
on tuition fees’, The Daily Mail, 4th
November 2010; 6 See Office for Fair Access, ‘Access agreements 2012-13’ Table 2. http://www.offa.org.uk/wp-
content/uploads/2011/12/Updated-access-agreement-data-tables-for-2012-13-December-2012.pdf

8
their fees up-front, but instead can borrow the full amount from the government under
generous terms, which are explained below.
Maintenance loans: As well as tuition fee loans, government backed loans are also available
to students for living costs. These loans are means-tested, according to the parental income of
the student. In 2012, the maximum student loan available will be £5,500 per year7, and the
minimum amount, available to all students regardless of parental income, will be £3,575 per
year. Student maintenance loans are repaid in the same way as tuition fee loans.
Maintenance grants: Some students are also entitled to maintenance grants, which do not
have to be repaid. These grants are also means-tested. Students whose parental income is less
than £25,000 per year are entitled to £3,250 per year. As parental incomes rise, the grant
entitlement is reduced, so that students whose parental income is over £42,600 per year
receive nothing.
Repayment of fee and maintenance loans: Students do not have to repay their loans until they
have graduated university and are earning £21,000 per year (this threshold will be increased
every year in line with average earnings). Once a graduate is earning at or more than £21,000
per year they repay 9% of their earnings over this amount, which is typically be deducted
from their earnings automatically by their employer in a similar way to income tax. So, a
graduate earning £25,000 would repay £360 per year. Repayment continues for 30 years, or
until the graduate has repaid their loan in its entirety. An added complexity is that interest is
added onto the loan each year, on a means tested-basis. Graduates earning £21,000 or less per
year will incur no interest, whilst graduates earning £41,000 per year will incur interest of 3%
per year; interest is tapered between 0% and 3% for those earning between £21,000 and
£41,000.
The system is designed to ensure that a student’s income background does not affect
their ability to participate; students have nothing to pay nothing up-front and benefit from a
generous support package. The system also insures graduates against low earnings, protecting
them from unmanageable repayments. However, there is little empirical evidence that
students fully understand the complex nature of the system. Media coverage has tended to
focus on the headline debt figure rather than the complexities of the loan repayment system
and have given rise to an increased perception that going to university is 'too expensive'.
7 This figure is for students living away from home and outside London. Students living at home are entitled to
borrow less money, whilst students living in London are entitled to borrow more.

Whilst the impact of the almost trebling of fees on participation will not be known for some
8years, the latest available reports indicate a decrease in applications for 2012 .
This is clearly a crucial time in higher education finance policy where it is important
to understand how much students know about the system and how knowledge affects their
aspirations. Our study includes analysis of the following issues: (1) the extent to which
students understand the basic facts; (2) the impact of the major announcement and
corresponding media reporting on students’ understanding of the system and future intentions
and (3) the impact of an ‘information campaign’ focused on improving students’
understanding of the system as well as the potential benefits from staying on in education.
4. The Experiment
Randomisation
All secondary schools in London were invited to participate. We conducted paired
9randomisation where we aligned schools in sequence on the following dimensions:
10independent/selective or comprehensive ; single sex or mixed; average exam scores in the
GCSE exam at age 16. We randomised schools for the treatment within each pair of schools.
Tables 1a and 1b show how the randomisation worked based on school-level characteristics
and based on outcome variables that we use in the baseline survey. This shows that values for
the treatment schools are very similar to those of the control schools at baseline. The
randomisation worked.
There are 54 schools in our main sample, which is about 10% of all schools in
11London. The participating schools were more likely than other schools to be
independent/selective, have higher average performance and a lower percentage of students
eligible to receive free school meals. Thus, they cannot be taken to be representative of the
school population. It might be expected that such schools would already have a reasonable
8 UCAS 2012 applicant figures released in July 2012 showed an 8% fall in applications year-on-year (see
http://www.ucas.ac.uk/about_us/media_enquiries/media_releases/2012/20120709 ) 9 Since statistical efficiency drops when randomizing clusters, we follow the widely-used methodology of
pairing schools, based on their pre-treatment characteristics. We then randomly assigning one school within
each pair to receive the treatment. The regression models include dummy variables for each pair. See, for
example, Angrist and Lavy (2009) for an application of Group Randomised Trials in education context and a
discussion of this method. 10
Most schools in England are comprehensive – open to pupils of all abilities, where selection on prior ability is
prohibited. There are some selective schools in the state system (called ‘grammar schools’) where entry is based
on an exam taken at age 11. Independent schools get no support from the government (except through charitable
tax status) and charge fees to parents. Some of them are also academically selective. 11
During the initial stages of communication with schools, a small number dropped out of the experiment,
usually citing logistical problems, with timetabling and lack of space being the main issues. Also, there were a
further 6 schools involved in the study before the main sample (last term of 2009/10). This used these schools to
pilot both the questionnaire and the intervention.
9
10
programme of careers advice and guidance. It is surprising that students are not better
informed at baseline than they appear to be (we discuss the implications of Table 1b below).
Logistics
In the letter of invitation, we explained that the purpose of the study was to learn about how
much students know about economically relevant facts with regard to staying on in education.
As an incentive to participate, we promised each school that we would give them resource
materials on this issue at some stage during the academic year (without saying when) and that
we would give them a school-level report profiling their students compared to similar schools
involved in the study. All participating schools were expected to give us 40 minutes of class
time on two occasions during the school year (8-12 weeks apart) to survey all students in
Year 10 (i.e. 14/15 year olds). Attrition is not an issue in this study.
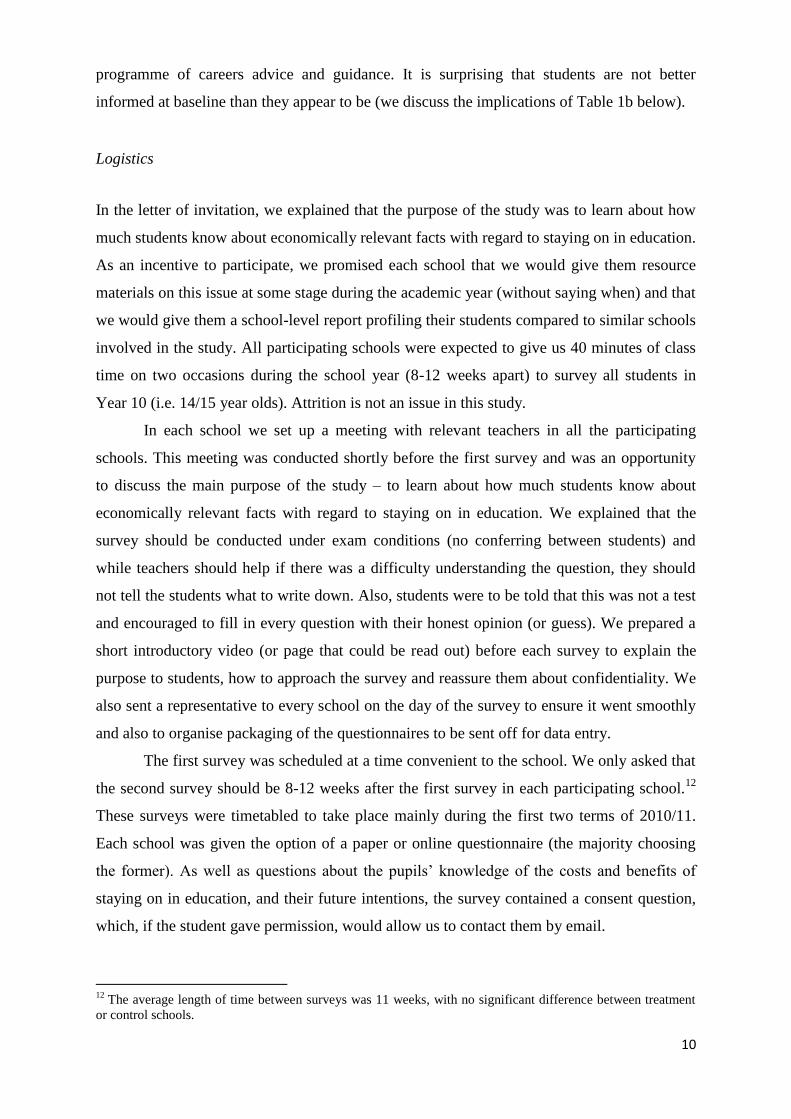
In each school we set up a meeting with relevant teachers in all the participating
schools. This meeting was conducted shortly before the first survey and was an opportunity
to discuss the main purpose of the study – to learn about how much students know about
economically relevant facts with regard to staying on in education. We explained that the
survey should be conducted under exam conditions (no conferring between students) and
while teachers should help if there was a difficulty understanding the question, they should
not tell the students what to write down. Also, students were to be told that this was not a test
and encouraged to fill in every question with their honest opinion (or guess). We prepared a
short introductory video (or page that could be read out) before each survey to explain the
purpose to students, how to approach the survey and reassure them about confidentiality. We
also sent a representative to every school on the day of the survey to ensure it went smoothly
and also to organise packaging of the questionnaires to be sent off for data entry.
The first survey was scheduled at a time convenient to the school. We only asked that
12the second survey should be 8-12 weeks after the first survey in each participating school.
These surveys were timetabled to take place mainly during the first two terms of 2010/11.
Each school was given the option of a paper or online questionnaire (the majority choosing
the former). As well as questions about the pupils’ knowledge of the costs and benefits of
staying on in education, and their future intentions, the survey contained a consent question,
which, if the student gave permission, would allow us to contact them by email.
12
The average length of time between surveys was 11 weeks, with no significant difference between treatment
or control schools.
11
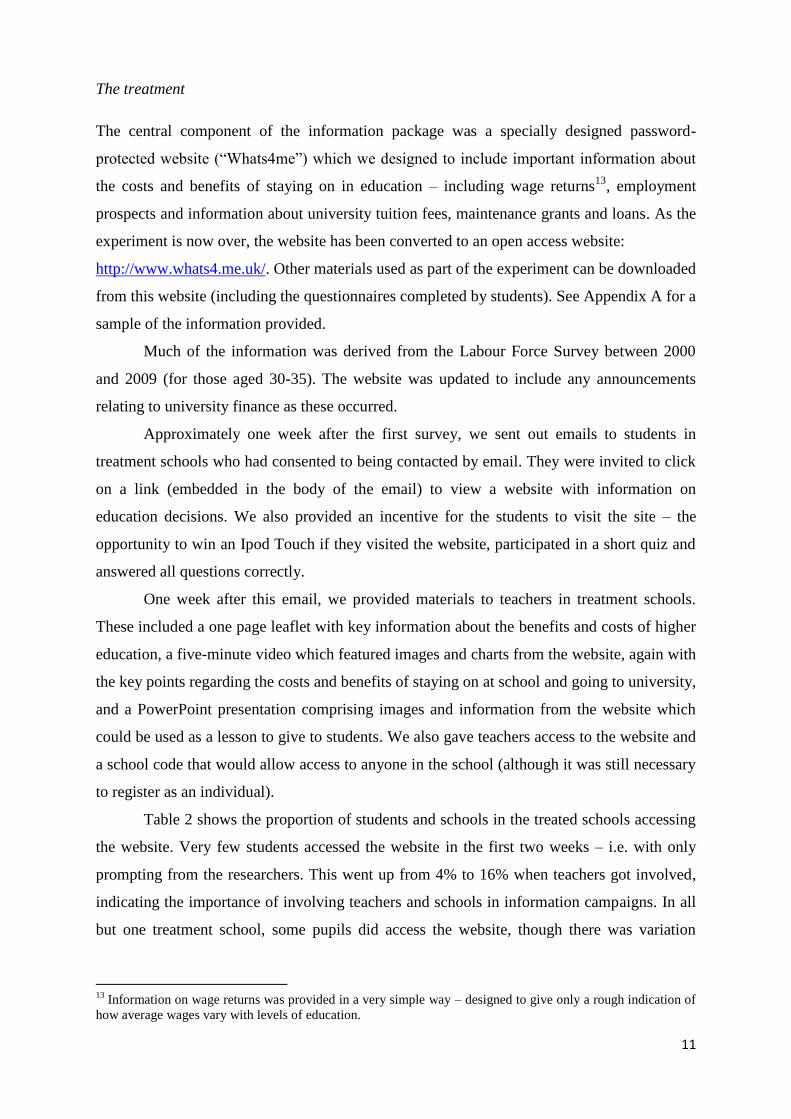
The treatment
The central component of the information package was a specially designed password-
protected website (“Whats4me”) which we designed to include important information about
the costs and benefits of staying on in education – including wage returns13
, employment
prospects and information about university tuition fees, maintenance grants and loans. As the
experiment is now over, the website has been converted to an open access website:
http://www.whats4.me.uk/. Other materials used as part of the experiment can be downloaded
from this website (including the questionnaires completed by students). See Appendix A for a
sample of the information provided.
Much of the information was derived from the Labour Force Survey between 2000
and 2009 (for those aged 30-35). The website was updated to include any announcements
relating to university finance as these occurred.
Approximately one week after the first survey, we sent out emails to students in
treatment schools who had consented to being contacted by email. They were invited to click
on a link (embedded in the body of the email) to view a website with information on
education decisions. We also provided an incentive for the students to visit the site – the
opportunity to win an Ipod Touch if they visited the website, participated in a short quiz and
answered all questions correctly.
One week after this email, we provided materials to teachers in treatment schools.
These included a one page leaflet with key information about the benefits and costs of higher
education, a five-minute video which featured images and charts from the website, again with
the key points regarding the costs and benefits of staying on at school and going to university,
and a PowerPoint presentation comprising images and information from the website which
could be used as a lesson to give to students. We also gave teachers access to the website and
a school code that would allow access to anyone in the school (although it was still necessary
to register as an individual).
Table 2 shows the proportion of students and schools in the treated schools accessing
the website. Very few students accessed the website in the first two weeks – i.e. with only
prompting from the researchers. This went up from 4% to 16% when teachers got involved,
indicating the importance of involving teachers and schools in information campaigns. In all
but one treatment school, some pupils did access the website, though there was variation
13
Information on wage returns was provided in a very simple way – designed to give only a rough indication of
how average wages vary with levels of education.
between schools in the extent of website use. In 56% of treatment schools, the percentage of
students accessing the website was over 10%.
Table 3 shows the characteristics of students accessing the website. The probability of
accessing the website is 20 per cent higher if the student is in a selective/independent school.
Other variables that are significantly associated with accessing the website include being
female (+0.044) and whether the student intends to stay in full-time education after the age of
16 in the baseline survey (+0.028). The probability is also positively associated with self-
esteem and higher socio-economic background. Appendix B shows some information about
the amount of time students spend on the website and how this is allocated.
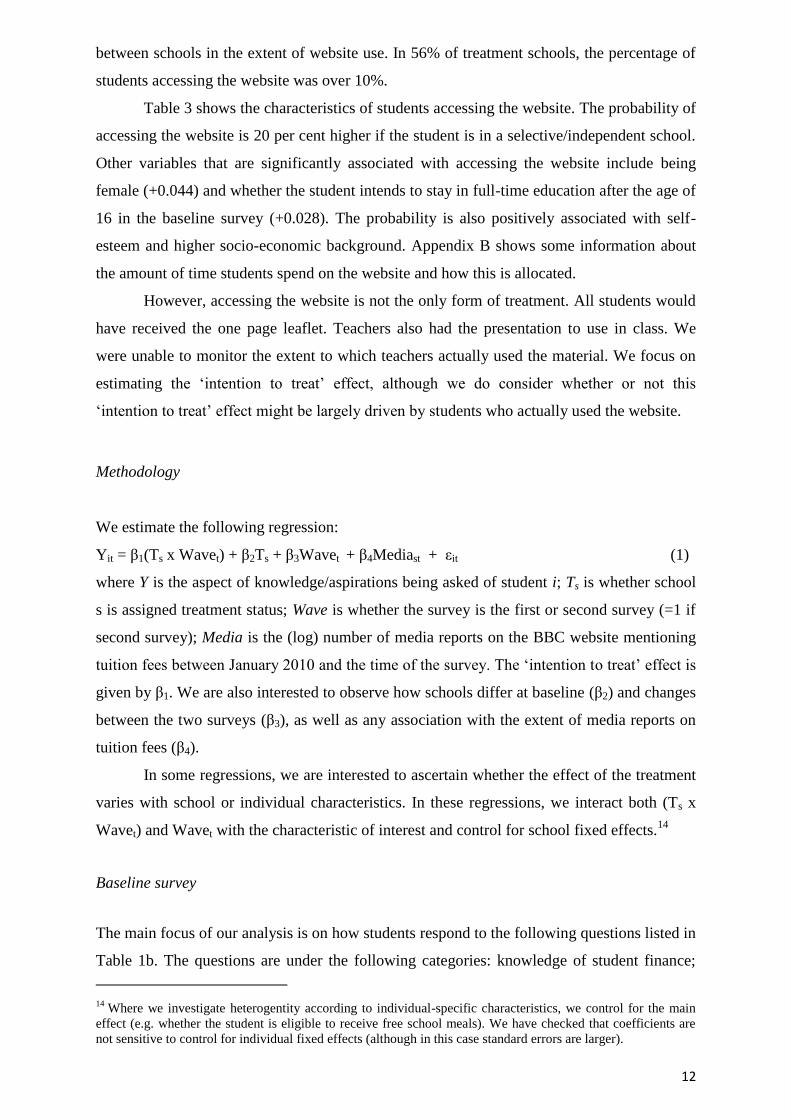
However, accessing the website is not the only form of treatment. All students would
have received the one page leaflet. Teachers also had the presentation to use in class. We
were unable to monitor the extent to which teachers actually used the material. We focus on
estimating the ‘intention to treat’ effect, although we do consider whether or not this
‘intention to treat’ effect might be largely driven by students who actually used the website.
Methodology
We estimate the following regression:
Yit = β1(Ts x Wavet) + β2Ts + β3Wavet + β4Mediast + εit (1)
where Y is the aspect of knowledge/aspirations being asked of student i; Ts is whether school
s is assigned treatment status; Wave is whether the survey is the first or second survey (=1 if
second survey); Media is the (log) number of media reports on the BBC website mentioning
tuition fees between January 2010 and the time of the survey. The ‘intention to treat’ effect is
given by β1. We are also interested to observe how schools differ at baseline (β2) and changes
between the two surveys (β3), as well as any association with the extent of media reports on
tuition fees (β4).
In some regressions, we are interested to ascertain whether the effect of the treatment
varies with school or individual characteristics. In these regressions, we interact both (Ts x
14Wavet) and Wavet with the characteristic of interest and control for school fixed effects.
Baseline survey
The main focus of our analysis is on how students respond to the following questions listed in
Table 1b. The questions are under the following categories: knowledge of student finance;
14 Where we investigate heterogentity according to individual-specific characteristics, we control for the main
effect (e.g. whether the student is eligible to receive free school meals). We have checked that coefficients are
not sensitive to control for individual fixed effects (although in this case standard errors are larger).
12
perceived importance of financial constraint; the opportunity cost; knowledge about the
benefits of staying on in education; and future intentions with regard to education.
There is no statistical difference at baseline between the treatment and control groups
with regard to any of these questions (as Table 1b illustrates). However, the survey does
suggest that there are significant gaps in students’ knowledge. One fifth of students do not
think that a person has a better chance of getting a job if they stay on in education up to 18
(as opposed to leaving at age 16) or going to university (as opposed to leaving education at
age 18). Lack of knowledge is also illustrated in students’ wage expectations (discussed in
Section 5). Less than half of respondents think that earnings are affected by subject of study
and just over half think that earnings are the same regardless of higher education institution
attended. Also, many students seem to be unaware of how most people pay university fees.
Less than half of students in the sample know that university tuition fees are generally paid
after university and when they have a job; or agree that student loans are a cheaper/better way
to borrow money than other types of loan. Around a fifth of students believe that going to
university is too expensive, and that the financial aspect of going to university would make
them think of not applying.
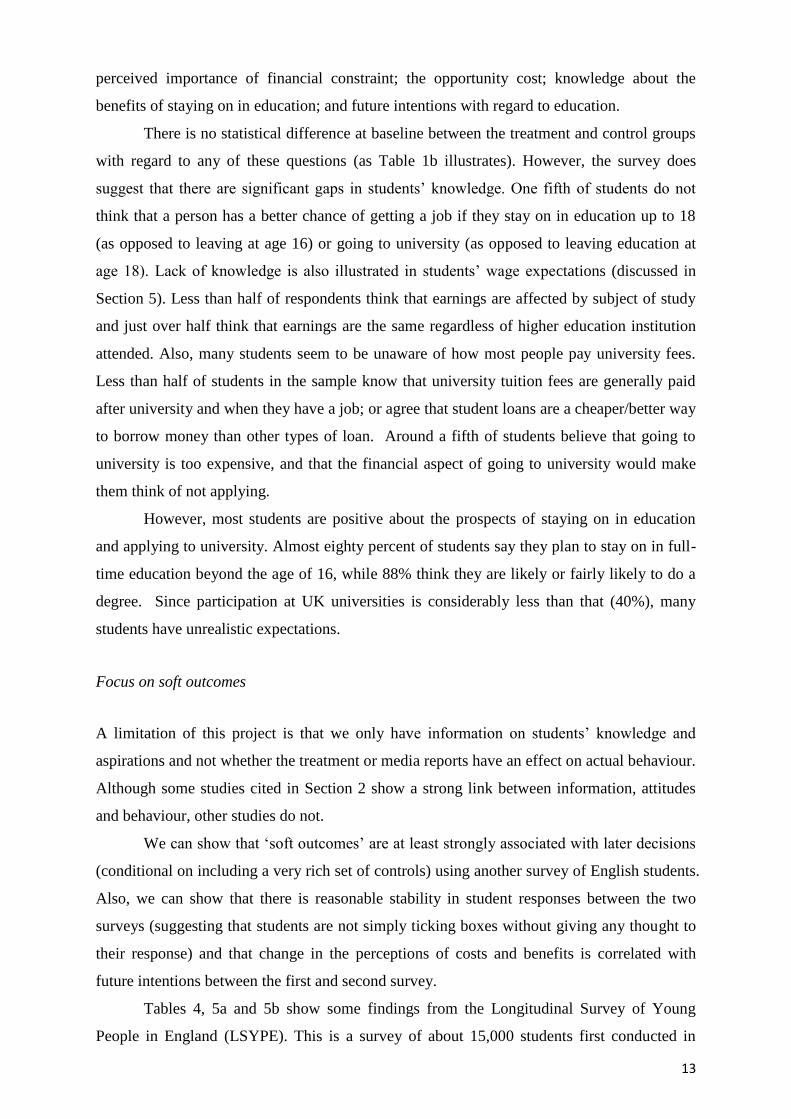
However, most students are positive about the prospects of staying on in education
and applying to university. Almost eighty percent of students say they plan to stay on in full-
time education beyond the age of 16, while 88% think they are likely or fairly likely to do a
degree. Since participation at UK universities is considerably less than that (40%), many
students have unrealistic expectations.
Focus on soft outcomes
A limitation of this project is that we only have information on students’ knowledge and
aspirations and not whether the treatment or media reports have an effect on actual behaviour.
Although some studies cited in Section 2 show a strong link between information, attitudes
and behaviour, other studies do not.
We can show that ‘soft outcomes’ are at least strongly associated with later decisions
(conditional on including a very rich set of controls) using another survey of English students.
Also, we can show that there is reasonable stability in student responses between the two
surveys (suggesting that students are not simply ticking boxes without giving any thought to
their response) and that change in the perceptions of costs and benefits is correlated with
future intentions between the first and second survey.
Tables 4, 5a and 5b show some findings from the Longitudinal Survey of Young
People in England (LSYPE). This is a survey of about 15,000 students first conducted in
13

14
2003/04. Table 4 shows young people’s intentions at about the same age as in our study.
About 89% of 14 year olds intend to stay on in full-time education after the age of 16 and 72%
intend to apply to university at some stage. However, the actual realisation is different from
the hope: at age 16/17, 63% of the same survey population are observed to actually stay on.
At age 17/18, 56% are still in full-time education and 35% actually go to university.
Although aspirations are very different from realisations, there is a strong correlation between
initial motivation and behaviour. This is shown in Tables 5a and 5b. Intentions at age 14 are
strongly associated with future behaviour even after conditioning on performance in school
exams, family characteristics, demographics and school fixed effects. In this context, future
intentions might be a proxy for motivation and information. Although the association does
not have a causal interpretation here, it does suggest the possibility that influencing intentions
might affect behaviour. Furthermore, it suggests that intentions of young people do bear some
relation to what they later go on to do.
Table 6 illustrates how (in our data), students in the control group change their
responses between the two surveys, for some key issues, including future intentions, and
student attitudes towards the cost of going to university. In each case, there is a strong
association between what students say in the two surveys.
Finally, Table 7 shows how some of these variables are correlated with each other
between the two surveys. This table shows regressions of future intentions against
perceptions of costs and benefits after controlling for student fixed effects. For example, it
shows how an increased perception of costs is associated with whether the student plans to
stay on in full-time education or apply to university at some stage. This shows that the
perception of higher costs (reflected in a positive response to ‘financial cost is too high to
stay on in education after age 16’, ‘going to university is too expensive for me/my family’
and ‘going to university would mean waiting too long to earn a full-time wage’) is negatively
associated with whether the student plans to stay on in full-time education after age 16 and
whether it is likely/very likely that he/she will ever apply to go to university to do a degree.
Also, an increased perception of benefits (reflected in a positive response to ‘better chance of
getting a job if stays on in education to age 18 – and going to university) shows a positive
association with plans to stay on in education and apply to university.
This evidence suggests that influencing ‘soft-outcomes’ is not meaningless.
Furthermore, although intentions often do not translate into actual behaviour, it seems
reasonable to suggest that influencing perceptions is an important pre-curser to influencing
behavioural change.
15
5. The Main Results
We show results for the following groups of variables: ‘knowledge of student finance and
perception of costs’ (Table 8), ‘perception of benefits’ (Table 9), and ‘future intentions’
(Table 10). We also discuss effects on wage expectations.
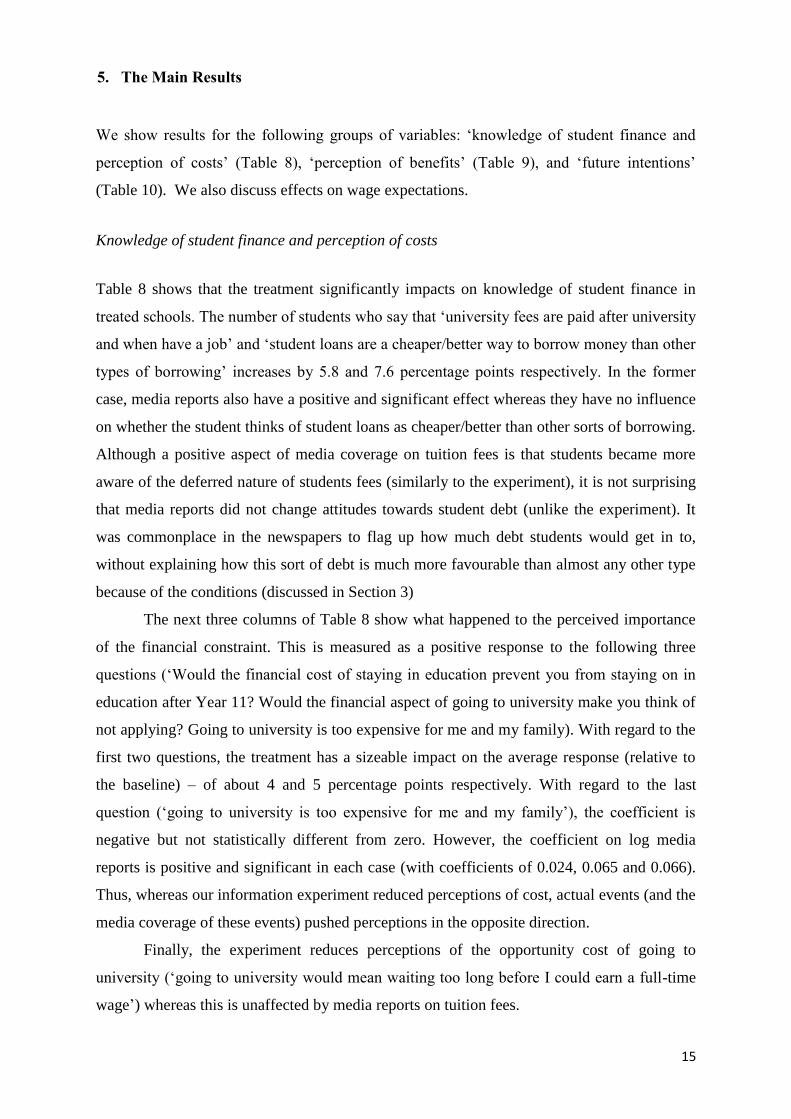
Knowledge of student finance and perception of costs
Table 8 shows that the treatment significantly impacts on knowledge of student finance in
treated schools. The number of students who say that ‘university fees are paid after university
and when have a job’ and ‘student loans are a cheaper/better way to borrow money than other
types of borrowing’ increases by 5.8 and 7.6 percentage points respectively. In the former
case, media reports also have a positive and significant effect whereas they have no influence
on whether the student thinks of student loans as cheaper/better than other sorts of borrowing.
Although a positive aspect of media coverage on tuition fees is that students became more
aware of the deferred nature of students fees (similarly to the experiment), it is not surprising
that media reports did not change attitudes towards student debt (unlike the experiment). It
was commonplace in the newspapers to flag up how much debt students would get in to,
without explaining how this sort of debt is much more favourable than almost any other type
because of the conditions (discussed in Section 3)
The next three columns of Table 8 show what happened to the perceived importance
of the financial constraint. This is measured as a positive response to the following three
questions (‘Would the financial cost of staying in education prevent you from staying on in
education after Year 11? Would the financial aspect of going to university make you think of
not applying? Going to university is too expensive for me and my family). With regard to the
first two questions, the treatment has a sizeable impact on the average response (relative to
the baseline) – of about 4 and 5 percentage points respectively. With regard to the last
question (‘going to university is too expensive for me and my family’), the coefficient is
negative but not statistically different from zero. However, the coefficient on log media
reports is positive and significant in each case (with coefficients of 0.024, 0.065 and 0.066).
Thus, whereas our information experiment reduced perceptions of cost, actual events (and the
media coverage of these events) pushed perceptions in the opposite direction.
Finally, the experiment reduces perceptions of the opportunity cost of going to
university (‘going to university would mean waiting too long before I could earn a full-time
wage’) whereas this is unaffected by media reports on tuition fees.
16
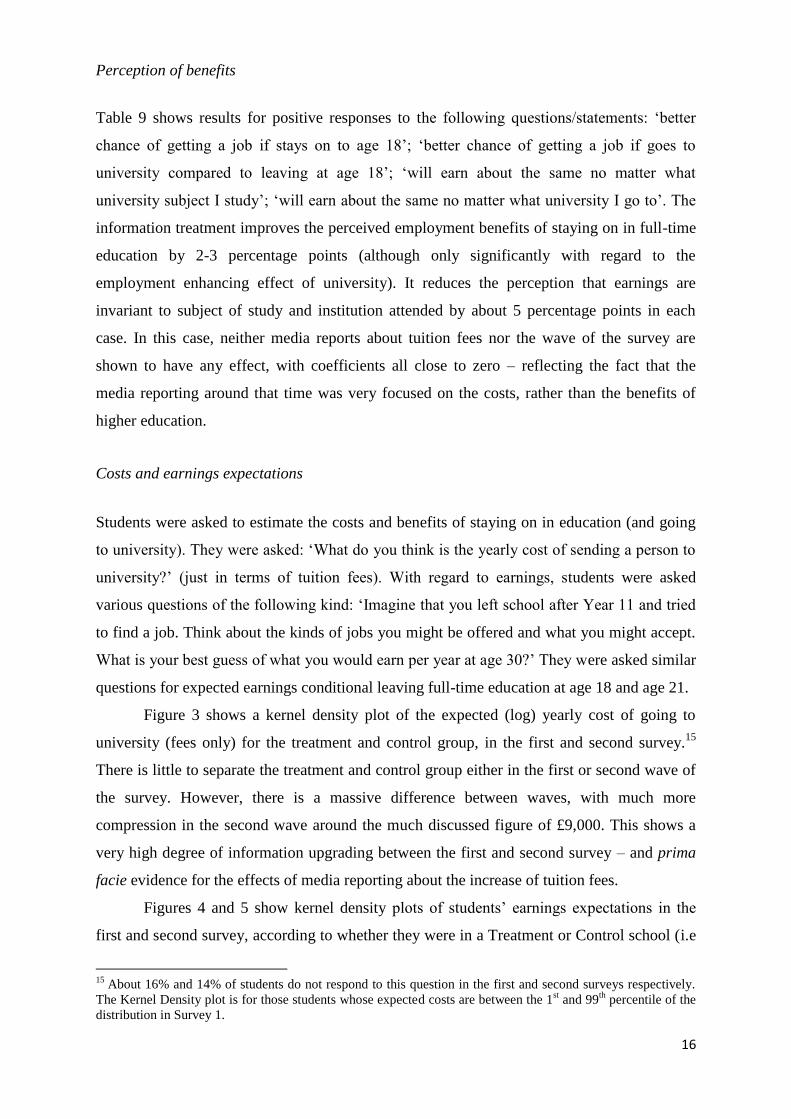
Perception of benefits
Table 9 shows results for positive responses to the following questions/statements: ‘better
chance of getting a job if stays on to age 18’; ‘better chance of getting a job if goes to
university compared to leaving at age 18’; ‘will earn about the same no matter what
university subject I study’; ‘will earn about the same no matter what university I go to’. The
information treatment improves the perceived employment benefits of staying on in full-time
education by 2-3 percentage points (although only significantly with regard to the
employment enhancing effect of university). It reduces the perception that earnings are
invariant to subject of study and institution attended by about 5 percentage points in each
case. In this case, neither media reports about tuition fees nor the wave of the survey are
shown to have any effect, with coefficients all close to zero – reflecting the fact that the
media reporting around that time was very focused on the costs, rather than the benefits of
higher education.
Costs and earnings expectations
Students were asked to estimate the costs and benefits of staying on in education (and going
to university). They were asked: ‘What do you think is the yearly cost of sending a person to
university?’ (just in terms of tuition fees). With regard to earnings, students were asked
various questions of the following kind: ‘Imagine that you left school after Year 11 and tried
to find a job. Think about the kinds of jobs you might be offered and what you might accept.
What is your best guess of what you would earn per year at age 30?’ They were asked similar
questions for expected earnings conditional leaving full-time education at age 18 and age 21.
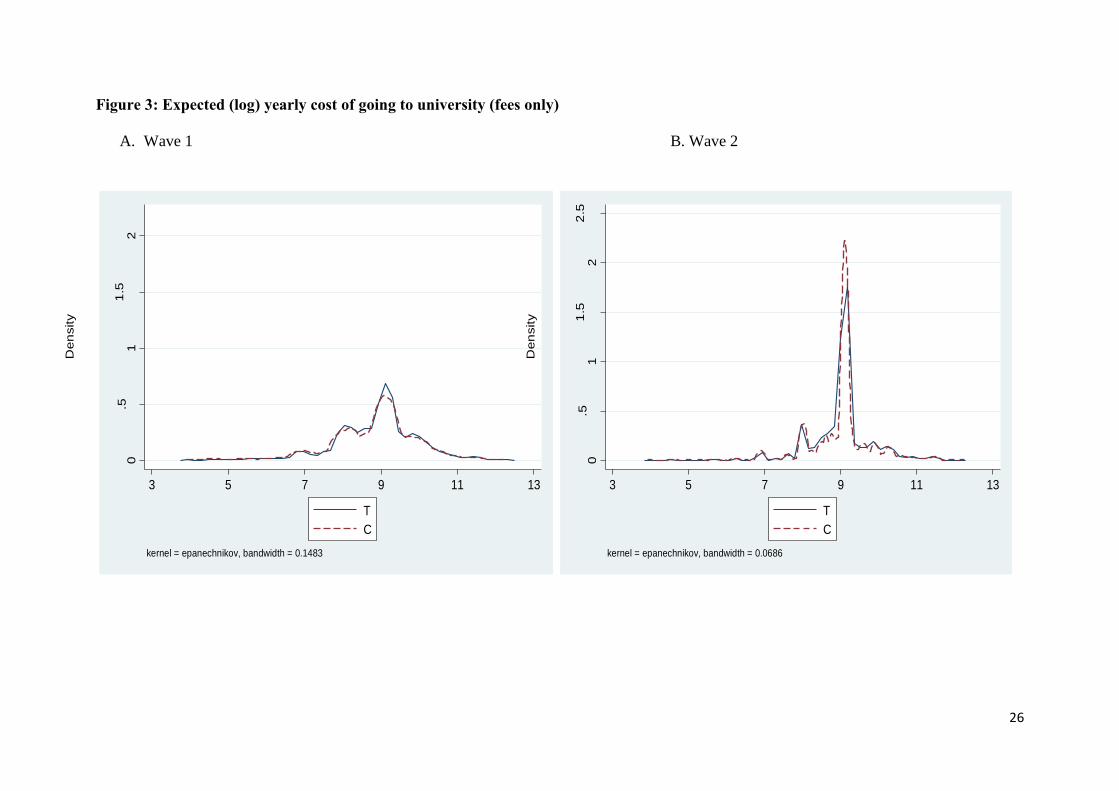
Figure 3 shows a kernel density plot of the expected (log) yearly cost of going to
15university (fees only) for the treatment and control group, in the first and second survey.
There is little to separate the treatment and control group either in the first or second wave of
the survey. However, there is a massive difference between waves, with much more
compression in the second wave around the much discussed figure of £9,000. This shows a
very high degree of information upgrading between the first and second survey – and prima
facie evidence for the effects of media reporting about the increase of tuition fees.
Figures 4 and 5 show kernel density plots of students’ earnings expectations in the
first and second survey, according to whether they were in a Treatment or Control school (i.e
15
About 16% and 14% of students do not respond to this question in the first and second surveys respectively.
The Kernel Density plot is for those students whose expected costs are between the 1st and 99
th percentile of the
distribution in Survey 1.
17
we take the ratio of students’ expected earnings for further/higher education relative to
16expected earnings if he/she were to leave school at age 16).
The Figures show a very wide range in students’ implicit estimate of the earnings
differential between different levels of education. There is a long right tail in the distribution
– many students vastly overestimate returns. However, the median student does have an idea
and by comparing Figures 4 and 5, one can see that the ratio of expected earnings in further
education (to age 18) relative to compulsory education (age 16) is smaller than the ratio of
expected earnings in higher education (to age 21) relative to compulsory education. The
distribution is also less spread out. The Figures hint at a possible effect of the treatment in
the middle of the distribution. However, this does not come out in quantile regressions
(reported in Appendix C) where we find no significant effect of the information campaign.
However, there is some compression of the right hand side of the distribution between waves.
It is also of interest to note that the treatment does not appear to influence the preferred
subject of study in higher education in a way that relates to the earnings potential of different
subjects. This is shown in Appendix D.
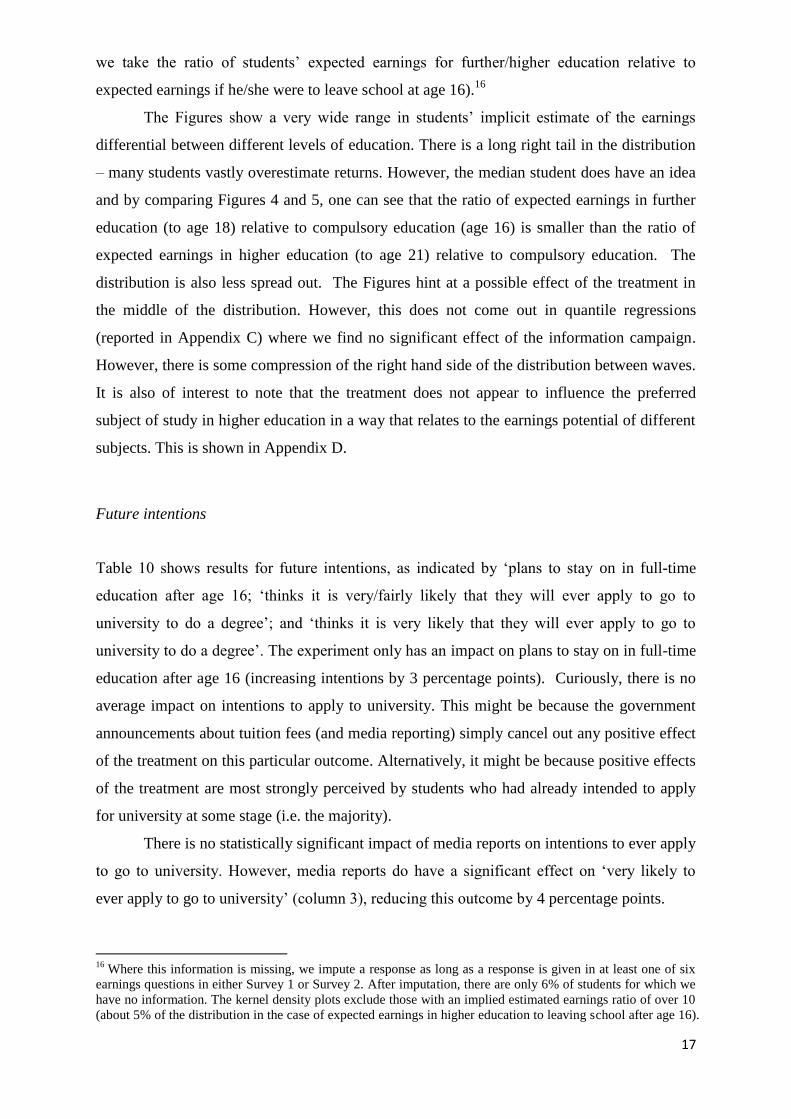
Future intentions
Table 10 shows results for future intentions, as indicated by ‘plans to stay on in full-time
education after age 16; ‘thinks it is very/fairly likely that they will ever apply to go to
university to do a degree’; and ‘thinks it is very likely that they will ever apply to go to
university to do a degree’. The experiment only has an impact on plans to stay on in full-time
education after age 16 (increasing intentions by 3 percentage points). Curiously, there is no
average impact on intentions to apply to university. This might be because the government
announcements about tuition fees (and media reporting) simply cancel out any positive effect
of the treatment on this particular outcome. Alternatively, it might be because positive effects
of the treatment are most strongly perceived by students who had already intended to apply
for university at some stage (i.e. the majority).
There is no statistically significant impact of media reports on intentions to ever apply
to go to university. However, media reports do have a significant effect on ‘very likely to
ever apply to go to university’ (column 3), reducing this outcome by 4 percentage points.
16
Where this information is missing, we impute a response as long as a response is given in at least one of six
earnings questions in either Survey 1 or Survey 2. After imputation, there are only 6% of students for which we
have no information. The kernel density plots exclude those with an implied estimated earnings ratio of over 10
(about 5% of the distribution in the case of expected earnings in higher education to leaving school after age 16).

Interpretation of main results
It is interesting to ask whether the above results are mainly influenced by those students
accessing the website or whether they are evident for other students too – since ‘treatment’
could come in a variety of forms such as a simple leaflet and teacher/researcher presentations
(discussed in Section 4). Also, peer effects might be important.
The form of treatment was not randomised and hence we are not able to observe the
causal influence of different components of treatment. However, we can re-specify our
regression, adding other terms to denote whether a student is a site-user (in treatment schools
only) and the interaction between treatment and site-user:
Yit = α1(Ts x Wavet) + α2Ts + α3Wavet + α4Mediast
+ α5(Ts x Wavet x Siteuser) + α6(Siteuser) + vit (2)
The issue of interest is to what extent the coefficient on the main treatment effect (α1)
changes when controls are included for the treatment-siteuser interaction. If everything is
driven only by those students who use the website, then one would expect α1 to fall to zero.
Table 11 shows the estimates for α1 and α5 in this specification (row 2), comparing them to
the main specification where site-user is omitted (row 1). In most cases, the estimate of the
main treatment effect does not change by very much. This suggests that the ‘information
campaign’ is not only working for students who access the website.
6. Heterogeneity
The most interesting aspect of this study is the extent to which our information campaign and
publicity about tuition fees in the media had an impact on the perceived cost of staying on in
education and any effect this might have had on aspirations. In this section we focus on these
outcome variables and ask the following questions: (a) Was the effect of our information
campaign different according to the extent of media publicity on tuition fees between the first
and second survey? (b) Were the effects of the information campaign and media publicity
different in schools attended by children of higher socio-economic groups? (i.e.
17independent/selective schools). (c) Were the effects of the information campaign and media
publicity different for children from especially low income families? (as measured by
18eligibility to receive free school meals – only observable in state schools ).
17
We put selective state schools in the same category as independent schools because their GCSE results are far
more similar than they are to other schools in the state system. The main characteristics of independent schools
are that they are fee-paying and outside government control. Many of them are also academically selective. 18
This is taken from administrative data that has been matched to the surveys (only available for state schools).
Children are eligible to receive free school meals if their parents are on welfare support.
18

We have investigated other aspects of heterogeneity quite extensively (e.g. according
to the gender and immigration status of individuals). In many cases, there is no significant
difference in the extent to which the information campaign and/or media coverage impacts
differently on these groups. It is particularly noteworthy that there is no difference in the
effect of information campaign and media publicity on students’ knowledge (i.e. of when
university fees or paid; whether student loans are regarded as a relatively cheap source of
19borrowing) according to whether students are classified as high or low ability suggesting
that cognitive ability (as measured here) is not an obstacle to students’ comprehension of
20relatively simple material.
Media coverage
Figure 2 shows our measure of media coverage. This is the number of hits on the BBC
website mentioning tuition fees from January 2010 until the dates of the relevant survey in
each school. In Table 12a, we split the sample according to whether they are above or below
the median for the change in media coverage on tuition fees between the two surveys (‘high
media’ or ‘low media’). We show that for many baseline characteristics, there is no
difference between these two groups. Where they differ is on the days between the first and
second survey and on days after the Browne report. Schools with above average media
coverage between the two surveys had a longer interval between surveys (16 days more, on
average) and were more likely to have their first survey closer to the Browne report (i.e.
earlier in the fieldwork period, which mainly took place between September 2010 and March
2011).
In Table 12b, we show results for these two groups with regard to knowledge and
perception of costs. The regressions are estimated with interaction terms for ‘treatment x
21wave’ and ‘wave’ and include school fixed effects . The ‘intention to treat’ effect is not
statistically different between the two groups. Where they differ is in how the whole group
changes between the two surveys (as indicated by the coefficient on ‘Wave 2’). The
coefficients are quite often statistically different. The group with more exposure to media
coverage on tuition fees between the two surveys show a much stronger increase in their
knowledge about when university fees are paid (a coefficient of 0.127 rather than 0.057), and
19
‘High ability’ measures whether the student reaches at least the expected standard (level 5) in the previous
year’s teaching assessment (Key Stage 3) in all core subjects – English, Science and Maths. 20
In fact, the effect of the information campaign on students’ perception of the cost of attending university is
higher for low ability students (and in the expected direction); they are also more likely to be influenced by the
information campaign to stay on in full-time education after the age of 16. These differences are statistically
significant. 21
The variable ‘log media reports’ is not included in these regressions.
19
show a much stronger increase in the perception that going to university (and staying on in
education after Year 11) is too expensive. This is true across all four questions. The number
of students who say that ‘going to university is too expensive for me and my family’ goes up
by nearly 10 percentage points between the two surveys whereas it hardly changes for the
group with less media coverage between the two surveys.
The point of this section is to show that the effects of our experiment do not differ
according to whether or not students were exposed to a higher or lower level of media
information between the two surveys. However, the whole group (both treatment and control)
show a change in how they respond to these questions according to the extent of the flow of
media information between the two surveys. This operates in the expected direction as there
is more change (treatment and control groups) where the flow of media information is greater.
There is no difference between the two groups with regard to expectations of benefit (not
shown). With regard to future intentions, there is no statistically significant difference
between groups apart from the question that asks whether students ‘think it is very likely they
will ever apply to university to do a degree’. In this case, expectations fall by 5 percentage
points for all students (treatment and control) in the group exposed to a higher flow of media
information between the two surveys whereas it is unchanged for those students with a lower
flow of media information between the surveys.
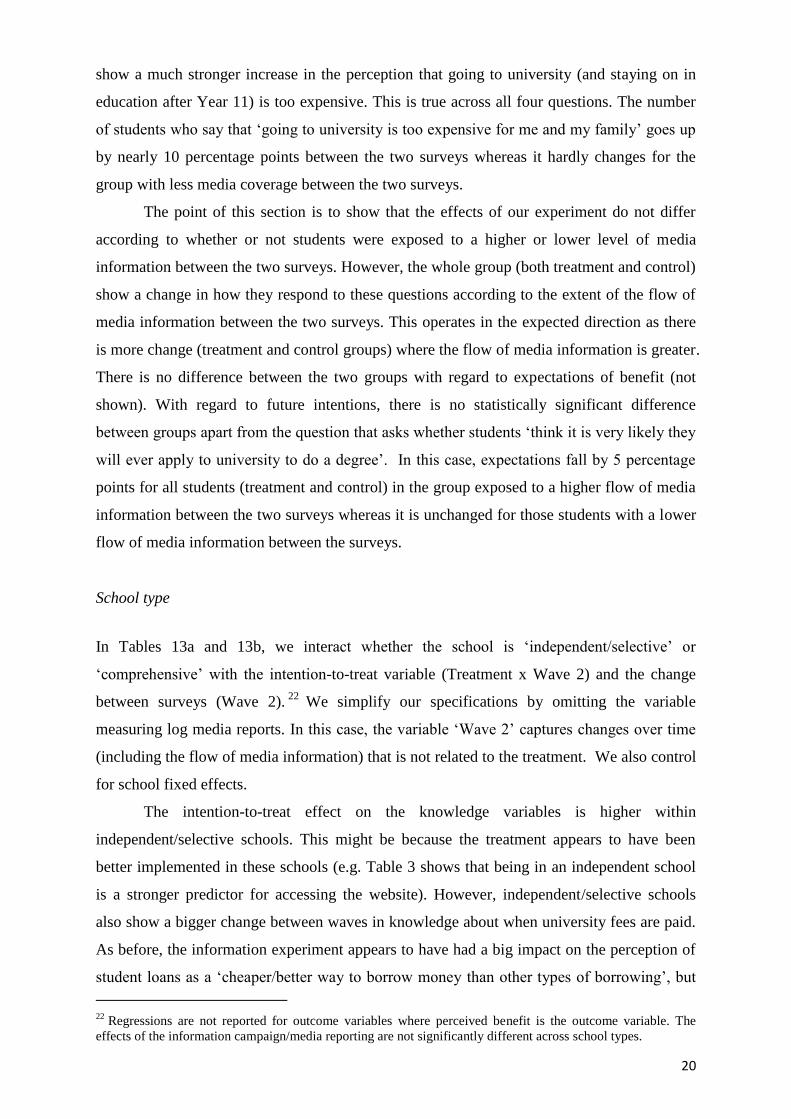
School type
In Tables 13a and 13b, we interact whether the school is ‘independent/selective’ or
‘comprehensive’ with the intention-to-treat variable (Treatment x Wave 2) and the change
22between surveys (Wave 2). We simplify our specifications by omitting the variable
measuring log media reports. In this case, the variable ‘Wave 2’ captures changes over time
(including the flow of media information) that is not related to the treatment. We also control
for school fixed effects.
The intention-to-treat effect on the knowledge variables is higher within
independent/selective schools. This might be because the treatment appears to have been
better implemented in these schools (e.g. Table 3 shows that being in an independent school
is a stronger predictor for accessing the website). However, independent/selective schools
also show a bigger change between waves in knowledge about when university fees are paid.
As before, the information experiment appears to have had a big impact on the perception of
student loans as a ‘cheaper/better way to borrow money than other types of borrowing’, but
22 Regressions are not reported for outcome variables where perceived benefit is the outcome variable. The
effects of the information campaign/media reporting are not significantly different across school types.
20

there is no change over time for control schools (i.e. the coefficient on Wave 2 is close to
zero). It is interesting to see that the questions on expense all show a much stronger impact
for comprehensive schools than independent/selective schools. Although the experiment
works in the opposite direction (i.e. helping students to think university is more affordable
rather than less affordable), it is clear that the experiment is not enough to outweigh other
factors (such as the government announcement and the media reporting) on all questions. For
example, on the statement ‘going to university is too expensive for me and my family’, the
number of students agreeing goes up by 6.6 percentage points between surveys in
comprehensive schools whereas it goes up by 2.2 percentage points in independent/selective
schools. The information campaign does not have a significant impact on either group
(although it does have an impact on the other questions about financial constraints). In Table
13b, we look at how the two groups vary according to future intentions. The negative impact
on university intentions between the two surveys is only evident for students in
comprehensive schools and not for students going to independent/selective schools. The
effect is to reduce aspirations on applying to university by around 3 percentage points in
comprehensive schools (and this is statistically different from the estimated effect in
independent/selective schools).
Student’s socio-economic status
In Tables 14a and 14b we consider the effects of the experiment according to whether
students are eligible to receive free school meals (only in the sample of state schools as we do
not observe this information for students in independent schools – although such students
23would be unlikely to be eligible for free school meals) . In this case, we interact the variables
of interest with the student’s free school meals status while controlling for school fixed
effects (and including a variable for whether the student is eligible to receive free school
meals).
The important difference between the two groups is on the two questions relating to the
cost of financing university education (‘Would the financial aspect of going to university
make you think of not applying?’ ‘Going to university is too expensive for me and my
family’). In this case, the effects of the experiment are much more evident for the students
eligible to receive free school meals. The probability of saying ‘yes’ to these two questions
23 Regressions are not reported for outcome variables where perceived benefit is the outcome variable. The
effects of the information campaign/media reporting are not significantly different across the two groups of
pupils.
21
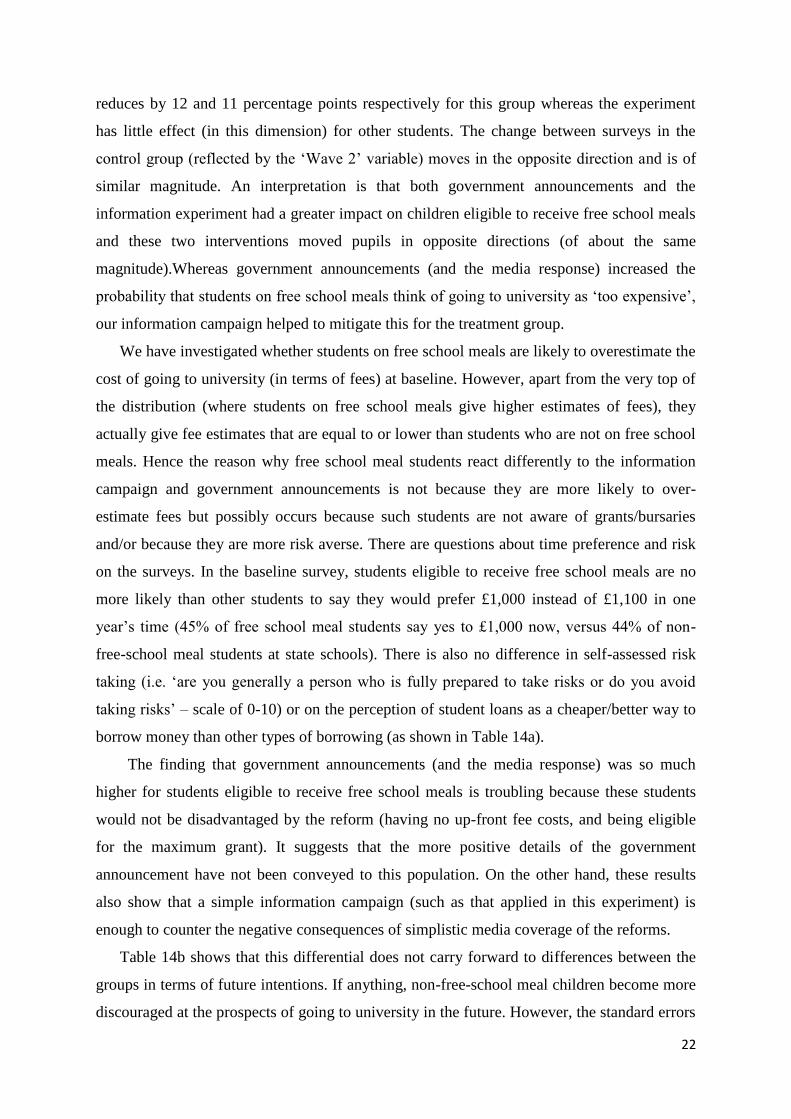
22
reduces by 12 and 11 percentage points respectively for this group whereas the experiment
has little effect (in this dimension) for other students. The change between surveys in the
control group (reflected by the ‘Wave 2’ variable) moves in the opposite direction and is of
similar magnitude. An interpretation is that both government announcements and the
information experiment had a greater impact on children eligible to receive free school meals
and these two interventions moved pupils in opposite directions (of about the same
magnitude).Whereas government announcements (and the media response) increased the
probability that students on free school meals think of going to university as ‘too expensive’,
our information campaign helped to mitigate this for the treatment group.
We have investigated whether students on free school meals are likely to overestimate the
cost of going to university (in terms of fees) at baseline. However, apart from the very top of
the distribution (where students on free school meals give higher estimates of fees), they
actually give fee estimates that are equal to or lower than students who are not on free school
meals. Hence the reason why free school meal students react differently to the information
campaign and government announcements is not because they are more likely to over-
estimate fees but possibly occurs because such students are not aware of grants/bursaries
and/or because they are more risk averse. There are questions about time preference and risk
on the surveys. In the baseline survey, students eligible to receive free school meals are no
more likely than other students to say they would prefer £1,000 instead of £1,100 in one
year’s time (45% of free school meal students say yes to £1,000 now, versus 44% of non-
free-school meal students at state schools). There is also no difference in self-assessed risk
taking (i.e. ‘are you generally a person who is fully prepared to take risks or do you avoid
taking risks’ – scale of 0-10) or on the perception of student loans as a cheaper/better way to
borrow money than other types of borrowing (as shown in Table 14a).
The finding that government announcements (and the media response) was so much
higher for students eligible to receive free school meals is troubling because these students
would not be disadvantaged by the reform (having no up-front fee costs, and being eligible
for the maximum grant). It suggests that the more positive details of the government
announcement have not been conveyed to this population. On the other hand, these results
also show that a simple information campaign (such as that applied in this experiment) is
enough to counter the negative consequences of simplistic media coverage of the reforms.
Table 14b shows that this differential does not carry forward to differences between the
groups in terms of future intentions. If anything, non-free-school meal children become more
discouraged at the prospects of going to university in the future. However, the standard errors

23
around the estimates are large and it seems difficult to detect effects on this outcome variable
with relatively few ‘free school meal’ students in the sample.
7. Conclusion
In this paper, we examine the effects of an ‘information campaign’ where students in
randomly selected schools are given basic facts relevant to the staying-on decision. We show
that a ‘light-touch’ intervention can affect students’ knowledge, attitudes and aspirations over
the short-run. However, the government announcement to treble university fees over this
time-period often worked in the opposite direction. Most troubling is the difference in the
effect of the announcements for students in comprehensive schools relative to those in
independent/selective schools and for students eligible to receive free school meals relative to
other children. This is despite the fact that the system of financing higher education has been
designed with a view to not putting off those from relatively disadvantaged backgrounds.
This analysis suggests that this point is not getting through to these students. It also suggests
that relatively inexpensive and properly directed information campaigns can help to mitigate
this effect.

24
References
Angrist, J., and V. Lavy, (2009), The effects of high stakes high school achievement awards:
evidence from a randomized trial. American Economic Review 99(4): 303-331
Bettinger, E., B. Long, et al. (2009). The role of simplification and information in college
decisions: results from the H&R block FAFSA experiment. NBER working papers
w15361.
Betts, J. R. (1996). What do students know about wages? Evidence from a survey of
undergraduates. Journal of Human Resources 31(1): 27-56.
Blanden, J., Gregg, P. & Machin, S. (2003). Changes in Educational Inequality. CMPO
Working Paper Series No 03/079.
Booij, A., E. Leuven, and H. Oosterbeek (2012). The role of information in the take-up of
student loans. Economics of Education Review, 31: 33-44
Dominitz, J. and H. Manski (1996). Eliciting student expectations of the returns to schooling.
Journal of Human Resources 31(1): 1-26.
Duflo, E., and E. Saez, (2003), The role of information and social interactions in retirement
plan decisions: evidence from a randomized experiment, Quarterly Journal of
Economics, 118 (3), 815-842.
Duflo, E., P. Dupas, M. Kremer, and S. Samuel, (2006), Education and HIV/AIDS prevention:
evidence from a randomised evaluation in Western Kenya. World Bank Policy
Research Working Paper. No. 4024.
Dupas, P., (2006), Relative risks and the market for sex: teenagers, sugar daddies and HIV
in Kenya, mimeo, Dartmouth College.
Jensen, R. (2010). The (perceived) returns to education and the demand for schooling.
Quarterly Journal of Economics 125(2): 515-548.
Liebman, J. B. and E.F.P. Luttmer, (2010), Would people behave differently if they better
understood social security? Evidence from a field experiment. NBER working paper.
Nguyen, T. (2008). Information, role models and perceived returns to education:
experimental evidence from Madagascar. MIT working papers.
Oreopoulos, P. and R. Dunn, (2009), Information and College Access: Evidence from a
Randomized Field Experiment. Available at http://www.sole-jole.org/11027.pdf.
25
Figure 1: BBC reports on tuition fee
Figure 2. Count of news articles mentioning ‘tuition fees’ on BBC website From January 2010 until the date of each survey in the data set (either Waves 1 or 2)
0
10
20
30
40
50
60
70
01
-Jan
-10
01
-Fe
b-1
0
01
-Mar
-10
01
-Ap
r-1
0
01
-May
-10
01
-Ju
n-1
0
01
-Ju
l-1
0
01
-Au
g-1
0
01
-Se
p-1
0
01
-Oct
-10
01
-No
v-1
0
01
-De
c-1
0
01
-Jan
-11
01
-Fe
b-1
1
01
-Mar
-11
01
-Ap
r-1
1
01
-May
-11
media hits
browne review
willets announces £9k
student protests/riots
commons vote through £9k
0
.00
1.0
02
.00
3
Den
sity
0 500 1000 1500number of articles
26
Figure 3: Expected (log) yearly cost of going to university (fees only)
A. Wave 1 B. Wave 2
0.5
11
.52
Den
sity
3 5 7 9 11 13
T
C
kernel = epanechnikov, bandwidth = 0.1483
0.5
11
.52
2.5
Den
sity
3 5 7 9 11 13
T
C
kernel = epanechnikov, bandwidth = 0.0686

27
Figure 4: Ratio of own expected earnings at age 30: higher education relative to leaving school at age 16
(A) Wave 1 (B) Wave 2
0.1
.2.3
.4.5
.6
Den
sity
0 1 2 3 4 5 6 7 8 9 10
T
C
kernel = epanechnikov, bandwidth = 0.1671
0.1
.2.3
.4.5
.6
Den
sity
0 1 2 3 4 5 6 7 8 9 10
T
C
kernel = epanechnikov, bandwidth = 0.1445
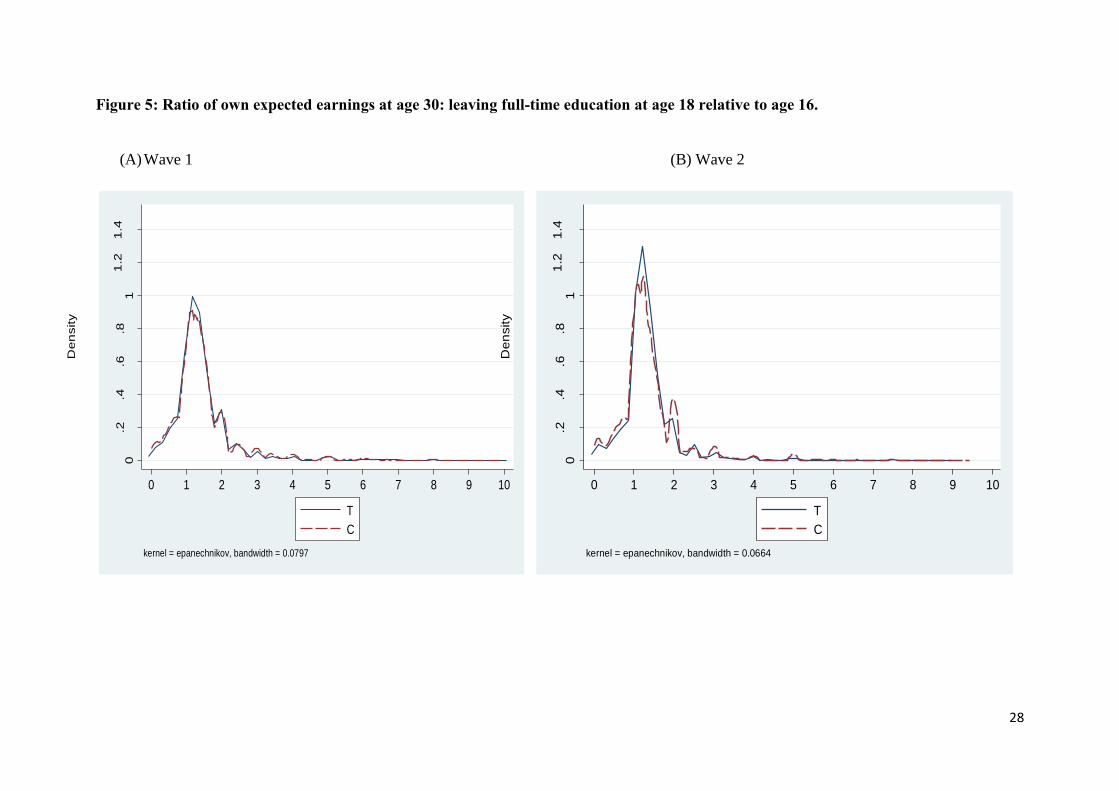
28
Figure 5: Ratio of own expected earnings at age 30: leaving full-time education at age 18 relative to age 16.
(A) Wave 1 (B) Wave 2
0.2
.4.6
.81
1.2
1.4
Den
sity
0 1 2 3 4 5 6 7 8 9 10
T
C
kernel = epanechnikov, bandwidth = 0.0797
0.2
.4.6
.81
1.2
1.4
Den
sity
0 1 2 3 4 5 6 7 8 9 10
T
C
kernel = epanechnikov, bandwidth = 0.0664
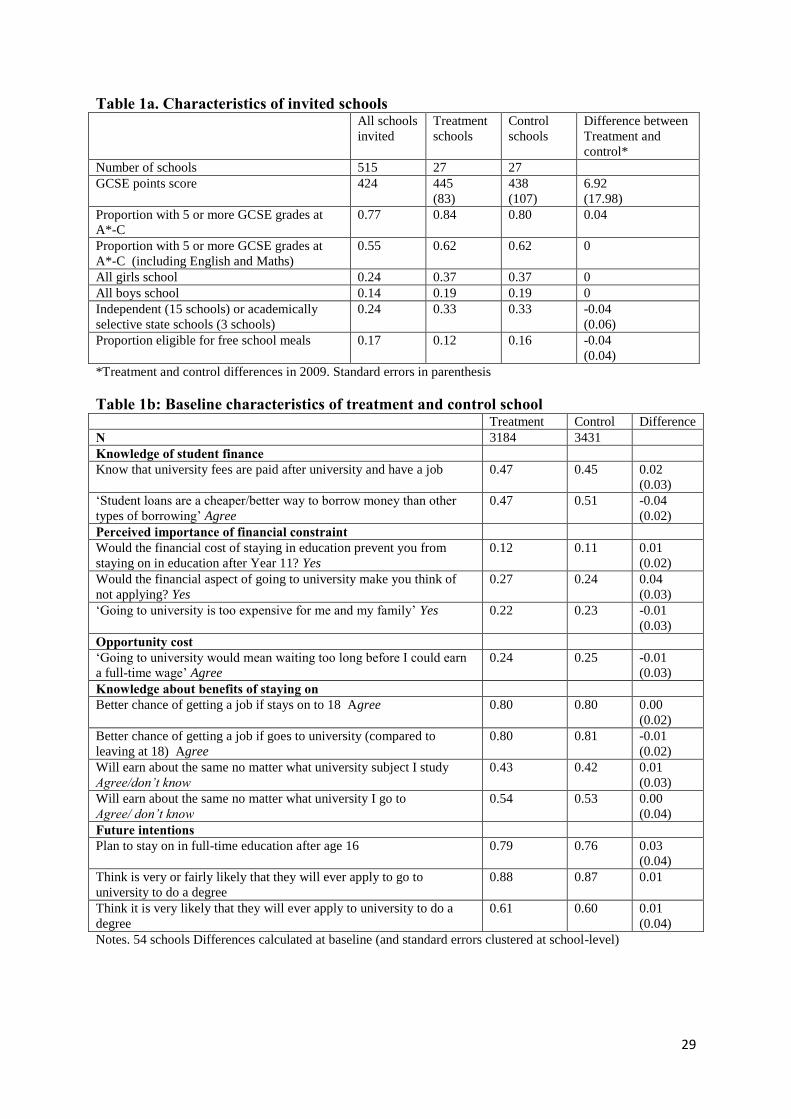
29
Table 1a. Characteristics of invited schools
All schools
invited
Treatment
schools
Control
schools
Difference between
Treatment and
control*
Number of schools 515 27 27
GCSE points score 424 445
(83)
438
(107)
6.92
(17.98)
Proportion with 5 or more GCSE grades at
A*-C
0.77 0.84 0.80 0.04
Proportion with 5 or more GCSE grades at
A*-C (including English and Maths)
0.55 0.62 0.62 0
All girls school 0.24 0.37 0.37 0
All boys school 0.14 0.19 0.19 0
Independent (15 schools) or academically
selective state schools (3 schools)
0.24 0.33 0.33 -0.04
(0.06)
Proportion eligible for free school meals 0.17 0.12 0.16 -0.04
(0.04)
*Treatment and control differences in 2009. Standard errors in parenthesis
Table 1b: Baseline characteristics of treatment and control school Treatment Control Difference
N 3184 3431
Knowledge of student finance
Know that university fees are paid after university and have a job 0.47 0.45 0.02
(0.03)
‘Student loans are a cheaper/better way to borrow money than other
types of borrowing’ Agree
0.47 0.51 -0.04
(0.02)
Perceived importance of financial constraint
Would the financial cost of staying in education prevent you from
staying on in education after Year 11? Yes
0.12 0.11 0.01
(0.02)
Would the financial aspect of going to university make you think of
not applying? Yes
0.27 0.24 0.04
(0.03)
‘Going to university is too expensive for me and my family’ Yes 0.22 0.23 -0.01
(0.03)
Opportunity cost
‘Going to university would mean waiting too long before I could earn
a full-time wage’ Agree
0.24 0.25 -0.01
(0.03)
Knowledge about benefits of staying on
Better chance of getting a job if stays on to 18 Agree 0.80 0.80 0.00
(0.02)
Better chance of getting a job if goes to university (compared to
leaving at 18) Agree
0.80 0.81 -0.01
(0.02)
Will earn about the same no matter what university subject I study
Agree/don’t know
0.43 0.42 0.01
(0.03)
Will earn about the same no matter what university I go to
Agree/ don’t know
0.54 0.53 0.00
(0.04)
Future intentions
Plan to stay on in full-time education after age 16 0.79 0.76 0.03
(0.04)
Think is very or fairly likely that they will ever apply to go to
university to do a degree
0.88 0.87 0.01
Think it is very likely that they will ever apply to university to do a
degree
0.61 0.60 0.01
(0.04)
Notes. 54 schools Differences calculated at baseline (and standard errors clustered at school-level)
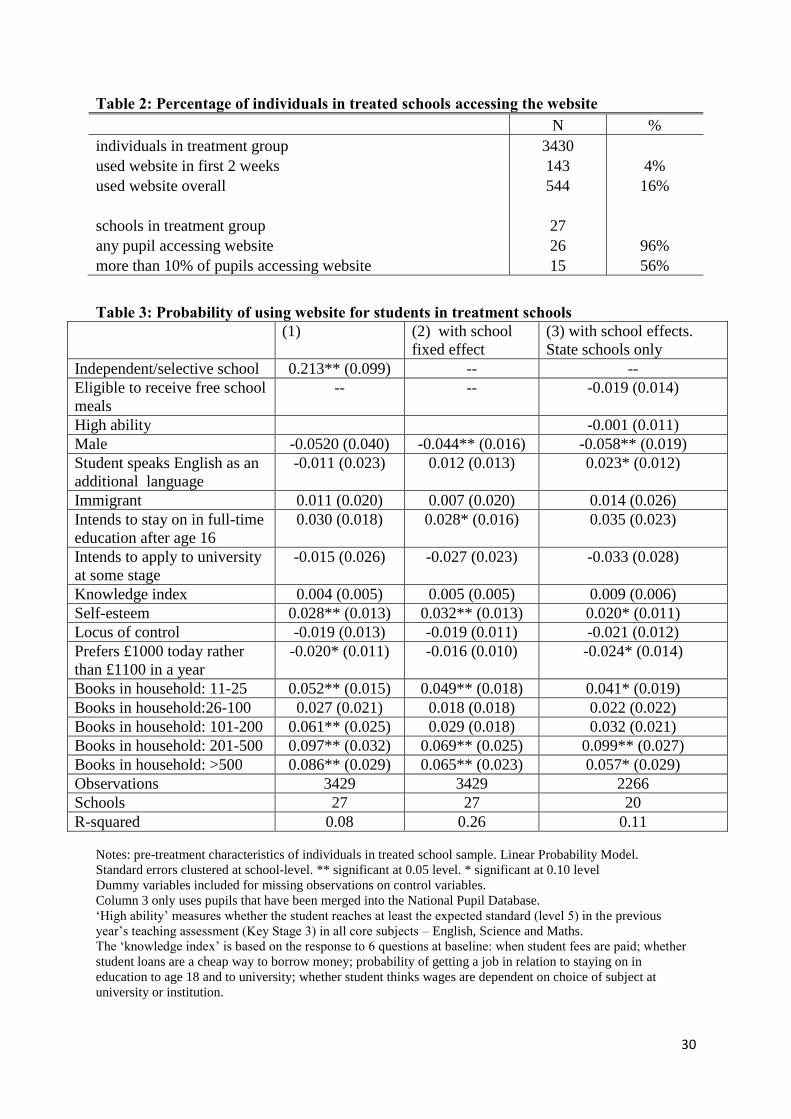
30
Table 2: Percentage of individuals in treated schools accessing the website
N %
individuals in treatment group 3430
used website in first 2 weeks 143 4%
used website overall 544 16%
schools in treatment group 27
any pupil accessing website 26 96%
more than 10% of pupils accessing website 15 56%
Table 3: Probability of using website for students in treatment schools (1) (2) with school
fixed effect
(3) with school effects.
State schools only
Independent/selective school 0.213** (0.099) -- --
Eligible to receive free school
meals
-- -- -0.019 (0.014)
High ability -0.001 (0.011)
Male -0.0520 (0.040) -0.044** (0.016) -0.058** (0.019)
Student speaks English as an
additional language
-0.011 (0.023) 0.012 (0.013) 0.023* (0.012)
Immigrant 0.011 (0.020) 0.007 (0.020) 0.014 (0.026)
Intends to stay on in full-time
education after age 16
0.030 (0.018) 0.028* (0.016) 0.035 (0.023)
Intends to apply to university
at some stage
-0.015 (0.026) -0.027 (0.023) -0.033 (0.028)
Knowledge index 0.004 (0.005) 0.005 (0.005) 0.009 (0.006)
Self-esteem 0.028** (0.013) 0.032** (0.013) 0.020* (0.011)
Locus of control -0.019 (0.013) -0.019 (0.011) -0.021 (0.012)
Prefers £1000 today rather
than £1100 in a year
-0.020* (0.011) -0.016 (0.010) -0.024* (0.014)
Books in household: 11-25 0.052** (0.015) 0.049** (0.018) 0.041* (0.019)
Books in household:26-100 0.027 (0.021) 0.018 (0.018) 0.022 (0.022)
Books in household: 101-200 0.061** (0.025) 0.029 (0.018) 0.032 (0.021)
Books in household: 201-500 0.097** (0.032) 0.069** (0.025) 0.099** (0.027)
Books in household: >500 0.086** (0.029) 0.065** (0.023) 0.057* (0.029)
Observations 3429 3429 2266
Schools 27 27 20
R-squared 0.08 0.26 0.11
Notes: pre-treatment characteristics of individuals in treated school sample. Linear Probability Model.
Standard errors clustered at school-level. ** significant at 0.05 level. * significant at 0.10 level
Dummy variables included for missing observations on control variables.
Column 3 only uses pupils that have been merged into the National Pupil Database.
‘High ability’ measures whether the student reaches at least the expected standard (level 5) in the previous
year’s teaching assessment (Key Stage 3) in all core subjects – English, Science and Maths.
The ‘knowledge index’ is based on the response to 6 questions at baseline: when student fees are paid; whether
student loans are a cheap way to borrow money; probability of getting a job in relation to staying on in
education to age 18 and to university; whether student thinks wages are dependent on choice of subject at
university or institution.
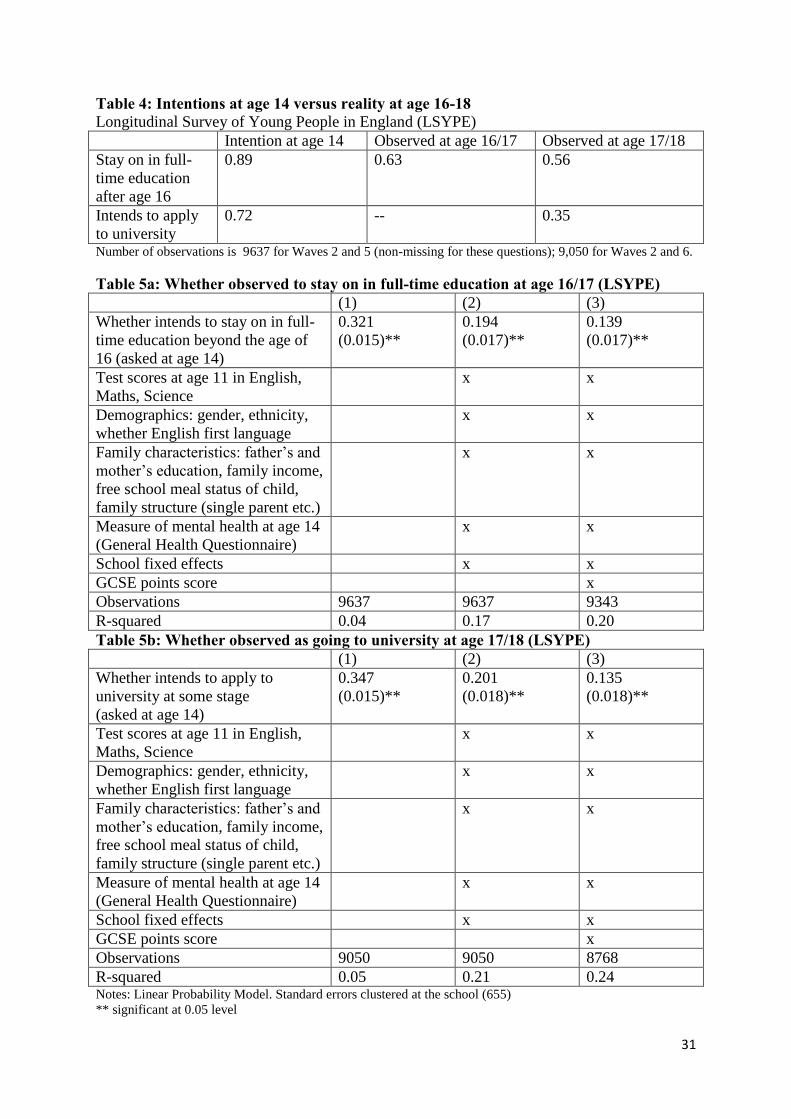
31
Table 4: Intentions at age 14 versus reality at age 16-18 Longitudinal Survey of Young People in England (LSYPE)
Intention at age 14 Observed at age 16/17 Observed at age 17/18
Stay on in full-
time education
after age 16
0.89 0.63 0.56
Intends to apply
to university
0.72 -- 0.35
Number of observations is 9637 for Waves 2 and 5 (non-missing for these questions); 9,050 for Waves 2 and 6.
Table 5a: Whether observed to stay on in full-time education at age 16/17 (LSYPE) (1) (2) (3)
Whether intends to stay on in full-
time education beyond the age of
16 (asked at age 14)
0.321
(0.015)**
0.194
(0.017)**
0.139
(0.017)**
Test scores at age 11 in English,
Maths, Science
x x
Demographics: gender, ethnicity,
whether English first language
x x
Family characteristics: father’s and
mother’s education, family income,
free school meal status of child,
family structure (single parent etc.)
x x
Measure of mental health at age 14
(General Health Questionnaire)
x x
School fixed effects x x
GCSE points score x
Observations 9637 9637 9343
R-squared 0.04 0.17 0.20
Table 5b: Whether observed as going to university at age 17/18 (LSYPE) (1) (2) (3)
Whether intends to apply to
university at some stage
(asked at age 14)
0.347
(0.015)**
0.201
(0.018)**
0.135
(0.018)**
Test scores at age 11 in English,
Maths, Science
x x
Demographics: gender, ethnicity,
whether English first language
x x
Family characteristics: father’s and
mother’s education, family income,
free school meal status of child,
family structure (single parent etc.)
x x
Measure of mental health at age 14
(General Health Questionnaire)
x x
School fixed effects x x
GCSE points score x
Observations 9050 9050 8768
R-squared 0.05 0.21 0.24 Notes: Linear Probability Model. Standard errors clustered at the school (655)
** significant at 0.05 level

32
Table 6. Transition matrices for control group
A. Whether intends to stay on in full-time education after the age of 16
Mean (agreeing) at Wave 1=0.764. Mean at Wave 2: 0.770
Does not intends to stay on: W2
Intends to stay on: W2
Does not intends to stay on W1 0.605 0.394
Intends to stay on W1 0.114 0.886
B. Would the financial aspect of going to university make you think of not applying?
Mean (agreeing) at Wave 1=0.237. Mean at Wave 2: 0.285
No: W2
Yes: W2
No: W1 0.834 0.166
Yes: W2 0.328 0.672
C. ‘Going to university is too expensive for me and my family’
Mean (agreeing) at Wave 1=0.226. Mean at Wave 2: 0.285
No: W2
Yes: W2
No: W1 0.833 0.166
Yes: W2 0.315 0.685
D. Likely to ever apply to go to university to do a degree
Mean (agreeing) at Wave 1=0.869. Mean at Wave 2: 0.848
No: W2
Yes: W2
No: W1 0.601 0.399
Yes: W2 0.081 0.919
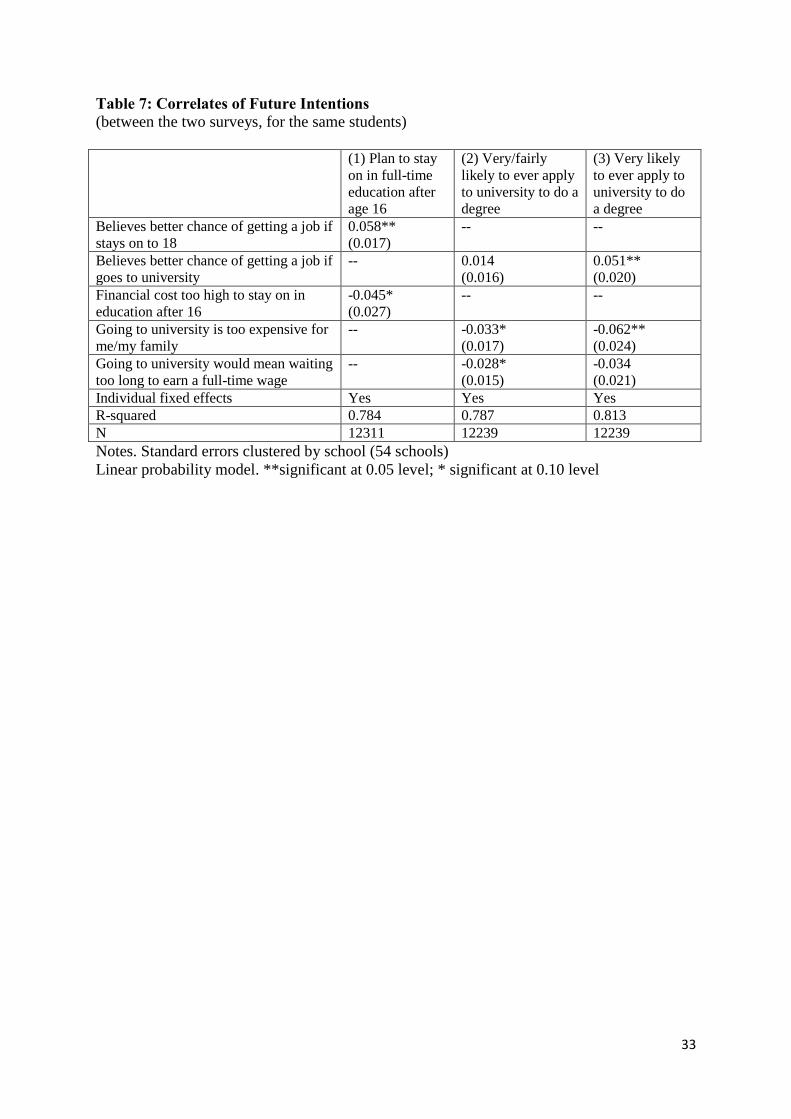
33
Table 7: Correlates of Future Intentions (between the two surveys, for the same students)
(1) Plan to stay
on in full-time
education after
age 16
(2) Very/fairly
likely to ever apply
to university to do a
degree
(3) Very likely
to ever apply to
university to do
a degree
Believes better chance of getting a job if
stays on to 18
0.058**
(0.017)
-- --
Believes better chance of getting a job if
goes to university
-- 0.014
(0.016)
0.051**
(0.020)
Financial cost too high to stay on in
education after 16
-0.045*
(0.027)
-- --
Going to university is too expensive for
me/my family
-- -0.033*
(0.017)
-0.062**
(0.024)
Going to university would mean waiting
too long to earn a full-time wage
-- -0.028*
(0.015)
-0.034
(0.021)
Individual fixed effects Yes Yes Yes
R-squared 0.784 0.787 0.813
N 12311 12239 12239
Notes. Standard errors clustered by school (54 schools)
Linear probability model. **significant at 0.05 level; * significant at 0.10 level
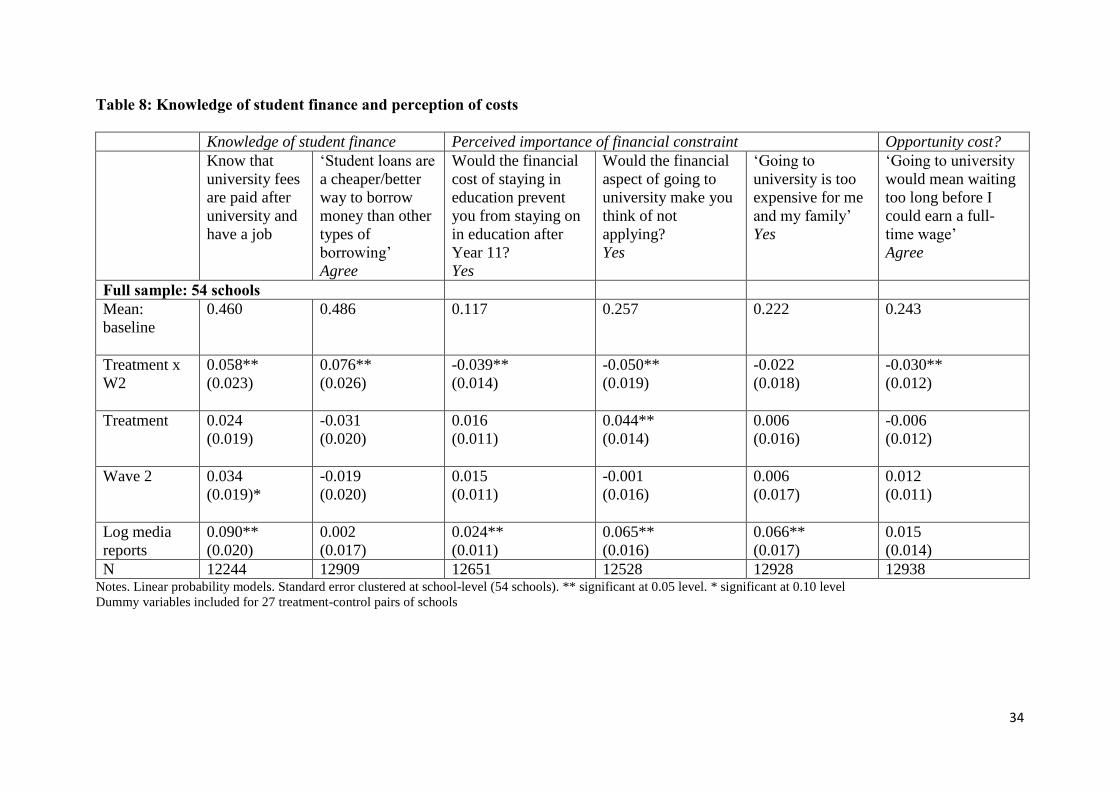
34
Table 8: Knowledge of student finance and perception of costs
Knowledge of student finance Perceived importance of financial constraint Opportunity cost?
Know that
university fees
are paid after
university and
have a job
‘Student loans are
a cheaper/better
way to borrow
money than other
types of
borrowing’
Agree
Would the financial
cost of staying in
education prevent
you from staying on
in education after
Year 11?
Yes
Would the financial
aspect of going to
university make you
think of not
applying?
Yes
‘Going to
university is too
expensive for me
and my family’
Yes
‘Going to university
would mean waiting
too long before I
could earn a full-
time wage’
Agree
Full sample: 54 schools
Mean:
baseline
0.460 0.486 0.117 0.257 0.222 0.243
Treatment x
W2
0.058**
(0.023)
0.076**
(0.026)
-0.039**
(0.014)
-0.050**
(0.019)
-0.022
(0.018)
-0.030**
(0.012)
Treatment 0.024
(0.019)
-0.031
(0.020)
0.016
(0.011)
0.044**
(0.014)
0.006
(0.016)
-0.006
(0.012)
Wave 2 0.034
(0.019)*
-0.019
(0.020)
0.015
(0.011)
-0.001
(0.016)
0.006
(0.017)
0.012
(0.011)
Log media
reports
0.090**
(0.020)
0.002
(0.017)
0.024**
(0.011)
0.065**
(0.016)
0.066**
(0.017)
0.015
(0.014)
N 12244 12909 12651 12528 12928 12938 Notes. Linear probability models. Standard error clustered at school-level (54 schools). ** significant at 0.05 level. * significant at 0.10 level
Dummy variables included for 27 treatment-control pairs of schools

35
Table 9: Perception of benefits
Better chance of getting a
job if stays on to 18
Agree
Better chance of getting a
job if goes to university
(compared to leaving at
18) Agree
Will earn about the same no
matter what university
subject I study
Agree/don’t know
Will earn about the same
no matter what university I
go to
Agree/ don’t know
Mean: baseline 0.798
0.804 0.427 0.534
Treatment x Wave 2
0.023
(0.016)
0.033**
(0.015)
-0.052**
(0.019)
-0.056**
(0.017)
Treatment -0.005
(0.012)
-0.008
(0.012)
0.019
(0.012)
0.013
(0.013)
Wave 2 -0.001
(0.016)
-0.018
(0.014)
-0.025
(0.016)
0.0090
(0.020)
Log media reports -0.006
(0.015)
0.016
(0.013)
0.019
(0.019)
0.027
(0.020) Notes. Linear probability models. Standard error clustered at school-level (54 schools). ** significant at 0.05 level. * significant at 0.10 level
Dummy variables included for 27 treatment-control pairs of schools

36
Table 10: Future Intentions
Plan to stay on in full-time
education after age 16
Think is very or fairly likely that
they will ever apply to go to
university to do a degree
Think it is very likely that they
will ever apply to university to do
a degree
Full sample: 54 schools Mean: baseline 0.779
0.874 0.590
Treatment x W2 0.029**
(0.013)
-0.003
(0.010)
0.006
(0.014)
Treatment 0.019
(0.015)
0.006
(0.013)
0.001
(0.016)
Wave 2 0.024
(0.020)
-0.007
(0.011)
-0.002
(0.016)
Log media reports
-0.021
(0.020)
-0.017
(0.012)
-0.040**
(0.017)
N 12,664 12,606 12,606 Notes. Linear probability models. Standard error clustered at school-level (54 schools). ** significant at 0.05 level. * significant at 0.10 level
Dummy variables included for 27 treatment-control pairs of schools
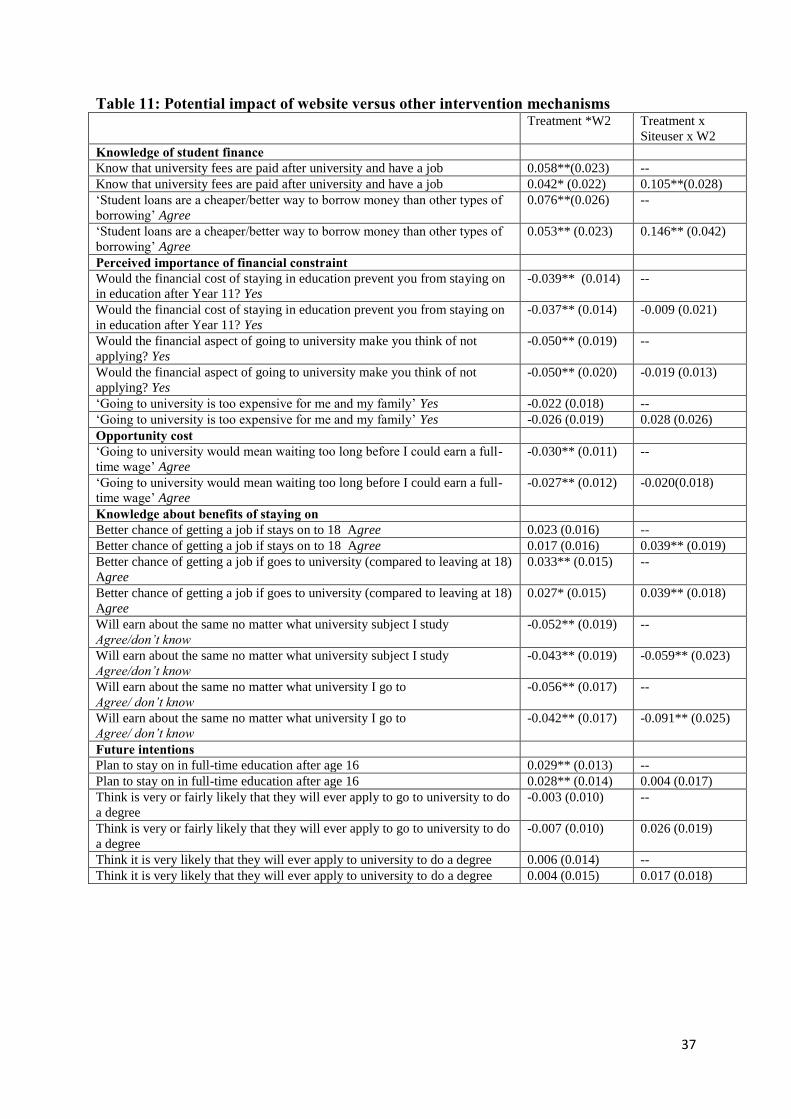
37
Table 11: Potential impact of website versus other intervention mechanisms Treatment *W2 Treatment x
Siteuser x W2
Knowledge of student finance
Know that university fees are paid after university and have a job 0.058**(0.023) --
Know that university fees are paid after university and have a job 0.042* (0.022) 0.105**(0.028)
‘Student loans are a cheaper/better way to borrow money than other types of
borrowing’ Agree
0.076**(0.026) --
‘Student loans are a cheaper/better way to borrow money than other types of
borrowing’ Agree
0.053** (0.023) 0.146** (0.042)
Perceived importance of financial constraint
Would the financial cost of staying in education prevent you from staying on
in education after Year 11? Yes
-0.039** (0.014) --
Would the financial cost of staying in education prevent you from staying on
in education after Year 11? Yes
-0.037** (0.014) -0.009 (0.021)
Would the financial aspect of going to university make you think of not
applying? Yes
-0.050** (0.019) --
Would the financial aspect of going to university make you think of not
applying? Yes
-0.050** (0.020) -0.019 (0.013)
‘Going to university is too expensive for me and my family’ Yes -0.022 (0.018) --
‘Going to university is too expensive for me and my family’ Yes -0.026 (0.019) 0.028 (0.026)
Opportunity cost
‘Going to university would mean waiting too long before I could earn a full-
time wage’ Agree
-0.030** (0.011) --
‘Going to university would mean waiting too long before I could earn a full-
time wage’ Agree
-0.027** (0.012) -0.020(0.018)
Knowledge about benefits of staying on
Better chance of getting a job if stays on to 18 Agree 0.023 (0.016) --
Better chance of getting a job if stays on to 18 Agree 0.017 (0.016) 0.039** (0.019)
Better chance of getting a job if goes to university (compared to leaving at 18)
Agree
0.033** (0.015) --
Better chance of getting a job if goes to university (compared to leaving at 18)
Agree
0.027* (0.015) 0.039** (0.018)
Will earn about the same no matter what university subject I study
Agree/don’t know
-0.052** (0.019) --
Will earn about the same no matter what university subject I study
Agree/don’t know
-0.043** (0.019) -0.059** (0.023)
Will earn about the same no matter what university I go to
Agree/ don’t know
-0.056** (0.017) --
Will earn about the same no matter what university I go to
Agree/ don’t know
-0.042** (0.017) -0.091** (0.025)
Future intentions
Plan to stay on in full-time education after age 16 0.029** (0.013) --
Plan to stay on in full-time education after age 16 0.028** (0.014) 0.004 (0.017)
Think is very or fairly likely that they will ever apply to go to university to do
a degree
-0.003 (0.010) --
Think is very or fairly likely that they will ever apply to go to university to do
a degree
-0.007 (0.010) 0.026 (0.019)
Think it is very likely that they will ever apply to university to do a degree 0.006 (0.014) --
Think it is very likely that they will ever apply to university to do a degree 0.004 (0.015) 0.017 (0.018)
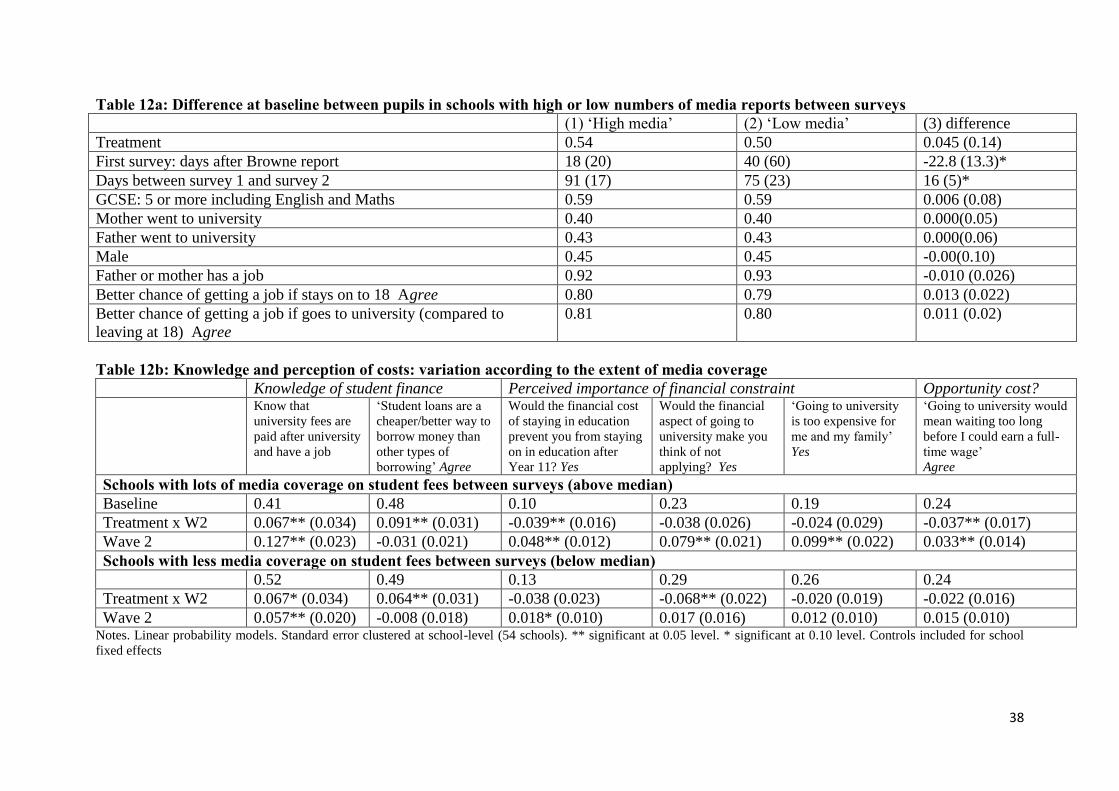
38
Table 12a: Difference at baseline between pupils in schools with high or low numbers of media reports between surveys (1) ‘High media’ (2) ‘Low media’ (3) difference
Treatment 0.54 0.50 0.045 (0.14)
First survey: days after Browne report 18 (20) 40 (60) -22.8 (13.3)*
Days between survey 1 and survey 2 91 (17) 75 (23) 16 (5)*
GCSE: 5 or more including English and Maths 0.59 0.59 0.006 (0.08)
Mother went to university 0.40 0.40 0.000(0.05)
Father went to university 0.43 0.43 0.000(0.06)
Male 0.45 0.45 -0.00(0.10)
Father or mother has a job 0.92 0.93 -0.010 (0.026)
Better chance of getting a job if stays on to 18 Agree 0.80 0.79 0.013 (0.022)
Better chance of getting a job if goes to university (compared to
leaving at 18) Agree
0.81 0.80 0.011 (0.02)
Table 12b: Knowledge and perception of costs: variation according to the extent of media coverage
Knowledge of student finance Perceived importance of financial constraint Opportunity cost? Know that
university fees are
paid after university
and have a job
‘Student loans are a
cheaper/better way to
borrow money than
other types of
borrowing’ Agree
Would the financial cost
of staying in education
prevent you from staying
on in education after
Year 11? Yes
Would the financial
aspect of going to
university make you
think of not
applying? Yes
‘Going to university
is too expensive for
me and my family’
Yes
‘Going to university would
mean waiting too long
before I could earn a full-
time wage’
Agree
Schools with lots of media coverage on student fees between surveys (above median) Baseline 0.41 0.48 0.10 0.23 0.19 0.24
Treatment x W2 0.067** (0.034) 0.091** (0.031) -0.039** (0.016) -0.038 (0.026) -0.024 (0.029) -0.037** (0.017)
Wave 2 0.127** (0.023) -0.031 (0.021) 0.048** (0.012) 0.079** (0.021) 0.099** (0.022) 0.033** (0.014)
Schools with less media coverage on student fees between surveys (below median) 0.52 0.49 0.13 0.29 0.26 0.24
Treatment x W2 0.067* (0.034) 0.064** (0.031) -0.038 (0.023) -0.068** (0.022) -0.020 (0.019) -0.022 (0.016)
Wave 2 0.057** (0.020) -0.008 (0.018) 0.018* (0.010) 0.017 (0.016) 0.012 (0.010) 0.015 (0.010) Notes. Linear probability models. Standard error clustered at school-level (54 schools). ** significant at 0.05 level. * significant at 0.10 level. Controls included for school
fixed effects
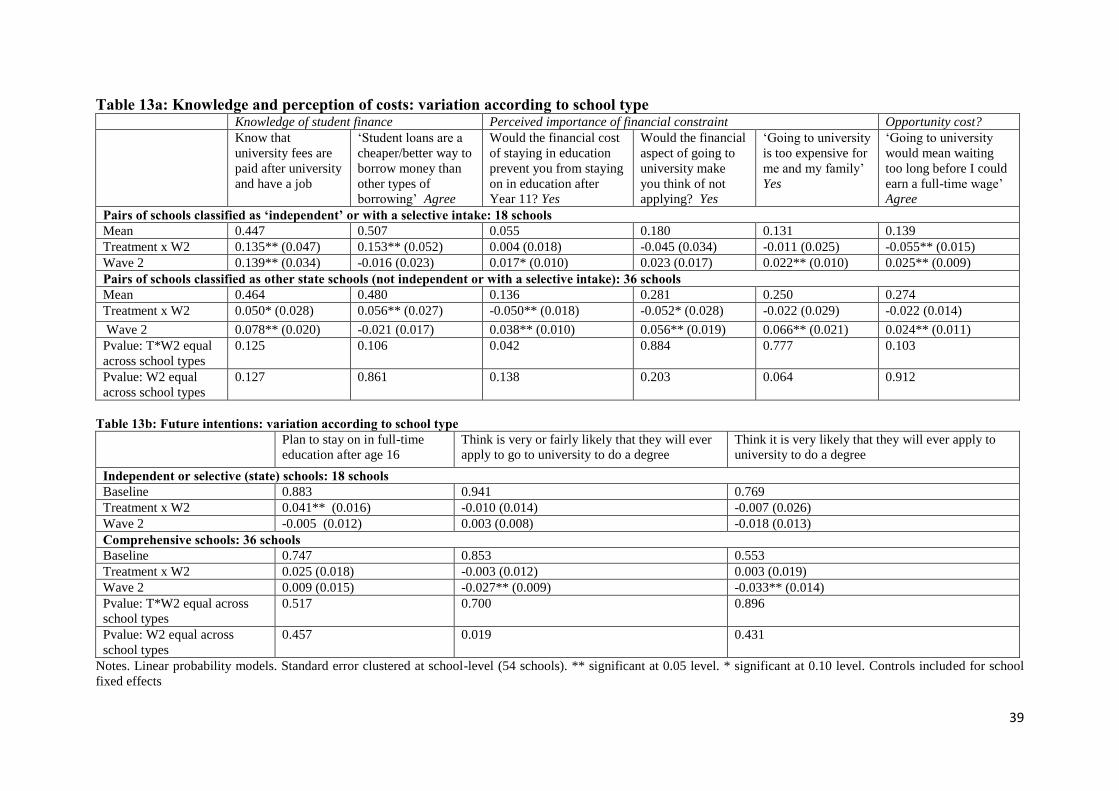
39
Table 13a: Knowledge and perception of costs: variation according to school type Knowledge of student finance Perceived importance of financial constraint Opportunity cost?
Know that
university fees are
paid after university
and have a job
‘Student loans are a
cheaper/better way to
borrow money than
other types of
borrowing’ Agree
Would the financial cost
of staying in education
prevent you from staying
on in education after
Year 11? Yes
Would the financial
aspect of going to
university make
you think of not
applying? Yes
‘Going to university
is too expensive for
me and my family’
Yes
‘Going to university
would mean waiting
too long before I could
earn a full-time wage’
Agree
Pairs of schools classified as ‘independent’ or with a selective intake: 18 schools
Mean 0.447 0.507 0.055 0.180 0.131 0.139
Treatment x W2 0.135** (0.047) 0.153** (0.052) 0.004 (0.018) -0.045 (0.034) -0.011 (0.025) -0.055** (0.015)
Wave 2 0.139** (0.034) -0.016 (0.023) 0.017* (0.010) 0.023 (0.017) 0.022** (0.010) 0.025** (0.009)
Pairs of schools classified as other state schools (not independent or with a selective intake): 36 schools Mean 0.464 0.480 0.136 0.281 0.250 0.274
Treatment x W2 0.050* (0.028) 0.056** (0.027) -0.050** (0.018) -0.052* (0.028) -0.022 (0.029) -0.022 (0.014)
Wave 2 0.078** (0.020) -0.021 (0.017) 0.038** (0.010) 0.056** (0.019) 0.066** (0.021) 0.024** (0.011)
Pvalue: T*W2 equal
across school types
0.125 0.106 0.042 0.884 0.777 0.103
Pvalue: W2 equal
across school types
0.127 0.861 0.138 0.203 0.064 0.912
Table 13b: Future intentions: variation according to school type
Plan to stay on in full-time
education after age 16
Think is very or fairly likely that they will ever
apply to go to university to do a degree
Think it is very likely that they will ever apply to
university to do a degree
Independent or selective (state) schools: 18 schools Baseline 0.883 0.941 0.769
Treatment x W2 0.041** (0.016) -0.010 (0.014) -0.007 (0.026)
Wave 2 -0.005 (0.012) 0.003 (0.008) -0.018 (0.013)
Comprehensive schools: 36 schools Baseline 0.747 0.853 0.553
Treatment x W2 0.025 (0.018) -0.003 (0.012) 0.003 (0.019)
Wave 2 0.009 (0.015) -0.027** (0.009) -0.033** (0.014)
Pvalue: T*W2 equal across
school types
0.517 0.700 0.896
Pvalue: W2 equal across
school types
0.457 0.019 0.431
Notes. Linear probability models. Standard error clustered at school-level (54 schools). ** significant at 0.05 level. * significant at 0.10 level. Controls included for school
fixed effects
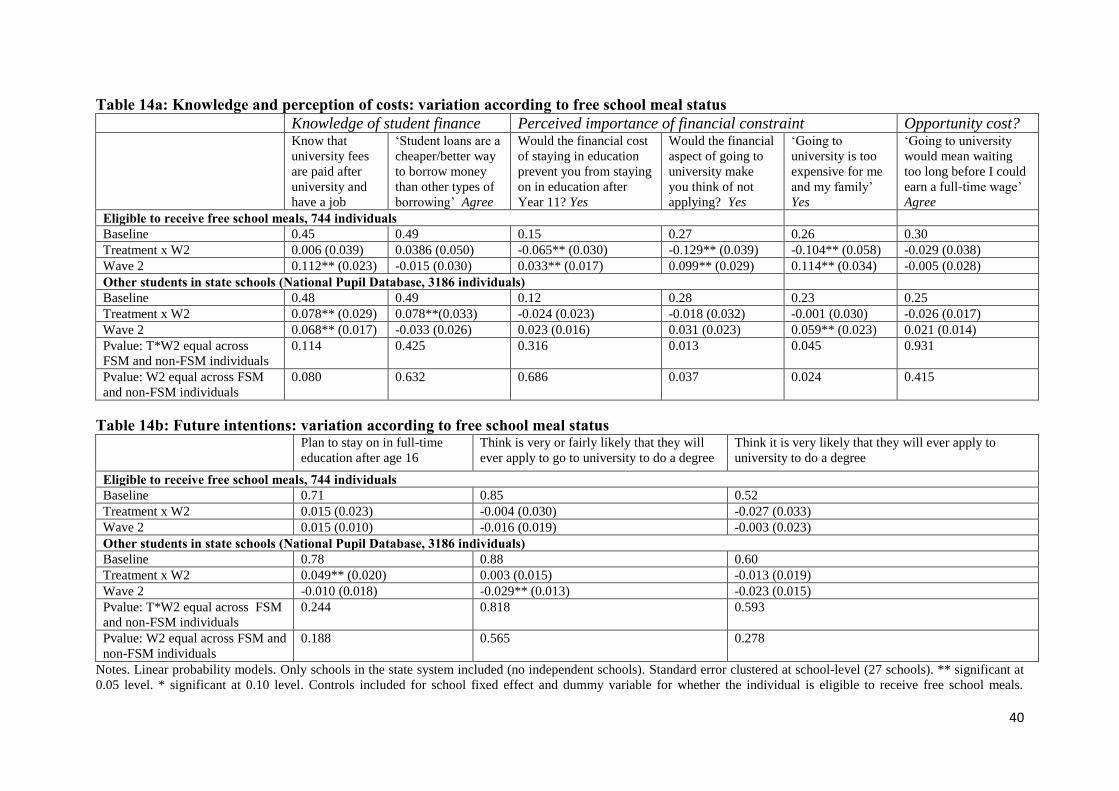
40
Table 14a: Knowledge and perception of costs: variation according to free school meal status
Knowledge of student finance Perceived importance of financial constraint Opportunity cost? Know that
university fees
are paid after
university and
have a job
‘Student loans are a
cheaper/better way
to borrow money
than other types of
borrowing’ Agree
Would the financial cost
of staying in education
prevent you from staying
on in education after
Year 11? Yes
Would the financial
aspect of going to
university make
you think of not
applying? Yes
‘Going to
university is too
expensive for me
and my family’
Yes
‘Going to university
would mean waiting
too long before I could
earn a full-time wage’
Agree
Eligible to receive free school meals, 744 individuals
Baseline 0.45 0.49 0.15 0.27 0.26 0.30
Treatment x W2 0.006 (0.039) 0.0386 (0.050) -0.065** (0.030) -0.129** (0.039) -0.104** (0.058) -0.029 (0.038)
Wave 2 0.112** (0.023) -0.015 (0.030) 0.033** (0.017) 0.099** (0.029) 0.114** (0.034) -0.005 (0.028)
Other students in state schools (National Pupil Database, 3186 individuals) Baseline 0.48 0.49 0.12 0.28 0.23 0.25
Treatment x W2 0.078** (0.029) 0.078**(0.033) -0.024 (0.023) -0.018 (0.032) -0.001 (0.030) -0.026 (0.017)
Wave 2 0.068** (0.017) -0.033 (0.026) 0.023 (0.016) 0.031 (0.023) 0.059** (0.023) 0.021 (0.014)
Pvalue: T*W2 equal across
FSM and non-FSM individuals
0.114 0.425 0.316 0.013 0.045 0.931
Pvalue: W2 equal across FSM
and non-FSM individuals
0.080 0.632 0.686 0.037 0.024 0.415
Table 14b: Future intentions: variation according to free school meal status
Plan to stay on in full-time
education after age 16
Think is very or fairly likely that they will
ever apply to go to university to do a degree
Think it is very likely that they will ever apply to
university to do a degree
Eligible to receive free school meals, 744 individuals Baseline 0.71 0.85 0.52
Treatment x W2 0.015 (0.023) -0.004 (0.030) -0.027 (0.033)
Wave 2 0.015 (0.010) -0.016 (0.019) -0.003 (0.023)
Other students in state schools (National Pupil Database, 3186 individuals) Baseline 0.78 0.88 0.60
Treatment x W2 0.049** (0.020) 0.003 (0.015) -0.013 (0.019)
Wave 2 -0.010 (0.018) -0.029** (0.013) -0.023 (0.015)
Pvalue: T*W2 equal across FSM
and non-FSM individuals
0.244 0.818 0.593
Pvalue: W2 equal across FSM and
non-FSM individuals
0.188 0.565 0.278
Notes. Linear probability models. Only schools in the state system included (no independent schools). Standard error clustered at school-level (27 schools). ** significant at
0.05 level. * significant at 0.10 level. Controls included for school fixed effect and dummy variable for whether the individual is eligible to receive free school meals.

41
Appendix A: Selected Material from ‘Information Treatment’: See: http://www.whats4.me.uk/ 1 page leaflet (front and back) and part of presentation for use by teachers

42
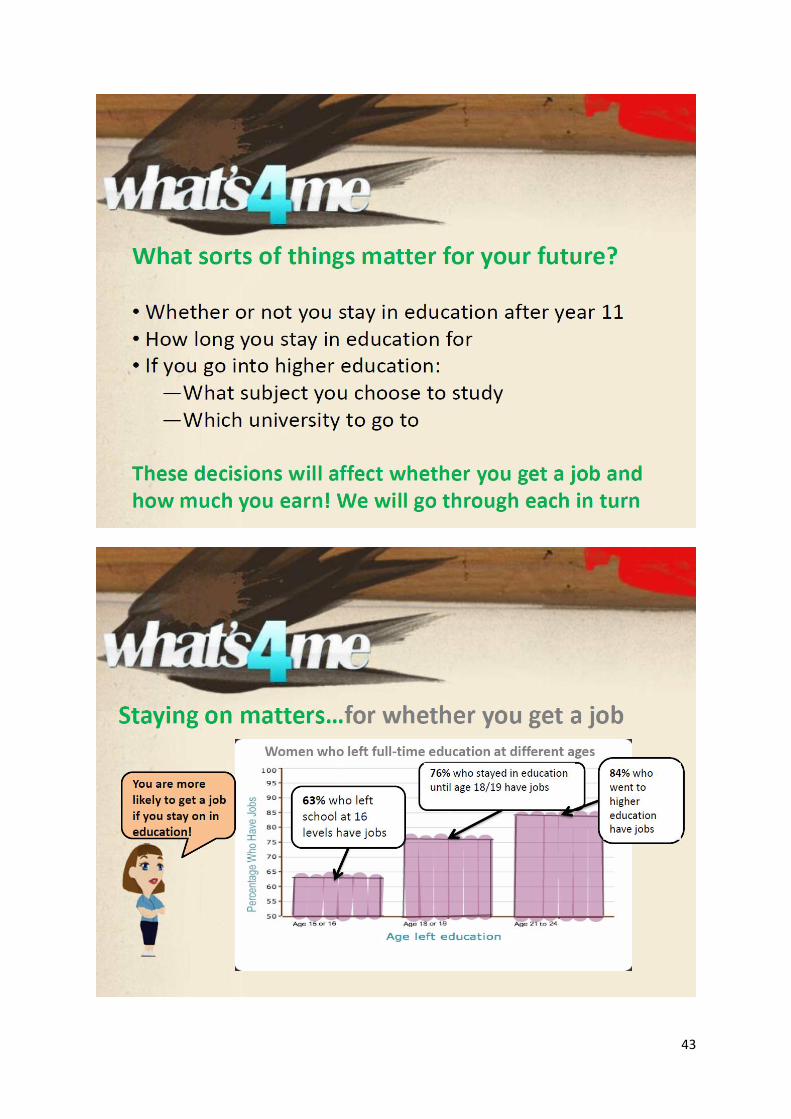
43
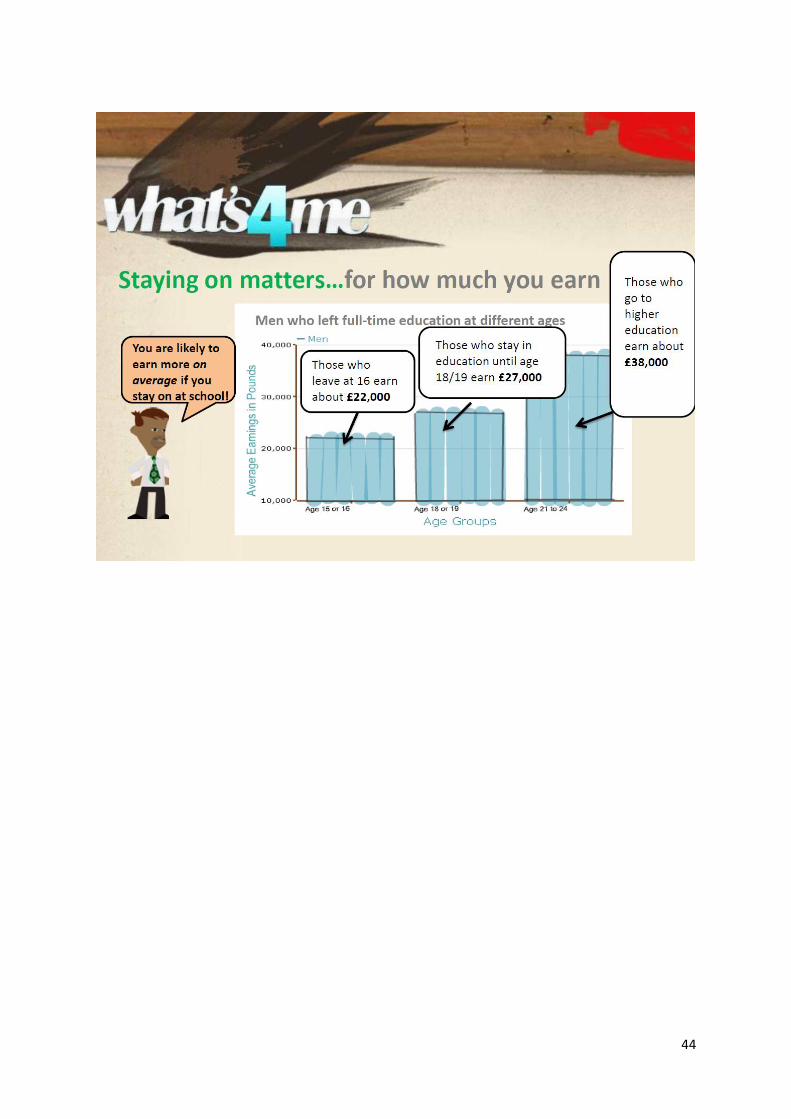
44

45

46
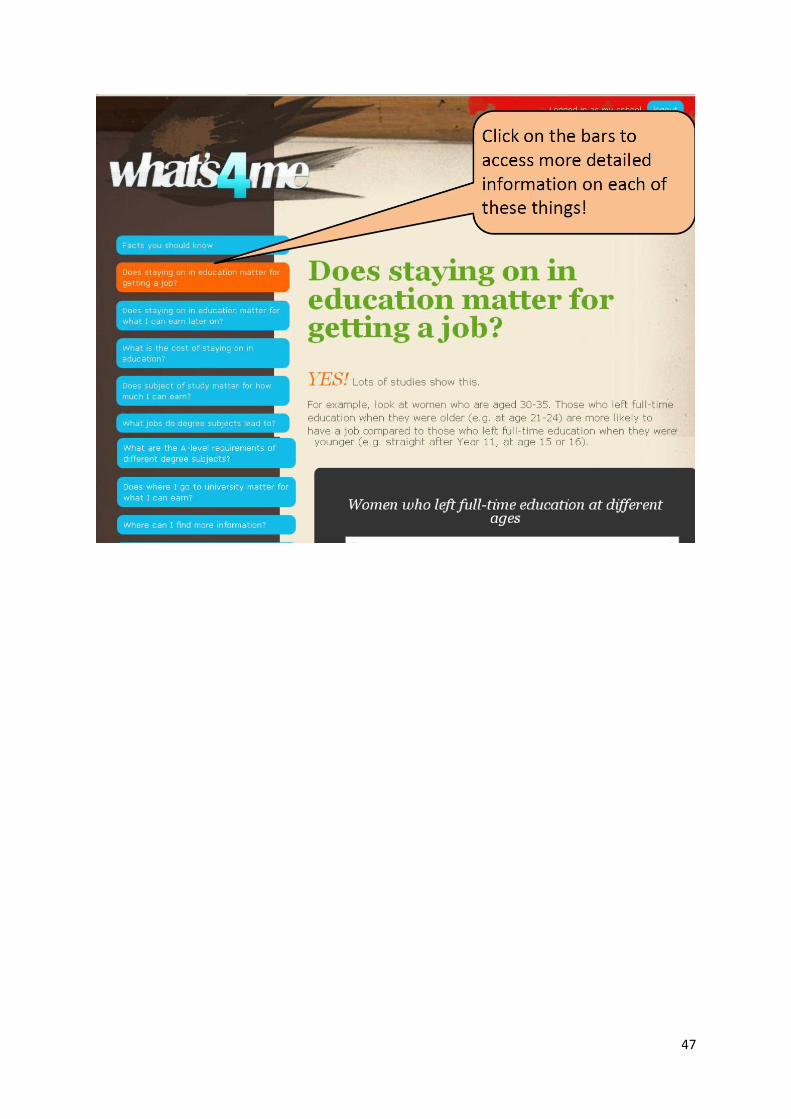
47
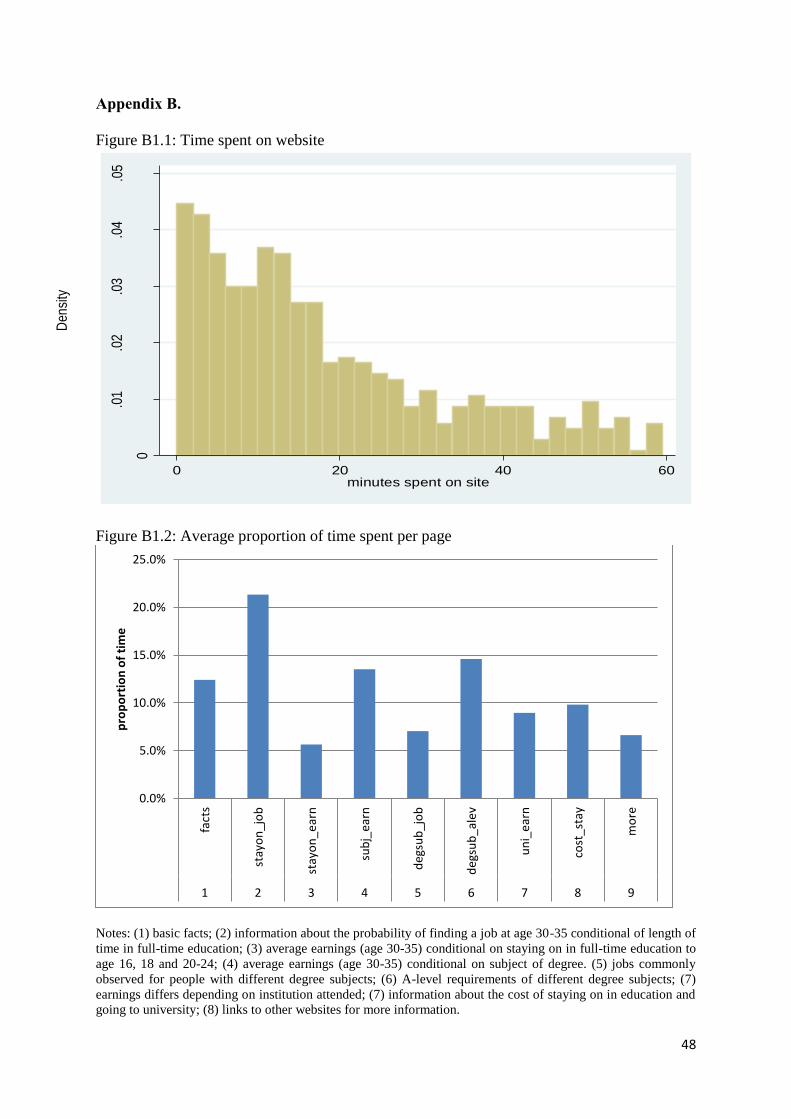
48
Appendix B.
Figure B1.1: Time spent on website
Figure B1.2: Average proportion of time spent per page
Notes: (1) basic facts; (2) information about the probability of finding a job at age 30-35 conditional of length of
time in full-time education; (3) average earnings (age 30-35) conditional on staying on in full-time education to
age 16, 18 and 20-24; (4) average earnings (age 30-35) conditional on subject of degree. (5) jobs commonly
observed for people with different degree subjects; (6) A-level requirements of different degree subjects; (7)
earnings differs depending on institution attended; (7) information about the cost of staying on in education and
going to university; (8) links to other websites for more information.
0
.01
.02
.03
.04
.05
Den
sity
0 20 40 60minutes spent on site
0.0%
5.0%
10.0%
15.0%
20.0%
25.0%
fact
s
stay
on
_jo
b
stay
on
_ear
n
sub
j_ea
rn
deg
sub
_jo
b
deg
sub
_ale
v
un
i_e
arn
cost
_sta
y
mo
re
1 2 3 4 5 6 7 8 9
pro
po
rtio
n o
f ti
me
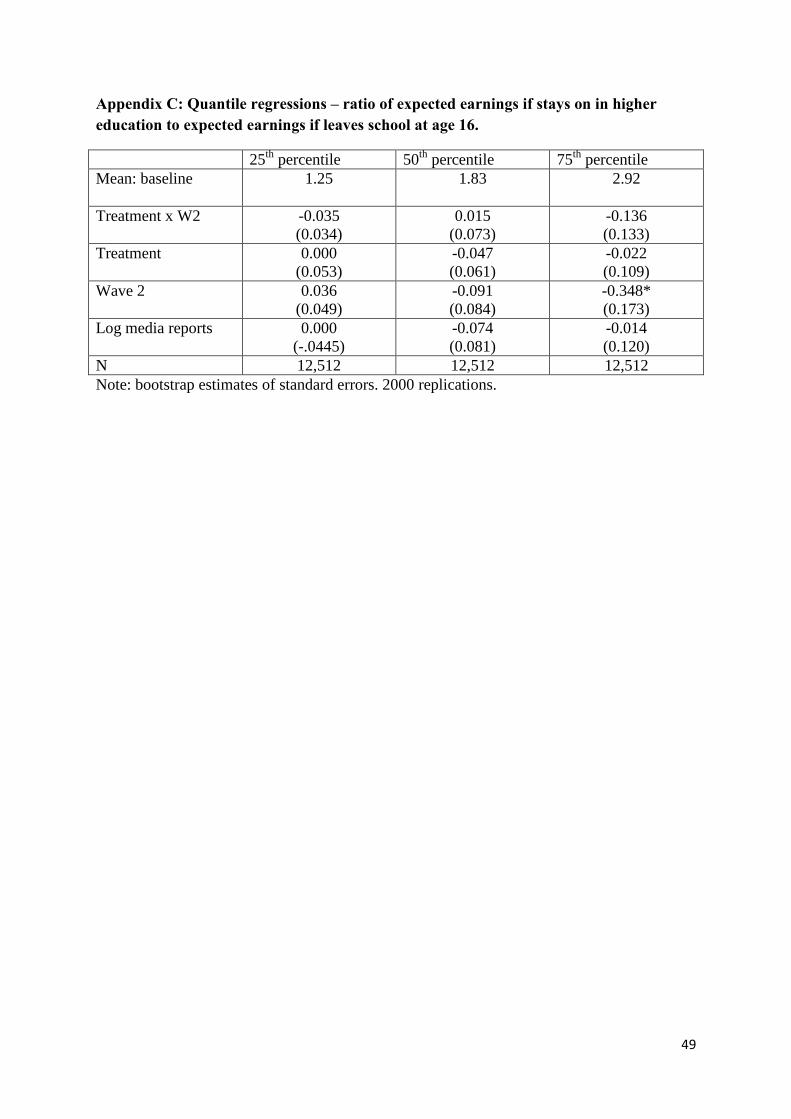
49
Appendix C: Quantile regressions – ratio of expected earnings if stays on in higher education to expected earnings if leaves school at age 16.
25th
percentile 50th
percentile 75th
percentile
Mean: baseline
1.25 1.83 2.92
Treatment x W2 -0.035
(0.034)
0.015
(0.073)
-0.136
(0.133)
Treatment 0.000
(0.053)
-0.047
(0.061)
-0.022
(0.109)
Wave 2 0.036
(0.049)
-0.091
(0.084)
-0.348*
(0.173)
Log media reports 0.000
(-.0445)
-0.074
(0.081)
-0.014
(0.120)
N 12,512 12,512 12,512
Note: bootstrap estimates of standard errors. 2000 replications.
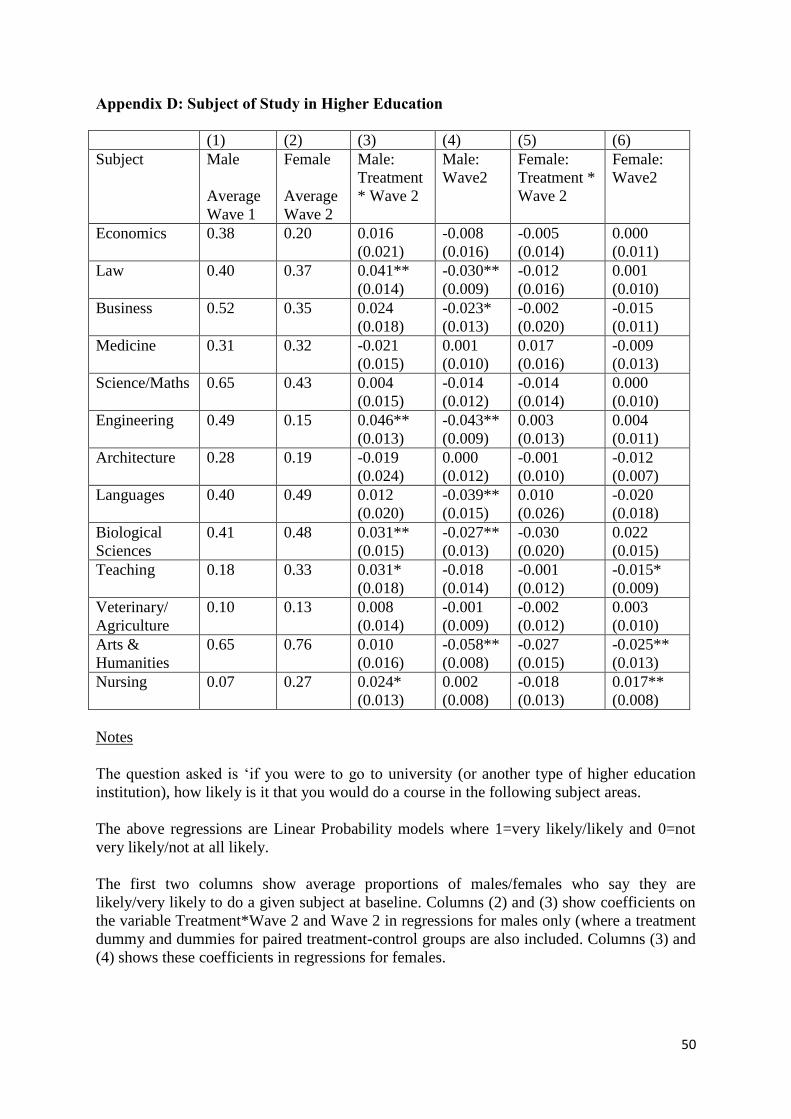
50
Appendix D: Subject of Study in Higher Education
(1) (2) (3) (4) (5) (6)
Subject Male
Average
Wave 1
Female
Average
Wave 2
Male:
Treatment
* Wave 2
Male:
Wave2
Female:
Treatment *
Wave 2
Female:
Wave2
Economics 0.38 0.20 0.016
(0.021)
-0.008
(0.016)
-0.005
(0.014)
0.000
(0.011)
Law 0.40 0.37 0.041**
(0.014)
-0.030**
(0.009)
-0.012
(0.016)
0.001
(0.010)
Business 0.52 0.35 0.024
(0.018)
-0.023*
(0.013)
-0.002
(0.020)
-0.015
(0.011)
Medicine 0.31 0.32 -0.021
(0.015)
0.001
(0.010)
0.017
(0.016)
-0.009
(0.013)
Science/Maths 0.65 0.43 0.004
(0.015)
-0.014
(0.012)
-0.014
(0.014)
0.000
(0.010)
Engineering 0.49 0.15 0.046**
(0.013)
-0.043**
(0.009)
0.003
(0.013)
0.004
(0.011)
Architecture 0.28 0.19 -0.019
(0.024)
0.000
(0.012)
-0.001
(0.010)
-0.012
(0.007)
Languages 0.40 0.49 0.012
(0.020)
-0.039**
(0.015)
0.010
(0.026)
-0.020
(0.018)
Biological
Sciences
0.41 0.48 0.031**
(0.015)
-0.027**
(0.013)
-0.030
(0.020)
0.022
(0.015)
Teaching 0.18 0.33 0.031*
(0.018)
-0.018
(0.014)
-0.001
(0.012)
-0.015*
(0.009)
Veterinary/
Agriculture
0.10 0.13 0.008
(0.014)
-0.001
(0.009)
-0.002
(0.012)
0.003
(0.010)
Arts &
Humanities
0.65 0.76 0.010
(0.016)
-0.058**
(0.008)
-0.027
(0.015)
-0.025**
(0.013)
Nursing 0.07 0.27 0.024*
(0.013)
0.002
(0.008)
-0.018
(0.013)
0.017**
(0.008)
Notes
The question asked is ‘if you were to go to university (or another type of higher education
institution), how likely is it that you would do a course in the following subject areas.
The above regressions are Linear Probability models where 1=very likely/likely and 0=not
very likely/not at all likely.
The first two columns show average proportions of males/females who say they are
likely/very likely to do a given subject at baseline. Columns (2) and (3) show coefficients on
the variable Treatment*Wave 2 and Wave 2 in regressions for males only (where a treatment
dummy and dummies for paired treatment-control groups are also included. Columns (3) and
(4) shows these coefficients in regressions for females.