measures of location/central … fractiles (extension of the median) computations of the fractile...
TRANSCRIPT
MEASURES OF LOCATION/CENTRAL
TENDENCY/AVERAGES

It is often necessary to represent a set of data by means of a single number, which, in its way, is descriptive of the entire set. This number depends on the particular characteristic we want to describe. We shall consider several measures which somehow describe the center or middle of a set of data – appropriately, they are called measures of location/central tendency/averages.

Average. In the statistical sense, is a measure of central tendency for a collection of values.
Measure of Averages:
1.) Mean – The sum of the values in a data set divided by the number of values.
2.) Median – The value of that item which divides an arrayed series into equal parts.
3.) Mode – That item which occurs the most number of items.

Computations of the Measure of Averages on Ungrouped Data (raw data):
1. Mean
a.) Simple Arithmetic Mean
b.) Weighted Arithmetic Mean
(if all weighs are equal, this formula reduces to simple arithmetic mean)
nxx
wwxx

2. Median
= ____ th item where n is the number of observation.
if even number of observations: Example 1, 2, 3, 4, 5, 6 then
Md = 3rd item + 0.5 (4th item – 3rd item)
2
1
nMd
thMd 5.32
16
5.35.03
)34(5.03

The Relative Position Mean, Median Mode.
1.) Symmetric Distribution (zero skewness)• Skew – means lacking symmetry
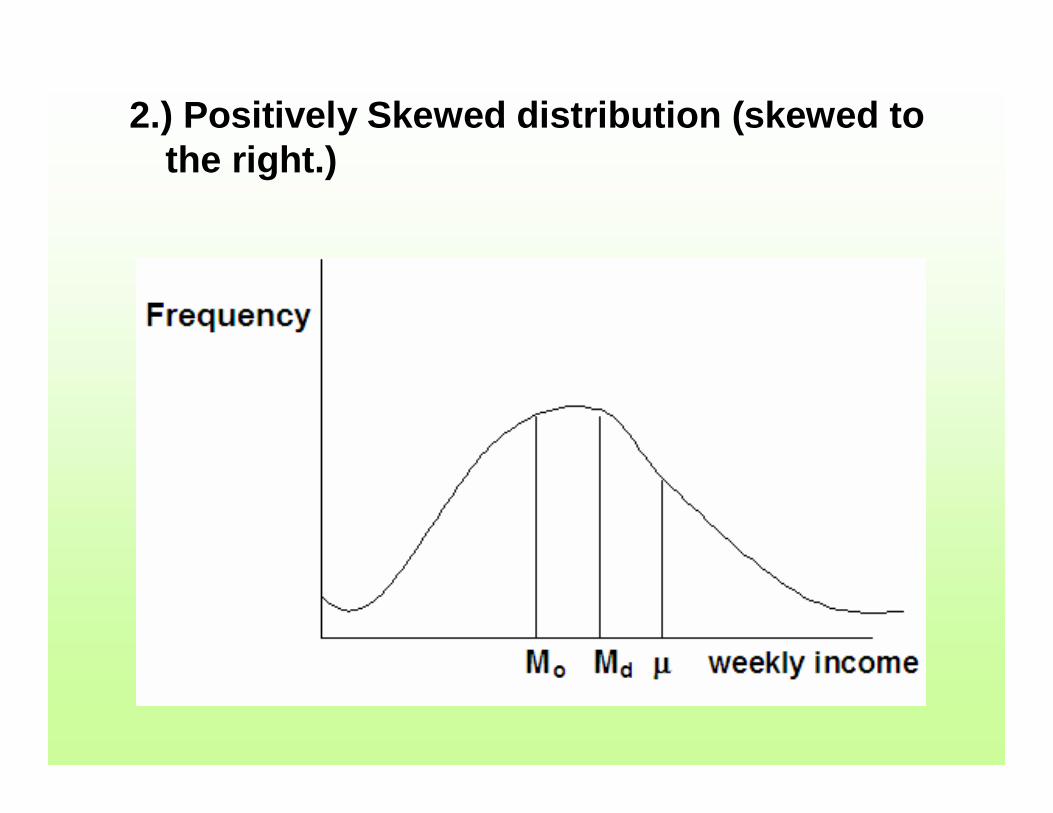
2.) Positively Skewed distribution (skewed to the right.)

3. Negatively skewed distribution. (skewed to the Left)

Examples of Measures of Location:1. For the 12 months of 1996, a police department reported 3, 2, 4, 4,
9, 7, 8, 5, 2, 3, 7 and 6 armed robberies. Find the mean, median, and mode number of robberies per month.
Solution:x987765443322
----------------x = 60
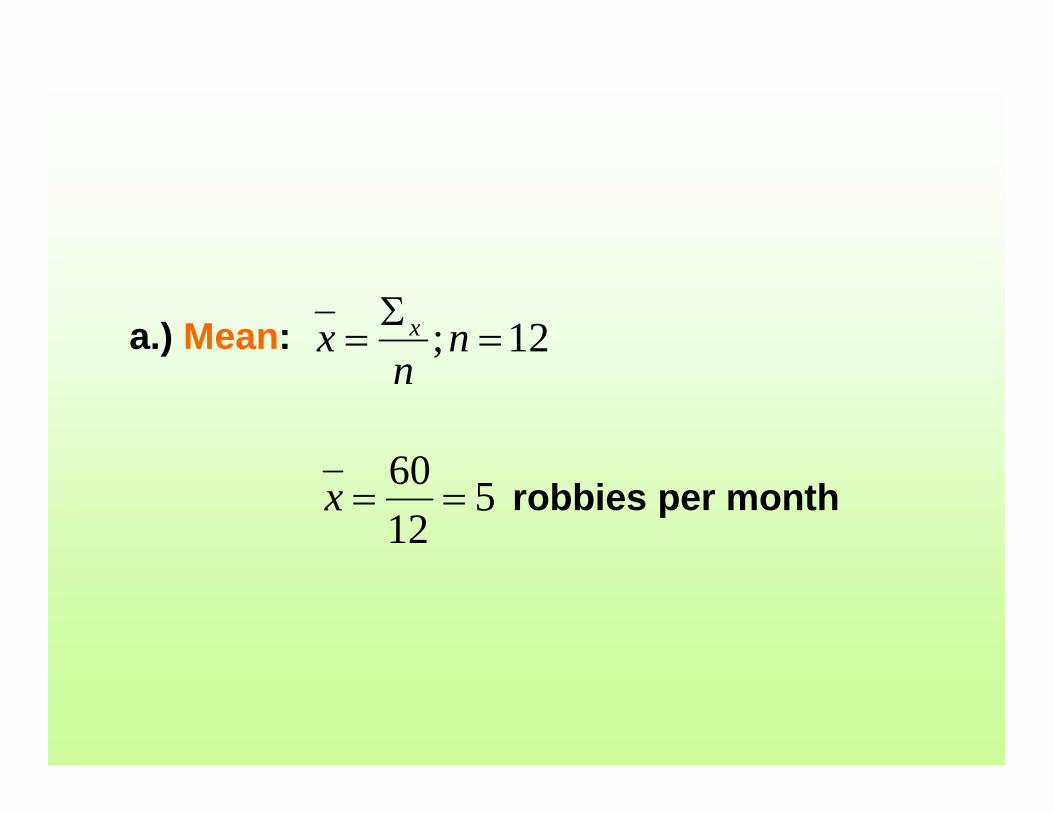
a.) Mean:
robbies per month
12;
nn
x x
51260
x
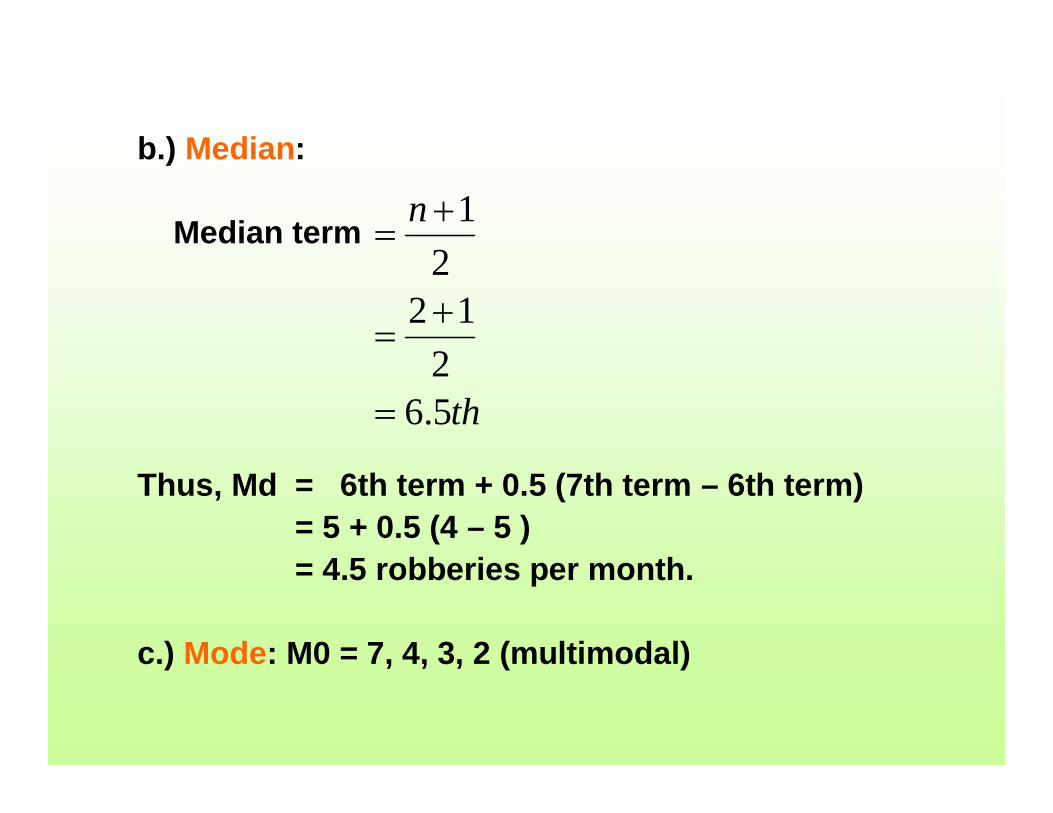
b.) Median:
Median term
Thus, Md = 6th term + 0.5 (7th term – 6th term)= 5 + 0.5 (4 – 5 )= 4.5 robberies per month.
c.) Mode: M0 = 7, 4, 3, 2 (multimodal)
th
n
5.62
122
1

2. A Capitol University student aspiring for an academic scholarship for second honor submitted his last semester’s grade as tabulated below. Will he qualify for the scholarship if the required weighted general average for second honor is 1.5 or better with no grade below 2.25 in any subjects excluding NSTP?

SUBJECT UNITS GRADEEnglish 2A 3 1.75Filipino 2 3 2.0Chemistry 4 1.25Pol. Sci. 2 3 1.0Math 117 5 1.25Soc. Sci 4 3 2.25Nat Sci 3 3 1.0

Solution: X (Grade) w (unit) wx1.75 3 5.252.0 3 6.01.25 4 5.01.0 3 3.01.25 5 6.252.25 3 6.751.0 3 3.0
________ __________W = 24 Wx = 35.25
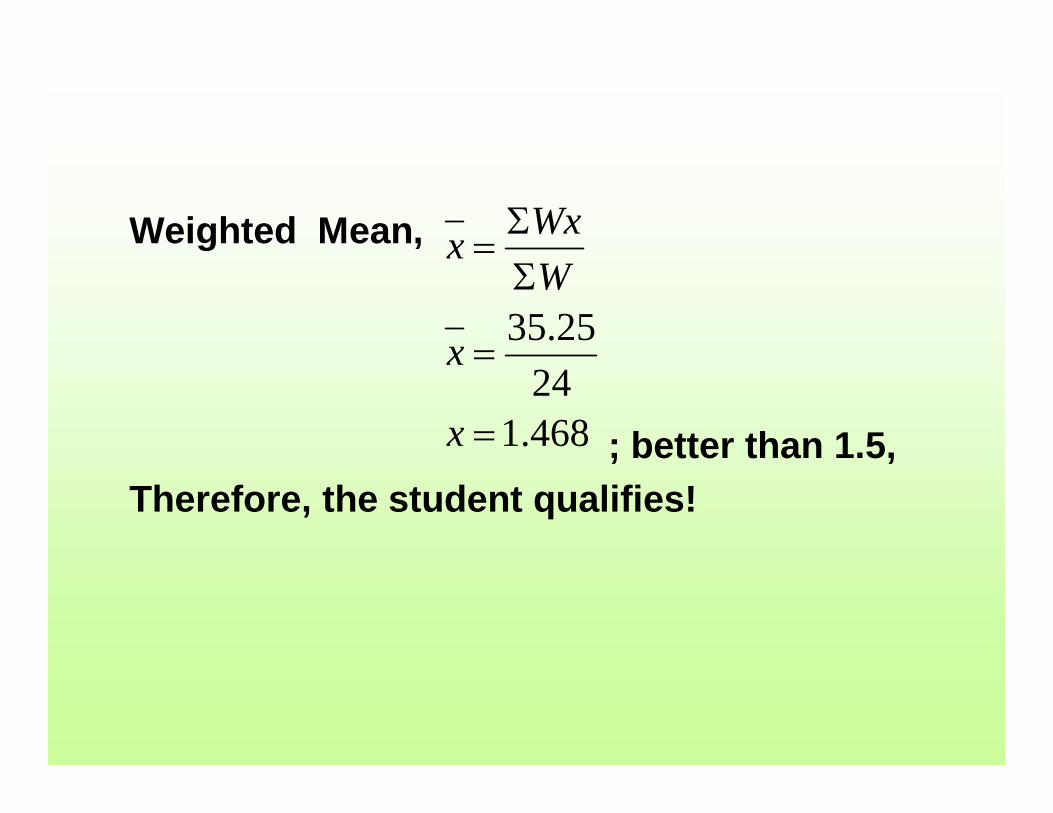
Weighted Mean,
; better than 1.5,Therefore, the student qualifies!
468.124
25.35
x
x
WWxx

The Fractiles (Extension of the Median)
Computations of the Fractile for Ungrouped Data (Raw Data)(Note: Always grouped the data in an array)
A. Quartiles. The value that marks the boundary between two consecutive intervals in a frequency distribution of four intervals with each containing one quarter of the total population,
Qi = the value of the __ th item
4
1ni

B. Deciles. Anyone of nine numbers that divide a frequency distribution into 10 classes such that each contains the same number of individuals.
Di = the value of the ___ th item
C. Percentiles. A value on a scale of one hundred that indicates the percent of a distribution that is equal to or below it.
Pi = the value of the ___th item
10
1ni
100
1ni

Example:Raw Data
15102
17683
102959
131
10
Find: 1. Q1 2. Q3 3. D7 4. D8 5. P35 6. P75

Solution:Array(n = 15) 17
1513101010998653221

termthQ
Q
niQi
44
)115(14
1
1
1
:.1 1Q,Formula
10, 1 QTherefore

4
1
niQi
4
11533
Q
termthQ 123
3, 3 QTherefore
:.2 3Q,Formula

2.1110
115710
1
7
7
D
D
niDi
Therefore, D7 = 11th term + 0.2 (12th term – 11th term
D7 = 5 + 0.2 (3 – 5)
D7 = 4.6
:.3 7D
,Formula

termthD
D
niDi
8.1210
115810
1
8
8
termthtermthtermthDTherefore 12138.012, 8
2.2328.03
8
8
DD
:.4 8D,Formula

:.5 35P 100
1,
niPFormula i
termthP
P
6.5100
11535
35
35
termthtermthtermthPTherefore 566.05, 35
10)1010(6.010
35
35
PP

:.6 75P 100
1,
niPFormula i
termthP
P
12100
11575
75
75
3, 75 PTherefore

Computations for Grouped Data (Measures of Average and Fractiles)
Measures of Averages:
A. Mean
where fi = ith frequency
k = the number of classes
i
ii
ffXX

B. Mediann/2 - Fmd – 1
Md = Lmd + c ( ------------------ )fmd
where:Lmd = lower class boundary of the class interval
where the assumed median is foundc = class interval
md –1 = “ <cf” before the median classfmd = frequency of the median class

(Note: n/2 = ____ (locate this value in the “<cf”column, thus your assumed median). If the numerical value of n/2 cannot be found in the “<cf” column, the next immediate number shall be use, thus your assumed median class.

C. Mode fmo - f1
Mo = Lmo + c ( -----------------------)2 fmo - f1 – f2
where:Lmo = lowest class boundary of the class
interval with the highest frequency c = class size
fmo = frequency of the modal classf1 = frequency above the modal class
f2 = frequency below the modal class
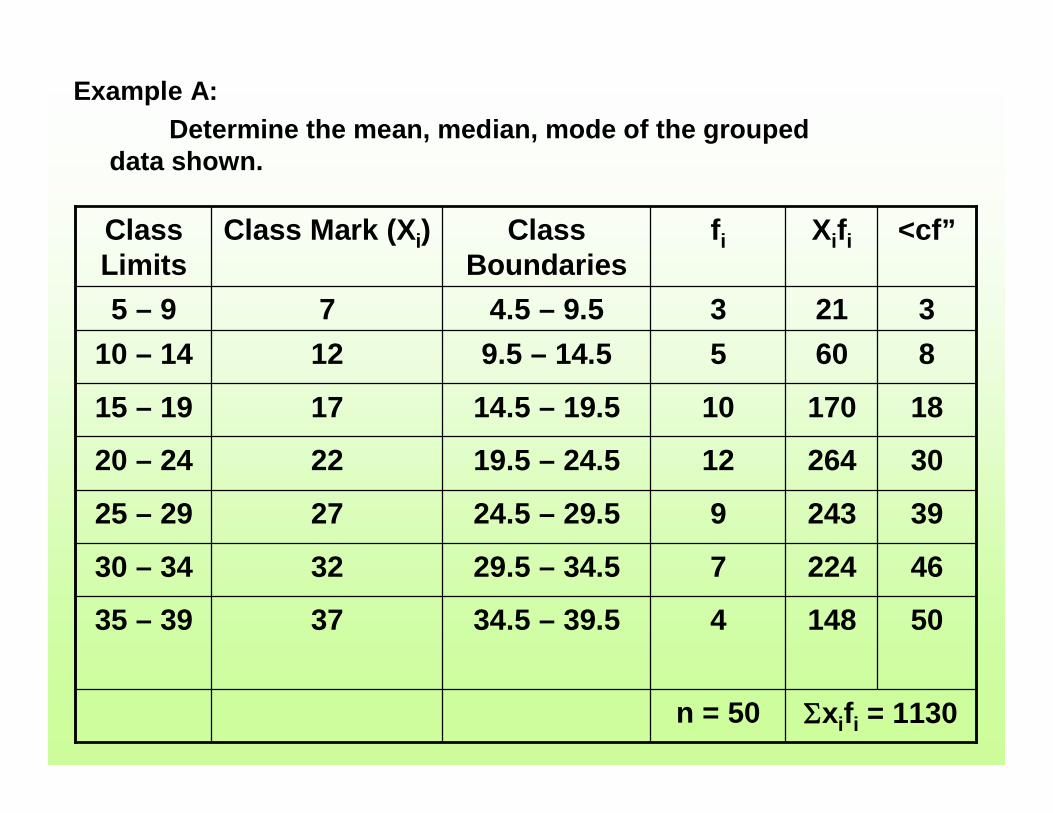
Example A:Determine the mean, median, mode of the grouped
data shown.
xifi = 1130n = 50
50148434.5 – 39.53735 – 39
46224729.5 – 34.53230 – 34
39243924.5 – 29.52725 – 29
302641219.5 – 24.52220 – 24
181701014.5 – 19.51715 – 19
86059.5 – 14.51210 – 1432134.5 – 9.575 – 9
<cf”XififiClass Boundaries
Class Mark (Xi)Class Limits

Solutions to the given example: Xi fi 1130
a) Mean X = ---------------- = ----------- = 22.6fi 50
n/2 – Fmd – 1 b) Median Md = Lmd + c ------------------
fmd
To solve for the assumed median class:
n/2 = 50/2 = 25 locate this value in the “<cf” column, hence the 4th class which gives;
Lmd = 19.5; fmd = 12; Fmd – 1 = 18; c = 5
25 – 18 Thus: Md = 19.5 + 5 ( --------------) = 22.42
12
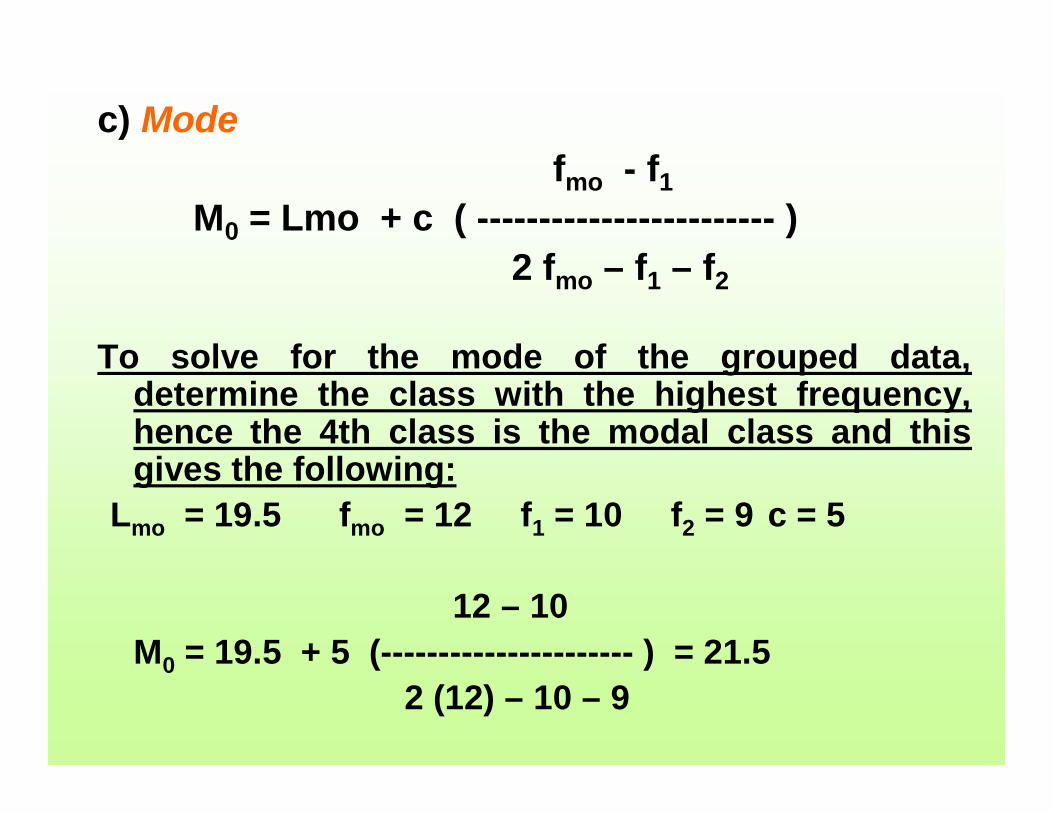
c) Modefmo - f1
M0 = Lmo + c ( ------------------------ )2 fmo – f1 – f2
To solve for the mode of the grouped data, determine the class with the highest frequency, hence the 4th class is the modal class and this gives the following:
Lmo = 19.5 fmo = 12 f1 = 10 f2 = 9 c = 5
12 – 10 M0 = 19.5 + 5 (---------------------- ) = 21.5
2 (12) – 10 – 9

The FRACTILES (Quartiles, Deciles, Percentiles) for Grouped Data:1. Quartiles
in/4 – Fqi – 1 Qi = Lqi + c ( -------------------)
fqi2. Deciles
in/10 - Fdi – 1 Di = Ldi + c ( --------------------)
fdi3. Percentiles
in/100 - Fpi – 1 Pi = Lpi + c ( --------------------)
fpi

where: c = class intervalL = lower class boundariesn = number of
observationsfqi, fdi, fpi = frequency of the Qi, Di, Pi classes respectively.
Fpi – 1, Fdi – 1, Fpi – 1 = “<cf” of the class before the Qi, Di, Pi classes respectively.
Example B:From Example A, frequency distribution Solve for Q1, D4, D75

Solutions to Example B:
To solve for Qi:in /4 – Fqi - 1
Qi = Lqi + c ( ---------------------)fqi
in 1(50)------- = --------- = 12.5 then locate this value in the “<cf”
4 4
column, hence the third class, which givesLq1 = 14.5; fq1 = 10; fq1 – 1 = 8; c = 5
12.5 – 8 Thus: Q1 = 14.5 + 5 ( -----------------)
10Q1 = 16.75

To solve for D4 :
n /10 – Fdi – 1 Di = Ldi + c ( -------------------)
fdiin 4 (50)
= --------- --------- = 20 then locate this value in the “<cf”10 10
column, hence the 4th class, which gives
Ld4 = 19.5; fd4 = 12; Fd4 – 1 = 18; c = 5 20 – 18
D4 = 19.5 + 5 ( ----------------)12
D4 = 20.33

To solve for P75 :in/100 – Fpi – 1
Pi = Lpi + c ( ----------------------)fpi
in 75 (50)------ = ---------- = 37.5 then locate this value in the “<cf”
10 100
column, hence the 5th class, which gives Lp75 = 24.5; fp75 = 9; Fp75 – 1 = 30; c = 5
thus;37.5 – 30
P75 = 24.5 + 5 ( ----------------)9
P75 = 28.67