the third lecturefac.ksu.edu.sa/sites/default/files/lecture3-442_opt.pdfthe third lecture we will...
TRANSCRIPT

The Third lecture
We will examine in this lecture:
•Mean
•Weighted Mean
•Median
•Mode
•Fractiles (Quartiles-Deciles-Percentiles)
Measures of Central Tendency
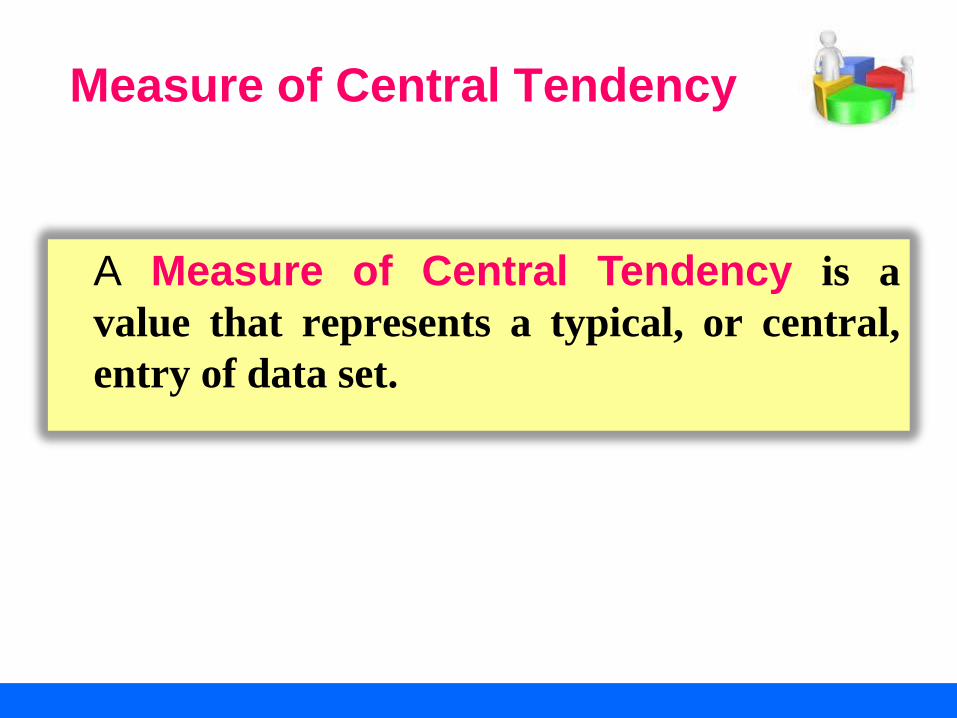
Measure of Central Tendency
A Measure of Central Tendency is a
value that represents a typical, or central,
entry of data set.

The three most commonly used
of central tendency
•Mean
•Median
•mode
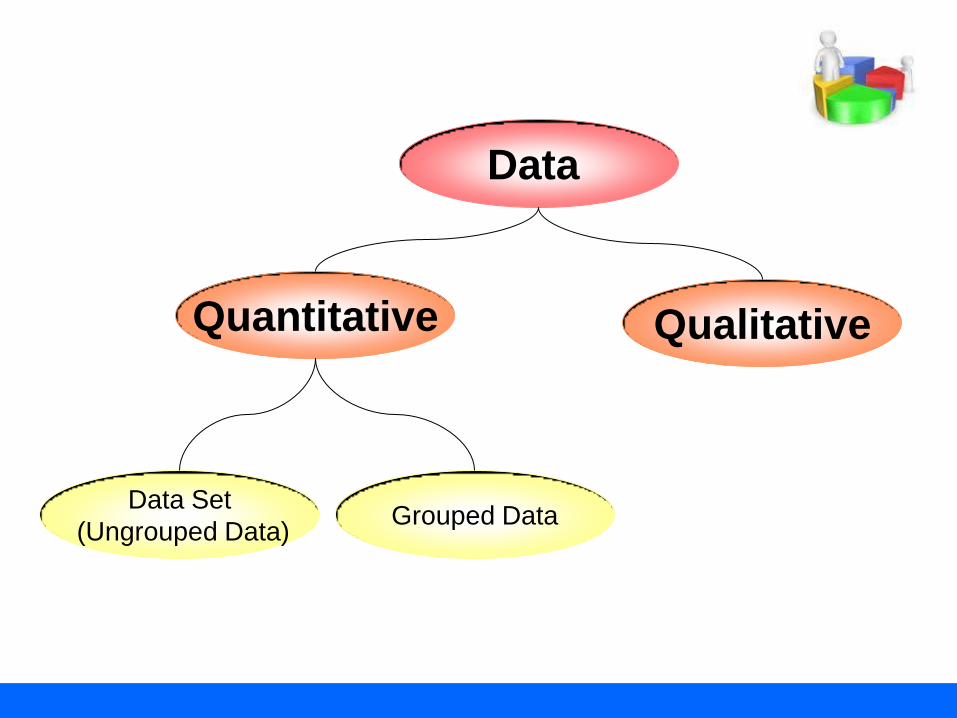
Data
Qualitative Quantitative
Grouped Data
Data Set
(Ungrouped Data)


The Mean of Ungrouped Data
n
x
x
n
i
i 1
The Mean of a data set is the
sum of the data entries divided by the
numbers of entries.
nxxx ,...,, 21
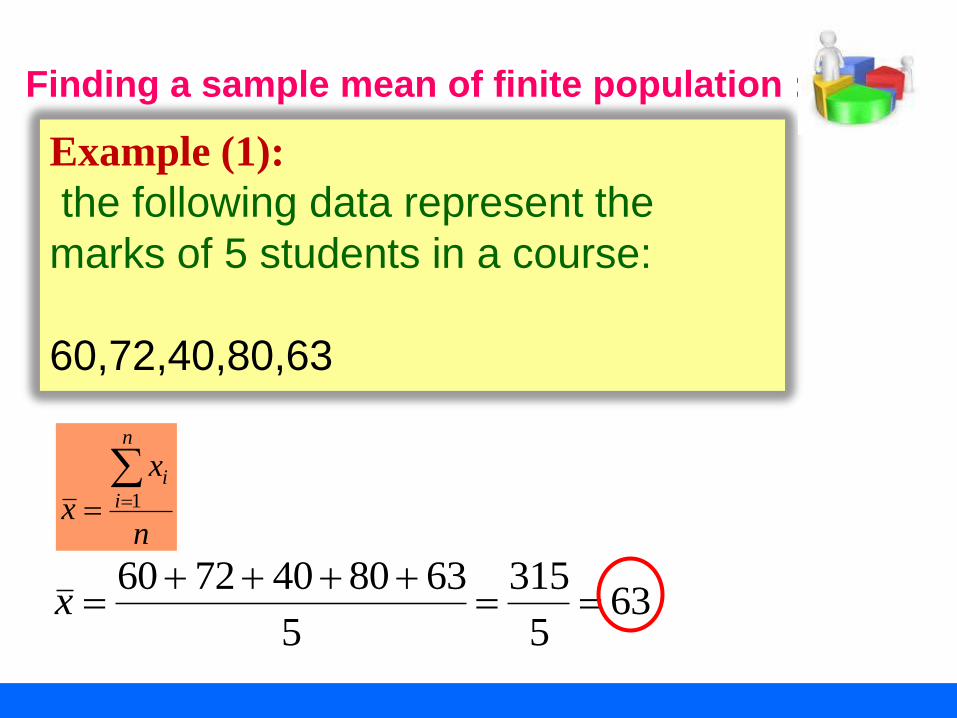
Finding a sample mean of finite population :
n
x
x
n
i
i 1
635
315
5
6380407260
x
Example (1):
the following data represent the
marks of 5 students in a course:
60,72,40,80,63
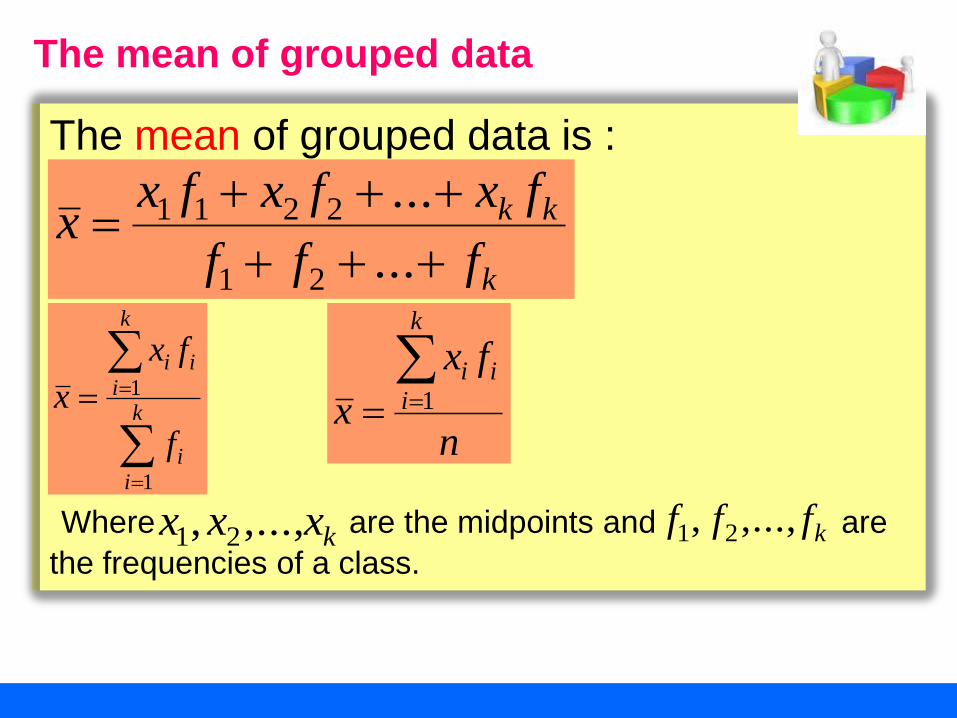
The mean of grouped data is :
Where are the midpoints and are
the frequencies of a class. kxxx ,...,, 21 kfff ,...,, 21
The mean of grouped data is :
Where are the midpoints and are
the frequencies of a class. kxxx ,...,, 21 kfff ,...,, 21
The mean of grouped data
k
i
i
k
i
ii
f
fx
x
1
1
k
kk
fff
fxfxfxx
...
...
21
2211
n
fx
x
k
i
ii 1
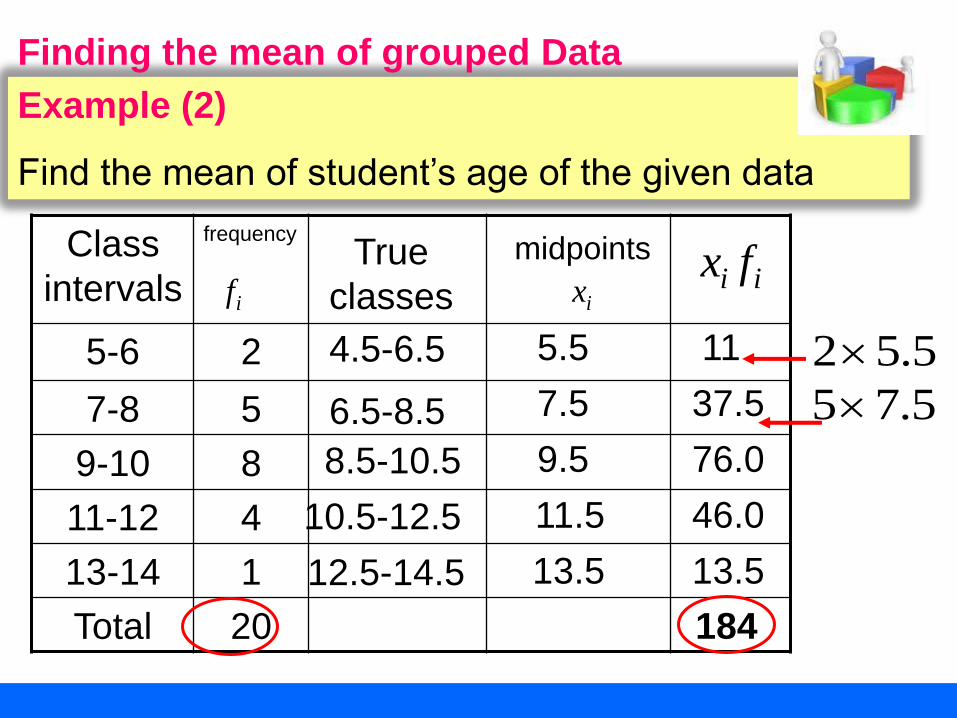
Example (2)
Find the mean of student’s age of the given data
frequency Class
intervals
2 5-6
5 7-8
8 9-10
4 11-12
1 13-14
20 Total
if ix
midpoints True
classes
4.5-6.5
6.5-8.5
8.5-10.5
10.5-12.5
12.5-14.5
5.5
7.5
11.5
13.5
9.5
ii fx
11
37.5
76.0
46.0
13.5
5.52
5.75
184
Finding the mean of grouped Data
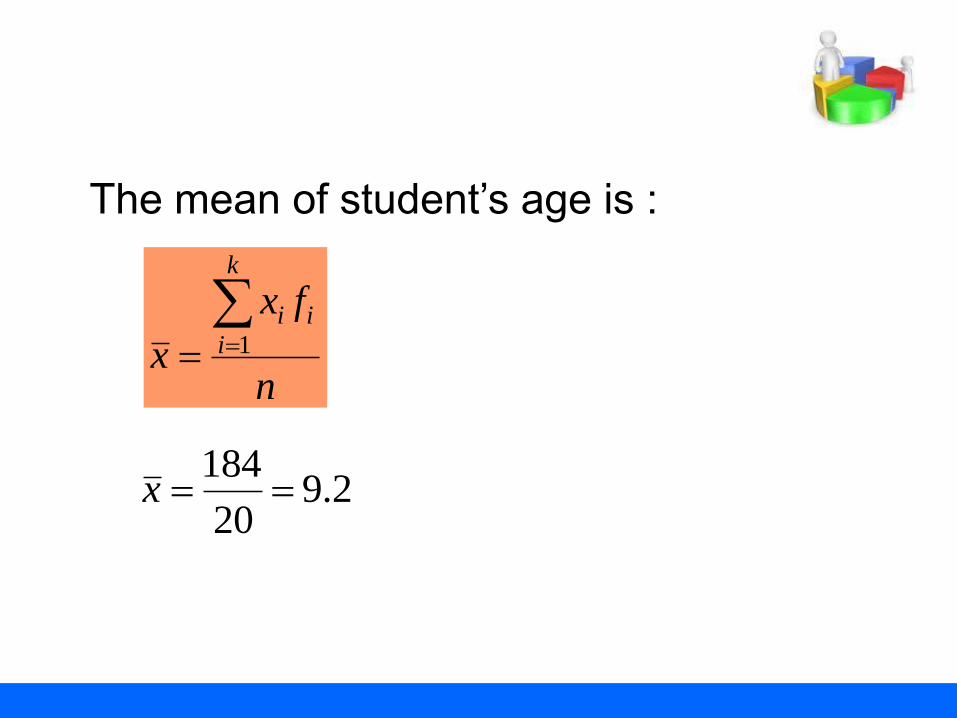
n
fx
x
k
i
ii 1
2.920
184x
The mean of student’s age is :
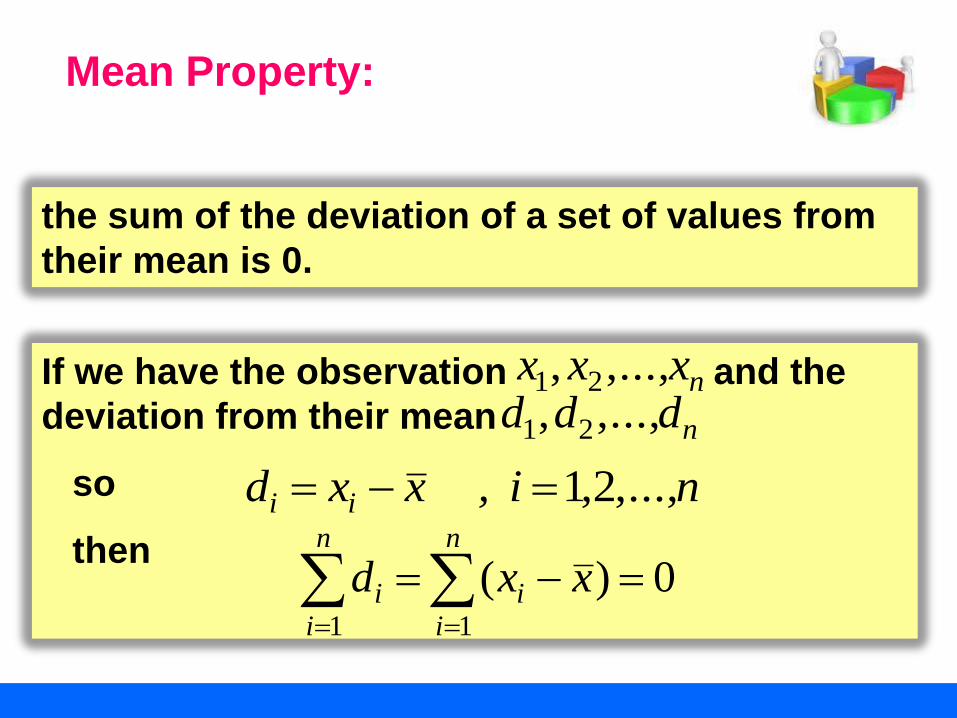
Mean Property:
the sum of the deviation of a set of values from
their mean is 0.
If we have the observation and the
deviation from their mean
so
then
nxxx ,...,, 21
nddd ,...,, 21
ni ,xxd ii ,...,2,1
n
i
i
n
i
i xxd11
0)(

Example (3):
the following data represent the
marks of 5 students in a course:
60,72,40,80,63, and the mean
63x
60
72
40
80
63
Total
ix xxd ii
-3
-23
17
0
0
9

1.For a given set of data there is one
and only one mean(uniqueness) .
2.It takes every entry into account.
3.It is easy to understand and to
compute.
Some advantage of using the mean:
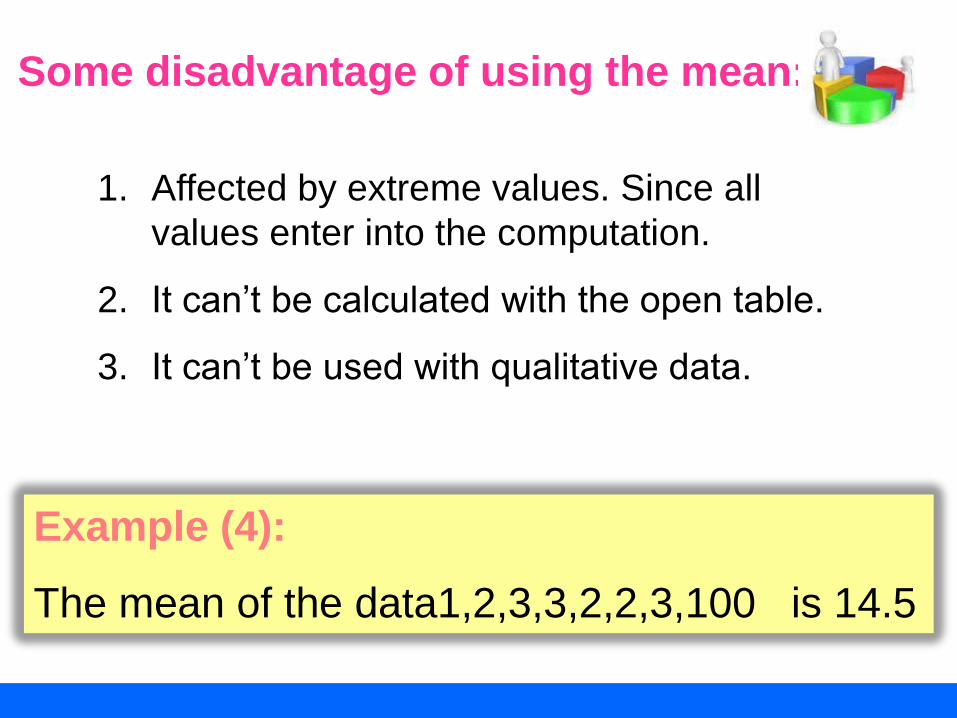
Some disadvantage of using the mean:
1. Affected by extreme values. Since all
values enter into the computation.
2. It can’t be calculated with the open table.
3. It can’t be used with qualitative data.
Example (4):
The mean of the data1,2,3,3,2,2,3,100 is 14.5
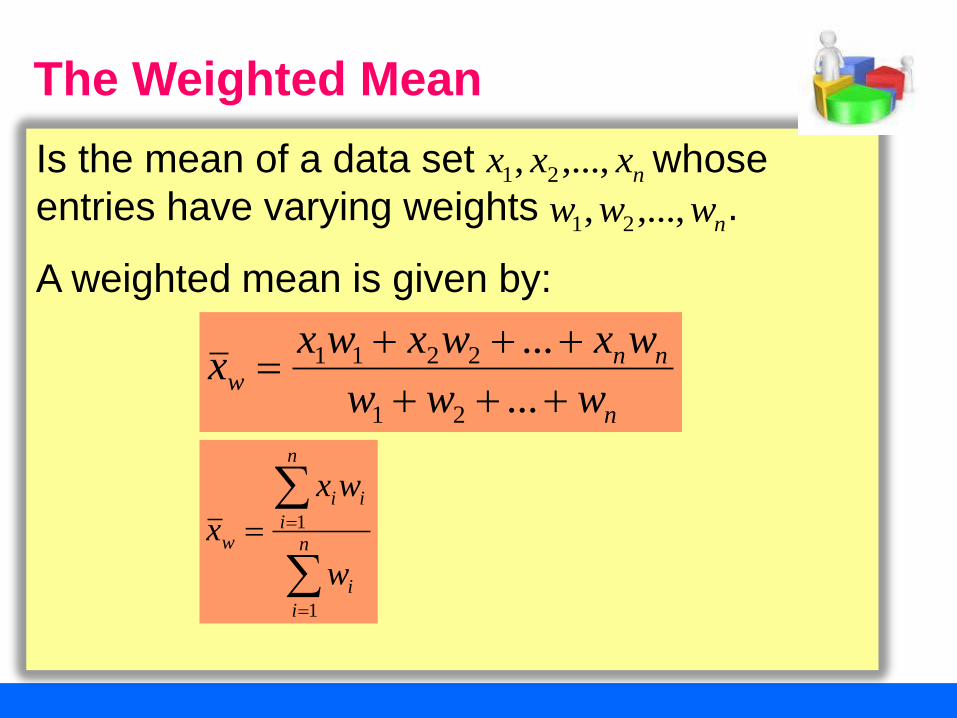
Is the mean of a data set whose
entries have varying weights .
A weighted mean is given by:
nxxx ,...,, 21
nwww ,...,, 21
n
nnw
www
wxwxwxx
...
...
21
2211
n
i
i
n
i
ii
w
w
wx
x
1
1
The Weighted Mean

Example (5)
Find the weighted mean of student’s
marks in three curses if we have the
marks 40,70,65 and the study hours for
these curses are 2,3,4 respectively.
wx
n
i
i
n
i
ii
w
w
wx
x
1
1
11.619
550
432
465370240
wx


The median:
The median of a data set is the
value that lies in the middle of the data
when the data set is ordered.

The median of a data set:
Data
Odd number Even number
The median is the mean
Of the two middle data
entries
The median is the
Middle data entry

Example (6)
Find the median of the student’s marks
60,72,40,80,63 :
First order the data
40,60,63,72,80
The median
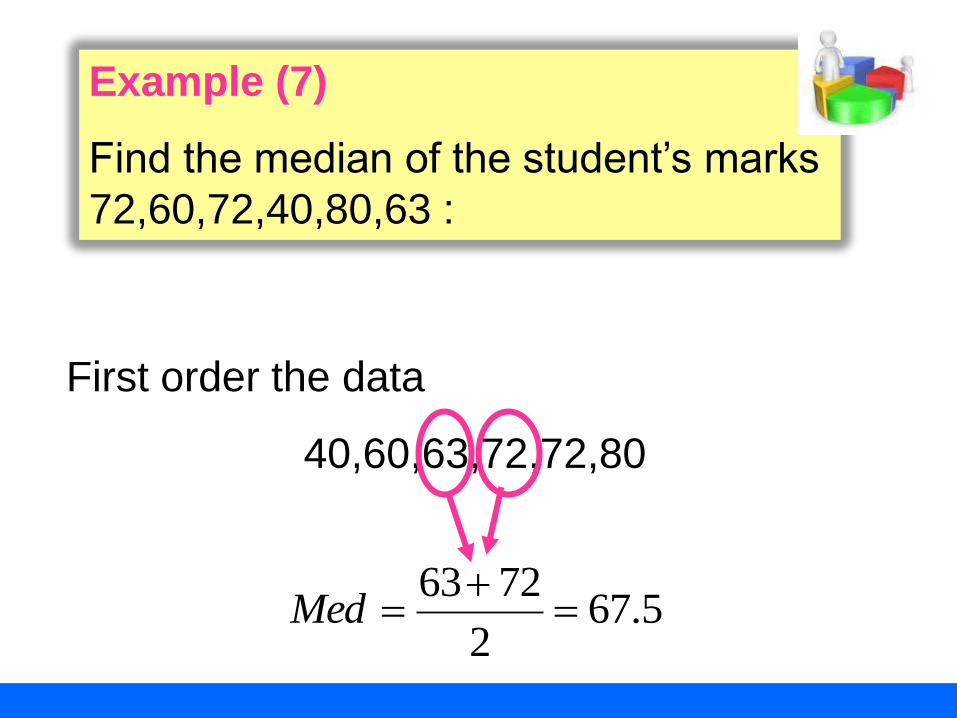
Example (7)
Find the median of the student’s marks
72,60,72,40,80,63 :
First order the data
40,60,63,72,72,80
5.672
7263
Med

1. Don’t affected by the extreme values.
2. It can be calculated with the open
table.
3. It can be used with qualitative data.
Example (8):
Find the median of A,A,B,C,D
Med
Some advantage of using the median:

1.It don’t takes every entry into account.
2. It is not easy to use in statistical
analyses.
Some disadvantage of using the median:
The mode
The mode of a data set is the data
entry that occurs with the greatest
frequency.

Finding the mode of a data set
Example (9)
Find the mode of the given data:
2,6,9,4,6,10,6
6Mod

Example (10)
Find the mode of the given data:
4,2,7,4,7,10,7
7Mod
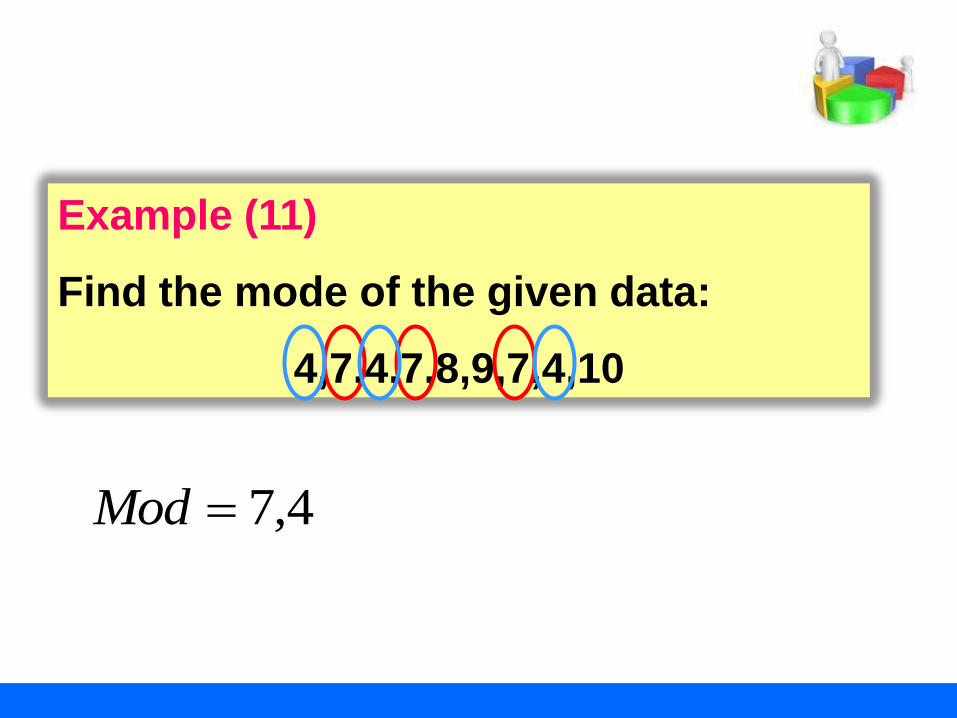
Example (11)
Find the mode of the given data:
4,7,4,7,8,9,7,4,10
4,7Mod

Example (12)
Find the mode of the given data:
4,9,8,12,11,7,15
There is no mode

Example (13)
Find the mode of the given data:
4,4,5,5,6,6,7,7
There is no mode

1. Don’t affected by the extreme values.
2. It can be calculated with the open frequencies
table.
3. It can be used with qualitative data.
4. It is easy measurement.
Example (14):
find the mode A,A,B,C,D
AMod
Some advantage of using the mode:

1.It don’t takes every entry into account.
2.In such cases, the mode may not exist
or may not be very meaningful.
3.Some data have no mode.
Some disadvantage of using the mode:

Set of data may have:
• one mode
• more than one mode (bimodal)
• no mode

-1
0
1
2
3
4
5
6
0 1 2 3
-1
0
1
2
3
4
5
6
0 1 2 3
0
1
2
3
4
5
6
0 1 2 3
One mode
bimodal No mode
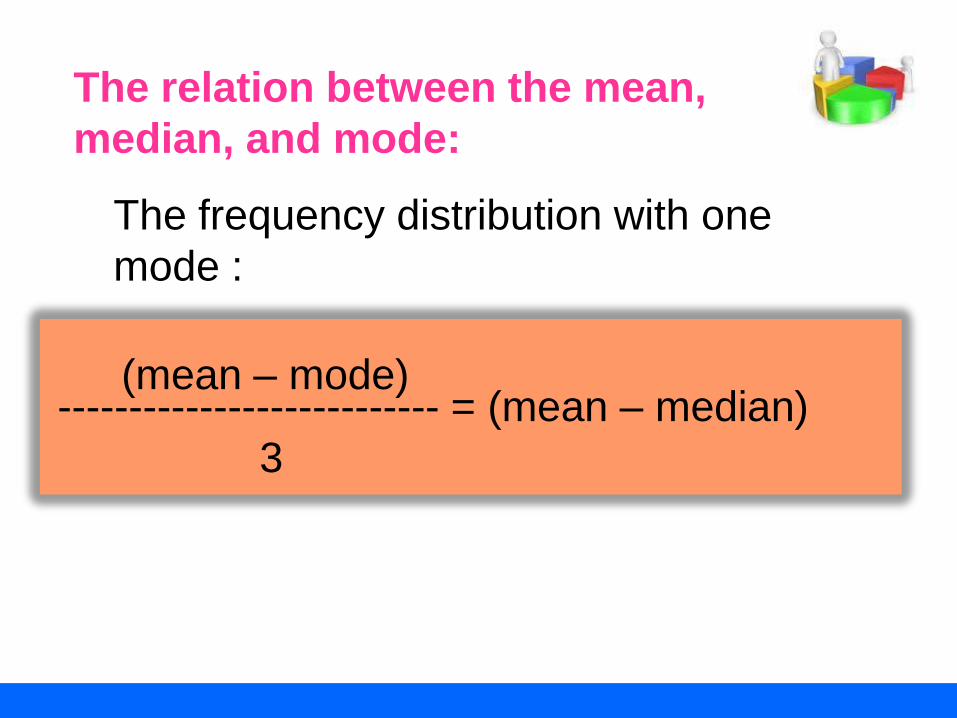
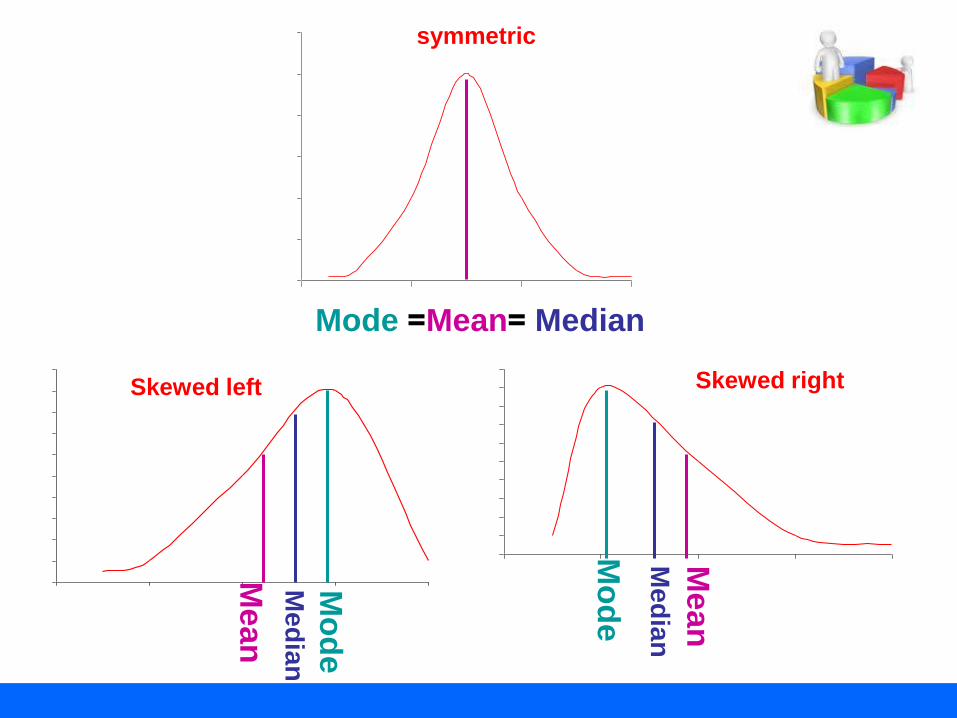
The relation between the mean,
median, and mode:
The frequency distribution with one
mode :
(mean – mode) --------------------------- = (mean – median)
3
0
1
2
3
4
5
6
0 1 2 3
Median =Mean= Mode
0
1
2
3
4
5
6
7
8
9
10
0 0.5 1 1.5 2
0
1
2
3
4
5
6
7
8
9
10
0 0.5 1 1.5 2
Mean
Med
ian
Mo
de
Me
an
Me
dia
n M
od
e
symmetric
Skewed left Skewed right

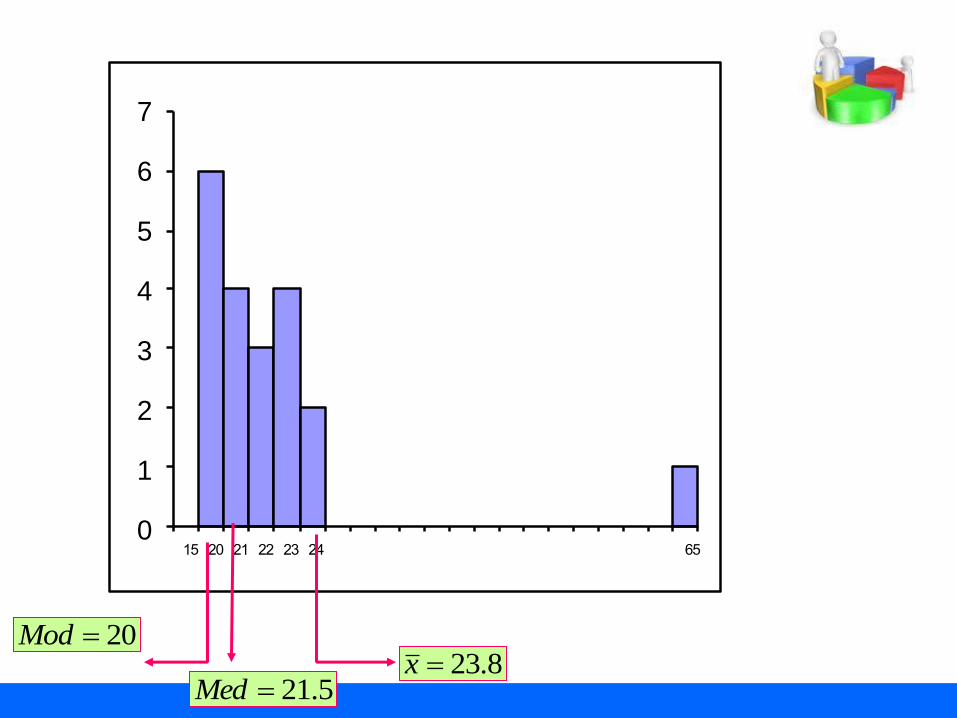
Example (15):
Find the mean, median, and the mode of these
data , Determine which measure of central
tendency is the best to represent the data?
21 20 20 20 20 20 20
23 22 22 22 21 21 21
65 24 24 23 23 23
The mean:
n
x
x i
i
20
1 8.2320
475

21 20 20 20 20 20 20
23 22 22 22 21 21 21
65 24 24 23 23 23
Median 5.212
2221
Med
Sort the data from lowest to highest values
Mode 20Mod
Mean 8.23x
0
1
2
3
4
5
6
7
20Mod8.23x
5.21Med

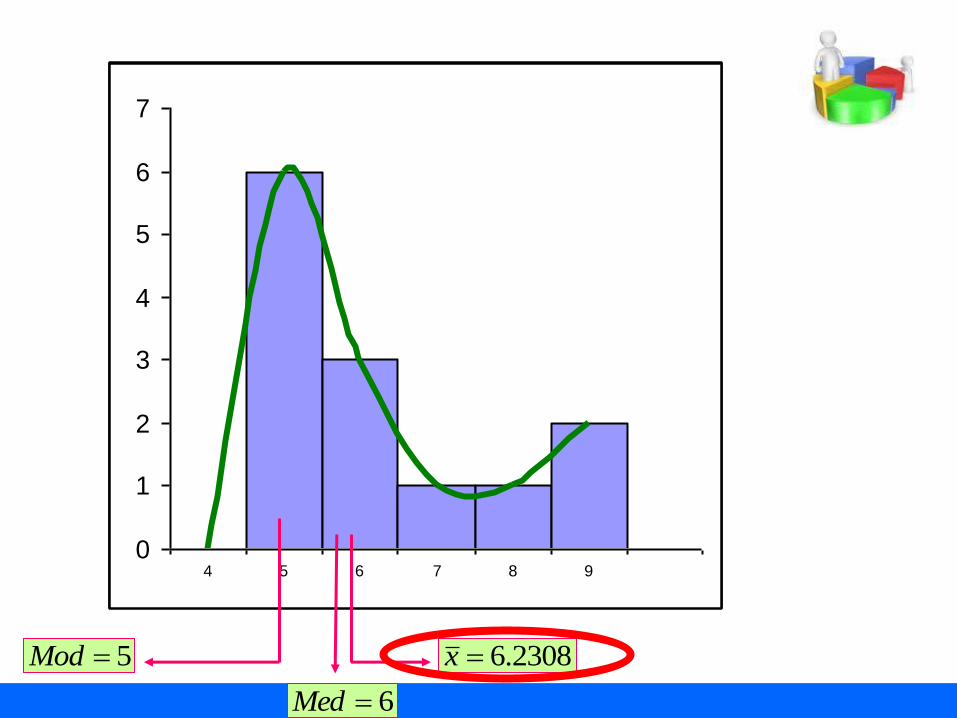
Example (16):
1. Find the mean, median, and mode of these
data, if possible. If not explain why?
2. Determine which measure of central
tendency is the best to represent the data
6, 6, 9, 9, 6, 5, 5, 5, 7, 5, 5, 5, 8
The mean n
x
x i
i
20
1 2308.613
81

Median 6Med
Sort the data from lowest to highest values
Mode 5Mod
Mean 2308.6x
5, 5, 5, 5, 5, 5, 6, 6, 6, 7, 8, 9, 9
0
1
2
3
4
5
6
7
4 5 6 7 8 9
5Mod
0
1
2
3
4
5
6
7
4 5 6 7 8 9
2308.6x
6Med
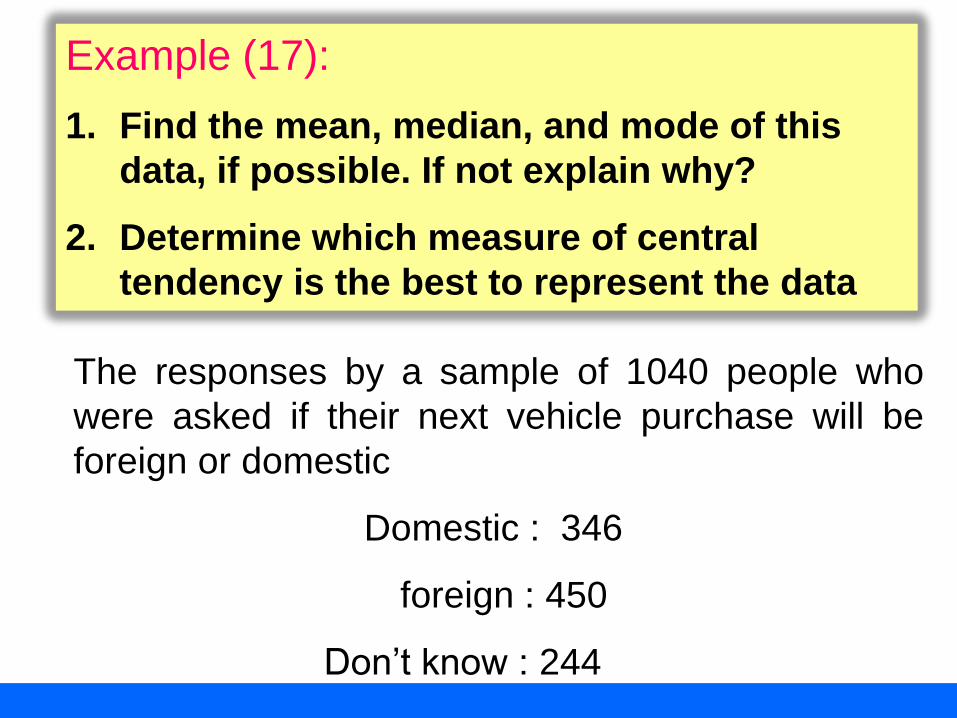
Example (17):
1. Find the mean, median, and mode of this
data, if possible. If not explain why?
2. Determine which measure of central
tendency is the best to represent the data
The responses by a sample of 1040 people who
were asked if their next vehicle purchase will be
foreign or domestic
Domestic : 346
foreign : 450
Don’t know : 244

Median
Mode Mod foreign
Mean It can’t be find because the data are
qualitative.
It can’t be find because the data are not
ordered
Domestic : 346
foreign : 450
Don’t know : 244
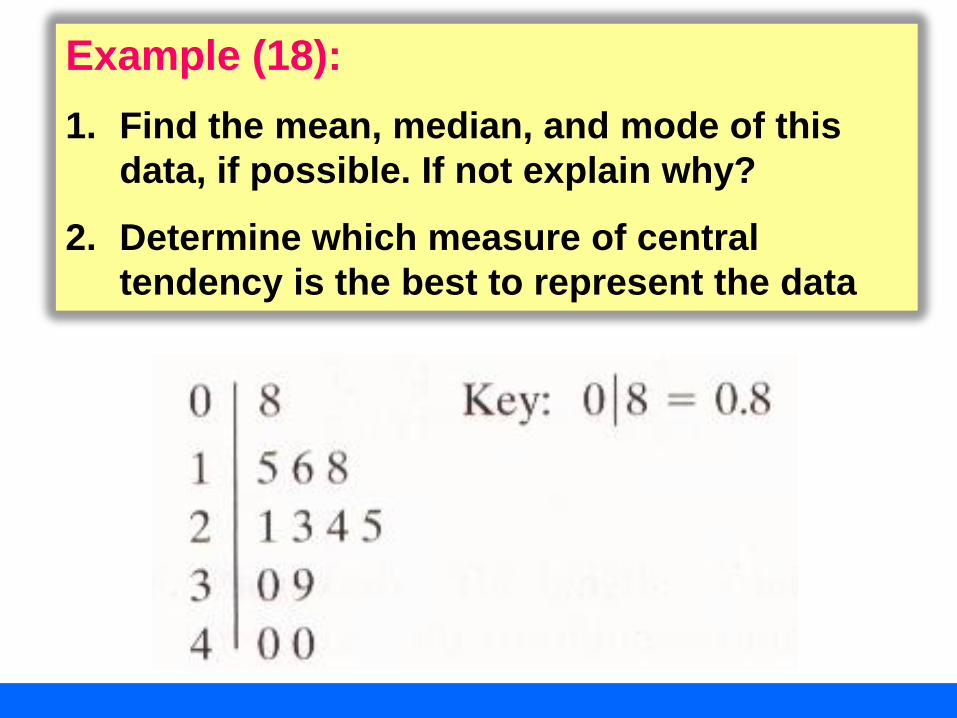
Example (18):
1. Find the mean, median, and mode of this
data, if possible. If not explain why?
2. Determine which measure of central
tendency is the best to represent the data

Mean n
x
x i
i
12
1
4917.212
9.29
12
449.335.24.23.21.28.16.15.18.0
Median 35.22
4.23.2
Med
Mode 4Mod
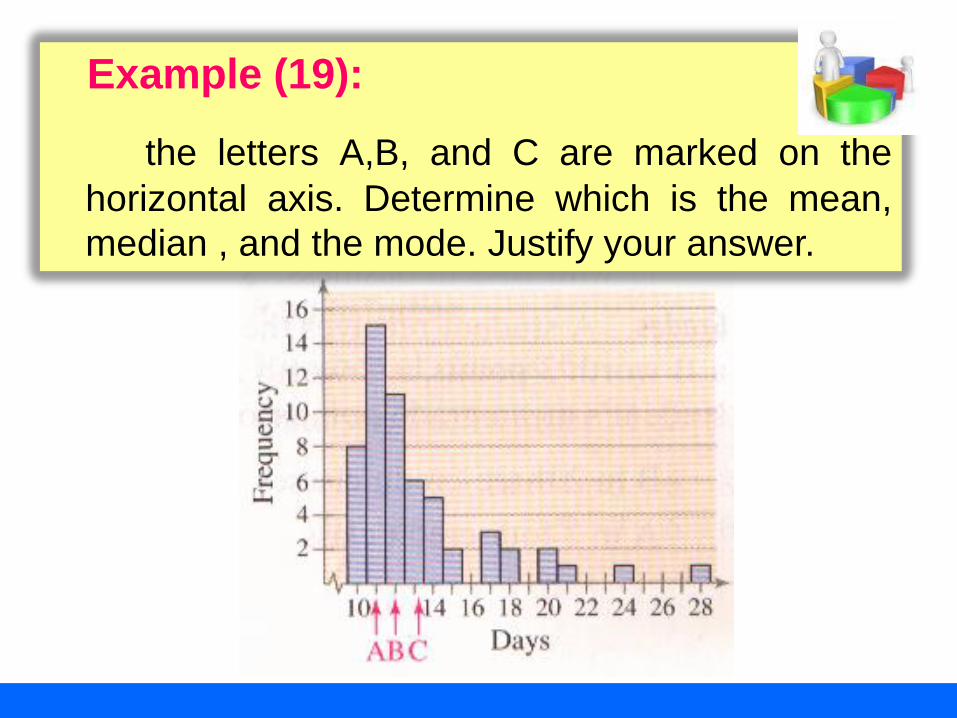
Example (19):
the letters A,B, and C are marked on the
horizontal axis. Determine which is the mean,
median , and the mode. Justify your answer.
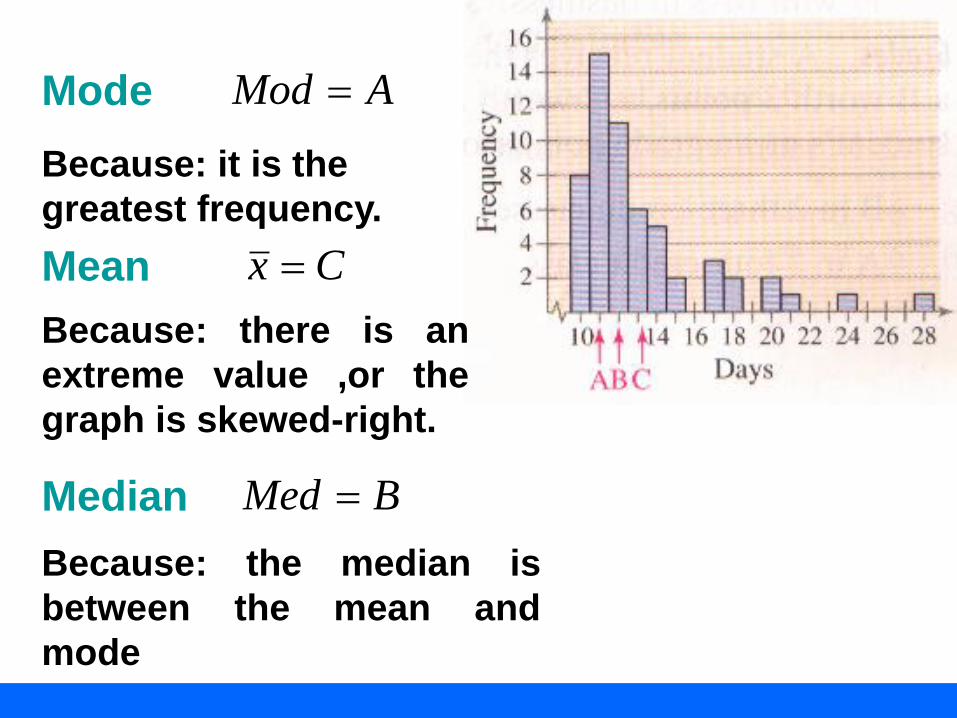
Mode AMod
Because: it is the
greatest frequency.
Mean Cx
Because: there is an
extreme value ,or the
graph is skewed-right.
Median BMed
Because: the median is
between the mean and
mode
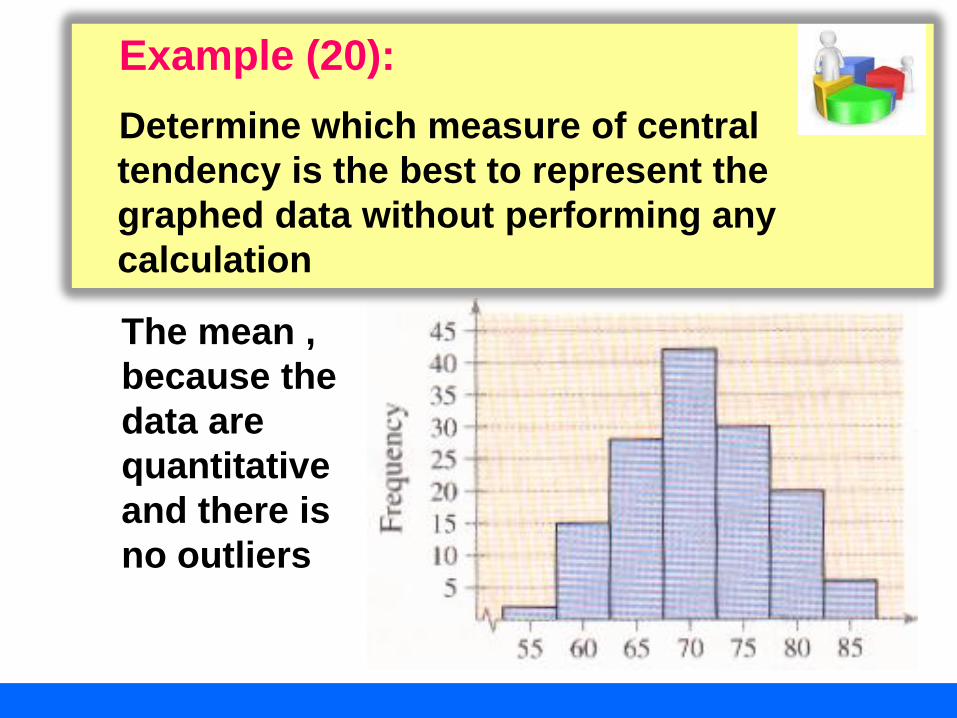
Example (20):
Determine which measure of central
tendency is the best to represent the
graphed data without performing any
calculation
The mean ,
because the
data are
quantitative
and there is
no outliers
Fractiles are numbers that
partition, or divide, an ordered data
set into equal parts like Quartiles,
Deciles and Percentiles.
Fractiles:
Example:
The median is a fractile because it
divides an ordered data set into two
equal parts.

Quartiles are numbers that
divide a data set into 4 equal parts.
Quartiles symbolized by Q1, Q2and Q3
Quartiles:
Q1 Q2 Q3

Example (21):
Find Q1, Q2and Q3 for the data set
13, 18, 17, 15, 14, 7, 10, 11, 5, 18, 16
Solution:
Arrange the data in order.
5 7 10 11 13 14 15 16 17 18 18
Find the median.
5 7 10 11 13 14 15 16 17 18 18
Q2 Q3 Q1
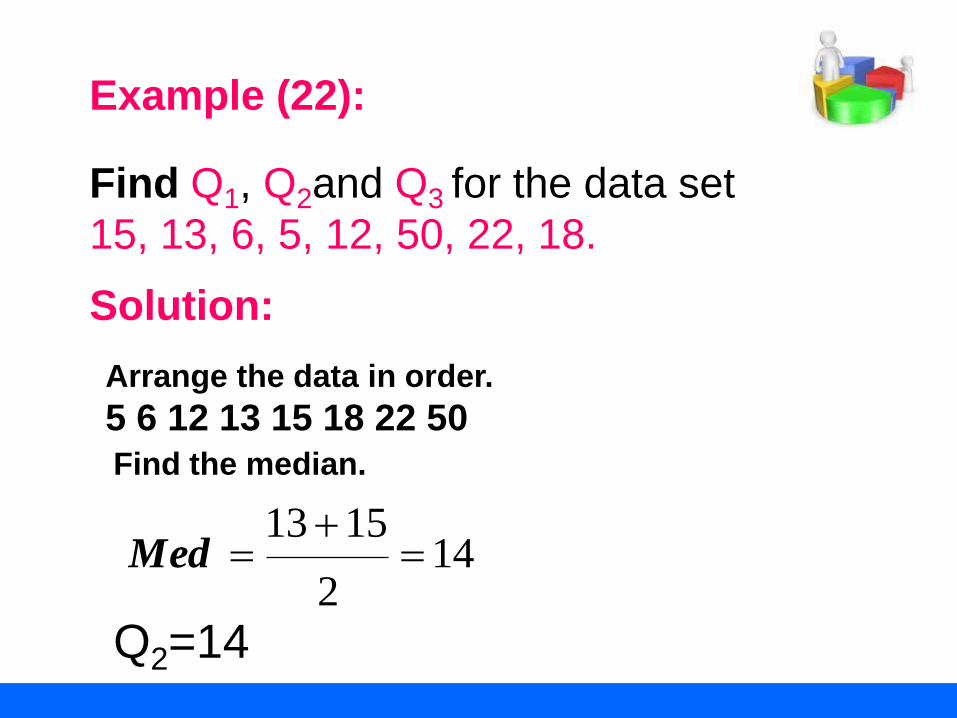
Example (22):
Find Q1, Q2and Q3 for the data set
15, 13, 6, 5, 12, 50, 22, 18.
Solution:
Arrange the data in order.
5 6 12 13 15 18 22 50
Find the median.
13 15
142
Med
Q2=14
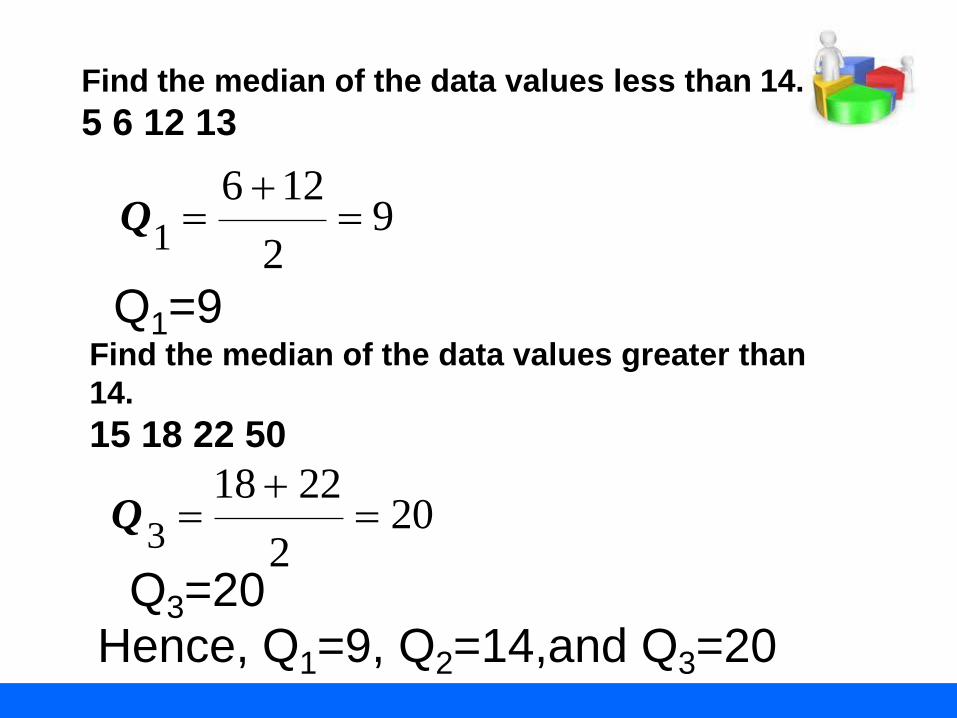
Find the median of the data values less than 14.
5 6 12 13
1
6 129
2Q
Q1=9 Find the median of the data values greater than
14.
15 18 22 50
3
18 2220
2Q
Q3=20 Hence, Q1=9, Q2=14,and Q3=20
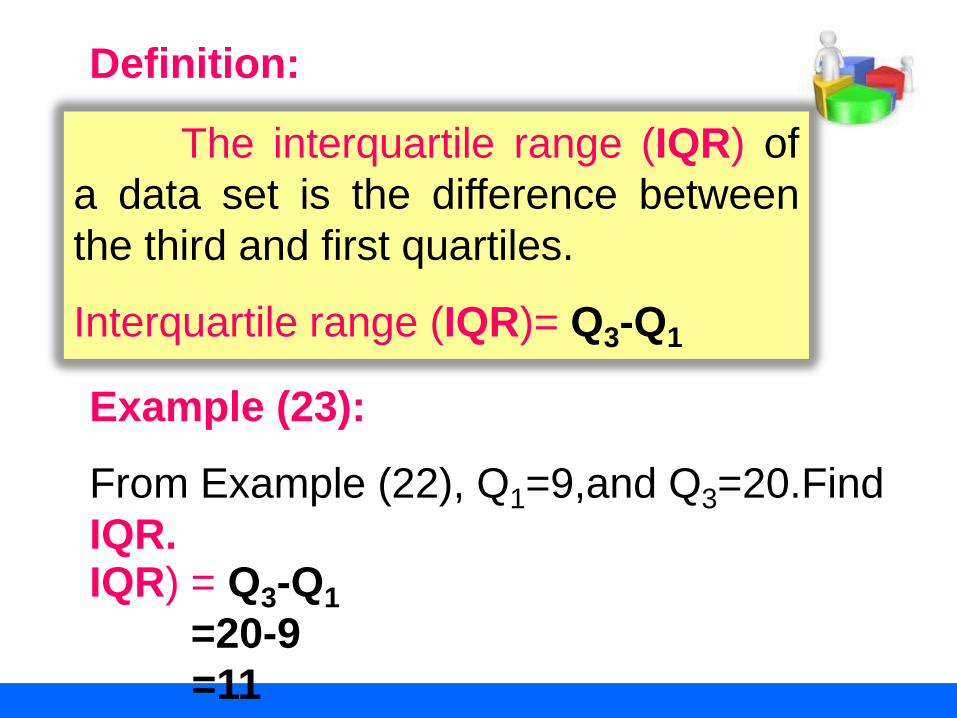
The interquartile range (IQR) of
a data set is the difference between
the third and first quartiles.
Interquartile range (IQR)= Q3-Q1
Definition:
Example (23):
From Example (22), Q1=9,and Q3=20.Find
IQR. IQR) = Q3-Q1
=20-9
=11
Deciles are numbers that divide a
data set into 10 equal parts. Quartiles
symbolized by D1, D2… D9
Deciles:
Percentiles:
Percentiles are numbers that divide
a data set into 100 equal parts.
Percentiles symbolized by P1, P2… P99

Remarks:
There are relationships among percentiles
,deciles and quartiles.
Deciles are denoted by D1, D2,…, D9 ,and they
correspond to P10, P20,…, P90 .
Quartiles are denoted by Q1, Q2, Q3 ,and they
correspond to P25, P50,…, P75 .
The median is the same as P50 or Q2 or D5.