measurements - world ozone and ultraviolet radiation...
TRANSCRIPT

WORLD METEOROLOGICAL ORGANIZATION
GLOBAL ATMOSPHERE WATCHWMO Global Ozone Research and Monitoring Project
Report No. 30
SECOND WMO CONSULTATION ON OZONE
BY
BREWER SPECTROPHOTOMETERCharlottesville, Virginia, 1-3 June 1992
MEASUREMENTS
C. T. McElroy, Editor

WMO CONSULTATION ON BREWER
OPERATION,
Report on the WMO Meeting on Brewer Ozone Spectrophotometer Operation,Calibration and Data Reporting
Edited by:
Organized by:
Chairperson:
OZONESPECTROPHOTOMETER
CALmRA TION AND DATA REPORTING
University of Virginia, CharlottesvilleJune 1-3, 1992
C.T. McElroy
R. Bojkov, J. Staehelin, J.B. Kerr, and C.T. McElroy
J.B. Kerr

The WMO Global Ozone Monitoring and Research Project was establishedin the mid-1970's to enable WMO to provide advice to Members, to the UnitedNations and to other organizations on: 1) the extent to which man-made pollutants,especially CFC's and nitrogen oxides might be responsible for stratospheric ozonereduction, 2) the possible impact of ozone changes on climate and the UV-Breaching the Earth's surface and 3) maintaining the basis for the long-ternmonitoring of trends.
Since the International Geophysical Year (IGY), WMO has had in existencethe Global Ozone Observing System (GO3OS) which is now part of the WMOGlobal Atmosphere Watch (GA W). While the system was originally instrumentedwith Dobson Ozone Spectrophotometers, there are now a large number (about 80)of Brewer Ozone Spectrophotometers in service. These instruments represent asignificant new resource for acquiring accurate ozone data over a wide geographicalarea. In the past, the coordination of intercomparisons of Dobson instruments hasalways been a priority task among the internationally coordinated activities withinthe GO3OS. In collaboration with the International Ozone Commission of IAMAP,the WMO has coordinated the exchange of data, scientific and technicalinfonnation, and facilitated calibration trips for the maintenance of calibrationstandards for the GO3OS.
As part of these efforts of WMO and the Ozone Commission, a regularprogram of Brewer Users' meetings was started with the first meeting in Arosa,Switzerland in 1990. This report contains a record of the discussions related toozone measurement which were conducted at the second bi-annual WMOConsultation on Brewer Ozone Spectrophotometer Operation, Calibration and DataReporting held at the University of Virginia in Charlottesville, Virginia in 1992.
With the rapid growth in the numbers of Brewer instruments and with thenew roles in which it is being employed, such as UV -B monitoring, it is essentialthat the calibration, operational programs, and data archiving for the instrumentsin the GO3OS be carefully coordinated. It is for this reason that this importantseries of workshops is being supported by the WMO an~ will continue to providea significant medium for the exchange of technical and scientific infonnation forthe operators of Brewer instruments in the GO3OS.
FOREWORD
C.T. McElroyMember, International Ozone Commission, IAMAP

1. Opening of the Meeting and Election of a Chairman and Rapporteurs 1
2. Review of the Recommendations by the Arosa 1990 Consultation.. 3
3. MeasurementofTotalOzone 5
4. Total Ozone Intercomparisons. . . . . . . . . .. . . . . . . . . . . . . . .. 13
S.UmkehrMeasurements , 15
6. UV-BMeasurements 25
7. N02Measurements 28
g. DataAnalysisandArchiving 33
~. New Instrument Hardware and Software Developments. . . . . . .. 35
lO. Formulation of Recommendations and Closing of the Meeting. .. 42
Appendices
) List of Participants. . . . . . . . . . . . . . . . . . . . . . . . . . . . . .. 44
i) Meeting Agenda. . . . . . . . . . . . . . . . . . . . . . . . . . . . . . .. 49
ii) List of Brewer Ozone Spectrophotometers in the GO]08 . . . .. 54
8.
9.
i)
ii)
iii)
Table of Conten~
33
3S
42
44
49
54

3.13.23.33.43.53.63.73.83.93.105.15.25.35.45.45.65.75.8
Annual ozone plot for Izafia Observatory.Ainnass dependency of the Izafta data.Ozone deviations from climatology from EASOE mapping project.S02 influence in Belgian ozone measurements.Dobson ozone trend at Uccle observatory.Brewer S02 trend at Uccle.Surface S02 trend.Corrected Dobson total ozone trend at Uccle, 1971 to 1993.Long-term total ozone trend at Toronto.Seasonal variation of long-tenD trends.Umkehr data from Table Mountain Observatory.Umkehr data collected in Edmonton, Alberta.A shalp increase observed in the ozone at 20-22 kIn in Rome.April and May, 1991 Umkher data collected at the CNR in Rome.May and June, 1991 Umkher profiles collected at the CNR.Stratospheric Umkehr layer results from Beijing observations.Total ozone values measured at the Quinghai site in 1991 and 1992.A comparison of total ozone at Beijing as measured by both the Brewerand Dobson Spectrophotometers.Aerosol effects on Umkehr observations.Ozone wind and temperature profiles including aerosol corrections.Comparison of the slant column amount of N02 observed at differenttimes by two instruments.The morning apparent slant column amount of N02 measured by eachinstrument at 840 solar zenith angle.
5.95.107.1
7.2
Ust of Figures

1. Opening of the Meeting and Election of a Chainnan and Rapporteurs
2. Recommendations of the Last Meeting
3. Measurement of Total Ozone [U. KOhler, rapporteur]
4. Total Ozone Intercomparisons [J. Staehelin, rapporteur]
S. Umkehr Measurements [E. W. Hare, rapporteur]
6. UV-B Measurements [W. Josefsson, rapporteur]
7. NO2 Measurements [J.B. Kerr, rapporteur]
8. Data Analysis and Archiving [ Alkis Bias, rapporteur]
9. New Instrument Hardware and Software Developments[A. Roberge, rapporteur]
10. Recommendations from the Attendees of the Meeting
SessionRapporteurs

1
CONSULTATION ON BREWER OWNE SPECTROPHOTOMETER
OPERATION, CALmRATION AND DATA REPORTING
Opening of the Meeting and Election of a Chainnan and Rapporteurs
Brewer User's Working Group
WMO
The Quadrennial Ozone Symposium was held in Charlottesville, Virginia inJune of 1992. The Brewer User's working Group took the opportunity to have theirbi-annual meeting in conjunction with the Symposium in accordance with theprincipals set down by the group at the time of the founding meeting held in Arosa,Switzerland in connection with a Dobson Spectrophotometer intercomparison inJuly and August of 1990. The 1992 meeting was attended by more than 30 ozoneexperts and Brewer operators from 20 countries and was hosted by the Universityof Virginia, the World Meteorological Organization and Environment Canada.
1.2 Opening remarks by Rumen Bojkov
The meeting was opened by Rumen Bojkov. He said that he was pleasedto open this second WMO Consultation on Brewer Ozone SpectrophotometerOperation, Calibration and Data Reporting and, on behalf of.the Secretary-General, Prof. Obasi, to welcome all who were present. Within the frameworkof the WMO Global Ozone Observing System and Ozone Project greatimportance is given to data quality, on which all the assessments and scientificdeductions depend. WMO has worked in close collaboration with theInternational Ozone Commission for 35 years to establish the methodology andstandardization, calibration and intercomparison of instruments, fonnerIy onlythe Dobson, in order to respond to the high demand for consistentmeasurements.
Now, more and more Brewers are being installed, and it is hoped that theozone research community will soon have timely access to their data through theWorld Ozone Data Centre. After the Brewer consultation meeting at Arosa twoyears ago, Tom McE]roy, Alkis Bais and Christos Zerefos prepared a beautifulreport for the WMO on the activities of the Brewer Users Working Group.

2
There are some advantages to the Brewer instrument, however they mustbe used everywhere or those advantages will remain only "paper advantages".These advantages include:
a) the automatic Umkehrb) the UV-B measurement
as well as other abilities such as measuring NO2 and SO2' However, thismeeting should have as its aim the implementation of a) and b). Within lessthan 1 year all Brewer-equipped stations in the Global Ozone Observing Systemshould be reporting data regularly.
Recommendations were made at the last meeting and a number of thesehave been implemented. New ozone absorption coefficients based on the workof Bass and Paur have been adopted. Brewer #039 has been used a travellingcalibration reference. There is not yet a systematic use of zenith skymeasurements within the Brewer community, and it is anticipated that scientistsat the AES will provide guidance in the use of this technique. The Universityof Thessaloniki and the specialists at the Academy of Sciences in Moscow haveco-operated to provide near-real-time data exchange, but more needs to be done.That is why the Secretary- General has provided support for this meeting andwhy all of you are here.
1.3 Opening remarks by the Chainnan,
James Kerr of Environment Canada was elected as the Chairman of theBrewer Users meeting. In his opening remarks he reminded the participants ofthe significance of the work being done by those present in order to monitor thestratosphere and understand the impact of changes in ozone on the UVenvironment on Earth. He noted that there are now more than 80 Brewers inuse around the world, and that as the use of the Brewer Spectrophotometersincreases and the length of the record becomes longer, the Brewer will play anincreasingly important roll in the Global Ozone Observing System. Kerr leadthe selection of rapporteurs for the meeting, and the election of the editor of theproceedings.
.

2. Recommendations of die Last Meeting
1. Recommendation concerning ozone coefficients for the Brewer and Dobson.
As of January 1, 1992 WMO called for the adoption of the Bass and Paur[1985] ozone absorption coefficient scale for J?oth Dobson and BrewerSpectrophotometers. Instructions concerning this recommendation wereformally distributed among the contributing members of the GO]OS.
2. Calibration visits.
Sci- Tec Instruments Limited is making regular trips to visit Dobson andBrewer observing sites to compare operational instruments to travellingstandard Brewers #017 (AES) and standard #039 (WMO). The calibrationreferences return frequently to Toronto for comparison with the AES Brewercalibration reference triad. The recalibration interval is variable from stationto station and the goal of having visits every two years has not beenuniversally met.
3. Reporting Brewer Moon Measurements.
Some stations have instituted moon observation programs; however,more instruments could still be included in this program.measurements are of particular interest in the polar night.
4., 5. Zenith Sky Observations
This report contains infonnation concerning the proper used of zenith skydata.
8., 9. UV -B Observations
A number of additional UV -B stations are now measuring UV -B. The oldACGIH-NIOSH scale has been replaced by the McKinley-Diffey algorithmwhich appears to be a likely candidate for an international standard forerythemal dose estimation.
3
manyThese

4
10. Regular Meetings.
The next meeting was held at Charlottesville, Virginia in connection with theQuadrennial Ozone Symposium in 1992, as recommended in Arosa in 1990.It appears that the value of the Brewer Users' meetings is such that they willcontinue to be convened every two years.
Real-Time Ozone Data Reporting
Near-real-time ozone data were collected by a data collection centre operatedby the University of Thessaloniki in connection with the European ArcticStratospheric Ozone Experiment. Data were submitted by European nations,countries of the Commonwealth of Independent States and by Canada. Mapsof the ozone distribution were provided to participants and interested parties.
11.
5
3. Measurement of Total Ozone [U. KOhler, rapporteur]
3.1 Total column ozone measuremen~ at Izafta Omervatory
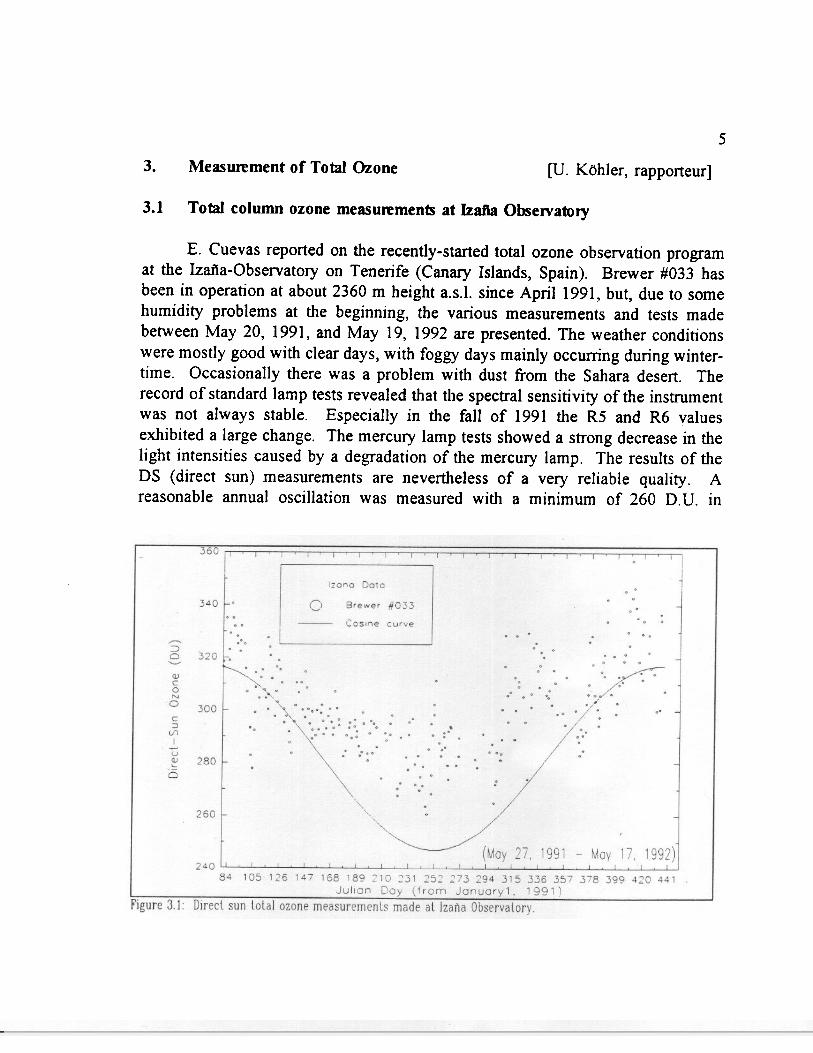
E. Cuevas reported on the recently-started total ozone observation programat the Izatla-Observatory on Tenerife (Canary Islands, Spain). Brewer #033 hasbeen in operation at about 2360 m height a.s.l. since April 1991, but, due to somehumidity problems at the beginning, the various measurements and tests madebetween May 20, 1991, and May 19, 1992 are presented. The weather conditionswere mostly good with clear days, with foggy days mainly occuning during winter-time. Occasionally there was a problem with dust from the Sahara desert. Therecord of standard lamp tests revealed that the spectral sensitivity of the instrumentwas not always stable. Especially in the fall of 1991 the RS and R6 valuesexhibited a large change. The mercury lamp tests showed a strong decrease in thelight intensities caused by a degradation of the mercury lamp. The results of theDS (direct sun) measurements are nevertheless of a very reliable quality. Areasonable annual oscillation was measured with a minimum of 260 D.O. in
~f1 '",
:;,
'c
~
~:; ,
"
~"
~

6
November 1991 and a maxirnurn of 357 D.U. in April 1992 (see Figure 3.1). Theobservations showed a slight, not unusual ~-dependency (Figure 3.2).
Measured SOl values were slightly negative at the beginning, but later ontheir rnean values were around 1 miIli-atm-cm with rnaximurn values up to 6 rnilli-atm-cm. A possible reason for this upward trend could be instrument drift assuggested by the behaviour of the R5 value frorn the standard lamp test, as no cor-rections to the extraterrestrial constants have been applied based on the lamp testresults. The comparison ofDS and FM (focussed moon) observations showed verygood agreement, but with a large standard deviation for the FM measurements.Similar results have already been presented at the first Brewer Workshop in Arosain 1990. The original set of ZS (zenith sky observation) coefficients, detenninedin Canada for instrurnent #015, turned out to be unsuitable for in~trurnent #033,with differences of about 7% cornpared to normal DS observations. A successfuldetermination of a new coefficient set for djfferent types of cloud cover improvedthe quality of the ZS observations.
.
.
.

5. .
Figure 3.3 Ozone deviations from historical levels
3.2 The zenith sky algoridlm for tota) ozone measurements
J. KelT gave guidelines for determining a "Sky Chart" from near-simultaneous DS and ZS observations. The following equation describes therelationship between the Brewer ozone absorption function F, which is calculatedusing zenith sky light, the total ozone amount, measured nearly simultaneously byDS observations and the airmass ~:
(F - Fo)
A + B J1 + C J12 + D X + E X J1 + FX J12 + G ~ + H X~ J1 + I X~ ~2
where F 0 is the extraterrestrial constant ETCX is the DS-total ozone valueJ! is the relative ainnass
7
for January, 1992.
function

8
At least several hundred sets of near simultaneous (within 10 minutes) DSand ZS observations are necessary to detennine the 9 constants of this empiricalfunction by a least square fit of all the data to sufficient accuracy.
Whereas E. Cuevas applied this method for three different zenith skyobservations (clear sky, dust and thin clouds), J. Kerr reported, that the constantsshould be detennined only for clear sky. The effects of clouds were detenninedby calculating the ratio of daily average zenith sky total ozone values to that forthe direct sun as a function of cloud cover. It was found that as cloudinessincreases from 0 to nearly 100 % (overcast) the ratio of zenith to direct sun ozonevalues increases from 1 to 1.04.
3.3 Resul1s of die WMO/GOJOS synoptic ozone mapping project
A. Bais reported on the EASOE-carnpaign of the winter 1991-92, duringwhich the daily means of total ozone observations of Brewer, Dobson and Filterinstruments were sent to Thessaloniki from a large number of stations. He clearlydescribed the problems with telecommunication, the time problem between themeasurements in Canada and Siberia, and with the schedules of some stations,which made it difficult to send the data in time. Because of these problems, themapping centre was not able to construct total ozone maps as quickly as it washoped. The availability of the maps at the NIL U data centre was within a 24 hourdelay, similar to that for TOMS data. A further problem in constructing the chartswas the different types of instruments each with different accuracies and calibrationstandards. Therefore the data are only preliminary and Thessaloniki could and willnot replace the World Ozone Data Centre in Toronto. The total ozone maps werenevertheless of high quality and were of great value to the EASOE-campaign.Some results, e.g.: the monthly mean deviations from long tenD means, were veryimpressive (Figure 3.3), which shows the extraordinary ozone reduction of up to20 % over a wide area during a large period in this winter. A. Bais promised forthe next campaign in the winter of 1993/94 to have' a. much bettertelecommunications link.
.A,B,... I are 9 regression constants
~
.

3.4 Measurements of ozone at Oslo
In the investigation of F. Tonnessen and S.H.H. Larsen direct sunobservations of total ozone from Brewer #042, Dobson No. 56 and TOMS at Oslo(60 N) for the period of May 1990-1992 were compared (direct sun measurementsare not possible during winter season at this latitude). Brewer #042 yielded about3% lower values in spring and fall, whereas values in summer were similar. Thedifference was slightly more pronounced comparing A wavelength pair observationswith Brewer #042.
Stronger seasonal variations in the difference were found comparingBrewer #042 with the daily overpasses of TOMS, with an amplitude of about6% (higher values of TOMS in summer). Similar but more pronounced was thedifference between TOMS and Dobson No. 56 (AD). The best agreement wasfound between TOMS and Dobson No. 56 (C).
3.5 The dayn
A.G. lshov presented data that indicated that during 3 years of Brewerobservations, only a few day exists
10 on which the diurnal amplitude is
aeo,.:.1.31.+~ smaller than 1 %. As an example0 he showed the measurements of
~ Brewer No. 44 at a tropical station~ .10 . in India. The total ozone amounti . oscillated between about 270 - 260I . +"" + - 270 DU with the minimum atS .3).1XI "'.. noon. He assumed that real! .. + + atmospheric processes cause this
.~.~ + "'+ diurnal variation and not an
instrumental miscalibration. This-C.IXI was confinned by A. Asbridge,
01Xl 4.1X1 8.1X1 12.1X1 18.1X1 3)1XI h h k d th . B ft thSO2~ W 0 C ec e elr rewer a er eFigure 3.4: The difference between the campaign. This behaviour of theamount of ozone measured by the Dobson total ozone is in contrast to theand Brewer Spectrophotometers as a observed diurnal variations in thefunction of S02 amount. moderate and northern latitudes
~
9
of the totalme course

10
10-~
l
I!SJ
.,o.~
-~~ I~ 14 10 I. W ~ 84 DO DO _.~ "'.. -~ ~ a.. -ca -_aa.-.
.. Y-: exists between these instruments19ure 3.5: The trend In total ozone at h th B 1 3 .
th SCJccJe w en e rewer . tImes e. column is added to the Brewer
otal ozone (Figure 3.4). This factor is somewhat higher than that recommendelIY AES (1.06). He proved that the apparent total ozone trend of about ..1.82%
ler decade as measured with his Dobson since 1971 (Figure 3.5), is in reality:aused by the decrease of the total column amount of SOl. This downward
trend, measured with the Brewer. (Figure 3.6), is of the same order
Slo~ - .245 . 0.017 DU/yeor7 Of -9.7 ./yeor as the results of the measurements
I of SOl near the surface (Figure.3.7). When the Dobson total
-# ozone data are corrected for SO2'
the remaining small trend is no~ II longer statistically significant
(Figure 3.8). The comparison2 between DS and ZS observations, shows very good agreement with0 ... annual oscillations, which are8;) .. e .. 57 .. 89 to 91 92 93
Yoo, deduced from the .change of theip~ 3.6: SO2 measurements made in ozone profile during the winter,JccJe. and which were very strong this
year [1992].
l
EuIE'0I
E
I
~~
Figure 3.6: SO2 measurements made inUccle.
near noon.with a m .8X1mum
3.6 Analysis of eight years ofozone and 802 Brewermeasuremenfs at dieMeteorological Institute ofBelgiumD. DeM uer presented a
comparison between Brewer #016and Dobson No. 40 at theMeteorological Instjtute of Belgiumin Brussels since 1983. Heshowed that an excellent agreementexists between these instrumentswhen the Brewer 1.3 times the 502column is added to the Brewerwhat higher than that recommended

"'e
~...
0VI
Figure 3.7: Surface S02 measunnents made at Uccle. These should be comparedto the Brewer m
f
72 7' 78 71
Figure 3.8:trend at Uccle.
11
ents shown in Figure 3.6.easurem
3.7 Measurements of ozone and802 at Kislovodsk obsenratory
N. P. Elansky presented the resultsof ozone and S02 measurements atKislovodsk with the Brewer #043. Themost interesting feature of the ozoneobservations is the deviation from thelatitudinal mean especially'duringsummer and fall, when the total ozoneamount is significantly lower than itshould be. He assumed the strong
80 82 ..
Dobson. IItotal
. .ozone

12
continental effect to be responsible for this phenomenon. During the summerseason tropical aintlasses drift to the north, driven by a high pressure system,which causes low ozone.
3.8 The Canadian OWNE WATCH program
J. Kerr gave a short survey of the Canadian Ozone Watch Program for thepublic, which has become a very important service with regard to the eventsduring the winter 1991/92 and the anticipated, future trend of total ozone andUV -B irradiance. He showed the trend investigation of the total ozoneobservations in Toronto in the period 1960-91, which revealed essentially notrend within the first 20 years, but then a sharp drop of the annual means since1982/83. This coincides with the eruption of EI Chichon in 1982 in Mexico.This downward trend has continued until the present with a small recovery inthe middle of the nineteen-eighties. Another large ozone loss is expected in1992, as already indicated in the monthly means of January - April (Figure3.9). An investigation of the deviation of the 60-day smoothed Brewer totalozone from the long term mean (1960 -1980) has shown that the main reductionis during winter and spring (Figure 3.10).
Figure 3.9: TotalToronto showingsince 1980..-
.
-
TOTAL OZONETORONTO
&-YEA. AYDAGD
ozone record from Figure 3.10 Annual cycle of totola downward trend ozone in Toronto.
.

4. Total Ozone Inte~omparisons
The intercomparison of total ozone measurements from instruments at theground (Brewer and Dobson) and from satellites (e.g. TOMS) is an importanttask because these measurement form the data bases, which are or will beavailable for global trend analysis. The different instruments provide eithercomplementary information (satellite versus ground based measurements) or theyhave different instrumental design and different calibration history (Brewerversus Dobson). Five contributions dealing with different data sets have beenpresented at this meeting including measurements from 60 N to the antarctica.It is worth to mentioning that other papers from another session of the meeting(De Muer: Analysis of the eight years of ozone and Brewer Measurements at theMeteorological Institute of Belgium) or presented at the Quadrennial OzoneSymposium are related to the same topic.
4.2 Inten:omparison of Dobson, ozonesonde, TOMS and Brewermeasurements made in Greece
In the presentation of C. Varatsos and P. Kalabokas, ozone measurementsperformed at local noon during May 1991 at Athens were compared with thosemade by the Brewer instrument in Thessaloniki. The Brewer data tended to berather higher (correlation coefficient 0.78). The measurements of Dobson No.118 agreed well with the daily overpasses of TOMS (correlation coefficient0.96). From 29 balloon ascents, performed with ECC sondes during the EASOEcampaign, 13 ascents could be compared with total ozone from Dobson No. 118.The integrated amount from the soundings agreed well with the measured totalozone values.
4.3 Intereomparison of Brewer #010 with Dobson No. 104 and TOMS
U. Kohler presented data from Hohenpeissenburg (Germany), fromwhere one of the world's longest data sets for the intercomparison of Brewer andDobson measurements is available. Good agreement of the measur,ements wasfound in the period between 1986 and 1991, when from both of the instrumentsgood data could be obtained. During this period the deviation of the monthlymean values of the two instruments was in the range of approximately 1 %showing a typical seasonal variation with higher Brewer than Dobson values in
13
[J. Staehelin, rapporteur]

14
winter. The comparison of Brewer #010 measurements with TOMS ovelpassesshowed larger seasonal variations in the differences which may have been theresult of errors in the TOMS measurements at large solar zenith angles.
The data comparisons consistently showed a small but systematic seasonalvariation in the difference of Brewer and Dobson measurements, whichpresently seem not to be fully understood [Ed. this has been observed elsewherean is probably due to the annual variation of the ozone-weighted meantemperature above the observing station causing an annual cycle in thedifference in the effective ozone absolption coefficients between the twoinstruments ].
4.4 Ainnass dependence of the Brewer #064 and the Dobson No. 84 totalozone
B. Rajewska-Wiech presented the comparison of measurements ofBrewer #064 and Dobson No. 84 from Poland. The group of Poland modelledthe influence of aerosols and stray light on Dobson No. 84 measurements usingthe procedure proposed by Basher (1982). A similar behaviour with respect todependence, in particular with noon decline, was found in the measurements ofBrewer #064 and Dobson No. 84.
4.5 Ozone measuremen~ in the Antan:tic
The contribution of L. Ciattaglia and Co Valenti included theintercomparison of total ozone from Brewer #035 (focused moon observations)with the New Zealand Dobson at Scott base in Antarctica which yielded quitesatisfactory agreement. Also the comparison of the Brewer results with theintegrated amount from balloon ozone soundings from Scott base, includingmeasurements from 1991, was reasonable. Umkehr measurements wereperfonned at Roma providing good results. Umkehr measurements in Antarc.ticaare restricted to a few days after the beginning of October because of the lowsolar elevation angle and small range of angles in polar regions:
uremen~

Umkehr Measurements5.
5.1 The Brewer Umkehr analysis and resul1s from Edmonton
C. T. McElroypresented a brief history ofthe mathematics and physics Table 5.1: Sample setup file for theof the Umkehr effect which Umkehr preprocessor.,has been known forapproximately sixty years,and discussed in detail the ozoavg89.039U k h . . h . 0999 TMO 34.383 117.683
mer mverslon tec rnque,particularly as it applies to /* station number header code latitude, ,Brewer Ozone and longitude */Spectrophotometer Umkehrmeasurements. Eightdiscrete wavelengths aremeasured with the Brewer Umkehr program. The Umkehr algorithm utilises thestandard five "short" wavelengths used for total ozone observations as well as.three additional "long" wavelengths obtained by offsetting the diffraction gratingto longer wavelengths which allows an overlap of the last two short and firsttwo long spectral positions. Measure-ments are made in the strong polarizationdirection, but will include some multiple scattered light.
The source radiation is attenuated by air and aerosols and is different forthe various Umkehr layers dependent upon the pressure. The mean scatteringheight is about 20 Km at a zenith angle equal to approximately 60°. There isattenuation of light through the layer and along the vertical path (between thebottom of the layer and the observing point on the surface) in the nadirdirection. Ozone removes most of the radiation in the 295-98 nm region.
The most probable solution method developed by Clive Rodgers is used inthe "short Umkehr", developed by J. DeLuisi and C. Mateer. The .Umkehrmethod utilizes the log-intensities at the various heights whereby twelve anglesare measured with the ratios of three wavelengths (ie. 6 of the 8), the shortestbeing 306.3 nm and the longest 323.2 nm. It is the difference in the variousratios which yields the information about the height distribution.
15.
[E. W. Hare, rapporteur]

16
The preprocessor reads an OZOA VG file which contains the daily meantotal column ozone values, one for each Umkehr observation day. APRESETUP file contains station location infonnation and is given in Table 5.1.The program produces actual intensity values for a given set of generated zenith
angles. Measurementsare made at a large
, ~" number of angles and, ,
6000 AM ",.10/0) 1~1_,...~ interpolated to standard. ~,-,j; ,~j ;,;;.~:.' angles. A complete;d 'c;:iC",,' ,,/;;'i,c\' ~,.tr.
~' "eo _:, ;: -5.,Ca'0'" -'., Umkehr preprocessor
output record is-~ 323.': nm illustrated in Table 5.2>-
:-= for one AM and one PM1/1
f; measurement. StandardE Umkehr angles are used
4000'0; for both AM/PM0 b ....J 0 servatlons.* Table 5.3 is an,-, .~~ ~
>--.~ct)C
Figure 5.1: This figure shows the fitted curve and the program requires anraw data points output by the preprocessor for the UMKSETUP file aslongest and shortest wavelengths observed by the input which containsBrewer.
Table 5.2: Preprocessed records for input to the Umkehr analysis program.
TJdO 24789 II 29IS03S48294S4S4245 398037163492 33SS3250312830272902999T~O 24789 12 291S397S25450~24823 459443053976 37613617346933563222999TJdO 24789 13 2915784567055095323 513248784544 42894099391137823636999TJdO 24789 14 29IS89958135690~549 540352034921 467244S04208404138~2 999TJdO 24789 15 2915860578356735546 541452334975 47414S23427440933898999TJdO 24789 16 2915667560S55175416 531251664958 47664580434641583943999TJdO 2478917 291S6305S7755015413 532251975017 48514690448143094102999T~O 24789 18 2915372S3235253S173 509049744810 46S64S07431541553960 999
.
10/01/~~~, .,,""" .. ~."
~
306.3 nmexample of a sampleoutput record from theUmkehr analysisprogram (TOMKEHR).The TOMKEHRprogram requires anUMKSETUP tile asinput which contains

instrument dependent coefficients and a representative model chosen to reflectthe climatology. An ozone partial column amount is produced for each Umkehrlayer and the sum of the partial column is compared with an independentmeasure of the total ozone. Output files which yield layer concentrations insummary and plot format are used to monitor data quality and integrity withrespect to the model fitting procedures.
Figure 5.1represents Edmonton, Brewer AM 11/01/91Alberta Umkehr datawhich includes both 50
morning and eveningas well as short and 40long wavelengths. -With the Rodger's ~30method, the uaveraging kernels -:g
yield infonnation :a 20about the vertical -c
resolution and 10validate the soundingmethodology. First 0quarter data for the 0[+000 2[+012. 4[+017 2 6[+012years 1984-92 from Concentration (mo]/cm )
Edmonton are Figure 5.2: Sample output from the inversionrepresented in Table algorithm. Both the climatological "first-guess"5.4. The Umkehr and the retrieved profile are shown.
inversion hascontributed about as much infonnation as the climatology at middle levels andthere is no statistically significant change from year-to-year for a given layer.
Program testing was conducted on data collected at Table Mountain,California during July, 1989. An Umkehr profile derived from BreVtfer data isgiven in Figure 5.1. The most "probable" profile based upon the observed dataand the climatology lies betWeen the "real profile" (probably close to the oneobserved by the independent profiling instruments) and the climatologicalprofile.
17
Brewer AM 11/01/91
-rinol- C1imOlolOgy
the inversion"first-guess"
Figure 5.2: Sample output from tlalgorithm. Both the climatological I
and the retrieved profile are shown.

18
In conclusion, McElroy indicated the use of the second Umkehr to recoverthe higher level profiles and yield information about the aerosol distribution, isunder investigation. Umkehr solutions will be poor if the total ozone amount ischanging rapidly near sunrise or sunset.
. UMKEHR PROfILESROME - CNR
» '1
3D
!- 2S
f20
1
10
~
0OC+O %£+12 .[+12 8[+12 .+12 1[+1]
C lrol;o-, (moI/C",'>
Figu~ 5.3: A sharp increase observedin the ozone at 20-22 kin in Rome.
stamp problem involving the Juliandate and AM/PM recording.
Data collected at the ConsiglioNazionale delle Ricerche (CNR) inRome, Italy have been processed andUmkehr profiles generated. April 17,1991 data indicates a sharp rise in the
.
5.2 U mkehrAn~tica
resul~ from Scott Base,
The Italians are working with datafrom two Brewer stations in theAntarctica: Brewer #50 at Scott Base andBrewer #35 in co-operation with NewZealand and Argentina respectively.Umkehr observations were collectedduring October, 1991 at Scott Base,however, there were no successfulprofiles generated due to a date/time
f~
J
.
profiles

E~
il.
Figure 5.5: Ozone]at the CNR in Rome1991.
19
ozone concentration at 20-22 KIn asseen in Figure 5.3 and there is stilluncertainty about the explanation.Profiles which have been plotted andgiven in Figures 5.4 and 5.5 wereobtained between April 10 and June 12,1991. Ozonesonde data collected at asite near Bologna, Italy have revealed amaximum concentration of ozone at 18KIn. Ozonesonde data collected onJune 6 and 20, 1991 are to becompared with Umkehr measurementsmade at CNR in Rome. In addition,total 03 and S02 are to be reported aswell and included in the datacomparison, despite the distancebetween the Rome and Bolognastations.

20
5.3 Comparison between the "classical" Umkehr and the Brewer Umkehr
'as
~i.~I.
jJjl
.~
.~
o~L-..~2«100 .00 32000 -.00 c~
J~ D8y IsI8It 1~J
Figure 5.6: Stratospheric Umkehr layerresults from Beijing observations.
methods
The effects of cloud were reported to be large~ therefore, the unusuallylarge ozone values observed are not considered reliable. Yet clear sky data alsoindicated unacceptably large ozone values suggesting a program "collapse" hadoccurred. From September 1990 to December 1991 a total of 336 Umkehrmeasurements have been made. January and June 1991 indicated good monthlymean ozone comparison results with best the agreement in layer 4. The upperlayers, such as layer 7, show the Brewer method estimating higher ozone valuesthan were reported for the Dobson. Total ozone measurements form the Brewerwere also noted to be larger than the Dobson values.
It was suggested that the percentage difference of ozone measurementsfrom each instrument can be determined and compared by running the Dobsondata through the Brewer Umkehr analysis program (with appropriate changes).
\t~
A comparison of Dobson No.51 and Brewer #040 at Arosa,Switzerland has been undertakenfor Umkehr profiles. Total ozonewas measured by the Brewer andby Dobson instrument No. 15.Phenomenological cloud coverdescriptions were made each dayand 25 data sets werepreprocessed with 15 Brewerozone profiles actually beinganalyzed using the TOMKEHRprogram. The Dobson Umkehranalysis employed the newprogram by Mateer and Deluisi(1992) to provide single profilesand monthly means from both

5.4 Aerosol conections for Umkehr measurement
There are currently two Brewer instruments operating in the PRC: onenear Beijing and another in the north Central interior at Qinghui at an elevationof 3300 IIi. There are two Dobson instruments at the northern site and twomore Brewer instruments have been ordered.
Data collected at the Beijing site from September 1991 to January 1992have been analyzed using the AES Umkehr data processing software. Plots for
~~
5ecE~"0u.20
rf'
site in 1991 and
collected at the Beijing site(November 1990 to January1991) showed good correlationwith about an average of 6%difference between instrumentsas seen in Figure 5.8.
t
~
~
Further data analysis usingthe aeroso] correction method is
21
layers 3 to 8 are given in Figure5.6 which are derived from dataanalyzed by the TOMKEHRprogram with acceptance criteria:nnsres values of < 1.1. Anaerosol correction has been appliedto these data. Total ozone valuesfrom the Qinghui site for theperiod September 1991 toFebruary 1992 are given in Figure5.7. Brewer and Dobson data
a:
II8
I
Figure 5.8: A comparison of total ozone atBeijing as measured by both the Brewer andDobson Spectrophotometers.

~
22
..~ ...~ 0 , ~ I
I,
Figure 5.9a:
-
.~~~
II
Figure 5.9b:
shown in the four plots in Figure 5.9where the first plot indicates the firstguess, the second is the AES softwarederived result~ and the last plot includesthe appropriate aerosol corrections.Table Mountain, California data is alsopresented indicating the effect of theaerosol correction given in Figure 5.9.
The aeroso) correction uses thestratospheric optica) depth of aeroso)p)us the mid-)atitude ozone profi)es.
2 These input parameters are then used tosolve the radiative transfer equationassuming first-order scattering (sing)escattering mode)). A first guess profilea)ong with the refl-active index of
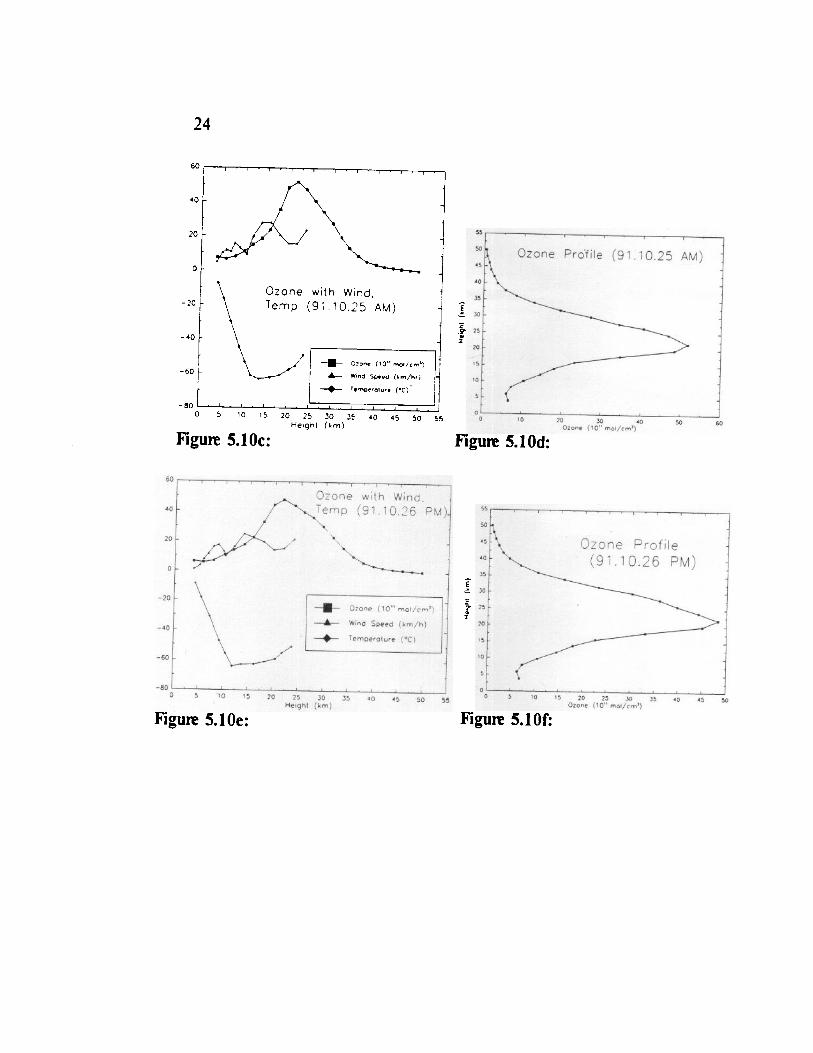
aeroso)s are a)so used as inputs to thecalculation. Six plots for morning andevening profiles are shown in Figure5.10.
It was recommended that the aerosolprofiles be measured to ensure that theaerosol optical depths used as input are,in fact, representative of the stratosphereand not ground-level aerosols.

.
.
..
»
»
to
....~
!J
Figure 5.9c:
60
alone with Wind. i~p (91.9.17 PM).0 ,~
:!o \.--
0 "' --- oz-- (10" mol!c",')
-~O Wino S~ ( ~m/l\ )
~ 1f"'PetG\Ute (oct-./
-80
-800 5 10 15 20 ~ JO ~ .0 .5 50 ~
~(.~)
Figure 5.10a:
23
Figure 5.9d:
!t
Figure 5.10b:
24
Ozone wj1n Wind.Temp (il.10.25 AM)
--- 0 I'O"-/~-.6- - '-OM (-If-)-+- T ("C)'
-m0 30 35
H.;qhl (~m)
~
Figure 5.10c:
~~~
I
Figure 5.10e:
~
Izz.%
Figure 5.10d:
!;..7
Figure 5.10f:

6. UV-B Measure
6.1 Preliminary resuJ1s of UV -B measuremen1s with Brewer #064
Preliminary results from UV -B measurements made with Brewer #064were presented by M. Degrorska. The instrument is sited at Belsk whereobservations of UV radiation have been recorded since 1975 using a Robertson-Berger (RB) meter. Three months of daily UV observations for the period Aprilto June 1991 from the Brewer were compared to the corresponding datarecorded by the RB meter. The correlation coefficient was about 0.92 and thedaily values from the Brewer included about 20 scans which were weighted bythe ACGIH-NIOSH action spectrum. The absolute calibration of the Brewer wasbased on exposures to a lamp unit supplied by Sci- Tec.
Spectral data from two clear days were compared with measurements ofBener and with model-computed values by Green, Dave and Halpern andSchippnick-Green.
6.2 Three yea~ of UV-BresuJ~
J. Kerr presented the results of a three-year study of, UV -B made by theBrewer instruments in Toronto. The instruments were calibrated once a weekusing a set of 1000 W DXW halogen lamps traceable to NIST.
Kerr also reportd on an intercomparison on the 6th of Nov 1990 betweena number of different spectroradiometers including the Brewer. The presentedagreement of the spectra within the UV -B was surprisingly good. Thecomparison data were taken close to local noon.
Daily values of weighted UV irradiation based on the action spectrumgiven by McKinley and Diffey were presented. The annual variation for theyears 1989 to 1991 revealed the strong influence of the solar elevation andcloudiness.
The McKinley-Diffey weighted values are denoted here by DFY and haveplotted versus the total ozone for different cloud categories. A set of clearbeen
25
[W. Josefsson, rapporteur]
at Toronto compared with modelmeasuremen~

26
days were extracted from the total data set and the DFY was plotted as afunction of the total ozone with the solar zenith angle as parameter. The resultwas a set of grouped data points. Using a simple regression mode], a set ofcurves were fitted to the points showing a good agreement.
This verification of the empirical model shows that it can be used tocompute clear-day values of DFY. It can also be used for simulation as wasshown in a plot presenting the yearly average daily DFY based on pre-1981total ozone data compared to the actual measured 1991 DFY values. Therelatively small effect of the springtime low values of total ozone was evident.The model also illustrated the so-called radiation amplification factor (RAF; theratio of the percentage UV change to the percentage ozone change causing it)which was a little larger than 1. The noon-time flux can be computed for anylatitude assuming a clear sky. Using TOMS data, it is possible to do a globalmap of the Diffey flux.
Canada has a program called the Green Plan which includes a UV-Badvisory program. On a daily basis, a forecast of an ultraviolet index is givento the public. It is based on a predicted field of ozone calculated frommeteorological fields and adjusted using Brewer total ozone data. The modelrelating UV -B to ozone amount is used to determine the clear-sky UV radiationwhich is then converted to a suitable index in the range 0 to 10.
6.3 Comparison of UV -B measurements pelfol1t1ed with a Brewer Spectrop-hotometer and a new Robel1son-Berger detector
A. Bais presented a comparison of data collected by a Brewer OzoneSpectrophotometer and a new Robertson-Berger (RB) meter. The Brewer wascalibrated using a calibration lamp unit supplied by Sci- Tec and UV spectrawere collected five times per day. The spectra were convolved with the actionspectt1lrn recommended by ACGIH-NIOSH [parish] and also the spectralresponse of the RB meter. The latter showed a very good correlation (0.997)with the measurements of the RB meter. '
A brief presentation of the intercomparison of spectroradiometers withinthe STEP UV measurement project was also included. Some very large discre-pancies were shown. A probable explanation is errors in the spectrophotometer

wavelength settings. A new intercomparison is planned to take place in thesummer of 1992.
6.4 UV-B - measurements applied to studying marine biology
A. Roberge presented the results of some UV -B measurements as appliedto the study of marine biology. A study of the growth of algae in a river inBritish Columbia (SION) as a function ofUV-B was the impetus for a newapplication of Brewer data. About 30 scans per day, roughly corresponding totwo observations per hour, were taken along with observations of the total ozonecolumn.
The action spectrum of Setlow was applied to the measured spectra andthey were also converted to photons per unit area per seconds. The latter is aunit often used for the photosynthetically active radiation (PAR) which also wasmeasured at the site.
27

28
7. NOz Measurements
7.1 Resulfs of NOz inten:omparisons.
Tom McElroy reported on an instrument intercomparison which wascarried out under the auspices of the World Meteorological Organization.Environment Canada hosted the comparison of visible light spectrophotometersat Mt. Kobau, British Columbia in August of 1991. Instruments from fourcountries were involved. The intercomparison results have indicated that somesignificant differences exist in the response of the various instruments, and haveprovided a basis for the comparison of the historical data sets which currentlyexist as a result of the independent researches carried out in the past in theformer Soviet Union, New Zealand and Canada.
Measurements of the amount of stratospheric nitrogen dio~ide were firstreported by Ackerman and Muller and were based on balloon observations ofthe solar spectrum in the infrared from high-altitude balloons. Shortlyafterward, Brewer, Kerr and McElroy published the first ground-based resultsusing visible light spectroscopy in the 430 to 450 nm region. Observations ofthe brightness of the zenith sky were analyzed by comparison with the results ofa single-scattering model to give an estimate of the amount of NO2 in thestratosphere.
The Mt. Kobau intercomparison was organized in order to evaluate theperformance of visible light spectrophotometers which have been in use forsome time for the monitoring of stratospheric nitrogen dioxide (for example thework of Brewer et al., Noxon, Pommereau, Platt et al., McKenzie and Johnstonand Mount et al.). It is of considerable scientific importance to compare thoseinstruments which have a long, independent record of measurements, particularlythe Canadian and New Zealand instruments. The groups which wererepresented at the intercomparison included the Academy of Sciences (AS) ofthe Soviet Union, the University of Heidelberg, Germany, the AttnosphericEnvironment Service (AES) of Canada, and the Department of Scientific andIndustrial Research (DSIR) of New Zealand.
The DSIR instrument is a mechanically scanned monochromator. TheAES NO2 instrument is a Brewer spectrophotometer and the University of
[J.B. Kerr, rapporteur]

NO, - - ---~~.'-J
"Eu
"0E
,0-tI'i!C
Ie Data from a total of 10(10 . .
Figure 7.1: Comparison of the slant column sunnses or .sunsets are avaIla~leamount of NO2 observed at different times ~or companng at least one paIr ofby two instruments. Instruments. At the other extreme,
four day's worth of data werecollected which permit the
comparison of sunset data from all four instruments and 2 sunrises wereavailable during which all instruments collected data. In the comparisons whichfollow, a detailed analysis of 4 mornings and 4 evenings is presented, sincethree of the four instruments were operating on all of those days. Thecomparison is of somewhat lower precision for the sunrise data in the case ofthe Heidelberginstrument becauseonly 2 days' data wereavailable.
The verticalcolumn amountswhich are reported bydifferent groups basedon zenith sky, twilightobservations is totallydependent on themodel or algorithmused to reduce slantcolumn data tovertical column
29
Heidelberg spectrometer is acooled, diode array device. TheAcademy of Sciences group used amechanically-scanned gratinginstrument. The detaileddescriptions of these instruments,and the results of the comparison,will be published during 1992 as aWM 0 report.
~A$ v os,.~OSl' v AS
'O'7~2' - .'2J't.,~'0.2'" - &.'60It.'5
AM N02 VAlUeSsa - USSR-DSIFI- He'deIOe'~
_A(S B...w~'NE
v
CE
60
.,"\~-A~~~:::::
40;~"0.-
..~
1:0
00
Figure 7.2: The morning apparent slantcolumn amount of NO2 measured by eachinstrument at 840 solar zenith angle.

30
amounts. Therefore, if vertical column data were directly compared, the resultswould include the effects of the differences in the analysis methods. Modelresults have shown that the process of scattering radiation from the sun towardan instrument looking at the zenith sky is relatively independent of wavelengthfor the spectral interval 400 to 500 nm. It is therefore useful in theinvestigation of the relative behaviour of the NO2 measurement systems tocompare the differential sensitivity of the various measurement devices tochanges in the apparent NO2 slant column in the zenith sky light which occurbecause of the variability of NO2 and the progression of the solar zenith anglethroughout the day.
Figure 7.2 shows the apparent slant column amount of NO2 measured byeach instrument at approximately 840 solar zenith angle each moming. Therelationship between the AES and DSIR instruments is markedly different. Itmay be that there is an interfering effect which makes the DSIR and AES databehave differently in the morning. Since it is known that the Brewer may beexperiencing some interference from residual Ring effect contributions andpossibly water vapour, the variation in the other column amounts retrieved (sayby the DSIR intsrument) should be examined in light of the information inFigure 7.2.
The. general consistency of the results would suggest that all instrumentsare achieving a precision on the order of a few percent. The offset indicatedbetween the AES instrument and the others may be a significant feature of thecomparison. The offsets between the other pairs of instruments generally seemto be somewhat smaller. Since the Brewer data analysis technique is differentfrom that which is used for the analysis of all the other data, this may indicate asystematic difference between the two analysis methods. This will requirefurther investigation.

Figure 7.3: Stratospheric AM and PM NO2 columnamounts during 1991.
NO2 were observed to decrease to values less than those observed in previousyears. The lower values of NO2continued during early and mid1992 as shown in Figure 7.2. Kerr ra. ~TOSPHERIC NO2 TORONTO 199~
Istated that the observed decrease a .Iin NO2 was likely due to effects: .
from the Mount Pinatubo volcanic :- 'debris which arrived at northern ~ .mid-latitudes around the same ~ 5
time. However, it is not clear ~ .Q 3
whether the observed decrease is a ~ I
real decrease in stratospheric NO2 Jn 1or an apparent decrease resulting 0
from the volcanic aerosols causing JUUAN DAY 19,92
an optical effect on the inversion. ~ 7 .. n YO' 7 .., h t...m ,~m~ QQ "Imlr~ .. 11
Figure 7.3 summarizes the 7year record of total NO2 (from
31
7.2 Seven yea~ of NO1measurements at TorontoNO2 TORONTO 1991
J.B. KelT presentedresults of NO2 measurementsmade at Toronto withBrewer instrument #022since 1985. Figure 7.1shows morning and eveningcolumn amounts ofstt-atospheric NO2 for 1991with the long-tenD (1985-1992) annual averagesshown as solid lines and theshort-tenD (60-day) runningaverages shown as dashedlines. Toward the end of1991 both morning andevening column amounts of
STRATOSPHERIC NO2 TORONTO 1992
-----
Figure 7.4: Same as Figure 7.3 but for1992. NO2 values are about 25% belownonnal.

32
Figure 7.5: St
troposphericmeasurements.
direct sunmeasurements) andmorning and eveningstratospheric columnamounts (from twilightzenith skymeasurements). It isapparent that the totalcolumn NO2 issignificantly larger thanthe stratosphericcolumn amount. It isalso evident that thetotal column NO2 hasbeen increasing withtime, whereas, thestratospheric amountremained relativelyconstant until the recentdecline in late 1991.
NO2 TORONTO 1985-1992
,
KJNUSPM
AK
Summary of total column stratospheric andNO2 from direct sun and twilight

8. Data Analysis and Archiving
8.1 The NO} vertical profile inversion technique.
Tom McElroy reported on the development of software to retrieve verticalprofiles of NO2 from apparent slant column amount measurements made usinglight from the zenith sky in the blue part of the visible spectrum. The apparentamount of NO2 in spectra taken at large solar zenith angles is detennined byeither the Brewer NO2 algorithm or the spectral fitting of the spectrum of lightrelative to a reference spectrum taken near noon. The growth of the apparentslant column amount is the result of light taking a long, slanting path throughthe upper atmosphere as the solar zenith angle increases.
The precise path of the light through the atmosphere is detennined by theradiative transfer process and is dependent on the amount of air and aerosol ateach level in the atmosphere. Since the absorption coefficients for absorptionby NO2 ozone and other significant substances are not large (maximum <10%)even in the long twilight slant path, the path of scattered light in the atmosphereis independent of the amounts of these absorbers. As a result, a quasi-linearmodel of the scattering process can be used to produce a useful profile inversionmethod. Some results of this technique have been reported in the literature,notably by McKenzie et al.
8.2 Brewer Database Management System (BDMS)
Ed Hare presented a general overview of the Brewer DatabaseManagement System (BDMS) by first giving a brief history of the developmentof the system by illustrating the contents of the Canadian Brewer data alongwith several international data sets currently being processed.
Hare then proceeded to discuss the development of the Oracle databasewhich is a multi-environment, relational database, by illustrating the logicalmodel used for data table creation. Parsing software will be used to disseminatedata from the Band # files in order to generate ascii text files which in turn getuploaded into the database. UV data tables are currently being designed.Figure 8.1 shows the logical model for Brewer tables.
33
[ Alkis Bias, rapporteur]

34
Revised Logical Model
~
I C
Figure 8.1: The Brewer Database organizational structure.

9. New Instrument Hardware and Software Developmen1s[A. Roberge, rapporteur]
9.1 Ozone Measurements at Large Solar Zenidl Angles
Weine Josefsson has developed a technique for the Brewer which extendsthe direct sun ozone monitoring capability to larger solar zenith angles. Thetechnique is known as a corrected Focused Sun observation. Focused sunobservations were originally developed for the Dobson Spectrophotometer.
The measurement is done by taking a reading of both an offset and afocused sun image on the entrance slit of the Brewer. The signal from theoffset position is taken as the scattered light component of the focused signal.In theory, the observations at higher solar zenith angles include much morescattered signal compared to a direct sun measurement at a smaller zenith ang
The relation:
where
shows the relation between what is measured by the Brewer [I'(WL)] along withthe direct component [I(WL)] and the difference between the previous twocomponents [L\I] which represents the signal read when the sun's image is offsetfrom the entrance slit. The Figure 9.1 demonstrates the relationship between thesun's image offset angle and the relative intensity value for both the longest andshortest Brewer wavelengths.
{graph} relati ve signal value v. image offset angle 9.1
Figure 9.2 demonstrates the difference between the conventional DSBrewer measurements and the new FS measurement which subtracts out thescattered skylight component of the signa]. The FS method can give reasonablyaccurate results down to 8S deg. SZA compared to 7S deg. for DSmeasurements. The ro))off will be dependent on sky conditions and the ozonevalue as is demonstrated in the Figure.
3S
zenith angle.
1'( WL )= I( WL ) + M
WL is wavelengthI is intensity

36
{graph} mu vs. ozone for DS and FS msmnts. 9.2
The higher the ozone, the less reliable the FS results are as increasedozone decreases the direct component and increases the scattered component ofthe signal.
9.2 New developments in instrument software
Ken Lamb of SCI- TEC Instruments discussed several aspects ofthe Brewer software and hardware. Recent hardware improvements to theBrewer include a redesigned weatherproof cover that no longer has an openingdoor on the top and uses a tubular gasket seated in an aluminum groove thatmakes a better seal to the Brewer base. Now that the top window is sealed, thesiting switches have been moved to along side the azimuth connector on theBrewer base. No changes have been made to the siting technique. A lightningarrestor has been added as a modular connection to the base of the tracker. Aswell, a surge suppression adaptor has been added to the computer end of theRS232 communications cable. Software improvements have been made for bothinstrument control as well as graphical presentation of near-real-time Brewerinstrument performance and atmospheric data.
Two commercial software packages have been tested running inconjunction with the Brewer control software. They are:
DESQVIEW V2.41 (Quarterdeck Office Systems)
- this package is a true multitasking system that can control up to nineoperations/windows at one time. The operations may be any combinationof Brewers, DOS operations or other commercial software packages suchas WordPerfect,
LOTUS
CLOSE-UP V4.0 (Norton Lambert)
- this package is a remote terminal control system that allows Brewer,DOS or any other application operation from another computer provided

both machines are connected by modem.
Sci- Tec is culTently developing some data processing software which candisplay, with a very small number of key strokes, any number of graphs at onceof Brewer instrument performance or atmospheric data. The style and structureof the graphs are defined by the operator. The name of the software isBREWVIEW. BREW VIEW, along with DESQVIEW, can turn a dedicatedBrewer control computer into a multitasking work station that is capable ofrunning more than one Brewer and other programs, as well as displaying innear-real-time previously-recorded Brewer data. Quality improvements havebeen directed toward improved GWBASIC Brewer software that eliminates mostcommunication difficulties.
9.3 Turbo-based software development for Brewers
P. Eriksen described the successful conversion of some of the Brewercontrol software to operate in the compiled mode using a Turbo-Basic compiler.This development permits the faster operation of the observing system andquicker post-processing of data which have been collected by the measuringsystem.
9.4 Development of die Brewer Double Monochromator
Tom McElroy presented preliminary results and discussed the constructionof a double monochromator Brewer. This Brewer has been constructed to testthe stray light rejection capability of the single monochromator Brewer. Theneed for accurate scan information is driven by sophisticated atmosphericradiation models, instrument specifications as well as the life sciences. Sinceground based spectral measurements are influenced by ozone (implies very littlesignal) it is assumed the single monochromator Brewer is sufficiently accuratefor wavelength scans.
The goals of the characterizations tests are to:- better understand the single monochromator- test the double monochromator.
It was shown that the throughput of radiation after each pass through a
37
Brewer,

38
Brewer monochromator is 20% of the signal (e.g.: 2nd pass 20% of 20%). Thedouble monochromator gives a higher performance in rejecting stray lightcompared to a single monochromator, where the quality figure for the doubleinstrument is the square of that for a single monochromator. In a graphshowing the ilT8diance values for simultaneous UV scans with both a single anddouble monochromator good agreement was seen between 300-325 nm as shownin Figure 9.3.
9.5 Development of the red-light Brewer for ozone measuremen~ at 600 DID
Andre Roberge presented and discussed the progress to date on the MKVBrewer. The MKV Brewer will have the capability of measuring ozone in bothUV and visible wavelengths. Wavelengths centred around the peak (580 to610 nrn) in the absorption spectrum of ozone in the Chappuis band (450 to 750nrn) will be used for visible-light ozone measurements. The use of the visibleabsorption band will extend the useful monitoring period in the winter, at high-latitude observing stations, since the absorption sue to ozone is smaller than inthe region used by the conventional Brewer UV measurement, the light level ishigher in the visible, and Rayleigh scattering is smaller.
The MKV Brewer design is based on the design of the MKIV Brewer.Hardware differences that distinguish the two are outlined in Table 9.1.Wavelength selection for O)/SOjNO2 in the MKIV and O)-UV/O)- vis. isaccomplished by using different diffl-action gratings and differeent order-sortingfilters located in front of the cathode of the PMT. Changes have been made inthe electronics in the MKV to achieve higher gain, speed and linearity andgreater stability in the applied high voltage. Faster pulse rise times and highercounting rates are used with the stronger visible light signal. Comparing theUV and visible wavelength regions to the UV ozone absorption, there is lessabsorption and a stronger signal in the visible region. To overcome thedifficulties with the weaker absorption the following elelments will be includedin the design:
a.) restrict wavelengths to those not affected by H2O or O2 absorption.b.) wavelengths cover the visible absorption region where 0) has the
greatest optica1 depth.c.) breadth of monitored region is sma)] enough to neglect aerosol

scattering.d.) calcluate and remove the effects of Rayleigh scatteringe.) apply the most accurate absorption coefficients.
Other instruments that have employed the Chappuis band differentialabsorption technique have achieved a 4-7% accuracy with both DS and ZSobservations. It is believed the Brewer MKV will do "equally as well andmaintain all of its automation and weather hardening. With the extension of themeasured wavelengths to the region between 530 nm and 700 nm it may bepossible to measure gasses other than O3' that absorb in this region.
39

40
Table 1: Hardware differences that di

9.6 Special Applications
Tom McElroy reported on the following new developments in Canada:
- a Stellar Brewer which would have a 30-40 cm. telescope for use in theArctic. Stars were first used as light sources for the measunnent of ozonein the 1960's by D. Wardle with a spectrophotometer similar to theBrewer. This project is in the conceptual design phase at this time.
- SunPhotoSpectrometer (SPS) for SPEAM II. This is a hand-heldinstrument to designed to fly on the US Space Shuttle in the fall of 1992.The instrument uses a 1024-pixel Reticon diode array detector and aconcave holographic grating (400-800 nm in second order and200-400 nm in the first order). The system weighs 2.8 kg with batteriesfor 6 hours of operation. A space-qualified PC computer has been builtas well to store data on ROM (1 MB credit card size). There is alsoanother instrument which will fly along with the SPS to make airglowmeasurements.
41

42
10. Recommendations from the Attendees of the Meeting
As part of the concluding discussions of the Brewer Users' Workshop, a numberof recommendations concerning ozone measurements and the operation ofBrewer Spectrophotometers in the Global Ozone Observing System were agreedupon by the working group members.
1. It is recommended that all Brewer Spectrophotometers havecalibration and servicing visits as frequently as possible and not less thanonce every two years. Furthermore, steps should be taken to co-ordinatethe calibration activities at various sites to reduce the cost of thecalibration trips.
2. All Brewer Spectrophotometer operators should be stronglyencouraged to collect and submit data, including umkehr observations,within 60 days of their acquisition.
Brewer Spectrophotometer operators should take the necessary stepsto upgrade their instruments to collect ultraviolet spectral (UV -B) data.
Regular UV -B calibration activities should be organized in order toproperly calibrate all the Brewer UV -B monitoring instruments in theworld network. These calibrations could be co-ordinated with the regularBrewer Spectrophotometer ozone calibrations.
3.
4.
It is recommended that measurements of the two linear polarizationcomponents of the zenith sky light be included as part off the BrewerUmkehr. Both the component of light polarized parallel to theinstrument-sun vector and the perpendicular component should bemeasured. Currently, only the perpendicular (strong) component is beingmeasured at most observing stations. As a minimum, ozone Umkehrobservations
5.
It is recognized that the WMO has supported the continuation oft ehnear-real-time ozone reporting and mapping system which was operatedjointly by Greek and Russian scientific groups for the purpose ofproviding ozone infonnation for planning during the European Arctic
6.
..

Stratospheric Ozone Experiment (EASOE). It is recommended that thereporting system be operated throughout the whole year until such time asthe World Ozone Data Centre (WODC) can provide near-real-time qualityassessment of contributed ozone data. Rapid collection and disseminationof ozone data encourages timely submission of data and provides for theearly detection of instt11ment problems.
. The working group further recommends that the WODC develop, as
soon as is practical, the ability to automatically collect ozone data fromfield stations. Preparations for the establishment of such a system shouldbe made so that the matter can be pursued at the next Brewer Workshop.
Guidelines should be developed and published, along with casehistories, to serve as an operational guide to the successful use of theBrewer Spectrophotometer in the Global Ozone and ultraviolet radiation
. .observing system.
The Users Group recommends that the WODC organize an on-linesoftware and information dissemination system that can be used to co-ordinate the activities of the Brewer Ozone measuring network, andthereby shorten the delays in making new observation techniques andsoftware avai1able to the observing stations operators. .
43

44
Appendix i) - List of Par1icipan~
Par1icipant Imtitution
ASBRIDGE Sci- Tec InArchie 1526 Fletc
BOJKOVRumen D.
BAISAJkiviadis
BARNARDBill
CAPPELLANIFransesco
CIATTAGIALuigi
CISNEROSJuan M.
f
Telephone/Fax
Sci- Tec Inst. Inc.1526 Fletcher Road- 306-934-0101Saskatoon, Sask. S7M 5Ml
9 Lebar Crescent 416-494-2622Willowdale, ON CAN, M2H IJ4
World Meteorological Organization 4122- 7308-455
306-934-0101
Home:
P.O. Box 2300Geneva-2, SwitzerlandEmail: OMNET WMO.OlONE
4122-7340-954
30-31-909431
(ext 2119)University of ThessalonikiPhysics DepartmentLaboratory of Attnospheric Physics54006- Thessaloniki-Greece 30-31-205512
919-541-2205
919-541-4609
@0239
39-332-78922839-332-785837
Environmental Protection AgencyMD-44Research Triangle Park, N.C.USA 27711
Commission of the EuropeanCommunityl.R.C. Ispra (VA) ItalyEnvironment Instrument
Consiglio Nazionale D. RichercheVia Tiburtina 770, 00159Roma, Italy
Instituto NAC De MeteorologiaApdo 285. Madrid 28071. Spain
396-4075871396-4075807
.
1-5819773
1-581967

COLOMBOTiziano
CUEVASEmilio
ELANSKYNikolay
FIOLETOVVitali
GUO SONG
4S
38-536-6244638-536-41028
Servizi oM eteoro] ogj co] tal i ano
Carom. Mt. CimoneSesto]a, Via Delle Ville, 100, 41029
Instituto Nacional de MeteorologiaObservatorio de Izanacl San Sebastian, 77, 38071
SIC de Tenerife SPAIN
34-22-38152134-22-218963
095-2312768095-2331652
Academy of Sciences of RussiaInstitute of Atmospheric PhysicsPhzhersky, 3, Moscow1090 17, Russia
Central Aerological ObservatoryPeryomaiskaja-3, Dol goprudny ,Moscow Region,141700, RussialOND SU Telex@911S77
095-408-6148095-485-4144
mos. Cherncademy of Meteo. Sci.
011-861-832-7390shiqiao
46
HAREEd
Email: (In_temet) [email protected]+441 ."344-~'S40 M 44/
HUGHES 1)'~ec1" U.K. Meteorological Office .,AIt-344-856697Phil Room 1426, London Road c.~ ~
Bracknell, Berkshire. 6.c t:'~t'~344-856412
RG12 252, UK OCt~--
ISHOVAlexandre
JOSEFSSONWeine
KALABOKASPavlos
KERRJim
KHATTATOVV.
Atmospheric Environment Service 4] 6- 739-46354905 Dufferin St., Downsview, ON 4]6-739-428]CANADA, M3H 5T4
f
Institute of ExperimentalMeteorology 249020 ObninskKaluga Region, Lenin Street 82,Russia
7-17-72
SMHI 46-11-158-183(Swedish Meteor, and Hydr. Inst.)S-60176, Norrkoping 46-11-158-261SWEDEN
Department of Applied PhysicsUniversity of Athens33, Ippokzortous Str. 210680 Athens - Greece
301-363-6279
Atmospheric Environment Service 416- 739-46264905 Dufferin Street 416- 739-4281Downsview, Ontario M3H ST4 CANEmail: (Internet) tmcelroy@dow .on.doe.ca
Central Aerological ObservatoryPervomaiskaja-3, Dolgoprudny,Moscow Regjon,]4]700, RussiaZOND SU Telex@9] 1577
095-408-6148095-485-4144
.

KOENIGGloria
KOHLERVIf
LAMBKen
MCELROYc. Tom
de MUERDirk
ROBERGEAndre
STAEHELINJohannes
TONNESSENFinn
47
303-497-6685303-497-6290
National Oceanic and AttnosphericAssociation ERL/CMDL-R/E/CG I325 Broadway, Boulder, CO 80303USA
49-8805-107149-8005-1037
Meteorological ObservatoryHohenpeissenberg, AlbinSchwaiger- W eg 40 D-8126Hohenpeissenberg, GerDlany
306-934-0101306-9782339
Sci- T ec Instruments Inc.1526 Fletcher Rd.Saskatoon, Saskatchewan87M OL7
Atmospheric Environment Service 416- 739-46304905 Dufferin St., Downsview, ON 416-739-4281CANADA, M3H ST4Email: (Internet) tmcelroy@dow .on.doe.ca
32-2-373-057032-2-373-1259
Meteorological Institute ofRinglaand, 3B-1180 Brussels, Belgium
306-934-0101306-9782339
Sci- Tec Instruments Inc.1526 Fletcher Rd.Saskatoon, Sask S7M 017
411-377-2748
411-371-1864
Attnospheric PhysicsETH-Hoenggerberg8093 Zurich, Switzerland
Dept. of Physics University ofOslo, Box 10480342 BLINDERN, Oslo, Norway
47-2-85567347-2-855671

48
VALENTICarlo
RAIERSHE-NIGELSBenaveutura
DeGORSKAM.
TOURPALIKleareti
VIATTEP.
~
.39-6-5910941Consiglio Nazionale D. Richerche
IstitutoDi Fisica Delle Athmosfera39-6-5915790 Piazza L. Sturzo, Ji00 1 44-Roma (Italy)
Institute of GeophysicsPolish Academy of Sciences01-452 Warsaw, PolandKs. Janusus 64
48-22-37982048-22-370522
Institute of GeophysicsPolish Academy of Science01-452 Warsaw, Poland
48-22-370522
30-31-909431
(ext 2119)
30-31-205512
37-62611137-611194
University of ThessalonikiPhysics DepartmentLaboratory of Atmospheric Physics54006- Thessaloniki-Greece
lnshlut Suisse de MeteorologieStation AerologiqueLes lnvuardesCH- 1530 Payeme - Suisse

Appendix ii)
OF THE BREWER OZONE SPECTROPHOTOMETER
University of Virginia, CharlottesvilleJune 1-3, 1992
1. Opening of the Meeting and EJection of a
2. REVIEW OF THE RECOMMENDATIONS BY THE AROSA 1990CONSULTATION
3. MEASUREMENT OF TOTAL OZONE
i) Total column ozone measurements at Izana Observatory. [E. Cuevas]
ii) The zenith sky algorithm for total ozone measurements. [J.B. Kerr]
iii) Results of the WMO/GO]OS synoptic
Measurements of ozone at Oslo.
The daytime course of the total ozone
iv)
v)
vi) Analysis of eight years of ozone and S02 Brewer measu,rements at theMeteorological Institute of Belgium.
vii) Measurements of ozone and S02 at Kislovodsk observatory.[N.P. Elansky]
49
WMO CONSULTATION ON THE OPERATION
: J .B. KenChainnan:
and Rapporteurs ...
[R.D. Bojkov]
Chainnan
mapping project.[A. Bais and C. Zerefos]
[S.H.H. Larsen]
[A.G. Ishov]
[D. De Muer]

so
viii) The Canadian OZONE WATCH program.
4. TOT AL OZONE INTERCOMPARISONS
i) Comparison of Brewer and Dobson measurements at Sondrestrom,Greenland. [p. Eriksen]
ii) Intercomparison of Dobson, ozonesonde,
iii) Intercomparison of Brewer 10 with Dobson 104 and TOMS.
iv) Ainnass dependence of the Brewer No. 64 and the Dobson No. 84total
v) Ozone measurements in the A:
[J.B. Kerr] ..
TOMS and Brewer data over[c. Varotsos]Greece
[U. Koehler]
[B. Rajewska- Wiech]ozone measurements.
ntarctic[1. Ciataglia and C. Valenti]
.

s. UMKEHR MEASUREMENTS
i) The Brewer Umkehr analysis and results from Edmonton.[C. T. McElroy]
ii) omparison between "classical" Umkehr and Brewer Umkehrmeasurements. [1. Staehelin, P. Viatte and B. Hoegger]
c
iii) Aerosol correction for Umkehr measurements
6. UV-BMEASUREMENTS
i) Preliminary results of UV-B measurements with the Brewer No. 64.[ M. Degrorska]
ii) Three years of UV -B measurements at Toronto compared with mode]results. [J.B. Kerr and D.I. Wardle]
iii) The Canadian UV-B Advisory program.
iv) Comparison of UV -B measurements performed with a Brewerspectrophotometer and new Robertson detectors. [A. Bais]
v) UV-B measurements applied to $tudying marine biology.[A. Roberge and K. Lamb]
7. NO2 MEASUREMENTS
i) Results of NO2 intercomparisons.
ii) Seven years of NO2 measurements at Toronto
51
-2-
[G. Song]
[J.B. Kerr]
[c. T. McElroy]
[J.B. KelT]

52
8. DATA ANALYSIS AND ARCHIVING
i) The NO2 vertical profile inversion technique. [C. T. McElroy]
ii) High altitude ozone profile measurements using the second umkehr.
iii) Measuring procedures, quality control and datameasurements at the Meteorological
iv) Software for total ozone mapping and analysis. [Y. Fioletov]
v) The Brewer data management system.
.,
[K. Gioulgkidis and C. T. McElroy]
:hiving of BrewerInstitute of Belgium. [H. De Backer]
[J.B. Kerr and E. Hare]

tI
9. NEW INSTRUMENT HARDWARE AND SOFTWARE DEVELOPMENTS
i) Focused sun observations using the Brewer
ii) New developments in instrument software.[K. Lamb and A. Roberge]
iii) Turbo based software development for Brewers. [P. Eriksen]
v) Development of the Brewer double monochromator.[C.T. McElroy and D.I. Wardle]
vi) Development of new Brewer instruments for special applications.[C.T. McElroy]
10. FORMULATION OF RECOMMENDATIONS AND CLOSING OF THEMEETING
53
-3-
ozone spectrophotometer.[W. J osefsson]
S4
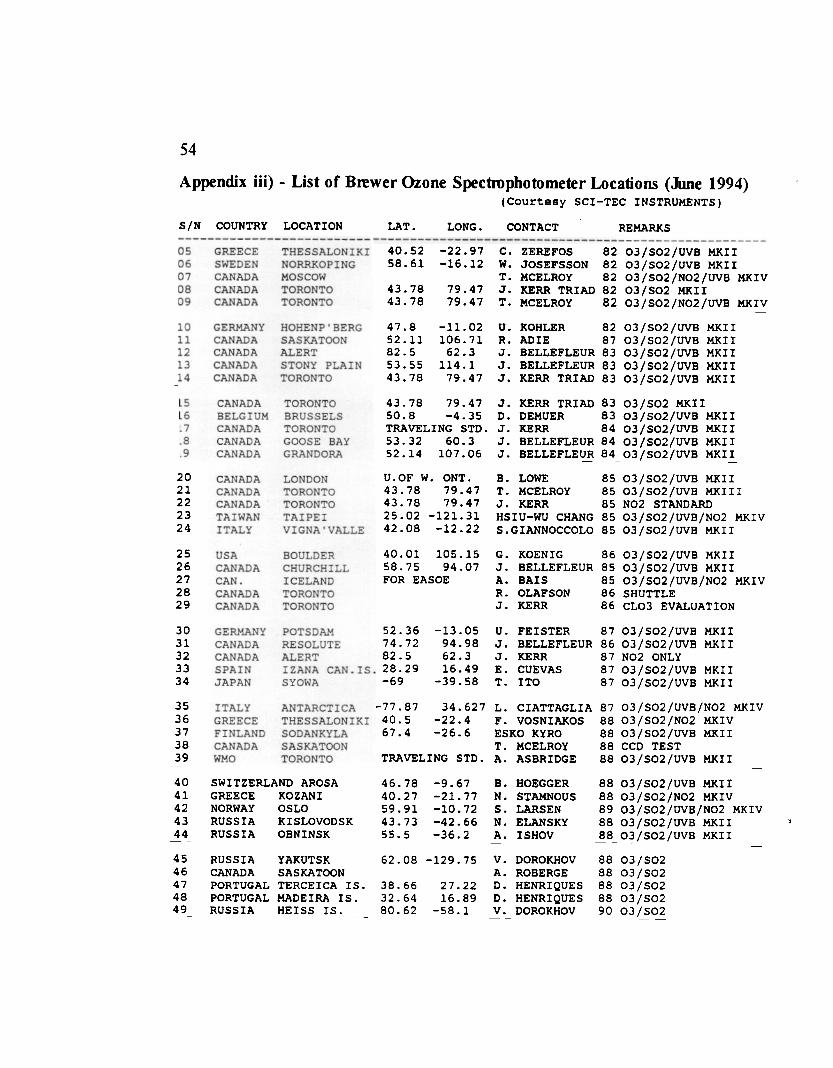
Appendix iii) - Ust of Brewer Ozone Spectrophotometer Locations (June 1994)(Courtesy SCI-TEC INSTRUMENTS)
SIN COUNTRY LOCATION LAT. LONG. CONTACT REMARKS
GREECESWEDENCANADACANADACANADA
OS06070809
1011121314
GERMANYCANADACANADACANADACANADA
1516171819
2021222324
2526272829
3031323334
3S36373839
4041424344
SWITZERLAND AROSAGREECE KOZANINORWAY OSLORUSSIA KISLOVODSKRUSSIA OBNINSK
RUSSIA YAKUTSKCANADA SASKATOONPORTUGAL TERCEICA IS.PORTUGAL MADEIRA IS.RUSSIA HEISS IS.
4546474849
4
40.52 -22.97 C.58.61 -16.12 W.
T.43.78 79.47 J.43.78 79.47 T.
47.8 -11.02 U.52.11 106.71 R.82.5 62.3 J.53.55 114.1 J.43.78 79.47 J.
43.78 79.47 J.50.8 -4.35 D.TRAVELING STD. J.53.32 60.3 J.52.14 107.06 J.
ZEREFOSJOSEFSSONMCELROYURR TRIADMCELROY
03/S02/tJVB MKII03/S02/UVB MXII03/SO2/RO2/UVB BIV03/502 BII03/SO2/N02/UVB MXIV
8282828282
KOHLERADIEBELLEFLEURBELLEFLEURKERR TRIAD
KERR TRIADDEHUERKERRBELLE FLEURBELLEFLEUR
82 03/S02/UVB MKII87 03/S02/UVB HXII83 03/S02/UVB HXII83 03/S02/UVB HXII83 03/S02/UVB HXII
8383848484
03/50203/80203/50203/80203/502
MRIIfuvD KKI IfUVS KKIIfUVS MKI IfUVD KKI I
03/S02/UVB MKII03/S02/UVB HXIIIN02 STANDARD03/S02/UVB/N02 HXIV03/ S02/UVB MXI I
LONDONTORONTOTORONTOTAIPEIVIGNA 'VALLE
B. LOWE 85T. MCELROY 85J. URR 85HSIU-WU CHANG 85S.GIANNOCCOLO 85
U.OF W. ONT.43.78 79.4743.78 79.4725.02 -121.3142.08 -12.22
40.01 105.1558.75 94.07FOR EASOE
52.36 -13.0574.72 94.9882.5 62.328.29 16.49-69 -39.58
-77.87 34.62740.5 -22.467.4 -26.6
TRAVELING STD.
46.78 -9.6740.27 -21.7759.91 -10.7243.73 -42.6655.5 -36.2
62.08 -129.75
38.66 27.2232.64 16.8980.62 -58.1
BOULDERCHURCHILLICELANDTORONTOTORONTO
G. KOENIG 86J. BELLEFLEUR 85A. BAIS 85R. OLAFSON 86J. KERR 86
U. FEISTER 87J. BELLEFLEUR 86J. URR 87E. CUEVAS 87T. ITO 87
L. CIATTAGLIA 87F. VOSNIAKOS 88ESKO KYRO 88T. MCELROY 88A. ASBRIDGE 88
03/S02/UV8 MKII03/S02/UVS MKII03/SO2/UVB/NO2 MKIVSHUTTLECLO3 EVALUATION
03/S02/UVB MXII03/S02/UVB MKII1902 ONLY03/S02/UVB MKII03/S02/UVB MKII
ANTARCTICATHESSALONIKISODANKYLASASKATOONTORONTO
03/ S02 /UVB /N02 MKIV03/S02/N02 MKIV03/S02/UVB MKIICCD TEST03/S02/UVB MKII
8888898888
HOEGGERSTAMNOUSLARSENELANSKYISHOV
B.N.S.N.A.
03/S02/UVB UII03/S02/NO2 MKIV03/S02/UVB/NO2 MKIV03/S02/UVB MKIIO~/SO2/UVB MKII
~
v.A.D.D.v.
8803/50288 03/5028803/5028803/5029003/502
DOROKHOVROBERGEHENRIQUESHENRIQUESDOROKHOV

BREWERBREWER SPECTROPHOTOMETER LOCATIONS
SIN COUNTRY LOCATION LAT. LOI
ITALYMOROCCOJAPANDENMARKCHINA
5051525354
5556575859
6061626364
CANADABRAZILJAPANJAPANJAPAN
JAPANTAIWANITALYITALYPOLAND
ITALYITALYITALYCHILECANADA
6566676869
7071727374
SPAIN MADRIDCANADA TORONTOSWITZERLAND AROSABRAZIL RIO BRANCOCHINA ZHONGSHAN
ENGLAND CAMBORNE7576777879
8081828384
8586878889
9091929394
ss
(JUNE/94) SCI-TEC INSTRUMENTS
CONTACT REMARKSLONG
SCOTT BASE -77.8 -165.6CASABLANCA 33.57 7.67TATENO 36.05 -140.1SONDRESTROH 67. 50.5GONGHE 36.27 -100.62
SATURNA B.C. 48.78 123.13CUIABA -15.5 56.05TOKYO 35.67 -139.75SAPPORO 43.05 -141.3KAGOSHIHA 31.6 -130.6
C. VALENTIB. LOUAUDT. ITOP. ERIKSENGUO SONG
8989898990
9089909090
03 {S02 {UVB{N02 MXIV03{SO2{UVB HXII03{SO2{UVB HXII03{S02{UVB MXII03{S02{UVB MKII
03/80203/80203/SO203/80203/802
/ova MXII/UVB BII/UVB MXII/UVB BII/UVB BII
J. KERRV. KIRCHHOFFH. INOUET. ITOT. ITO
-127.67-121.37
-17.95-10.77-20.79
OKINAWACHENGKUNGBRINDISISESTOLABELSK
OKINAWA 26.2 -127.67 T. ITO 90CHENGKUNG 23.1 -121.37 HSIU-WU CHANG 90BRINDISI 40.65 -17.95 MET. SERVICE 90SESTOLA 44.22 -10.77 T. COLOMBO 90BELSK 51.84 -20.79 M. DBGORSKA 90
MESSINA 38.2 -15.55 MET. SERVICE 90ISPRA 45.80 -8.63 G. RESTELLI 91U. OF ROME 41.9 -12.52 S. PALMIERI 91PUNTA ARENAS -52.5 71.0 V. KIRCHHOFF 91EUREKA 80. 85.93 A. ROBERGE 91
9090909090
03/S02/UVB MXII03/SO2/UVB/NO2 MXIV03/S02/UVB/NO2 MXIV03/S02/UVB/NO2 MXIV03/S02/UVB MXII
03/S02/UVB/NO2 MKIV03/SO2/UVB/NO2 MXIV03/S02/UVB/NO2 MXIV03/S02/UVB/NO2 MKIV03/S02/UVB/ MKV
40.4543.7846.78-9.97
-69.37
3.7279.47-9.6867.8176.37
03/S02/UVB/NO2 KKIV03/S02/OVB/NO2 KKIV03/SO2/OVB/MKII03/S02/UVB/NO2/KKIV03/SO2/UVB/NO2/MKIV
9191919191
J. CISNEROSJ. KERRB. HOEGGERV. KIRCHHOFFGOO SONG
50.22 5.32 P. HUGHES44.75 -127.6 GUO SONG30.3 -119.73 GUO SONG52.21 -14.12 U. LEITERER43.78 79.47 J. KERR
9191919192
03/S02/UVB/NO2/KKIV03/S02/MKII03/SO2/MKII03/S02/UVB/NO2/KKIV03/S02/UVB/NO2/MKIV
45.S-29.69
55.7249.9144.73
73.6 J. BELLEFLEUR 91 03/S02/UVB/NO2/KKIV53.73 V. KIRCHHOFF 9102/S02/MXII
-12.57 P. ERIKSEN 92 03/SO2/UVB/NO2/MXIV97.24 J. BELLE FLEUR 92 03/S02/UVB/NO2/KKIV63.66 J. KERR 92 03/S02/UVB/NO2/MXIV
43.78 79.47 T. MCELROY 92 03/SO2/UVB/MKIIIIXI 40.52 -22.97 A. BAIS 92 03/SO2/UVB/KKIIIARK 35.9 78.86 B. BARNARD 92 03/S02/UVB/N02/KKIVCBS. 51.93 10.25 G. MURPHY 92 03/S02/UVB/NO2/MKIV
28.58 -77.2 S. SRIVASTAV 93 03/SO2/UVB/NO2/MKIV
JAYA 3.1 -101.65 L. CHOW PENG 92 03/S02/UVB/MKII-69.0 -39.58 T. ITO 93 03/S02/UVB/MKII
X -7.57 -112.65 T. OGAWA 93 03/S02/NO2/KKIV47.05 -12.95 I. DIRMHIRM 93 03/S02/UVB/NO2/MKIV
L 10.67 -77.47 S. SRIVASTAV 93 03/S02/UVB/NO2/MKIV

56
BREWER SPECTROPHOTOMETER
COUNTRY LOCATION]
9S96979899
KOREA POHANGJAPAN MARCUS ISL.SLOVAKIA POPRAD-GAN.CZECH RP.HRADEC KRAL.ITALY ROME
NETHERLANDS DE 8ILTUSA ATHENS, GA.PORTUGAL LISBONUSA BOSTONNORWAY TROKSOUSA GAITHERSBURGUSA RES.TRI-PARKFINLAND SASKATOONUSA RES.TRI-PARKUSA SASKATOON
100101102103104105106107108109
BRAZILCANADAUSAJAPAN
10111213
1111
,LOCATIONS INSTRUMENTS
REMARXS
(JUNE/94) SCI-TEC
LONG.LAT. CONTACT
36.03 -129.38 a-SUN KIM 93 03/SO2/UVS/KKII24.3 -153.96 T. ITO 93 03/S02/KKII49.03 -20.32 M. CHMELIK 93 03/S02/UVa/NO2/MKIV50.18 -14.83 C. VANICEK 93 03/S02/UVS/NO2/MKIV41.9 -12.52 C. VALENTI 93 03/S02/UVS/NO2/MKIV
J:UIJ:RIVESHENRIQUESALLENSVENOETHOMPSONBARNARDTAALASBARNARDBARNARD
52.0033;95
F.J.D.G.T.A.B.P.B.B.
-S.1883.38
93949494949494949494
03/S02/UVB/MKIII03/S02/UVB/NO2/MKIV03/S02/UVB MKII03/S02/UVB/NO2/MKIV03/S02/UVB/MKIII03/S02/UVB/NO2/MKIV03/S02/UVB/NO2/MKIV03/S02/UVB/MKIII03/S02/UVB/NO2/MKIV03/SO2/UVB/NO2/MXIV
43.3369.65
71.10-18.95
SASKATOONSASKATOONSASKATOONSASKATOON
94 03/SO2/UVB/NO2/KKIV94 03/S02/UVB/KKIII94 03/S02/UVB/NO2/KKIV94 03/S02/UVB/KKII
KIRCHHOFFKERRBARNARDITO
V.J.8.T.
..